Boulder Creek, CA Map & Demographics
Boulder Creek Map
Boulder Creek Overview
$55,778
PER CAPITA INCOME
$134,125
AVG FAMILY INCOME
$112,426
AVG HOUSEHOLD INCOME
58.0%
WAGE / INCOME GAP [ % ]
42.0¢/ $1
WAGE / INCOME GAP [ $ ]
0.39
INEQUALITY / GINI INDEX
5,492
TOTAL POPULATION
2,897
MALE POPULATION
2,595
FEMALE POPULATION
111.64
MALES / 100 FEMALES
89.58
FEMALES / 100 MALES
45.6
MEDIAN AGE
3.0
AVG FAMILY SIZE
2.6
AVG HOUSEHOLD SIZE
3,097
LABOR FORCE [ PEOPLE ]
63.8%
PERCENT IN LABOR FORCE
10.0%
UNEMPLOYMENT RATE
Boulder Creek Zip Codes
Boulder Creek Area Codes
Income in Boulder Creek
Income Overview in Boulder Creek
Per Capita Income in Boulder Creek is $55,778, while median incomes of families and households are $134,125 and $112,426 respectively.
| Characteristic | Number | Measure |
| Per Capita Income | 5,492 | $55,778 |
| Median Family Income | 1,418 | $134,125 |
| Mean Family Income | 1,418 | $139,517 |
| Median Household Income | 2,115 | $112,426 |
| Mean Household Income | 2,115 | $143,276 |
| Income Deficit | 1,418 | $0 |
| Wage / Income Gap (%) | 5,492 | 58.01% |
| Wage / Income Gap ($) | 5,492 | 41.99¢ per $1 |
| Gini / Inequality Index | 5,492 | 0.39 |
Earnings by Sex in Boulder Creek
Average Earnings in Boulder Creek are $56,590, $91,526 for men and $38,429 for women, a difference of 58.0%.
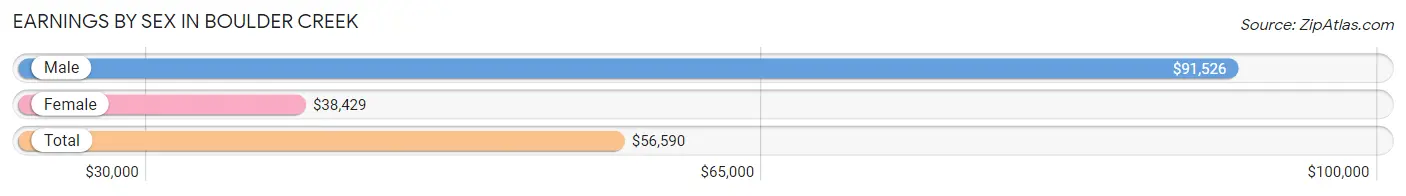
| Sex | Number | Average Earnings |
| Male | 1,693 (53.3%) | $91,526 |
| Female | 1,486 (46.7%) | $38,429 |
| Total | 3,179 (100.0%) | $56,590 |
Earnings by Sex by Income Bracket in Boulder Creek
The most common earnings brackets in Boulder Creek are $100,000+ for men (578 | 34.1%) and $100,000+ for women (286 | 19.3%).
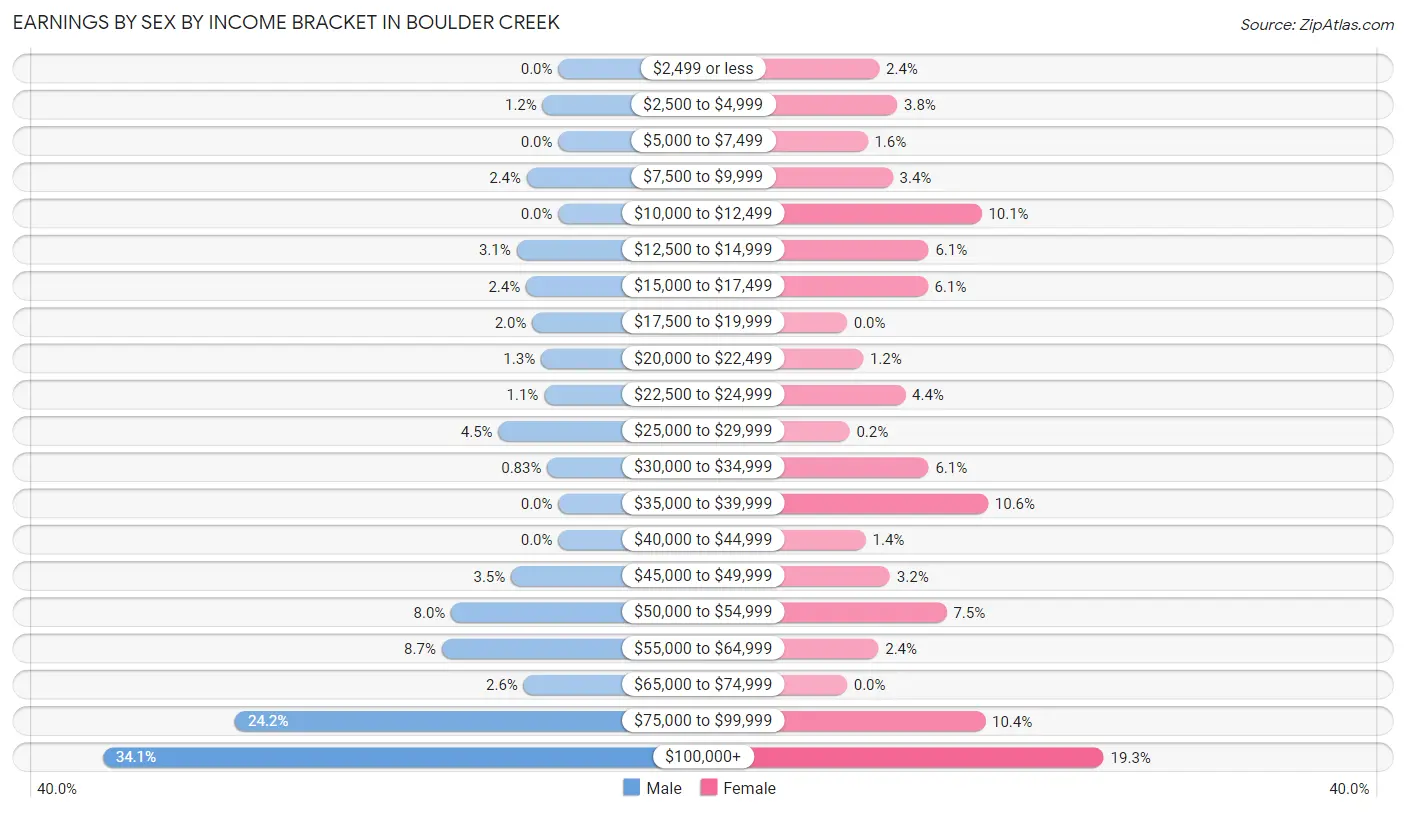
| Income | Male | Female |
| $2,499 or less | 0 (0.0%) | 36 (2.4%) |
| $2,500 to $4,999 | 20 (1.2%) | 56 (3.8%) |
| $5,000 to $7,499 | 0 (0.0%) | 23 (1.5%) |
| $7,500 to $9,999 | 40 (2.4%) | 51 (3.4%) |
| $10,000 to $12,499 | 0 (0.0%) | 150 (10.1%) |
| $12,500 to $14,999 | 53 (3.1%) | 91 (6.1%) |
| $15,000 to $17,499 | 41 (2.4%) | 90 (6.1%) |
| $17,500 to $19,999 | 33 (1.9%) | 0 (0.0%) |
| $20,000 to $22,499 | 22 (1.3%) | 18 (1.2%) |
| $22,500 to $24,999 | 18 (1.1%) | 65 (4.4%) |
| $25,000 to $29,999 | 76 (4.5%) | 3 (0.2%) |
| $30,000 to $34,999 | 14 (0.8%) | 91 (6.1%) |
| $35,000 to $39,999 | 0 (0.0%) | 157 (10.6%) |
| $40,000 to $44,999 | 0 (0.0%) | 21 (1.4%) |
| $45,000 to $49,999 | 60 (3.5%) | 48 (3.2%) |
| $50,000 to $54,999 | 136 (8.0%) | 111 (7.5%) |
| $55,000 to $64,999 | 148 (8.7%) | 35 (2.4%) |
| $65,000 to $74,999 | 44 (2.6%) | 0 (0.0%) |
| $75,000 to $99,999 | 410 (24.2%) | 154 (10.4%) |
| $100,000+ | 578 (34.1%) | 286 (19.3%) |
| Total | 1,693 (100.0%) | 1,486 (100.0%) |
Earnings by Sex by Educational Attainment in Boulder Creek
Average earnings in Boulder Creek are $93,917 for men and $48,306 for women, a difference of 48.6%. Men with an educational attainment of bachelor's degree enjoy the highest average annual earnings of $137,901, while those with college or associate's degree education earn the least with $60,673. Women with an educational attainment of graduate degree earn the most with the average annual earnings of $86,591, while those with college or associate's degree education have the smallest earnings of $50,409.
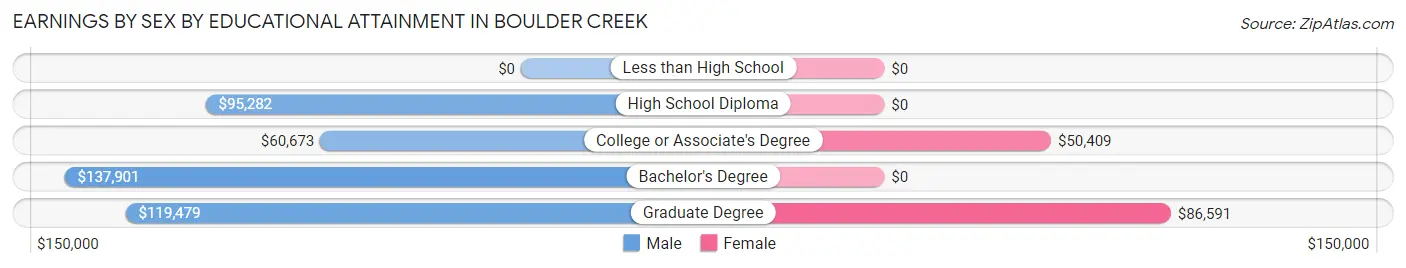
| Educational Attainment | Male Income | Female Income |
| Less than High School | - | - |
| High School Diploma | $95,282 | $0 |
| College or Associate's Degree | $60,673 | $50,409 |
| Bachelor's Degree | $137,901 | $0 |
| Graduate Degree | $119,479 | $86,591 |
| Total | $93,917 | $48,306 |
Family Income in Boulder Creek
Family Income Brackets in Boulder Creek
According to the Boulder Creek family income data, there are 336 families falling into the $100,000 to $149,999 income range, which is the most common income bracket and makes up 23.7% of all families.
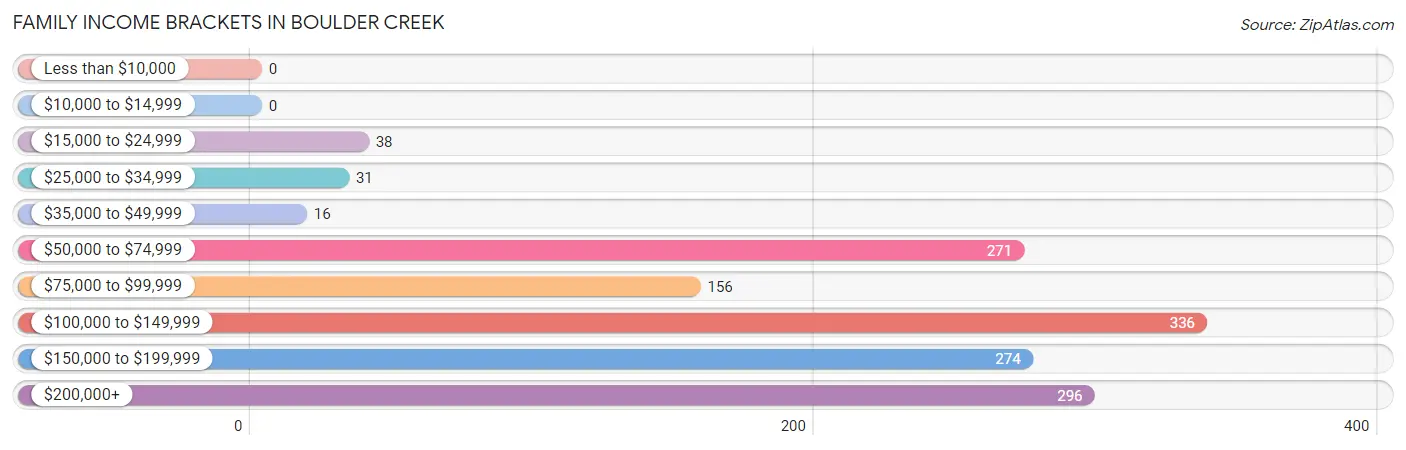
| Income Bracket | # Families | % Families |
| Less than $10,000 | 0 | 0.0% |
| $10,000 to $14,999 | 0 | 0.0% |
| $15,000 to $24,999 | 38 | 2.7% |
| $25,000 to $34,999 | 31 | 2.2% |
| $35,000 to $49,999 | 16 | 1.1% |
| $50,000 to $74,999 | 271 | 19.1% |
| $75,000 to $99,999 | 156 | 11.0% |
| $100,000 to $149,999 | 336 | 23.7% |
| $150,000 to $199,999 | 274 | 19.3% |
| $200,000+ | 296 | 20.9% |
Family Income by Famaliy Size in Boulder Creek
5-person families (162 | 11.4%) account for the highest median family income in Boulder Creek with $190,417 per family, while 2-person families (873 | 61.6%) have the highest median income of $55,698 per family member.
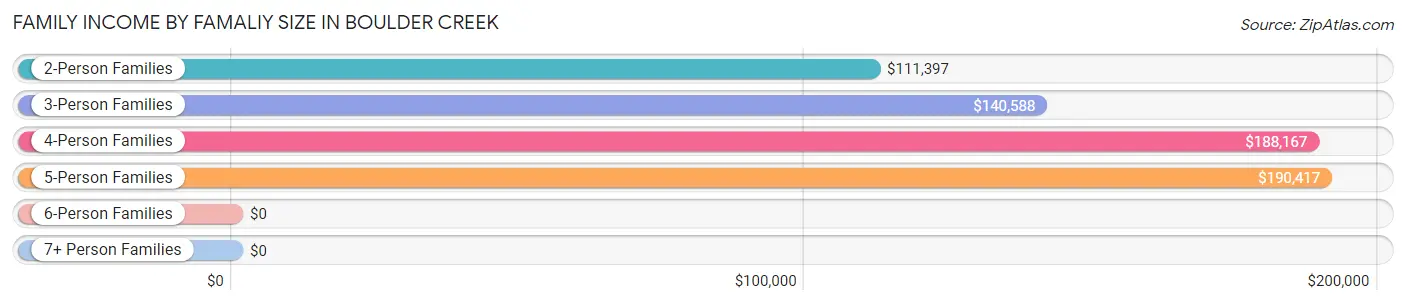
| Income Bracket | # Families | Median Income |
| 2-Person Families | 873 (61.6%) | $111,397 |
| 3-Person Families | 236 (16.6%) | $140,588 |
| 4-Person Families | 134 (9.5%) | $188,167 |
| 5-Person Families | 162 (11.4%) | $190,417 |
| 6-Person Families | 0 (0.0%) | $0 |
| 7+ Person Families | 13 (0.9%) | $0 |
| Total | 1,418 (100.0%) | $134,125 |
Family Income by Number of Earners in Boulder Creek
The median family income in Boulder Creek is $134,125, with families comprising 3+ earners (104) having the highest median family income of $187,667, while families with no earners (171) have the lowest median family income of $69,464, accounting for 7.3% and 12.1% of families, respectively.
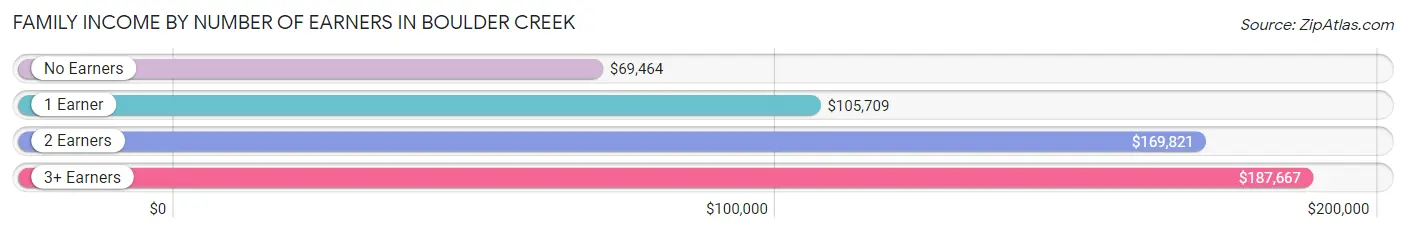
| Number of Earners | # Families | Median Income |
| No Earners | 171 (12.1%) | $69,464 |
| 1 Earner | 582 (41.0%) | $105,709 |
| 2 Earners | 561 (39.6%) | $169,821 |
| 3+ Earners | 104 (7.3%) | $187,667 |
| Total | 1,418 (100.0%) | $134,125 |
Household Income in Boulder Creek
Household Income Brackets in Boulder Creek
With 457 households falling in the category, the $200,000+ income range is the most frequent in Boulder Creek, accounting for 21.6% of all households.
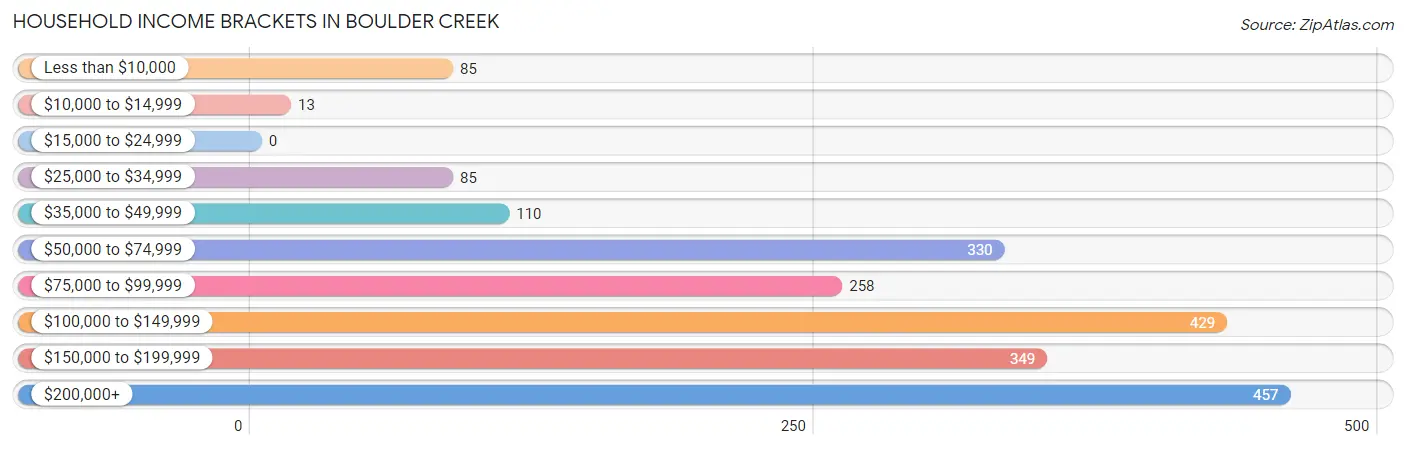
| Income Bracket | # Households | % Households |
| Less than $10,000 | 85 | 4.0% |
| $10,000 to $14,999 | 13 | 0.6% |
| $15,000 to $24,999 | 0 | 0.0% |
| $25,000 to $34,999 | 85 | 4.0% |
| $35,000 to $49,999 | 110 | 5.2% |
| $50,000 to $74,999 | 330 | 15.6% |
| $75,000 to $99,999 | 258 | 12.2% |
| $100,000 to $149,999 | 429 | 20.3% |
| $150,000 to $199,999 | 349 | 16.5% |
| $200,000+ | 457 | 21.6% |
Household Income by Householder Age in Boulder Creek
The median household income in Boulder Creek is $112,426, with the highest median household income of $148,092 found in the 45 to 64 years age bracket for the primary householder. A total of 1,011 households (47.8%) fall into this category.
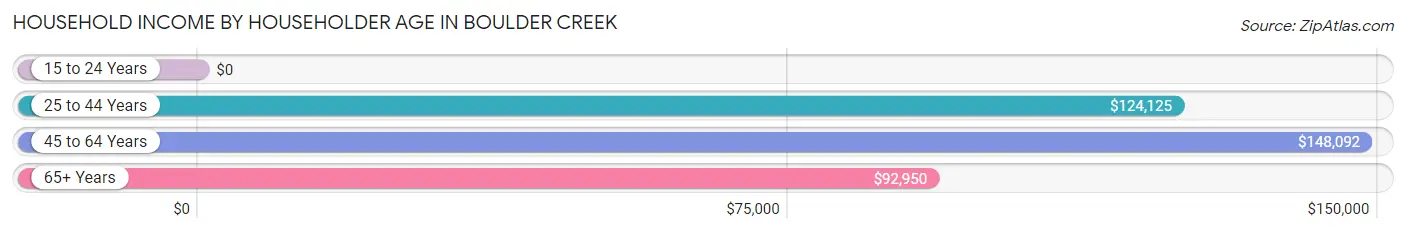
| Income Bracket | # Households | Median Income |
| 15 to 24 Years | 0 (0.0%) | $0 |
| 25 to 44 Years | 558 (26.4%) | $124,125 |
| 45 to 64 Years | 1,011 (47.8%) | $148,092 |
| 65+ Years | 546 (25.8%) | $92,950 |
| Total | 2,115 (100.0%) | $112,426 |
Poverty in Boulder Creek
Income Below Poverty by Sex and Age in Boulder Creek
With 4.8% poverty level for males and 5.7% for females among the residents of Boulder Creek, 55 to 64 year old males and 35 to 44 year old females are the most vulnerable to poverty, with 72 males (16.2%) and 42 females (12.3%) in their respective age groups living below the poverty level.
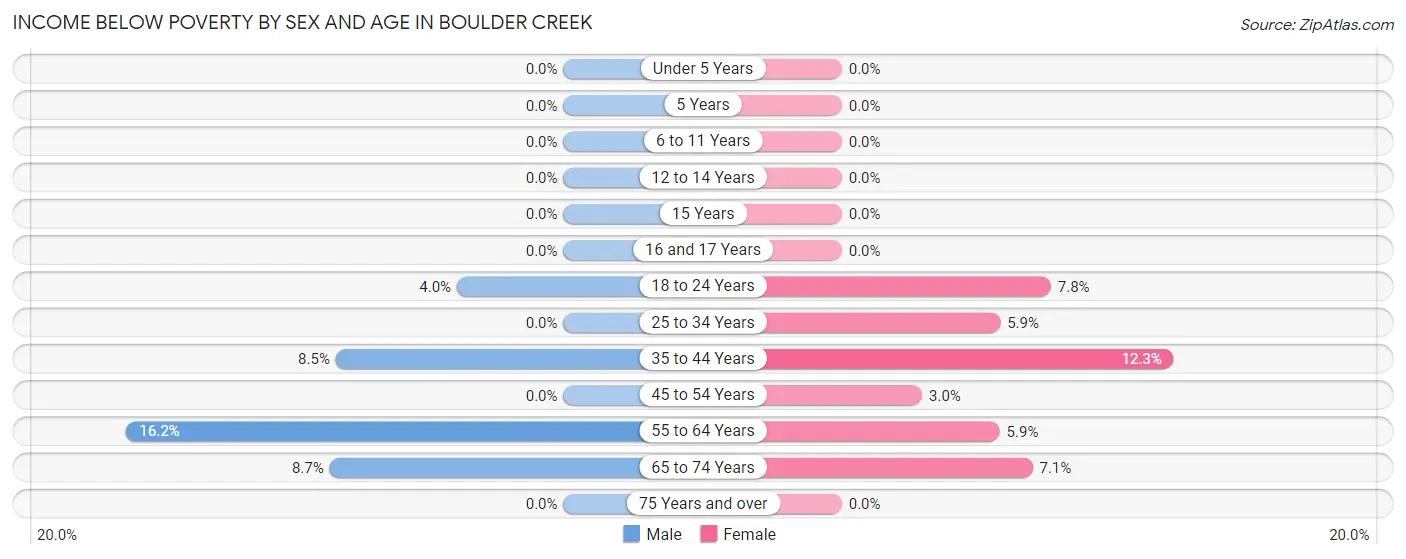
| Age Bracket | Male | Female |
| Under 5 Years | 0 (0.0%) | 0 (0.0%) |
| 5 Years | 0 (0.0%) | 0 (0.0%) |
| 6 to 11 Years | 0 (0.0%) | 0 (0.0%) |
| 12 to 14 Years | 0 (0.0%) | 0 (0.0%) |
| 15 Years | 0 (0.0%) | 0 (0.0%) |
| 16 and 17 Years | 0 (0.0%) | 0 (0.0%) |
| 18 to 24 Years | 9 (4.0%) | 25 (7.8%) |
| 25 to 34 Years | 0 (0.0%) | 16 (5.9%) |
| 35 to 44 Years | 36 (8.5%) | 42 (12.3%) |
| 45 to 54 Years | 0 (0.0%) | 18 (3.0%) |
| 55 to 64 Years | 72 (16.2%) | 18 (5.9%) |
| 65 to 74 Years | 23 (8.7%) | 30 (7.1%) |
| 75 Years and over | 0 (0.0%) | 0 (0.0%) |
| Total | 140 (4.8%) | 149 (5.7%) |
Income Above Poverty by Sex and Age in Boulder Creek
According to the poverty statistics in Boulder Creek, males aged under 5 years and females aged under 5 years are the age groups that are most secure financially, with 100.0% of males and 100.0% of females in these age groups living above the poverty line.
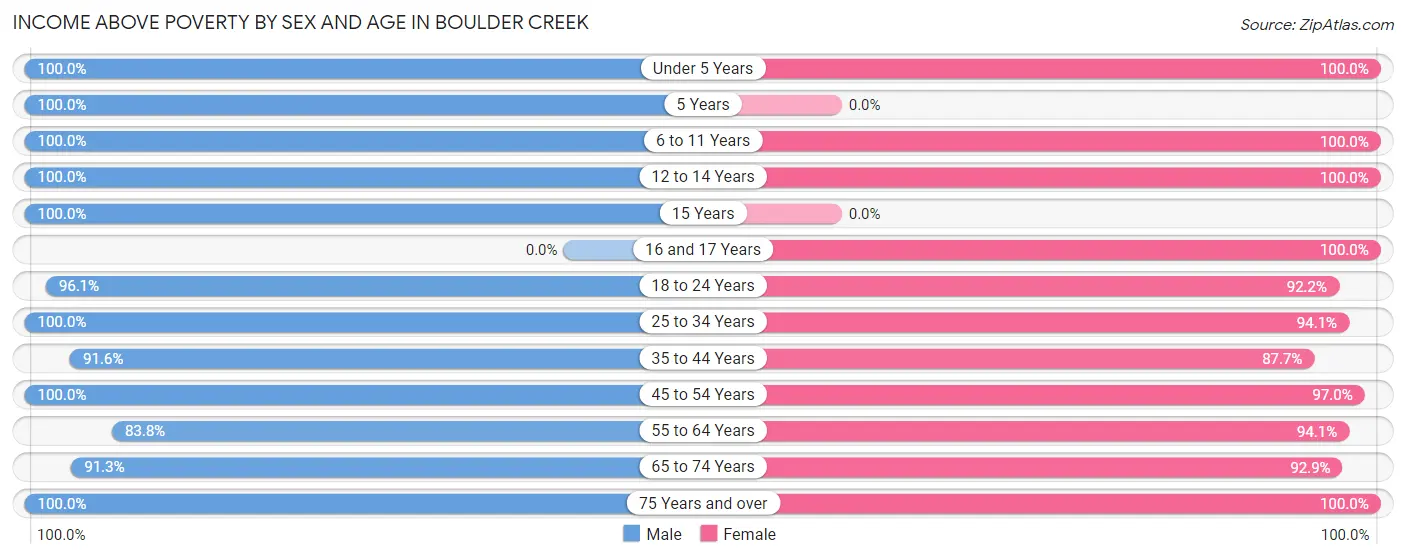
| Age Bracket | Male | Female |
| Under 5 Years | 44 (100.0%) | 28 (100.0%) |
| 5 Years | 67 (100.0%) | 0 (0.0%) |
| 6 to 11 Years | 203 (100.0%) | 65 (100.0%) |
| 12 to 14 Years | 162 (100.0%) | 57 (100.0%) |
| 15 Years | 11 (100.0%) | 0 (0.0%) |
| 16 and 17 Years | 0 (0.0%) | 67 (100.0%) |
| 18 to 24 Years | 219 (96.1%) | 297 (92.2%) |
| 25 to 34 Years | 365 (100.0%) | 256 (94.1%) |
| 35 to 44 Years | 390 (91.5%) | 299 (87.7%) |
| 45 to 54 Years | 429 (100.0%) | 586 (97.0%) |
| 55 to 64 Years | 372 (83.8%) | 289 (94.1%) |
| 65 to 74 Years | 242 (91.3%) | 394 (92.9%) |
| 75 Years and over | 253 (100.0%) | 108 (100.0%) |
| Total | 2,757 (95.2%) | 2,446 (94.3%) |
Income Below Poverty Among Married-Couple Families in Boulder Creek
The poverty statistics for married-couple families in Boulder Creek show that 1.1% or 11 of the total 1,001 families live below the poverty line. Families with no children have the highest poverty rate of 1.4%, comprising of 11 families. On the other hand, families with 1 or 2 children have the lowest poverty rate of 0.0%, which includes 0 families.
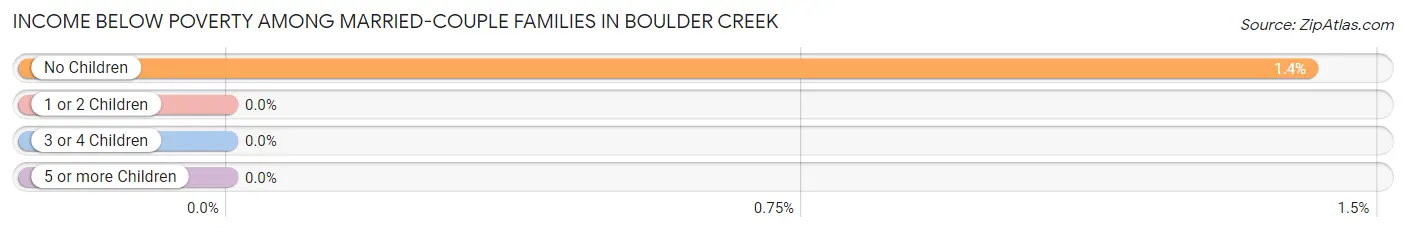
| Children | Above Poverty | Below Poverty |
| No Children | 769 (98.6%) | 11 (1.4%) |
| 1 or 2 Children | 201 (100.0%) | 0 (0.0%) |
| 3 or 4 Children | 20 (100.0%) | 0 (0.0%) |
| 5 or more Children | 0 (0.0%) | 0 (0.0%) |
| Total | 990 (98.9%) | 11 (1.1%) |
Income Below Poverty Among Single-Parent Households in Boulder Creek
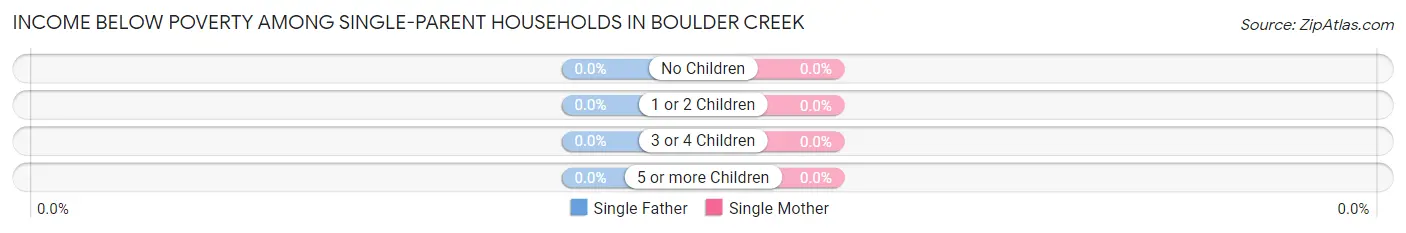
| Children | Single Father | Single Mother |
| No Children | 0 (0.0%) | 0 (0.0%) |
| 1 or 2 Children | 0 (0.0%) | 0 (0.0%) |
| 3 or 4 Children | 0 (0.0%) | 0 (0.0%) |
| 5 or more Children | 0 (0.0%) | 0 (0.0%) |
| Total | 0 (0.0%) | 0 (0.0%) |
Income Below Poverty Among Married-Couple vs Single-Parent Households in Boulder Creek
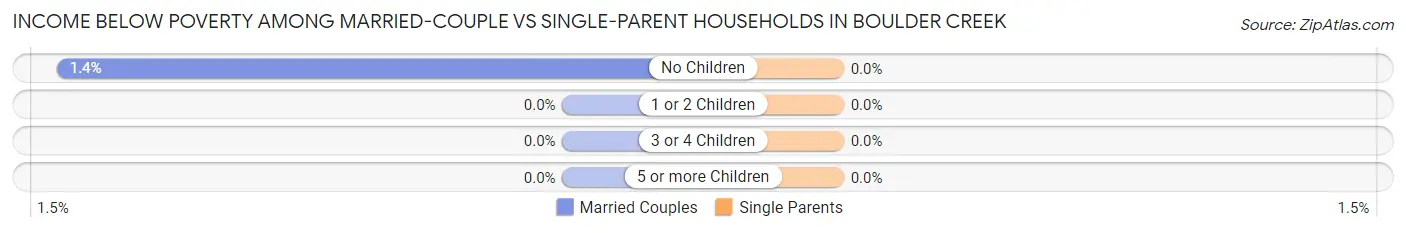
| Children | Married-Couple Families | Single-Parent Households |
| No Children | 11 (1.4%) | 0 (0.0%) |
| 1 or 2 Children | 0 (0.0%) | 0 (0.0%) |
| 3 or 4 Children | 0 (0.0%) | 0 (0.0%) |
| 5 or more Children | 0 (0.0%) | 0 (0.0%) |
| Total | 11 (1.1%) | 0 (0.0%) |
Race in Boulder Creek
The most populous races in Boulder Creek are White / Caucasian (4,540 | 82.7%), Hispanic or Latino (657 | 12.0%), and Two or more Races (654 | 11.9%).
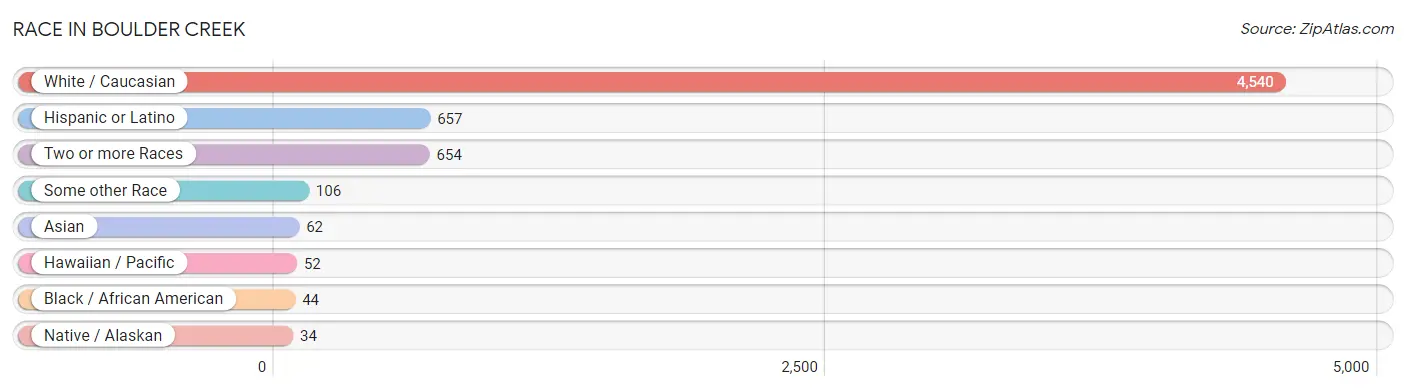
| Race | # Population | % Population |
| Asian | 62 | 1.1% |
| Black / African American | 44 | 0.8% |
| Hawaiian / Pacific | 52 | 0.9% |
| Hispanic or Latino | 657 | 12.0% |
| Native / Alaskan | 34 | 0.6% |
| White / Caucasian | 4,540 | 82.7% |
| Two or more Races | 654 | 11.9% |
| Some other Race | 106 | 1.9% |
| Total | 5,492 | 100.0% |
Ancestry in Boulder Creek
The most populous ancestries reported in Boulder Creek are German (867 | 15.8%), Irish (844 | 15.4%), Mexican (643 | 11.7%), Italian (558 | 10.2%), and English (502 | 9.1%), together accounting for 62.2% of all Boulder Creek residents.
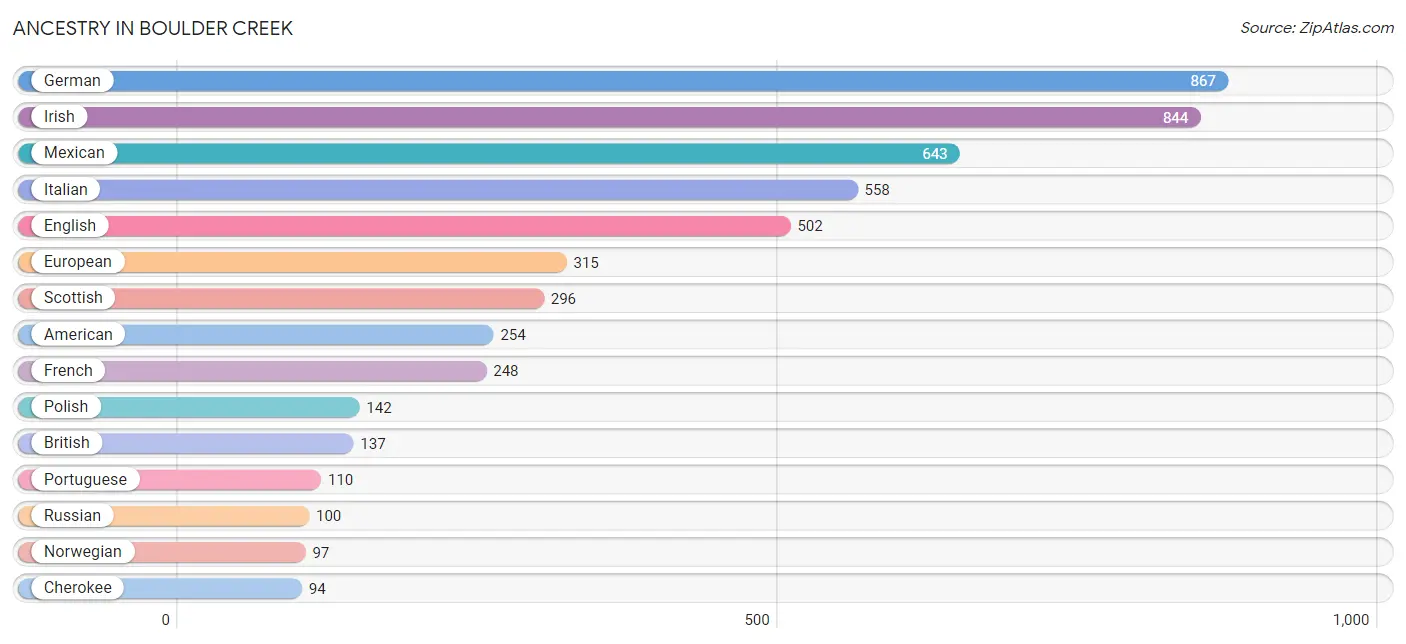
| Ancestry | # Population | % Population |
| American | 254 | 4.6% |
| Arab | 17 | 0.3% |
| Austrian | 17 | 0.3% |
| Bhutanese | 9 | 0.2% |
| Blackfeet | 13 | 0.2% |
| British | 137 | 2.5% |
| Burmese | 11 | 0.2% |
| Cherokee | 94 | 1.7% |
| Chippewa | 19 | 0.4% |
| Choctaw | 59 | 1.1% |
| Croatian | 18 | 0.3% |
| Czech | 44 | 0.8% |
| Czechoslovakian | 15 | 0.3% |
| Dutch | 43 | 0.8% |
| Eastern European | 16 | 0.3% |
| English | 502 | 9.1% |
| European | 315 | 5.7% |
| Finnish | 83 | 1.5% |
| French | 248 | 4.5% |
| French Canadian | 41 | 0.7% |
| German | 867 | 15.8% |
| Greek | 55 | 1.0% |
| Indian (Asian) | 33 | 0.6% |
| Iranian | 16 | 0.3% |
| Irish | 844 | 15.4% |
| Italian | 558 | 10.2% |
| Korean | 28 | 0.5% |
| Mexican | 643 | 11.7% |
| Native Hawaiian | 52 | 0.9% |
| Northern European | 21 | 0.4% |
| Norwegian | 97 | 1.8% |
| Polish | 142 | 2.6% |
| Portuguese | 110 | 2.0% |
| Russian | 100 | 1.8% |
| Scottish | 296 | 5.4% |
| Sioux | 40 | 0.7% |
| Spanish | 14 | 0.3% |
| Swedish | 16 | 0.3% |
| Thai | 14 | 0.3% |
| Ukrainian | 22 | 0.4% |
| Welsh | 34 | 0.6% | View All 41 Rows |
Immigrants in Boulder Creek
The most numerous immigrant groups reported in Boulder Creek came from Europe (145 | 2.6%), Asia (94 | 1.7%), Eastern Europe (91 | 1.7%), Central America (67 | 1.2%), and Latin America (67 | 1.2%), together accounting for 8.5% of all Boulder Creek residents.
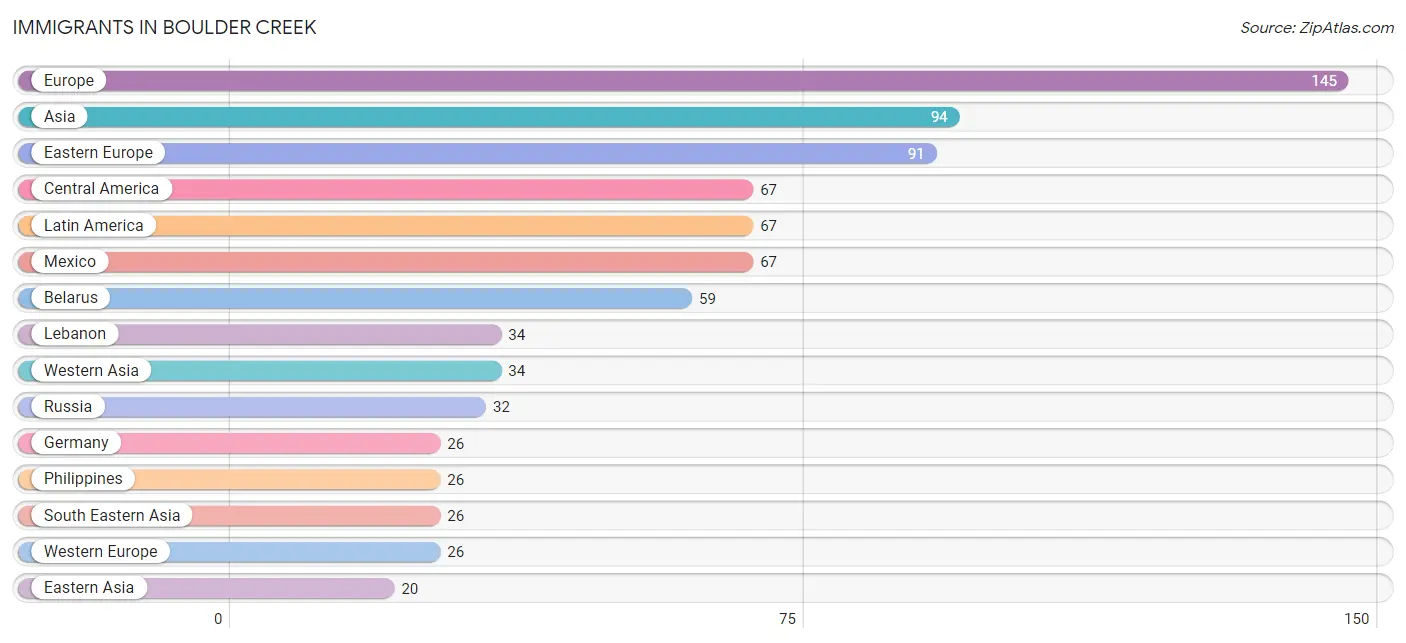
| Immigration Origin | # Population | % Population |
| Asia | 94 | 1.7% |
| Belarus | 59 | 1.1% |
| Canada | 17 | 0.3% |
| Central America | 67 | 1.2% |
| Eastern Asia | 20 | 0.4% |
| Eastern Europe | 91 | 1.7% |
| England | 13 | 0.2% |
| Europe | 145 | 2.6% |
| Germany | 26 | 0.5% |
| India | 14 | 0.3% |
| Italy | 12 | 0.2% |
| Japan | 9 | 0.2% |
| Korea | 11 | 0.2% |
| Latin America | 67 | 1.2% |
| Lebanon | 34 | 0.6% |
| Mexico | 67 | 1.2% |
| Northern Europe | 16 | 0.3% |
| Philippines | 26 | 0.5% |
| Russia | 32 | 0.6% |
| South Central Asia | 14 | 0.3% |
| South Eastern Asia | 26 | 0.5% |
| Southern Europe | 12 | 0.2% |
| Western Asia | 34 | 0.6% |
| Western Europe | 26 | 0.5% | View All 24 Rows |
Sex and Age in Boulder Creek
Sex and Age in Boulder Creek
The most populous age groups in Boulder Creek are 60 to 64 Years (279 | 9.6%) for men and 45 to 49 Years (412 | 15.9%) for women.
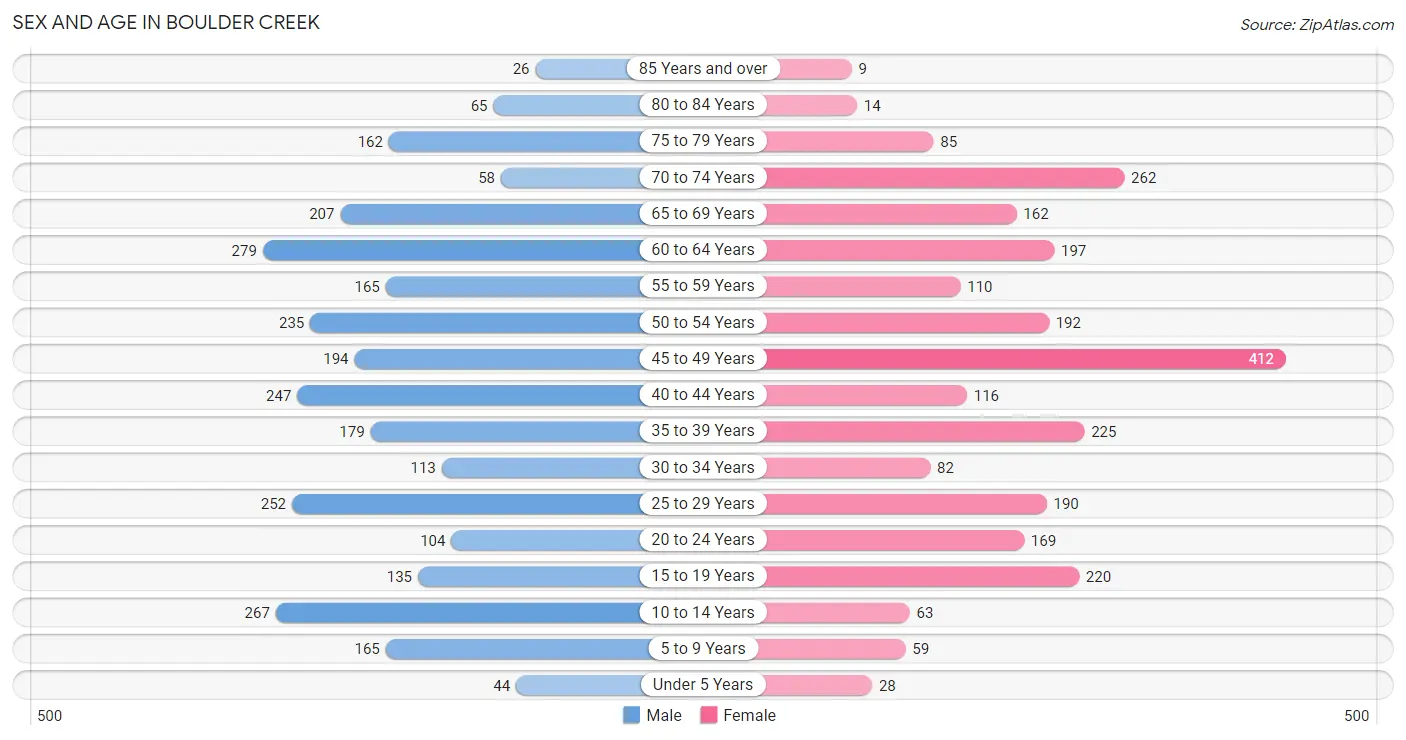
| Age Bracket | Male | Female |
| Under 5 Years | 44 (1.5%) | 28 (1.1%) |
| 5 to 9 Years | 165 (5.7%) | 59 (2.3%) |
| 10 to 14 Years | 267 (9.2%) | 63 (2.4%) |
| 15 to 19 Years | 135 (4.7%) | 220 (8.5%) |
| 20 to 24 Years | 104 (3.6%) | 169 (6.5%) |
| 25 to 29 Years | 252 (8.7%) | 190 (7.3%) |
| 30 to 34 Years | 113 (3.9%) | 82 (3.2%) |
| 35 to 39 Years | 179 (6.2%) | 225 (8.7%) |
| 40 to 44 Years | 247 (8.5%) | 116 (4.5%) |
| 45 to 49 Years | 194 (6.7%) | 412 (15.9%) |
| 50 to 54 Years | 235 (8.1%) | 192 (7.4%) |
| 55 to 59 Years | 165 (5.7%) | 110 (4.2%) |
| 60 to 64 Years | 279 (9.6%) | 197 (7.6%) |
| 65 to 69 Years | 207 (7.1%) | 162 (6.2%) |
| 70 to 74 Years | 58 (2.0%) | 262 (10.1%) |
| 75 to 79 Years | 162 (5.6%) | 85 (3.3%) |
| 80 to 84 Years | 65 (2.2%) | 14 (0.5%) |
| 85 Years and over | 26 (0.9%) | 9 (0.4%) |
| Total | 2,897 (100.0%) | 2,595 (100.0%) |
Families and Households in Boulder Creek
Median Family Size in Boulder Creek
The median family size in Boulder Creek is 2.99 persons per family, with married-couple families (1,001 | 70.6%) accounting for the largest median family size of 3.15 persons per family. On the other hand, single male/father families (205 | 14.5%) represent the smallest median family size with 2.54 persons per family.
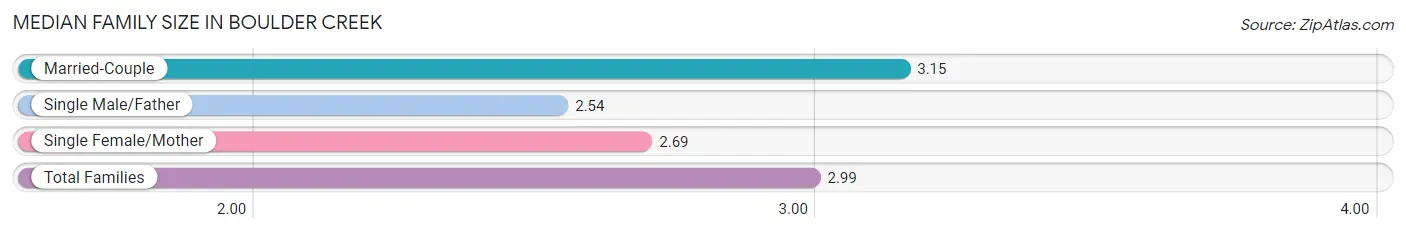
| Family Type | # Families | Family Size |
| Married-Couple | 1,001 (70.6%) | 3.15 |
| Single Male/Father | 205 (14.5%) | 2.54 |
| Single Female/Mother | 212 (14.9%) | 2.69 |
| Total Families | 1,418 (100.0%) | 2.99 |
Median Household Size in Boulder Creek
The median household size in Boulder Creek is 2.59 persons per household, with single male/father households (205 | 9.7%) accounting for the largest median household size of 3.39 persons per household. non-family households (697 | 33.0%) represent the smallest median household size with 1.39 persons per household.
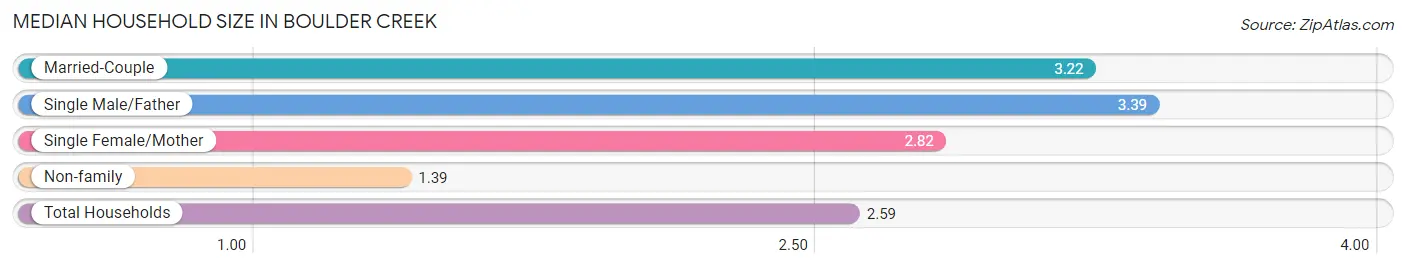
| Household Type | # Households | Household Size |
| Married-Couple | 1,001 (47.3%) | 3.22 |
| Single Male/Father | 205 (9.7%) | 3.39 |
| Single Female/Mother | 212 (10.0%) | 2.82 |
| Non-family | 697 (33.0%) | 1.39 |
| Total Households | 2,115 (100.0%) | 2.59 |
Household Size by Marriage Status in Boulder Creek
Out of a total of 2,115 households in Boulder Creek, 1,418 (67.0%) are family households, while 697 (33.0%) are nonfamily households. The most numerous type of family households are 2-person households, comprising 703, and the most common type of nonfamily households are 1-person households, comprising 469.
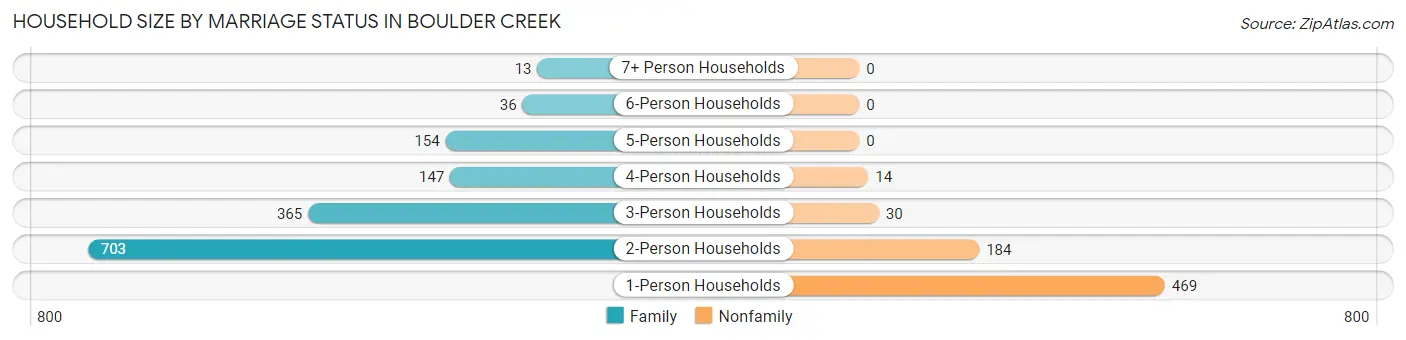
| Household Size | Family Households | Nonfamily Households |
| 1-Person Households | - | 469 (22.2%) |
| 2-Person Households | 703 (33.2%) | 184 (8.7%) |
| 3-Person Households | 365 (17.3%) | 30 (1.4%) |
| 4-Person Households | 147 (7.0%) | 14 (0.7%) |
| 5-Person Households | 154 (7.3%) | 0 (0.0%) |
| 6-Person Households | 36 (1.7%) | 0 (0.0%) |
| 7+ Person Households | 13 (0.6%) | 0 (0.0%) |
| Total | 1,418 (67.0%) | 697 (33.0%) |
Female Fertility in Boulder Creek
Fertility by Age in Boulder Creek
| Age Bracket | Women with Births | Births / 1,000 Women |
| 15 to 19 years | 0 (0.0%) | 0.0 |
| 20 to 34 years | 0 (0.0%) | 0.0 |
| 35 to 50 years | 0 (0.0%) | 0.0 |
| Total | 0 (0.0%) | 0.0 |
Fertility by Age by Marriage Status in Boulder Creek
| Age Bracket | Married | Unmarried |
| 15 to 19 years | 0 (0.0%) | 0 (0.0%) |
| 20 to 34 years | 0 (0.0%) | 0 (0.0%) |
| 35 to 50 years | 0 (0.0%) | 0 (0.0%) |
| Total | 0 (0.0%) | 0 (0.0%) |
Fertility by Education in Boulder Creek
| Educational Attainment | Women with Births | Births / 1,000 Women |
| Less than High School | 0 (0.0%) | 0.0 |
| High School Diploma | 0 (0.0%) | 0.0 |
| College or Associate's Degree | 0 (0.0%) | 0.0 |
| Bachelor's Degree | 0 (0.0%) | 0.0 |
| Graduate Degree | 0 (0.0%) | 0.0 |
| Total | 0 (0.0%) | 0.0 |
Fertility by Education by Marriage Status in Boulder Creek
| Educational Attainment | Married | Unmarried |
| Less than High School | 0 (0.0%) | 0 (0.0%) |
| High School Diploma | 0 (0.0%) | 0 (0.0%) |
| College or Associate's Degree | 0 (0.0%) | 0 (0.0%) |
| Bachelor's Degree | 0 (0.0%) | 0 (0.0%) |
| Graduate Degree | 0 (0.0%) | 0 (0.0%) |
| Total | 0 (0.0%) | 0 (0.0%) |
Employment Characteristics in Boulder Creek
Employment by Class of Employer in Boulder Creek
Among the 2,723 employed individuals in Boulder Creek, private company employees (1,857 | 68.2%), self-employed (not incorporated) (300 | 11.0%), and local government employees (238 | 8.7%) make up the most common classes of employment.
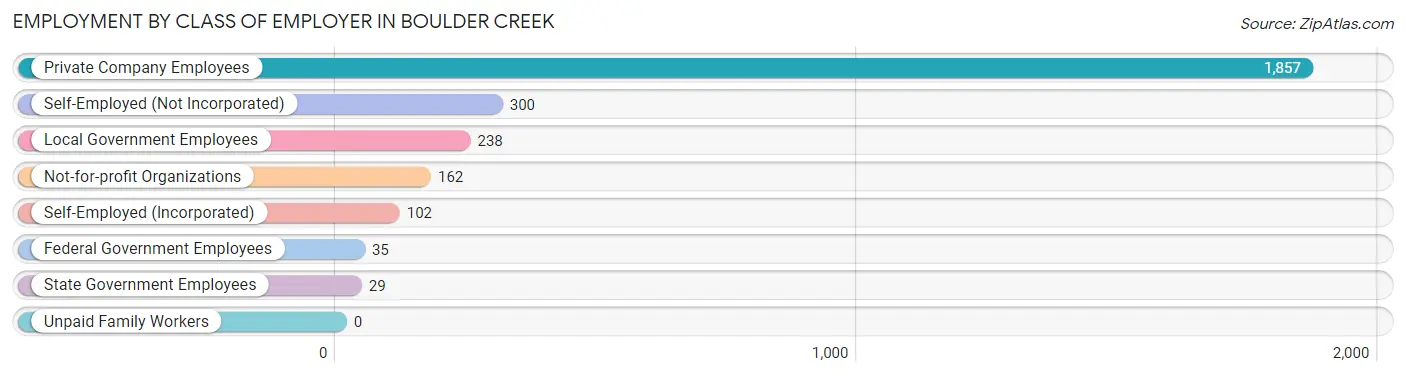
| Employer Class | # Employees | % Employees |
| Private Company Employees | 1,857 | 68.2% |
| Self-Employed (Incorporated) | 102 | 3.7% |
| Self-Employed (Not Incorporated) | 300 | 11.0% |
| Not-for-profit Organizations | 162 | 5.9% |
| Local Government Employees | 238 | 8.7% |
| State Government Employees | 29 | 1.1% |
| Federal Government Employees | 35 | 1.3% |
| Unpaid Family Workers | 0 | 0.0% |
| Total | 2,723 | 100.0% |
Employment Status by Age in Boulder Creek
According to the labor force statistics for Boulder Creek, out of the total population over 16 years of age (4,855), 63.8% or 3,097 individuals are in the labor force, with 10.0% or 310 of them unemployed. The age group with the highest labor force participation rate is 30 to 34 years, with 100.0% or 195 individuals in the labor force. Within the labor force, the 45 to 54 years age range has the highest percentage of unemployed individuals, with 24.1% or 195 of them being unemployed.
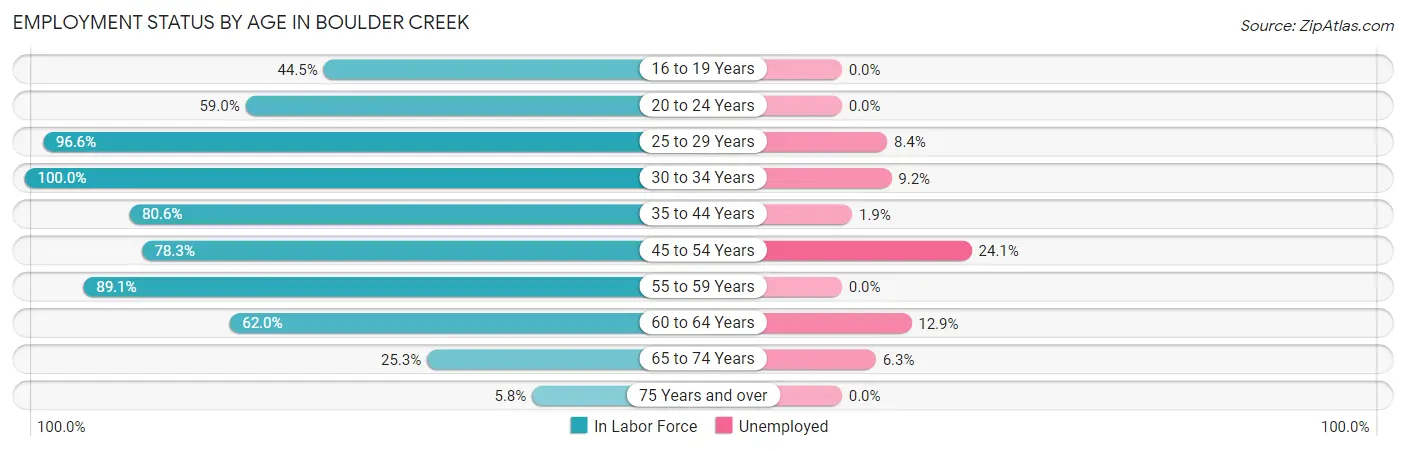
| Age Bracket | In Labor Force | Unemployed |
| 16 to 19 Years | 153 (44.5%) | 0 (0.0%) |
| 20 to 24 Years | 161 (59.0%) | 0 (0.0%) |
| 25 to 29 Years | 427 (96.6%) | 36 (8.4%) |
| 30 to 34 Years | 195 (100.0%) | 18 (9.2%) |
| 35 to 44 Years | 618 (80.6%) | 12 (1.9%) |
| 45 to 54 Years | 809 (78.3%) | 195 (24.1%) |
| 55 to 59 Years | 245 (89.1%) | 0 (0.0%) |
| 60 to 64 Years | 295 (62.0%) | 38 (12.9%) |
| 65 to 74 Years | 174 (25.3%) | 11 (6.3%) |
| 75 Years and over | 21 (5.8%) | 0 (0.0%) |
| Total | 3,097 (63.8%) | 310 (10.0%) |
Employment Status by Educational Attainment in Boulder Creek
According to labor force statistics for Boulder Creek, 81.2% of individuals (2,589) out of the total population between 25 and 64 years of age (3,188) are in the labor force, with 11.5% or 298 of them being unemployed. The group with the highest labor force participation rate are those with the educational attainment of high school diploma, with 92.4% or 521 individuals in the labor force. Within the labor force, individuals with college / associate degree education have the highest percentage of unemployment, with 21.4% or 247 of them being unemployed.
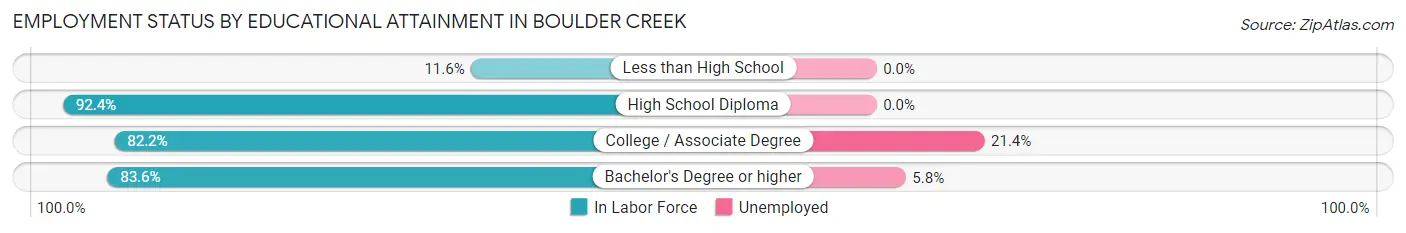
| Educational Attainment | In Labor Force | Unemployed |
| Less than High School | 17 (11.6%) | 0 (0.0%) |
| High School Diploma | 521 (92.4%) | 0 (0.0%) |
| College / Associate Degree | 1,152 (82.2%) | 300 (21.4%) |
| Bachelor's Degree or higher | 900 (83.6%) | 62 (5.8%) |
| Total | 2,589 (81.2%) | 367 (11.5%) |
Employment Occupations by Sex in Boulder Creek
Management, Business, Science and Arts Occupations
The most common Management, Business, Science and Arts occupations in Boulder Creek are Computers, Engineering & Science (564 | 20.2%), Computers & Mathematics (363 | 13.0%), Management (338 | 12.1%), Community & Social Service (331 | 11.9%), and Education Instruction & Library (217 | 7.8%).
Management, Business, Science and Arts Occupations by Sex
Within the Management, Business, Science and Arts occupations in Boulder Creek, the most male-oriented occupations are Legal Services & Support (100.0%), Architecture & Engineering (78.3%), and Computers & Mathematics (76.9%), while the most female-oriented occupations are Education, Arts & Media (90.5%), Education Instruction & Library (88.9%), and Health Technologists (74.7%).
| Occupation | Male | Female |
| Management | 258 (76.3%) | 80 (23.7%) |
| Business & Financial | 40 (36.7%) | 69 (63.3%) |
| Computers, Engineering & Science | 423 (75.0%) | 141 (25.0%) |
| Computers & Mathematics | 279 (76.9%) | 84 (23.1%) |
| Architecture & Engineering | 126 (78.3%) | 35 (21.7%) |
| Life, Physical & Social Science | 18 (45.0%) | 22 (55.0%) |
| Community & Social Service | 87 (26.3%) | 244 (73.7%) |
| Education, Arts & Media | 2 (9.5%) | 19 (90.5%) |
| Legal Services & Support | 13 (100.0%) | 0 (0.0%) |
| Education Instruction & Library | 24 (11.1%) | 193 (88.9%) |
| Arts, Media & Entertainment | 48 (60.0%) | 32 (40.0%) |
| Health Diagnosing & Treating | 30 (32.6%) | 62 (67.4%) |
| Health Technologists | 21 (25.3%) | 62 (74.7%) |
| Total (Category) | 838 (58.4%) | 596 (41.6%) |
| Total (Overall) | 1,514 (54.3%) | 1,274 (45.7%) |
Services Occupations
The most common Services occupations in Boulder Creek are Security & Protection (147 | 5.3%), Food Preparation & Serving (138 | 5.0%), Firefighting & Prevention (117 | 4.2%), Cleaning & Maintenance (63 | 2.3%), and Healthcare Support (50 | 1.8%).
Services Occupations by Sex
Within the Services occupations in Boulder Creek, the most male-oriented occupations are Cleaning & Maintenance (71.4%), Law Enforcement (66.7%), and Security & Protection (37.4%), while the most female-oriented occupations are Healthcare Support (100.0%), Personal Care & Service (100.0%), and Food Preparation & Serving (87.7%).
| Occupation | Male | Female |
| Healthcare Support | 0 (0.0%) | 50 (100.0%) |
| Security & Protection | 55 (37.4%) | 92 (62.6%) |
| Firefighting & Prevention | 35 (29.9%) | 82 (70.1%) |
| Law Enforcement | 20 (66.7%) | 10 (33.3%) |
| Food Preparation & Serving | 17 (12.3%) | 121 (87.7%) |
| Cleaning & Maintenance | 45 (71.4%) | 18 (28.6%) |
| Personal Care & Service | 0 (0.0%) | 29 (100.0%) |
| Total (Category) | 117 (27.4%) | 310 (72.6%) |
| Total (Overall) | 1,514 (54.3%) | 1,274 (45.7%) |
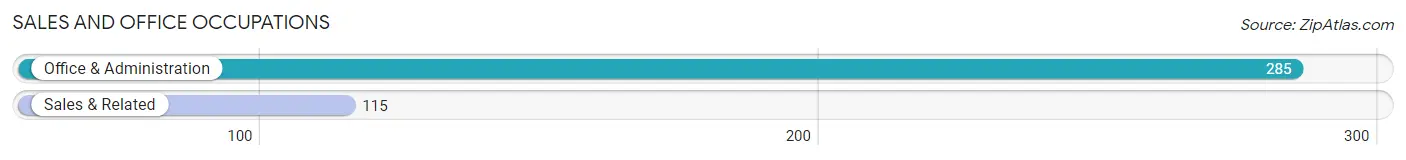
Sales and Office Occupations
The most common Sales and Office occupations in Boulder Creek are Office & Administration (285 | 10.2%), and Sales & Related (115 | 4.1%).
Sales and Office Occupations by Sex
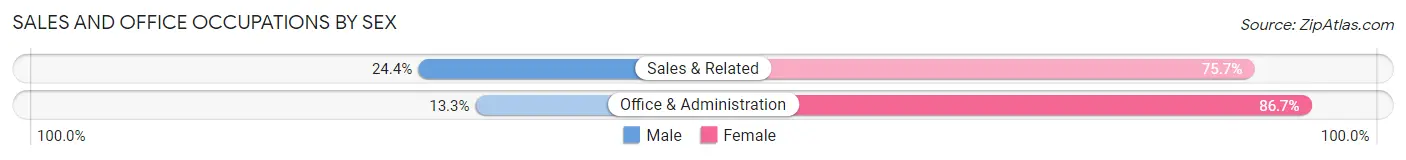
| Occupation | Male | Female |
| Sales & Related | 28 (24.3%) | 87 (75.6%) |
| Office & Administration | 38 (13.3%) | 247 (86.7%) |
| Total (Category) | 66 (16.5%) | 334 (83.5%) |
| Total (Overall) | 1,514 (54.3%) | 1,274 (45.7%) |
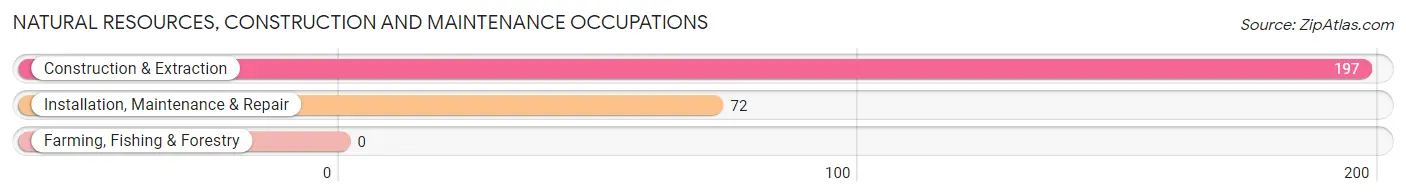
Natural Resources, Construction and Maintenance Occupations
The most common Natural Resources, Construction and Maintenance occupations in Boulder Creek are Construction & Extraction (197 | 7.1%), and Installation, Maintenance & Repair (72 | 2.6%).
Natural Resources, Construction and Maintenance Occupations by Sex
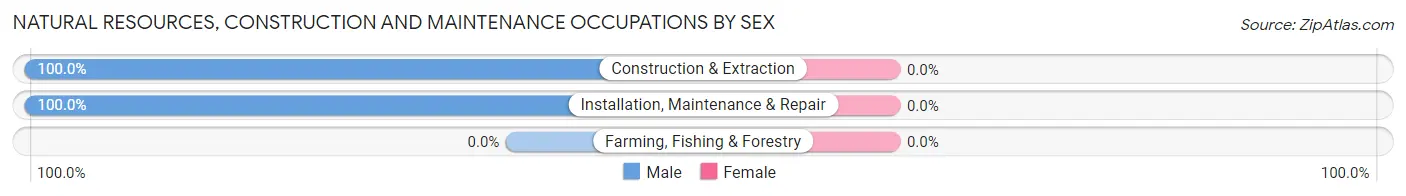
| Occupation | Male | Female |
| Farming, Fishing & Forestry | 0 (0.0%) | 0 (0.0%) |
| Construction & Extraction | 197 (100.0%) | 0 (0.0%) |
| Installation, Maintenance & Repair | 72 (100.0%) | 0 (0.0%) |
| Total (Category) | 269 (100.0%) | 0 (0.0%) |
| Total (Overall) | 1,514 (54.3%) | 1,274 (45.7%) |
Production, Transportation and Moving Occupations
The most common Production, Transportation and Moving occupations in Boulder Creek are Production (217 | 7.8%), Material Moving (26 | 0.9%), and Transportation (15 | 0.5%).
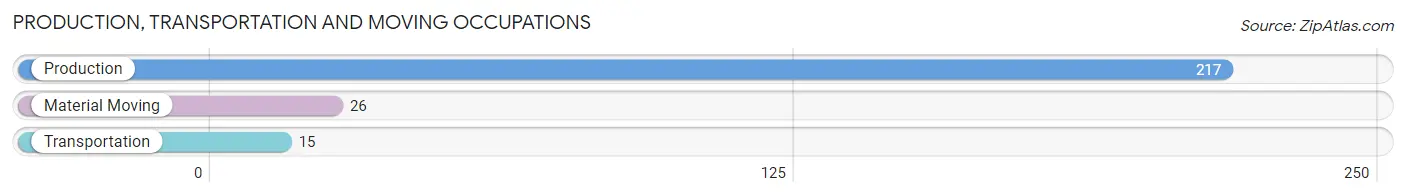
Production, Transportation and Moving Occupations by Sex
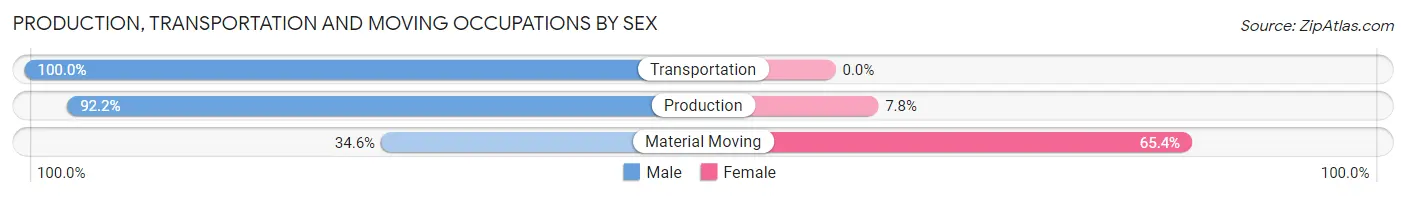
| Occupation | Male | Female |
| Production | 200 (92.2%) | 17 (7.8%) |
| Transportation | 15 (100.0%) | 0 (0.0%) |
| Material Moving | 9 (34.6%) | 17 (65.4%) |
| Total (Category) | 224 (86.8%) | 34 (13.2%) |
| Total (Overall) | 1,514 (54.3%) | 1,274 (45.7%) |
Employment Industries by Sex in Boulder Creek
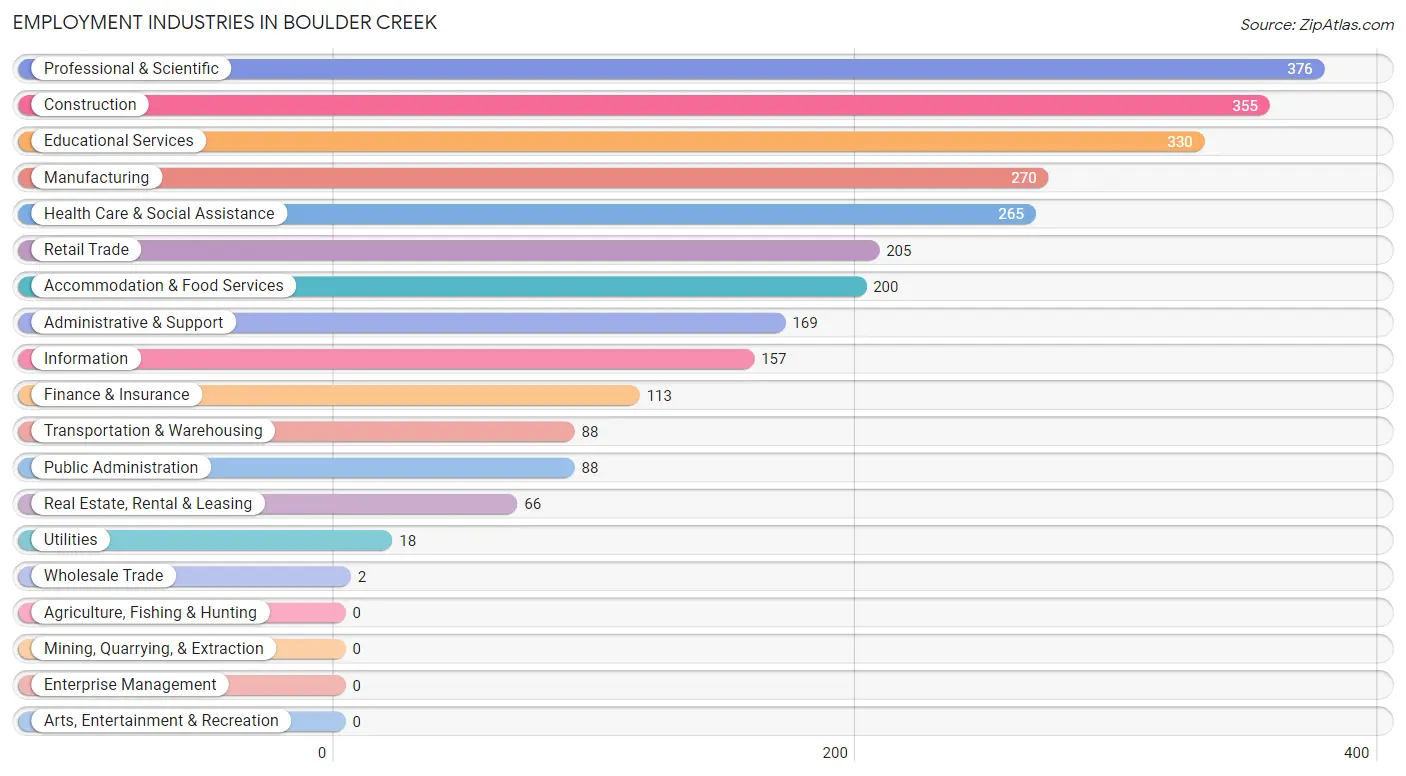
Employment Industries in Boulder Creek
The major employment industries in Boulder Creek include Professional & Scientific (376 | 13.5%), Construction (355 | 12.7%), Educational Services (330 | 11.8%), Manufacturing (270 | 9.7%), and Health Care & Social Assistance (265 | 9.5%).
Employment Industries by Sex in Boulder Creek
The Boulder Creek industries that see more men than women are Transportation & Warehousing (100.0%), Utilities (100.0%), and Real Estate, Rental & Leasing (100.0%), whereas the industries that tend to have a higher number of women are Wholesale Trade (100.0%), Retail Trade (75.1%), and Accommodation & Food Services (72.0%).
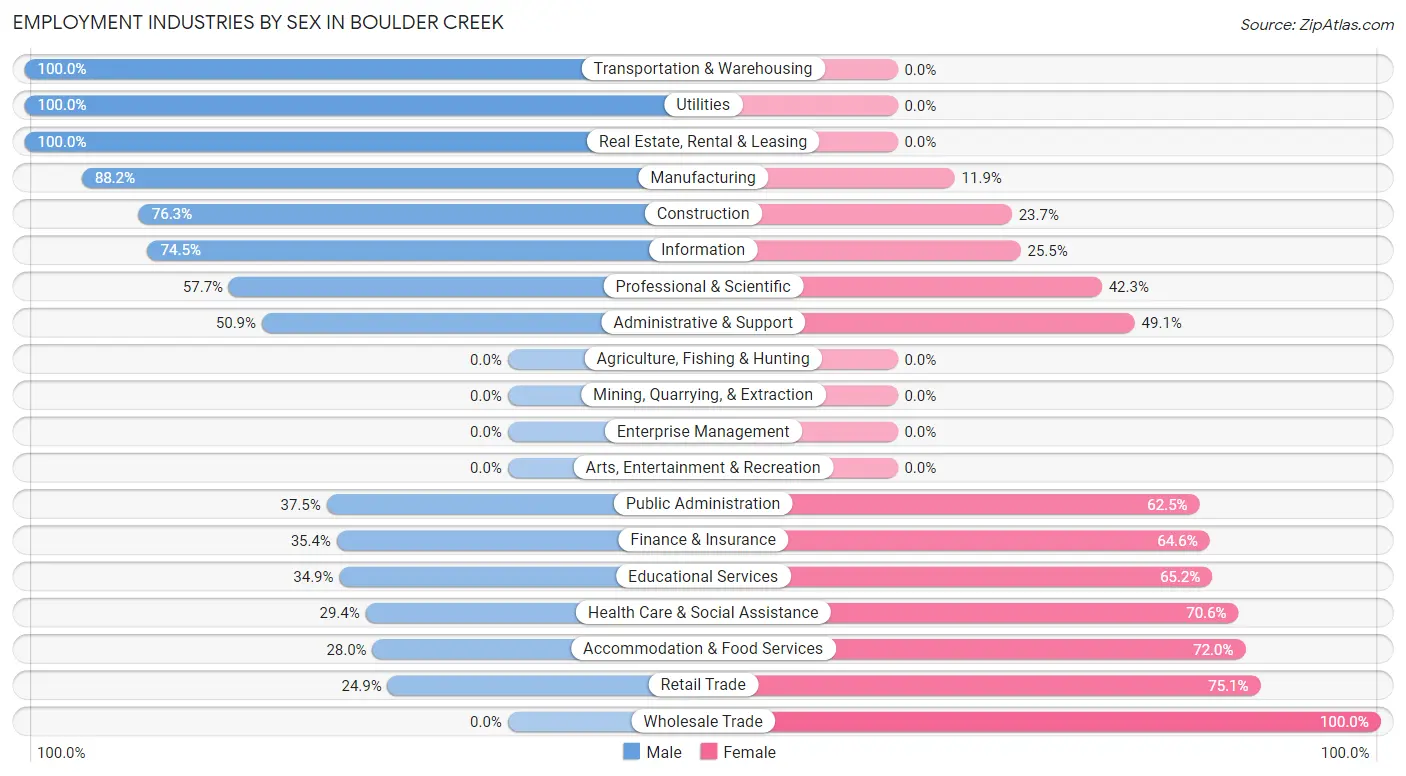
| Industry | Male | Female |
| Agriculture, Fishing & Hunting | 0 (0.0%) | 0 (0.0%) |
| Mining, Quarrying, & Extraction | 0 (0.0%) | 0 (0.0%) |
| Construction | 271 (76.3%) | 84 (23.7%) |
| Manufacturing | 238 (88.1%) | 32 (11.8%) |
| Wholesale Trade | 0 (0.0%) | 2 (100.0%) |
| Retail Trade | 51 (24.9%) | 154 (75.1%) |
| Transportation & Warehousing | 88 (100.0%) | 0 (0.0%) |
| Utilities | 18 (100.0%) | 0 (0.0%) |
| Information | 117 (74.5%) | 40 (25.5%) |
| Finance & Insurance | 40 (35.4%) | 73 (64.6%) |
| Real Estate, Rental & Leasing | 66 (100.0%) | 0 (0.0%) |
| Professional & Scientific | 217 (57.7%) | 159 (42.3%) |
| Enterprise Management | 0 (0.0%) | 0 (0.0%) |
| Administrative & Support | 86 (50.9%) | 83 (49.1%) |
| Educational Services | 115 (34.8%) | 215 (65.1%) |
| Health Care & Social Assistance | 78 (29.4%) | 187 (70.6%) |
| Arts, Entertainment & Recreation | 0 (0.0%) | 0 (0.0%) |
| Accommodation & Food Services | 56 (28.0%) | 144 (72.0%) |
| Public Administration | 33 (37.5%) | 55 (62.5%) |
| Total | 1,514 (54.3%) | 1,274 (45.7%) |
Education in Boulder Creek
School Enrollment in Boulder Creek
The most common levels of schooling among the 1,190 students in Boulder Creek are college / undergraduate (389 | 32.7%), high school (257 | 21.6%), and middle school (240 | 20.2%).
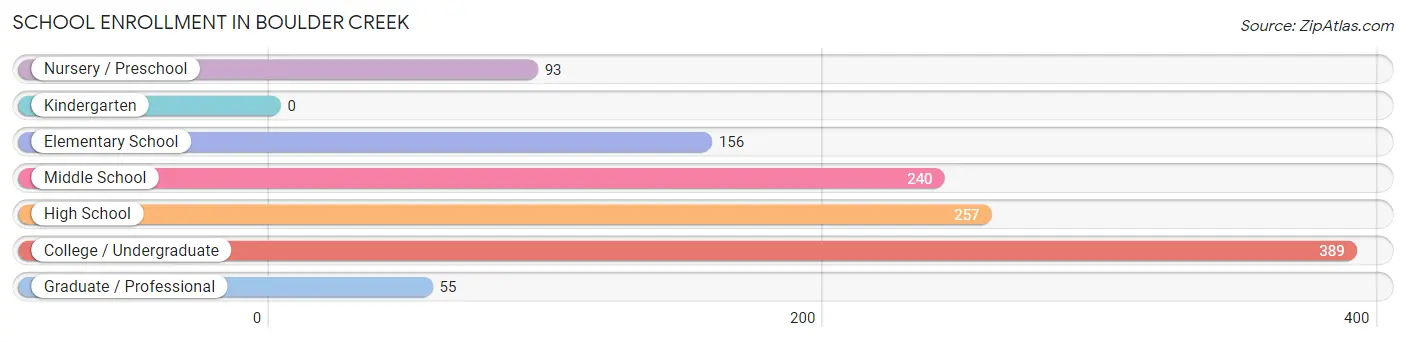
| School Level | # Students | % Students |
| Nursery / Preschool | 93 | 7.8% |
| Kindergarten | 0 | 0.0% |
| Elementary School | 156 | 13.1% |
| Middle School | 240 | 20.2% |
| High School | 257 | 21.6% |
| College / Undergraduate | 389 | 32.7% |
| Graduate / Professional | 55 | 4.6% |
| Total | 1,190 | 100.0% |
School Enrollment by Age by Funding Source in Boulder Creek
Out of a total of 1,190 students who are enrolled in schools in Boulder Creek, 96 (8.1%) attend a private institution, while the remaining 1,094 (91.9%) are enrolled in public schools. The age group of 35 years and over has the highest likelihood of being enrolled in private schools, with 9 (100.0% in the age bracket) enrolled. Conversely, the age group of 5 to 9 year old has the lowest likelihood of being enrolled in a private school, with 196 (100.0% in the age bracket) attending a public institution.
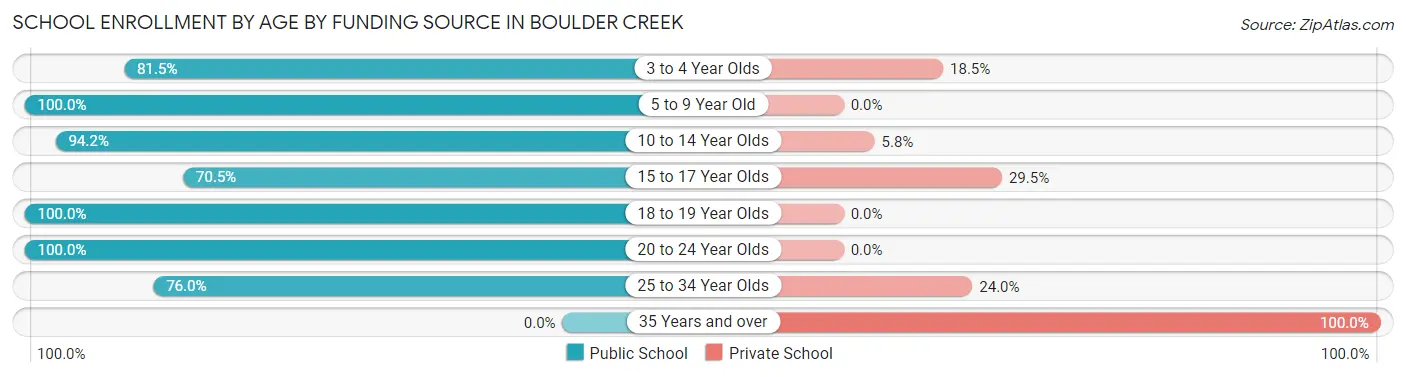
| Age Bracket | Public School | Private School |
| 3 to 4 Year Olds | 44 (81.5%) | 10 (18.5%) |
| 5 to 9 Year Old | 196 (100.0%) | 0 (0.0%) |
| 10 to 14 Year Olds | 311 (94.2%) | 19 (5.8%) |
| 15 to 17 Year Olds | 55 (70.5%) | 23 (29.5%) |
| 18 to 19 Year Olds | 218 (100.0%) | 0 (0.0%) |
| 20 to 24 Year Olds | 159 (100.0%) | 0 (0.0%) |
| 25 to 34 Year Olds | 111 (76.0%) | 35 (24.0%) |
| 35 Years and over | 0 (0.0%) | 9 (100.0%) |
| Total | 1,094 (91.9%) | 96 (8.1%) |
Educational Attainment by Field of Study in Boulder Creek
Business (211 | 12.7%), education (187 | 11.2%), social sciences (166 | 10.0%), computers & mathematics (162 | 9.7%), and engineering (159 | 9.6%) are the most common fields of study among 1,664 individuals in Boulder Creek who have obtained a bachelor's degree or higher.
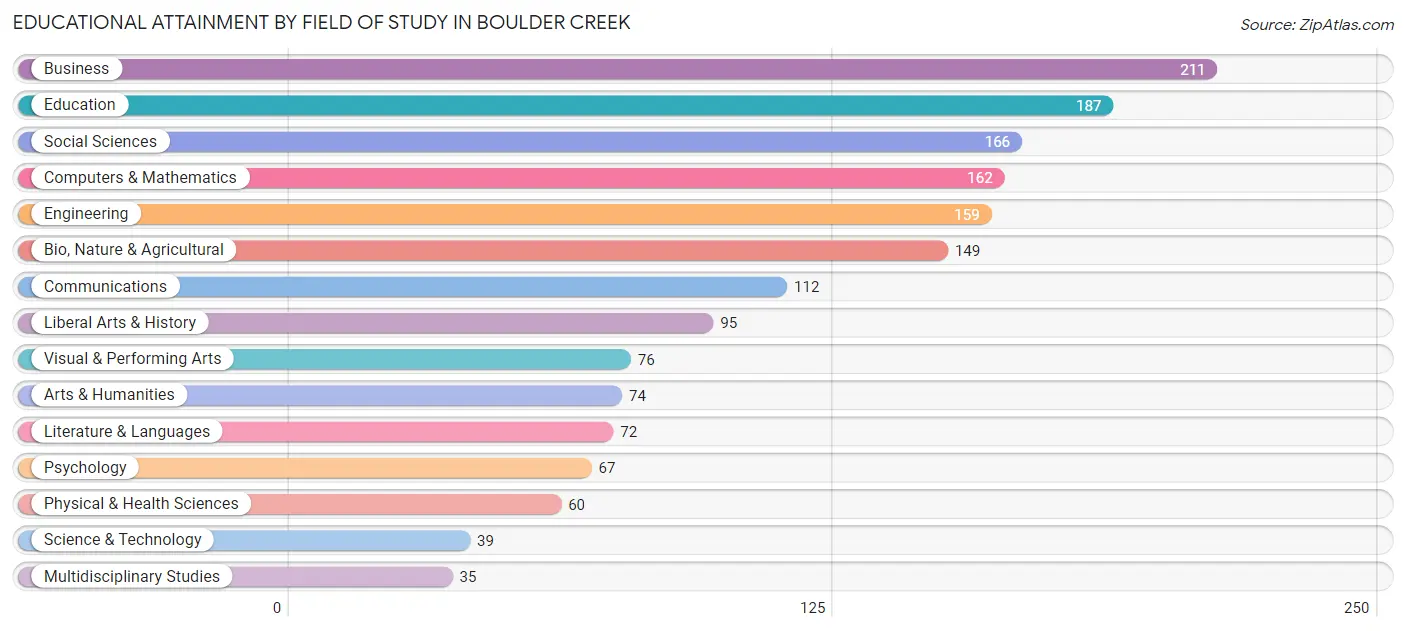
| Field of Study | # Graduates | % Graduates |
| Computers & Mathematics | 162 | 9.7% |
| Bio, Nature & Agricultural | 149 | 8.9% |
| Physical & Health Sciences | 60 | 3.6% |
| Psychology | 67 | 4.0% |
| Social Sciences | 166 | 10.0% |
| Engineering | 159 | 9.6% |
| Multidisciplinary Studies | 35 | 2.1% |
| Science & Technology | 39 | 2.3% |
| Business | 211 | 12.7% |
| Education | 187 | 11.2% |
| Literature & Languages | 72 | 4.3% |
| Liberal Arts & History | 95 | 5.7% |
| Visual & Performing Arts | 76 | 4.6% |
| Communications | 112 | 6.7% |
| Arts & Humanities | 74 | 4.4% |
| Total | 1,664 | 100.0% |
Transportation & Commute in Boulder Creek
Vehicle Availability by Sex in Boulder Creek
The most prevalent vehicle ownership categories in Boulder Creek are males with 2 vehicles (634, accounting for 41.9%) and females with 2 vehicles (475, making up 52.6%).
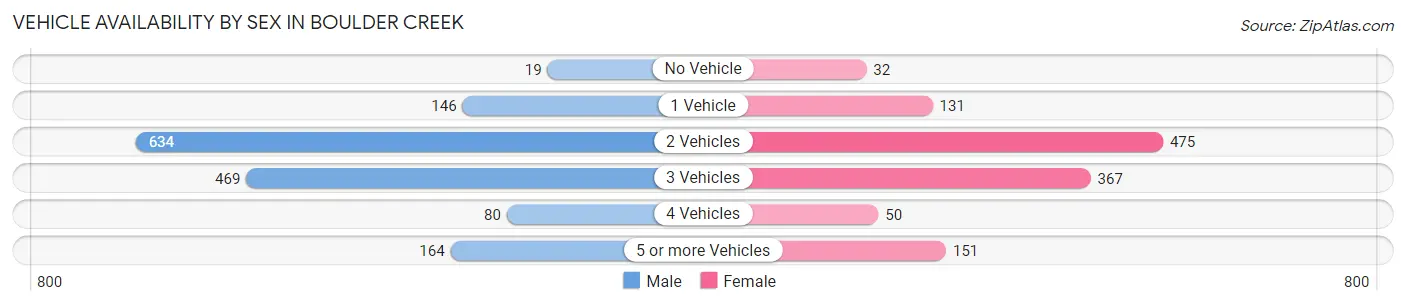
| Vehicles Available | Male | Female |
| No Vehicle | 19 (1.3%) | 32 (2.6%) |
| 1 Vehicle | 146 (9.7%) | 131 (10.9%) |
| 2 Vehicles | 634 (41.9%) | 475 (39.4%) |
| 3 Vehicles | 469 (31.0%) | 367 (30.4%) |
| 4 Vehicles | 80 (5.3%) | 50 (4.2%) |
| 5 or more Vehicles | 164 (10.8%) | 151 (12.5%) |
| Total | 1,512 (100.0%) | 1,206 (100.0%) |
Commute Time in Boulder Creek
The most frequently occuring commute durations in Boulder Creek are 45 to 59 minutes (720 commuters, 30.0%), 60 to 89 minutes (384 commuters, 16.0%), and 5 to 9 minutes (265 commuters, 11.0%).
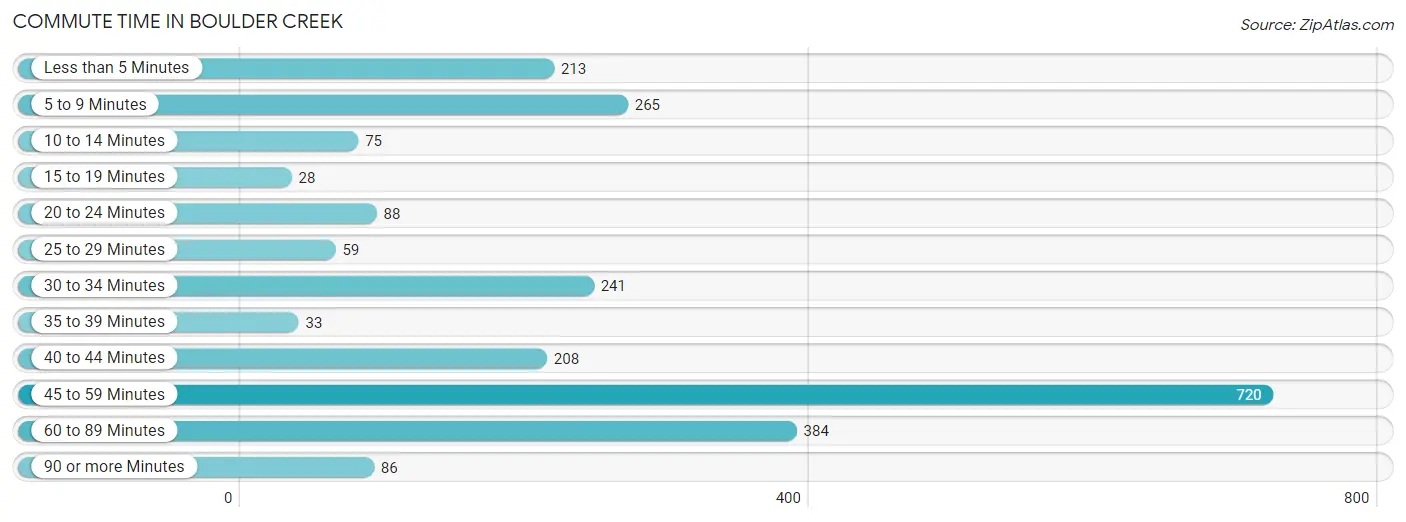
| Commute Time | # Commuters | % Commuters |
| Less than 5 Minutes | 213 | 8.9% |
| 5 to 9 Minutes | 265 | 11.0% |
| 10 to 14 Minutes | 75 | 3.1% |
| 15 to 19 Minutes | 28 | 1.2% |
| 20 to 24 Minutes | 88 | 3.7% |
| 25 to 29 Minutes | 59 | 2.5% |
| 30 to 34 Minutes | 241 | 10.0% |
| 35 to 39 Minutes | 33 | 1.4% |
| 40 to 44 Minutes | 208 | 8.7% |
| 45 to 59 Minutes | 720 | 30.0% |
| 60 to 89 Minutes | 384 | 16.0% |
| 90 or more Minutes | 86 | 3.6% |
Commute Time by Sex in Boulder Creek
The most common commute times in Boulder Creek are 45 to 59 minutes (291 commuters, 22.0%) for males and 45 to 59 minutes (429 commuters, 39.8%) for females.
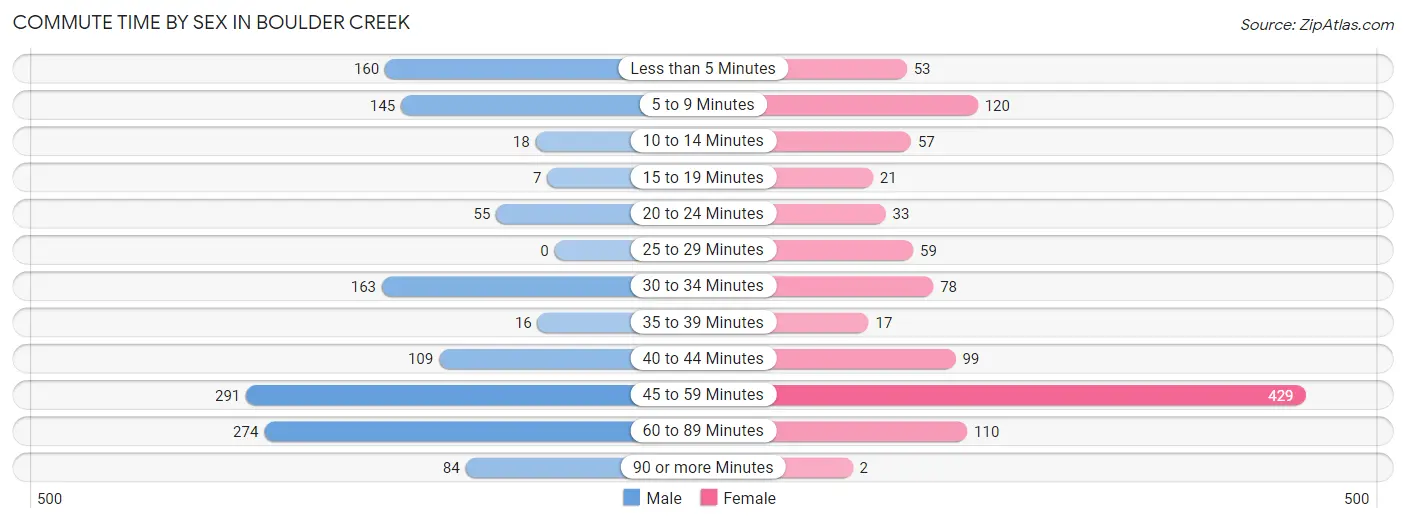
| Commute Time | Male | Female |
| Less than 5 Minutes | 160 (12.1%) | 53 (4.9%) |
| 5 to 9 Minutes | 145 (11.0%) | 120 (11.1%) |
| 10 to 14 Minutes | 18 (1.4%) | 57 (5.3%) |
| 15 to 19 Minutes | 7 (0.5%) | 21 (1.9%) |
| 20 to 24 Minutes | 55 (4.2%) | 33 (3.1%) |
| 25 to 29 Minutes | 0 (0.0%) | 59 (5.5%) |
| 30 to 34 Minutes | 163 (12.3%) | 78 (7.2%) |
| 35 to 39 Minutes | 16 (1.2%) | 17 (1.6%) |
| 40 to 44 Minutes | 109 (8.3%) | 99 (9.2%) |
| 45 to 59 Minutes | 291 (22.0%) | 429 (39.8%) |
| 60 to 89 Minutes | 274 (20.7%) | 110 (10.2%) |
| 90 or more Minutes | 84 (6.4%) | 2 (0.2%) |
Time of Departure to Work by Sex in Boulder Creek
The most frequent times of departure to work in Boulder Creek are 7:00 AM to 7:29 AM (362, 27.4%) for males and 7:00 AM to 7:29 AM (239, 22.2%) for females.
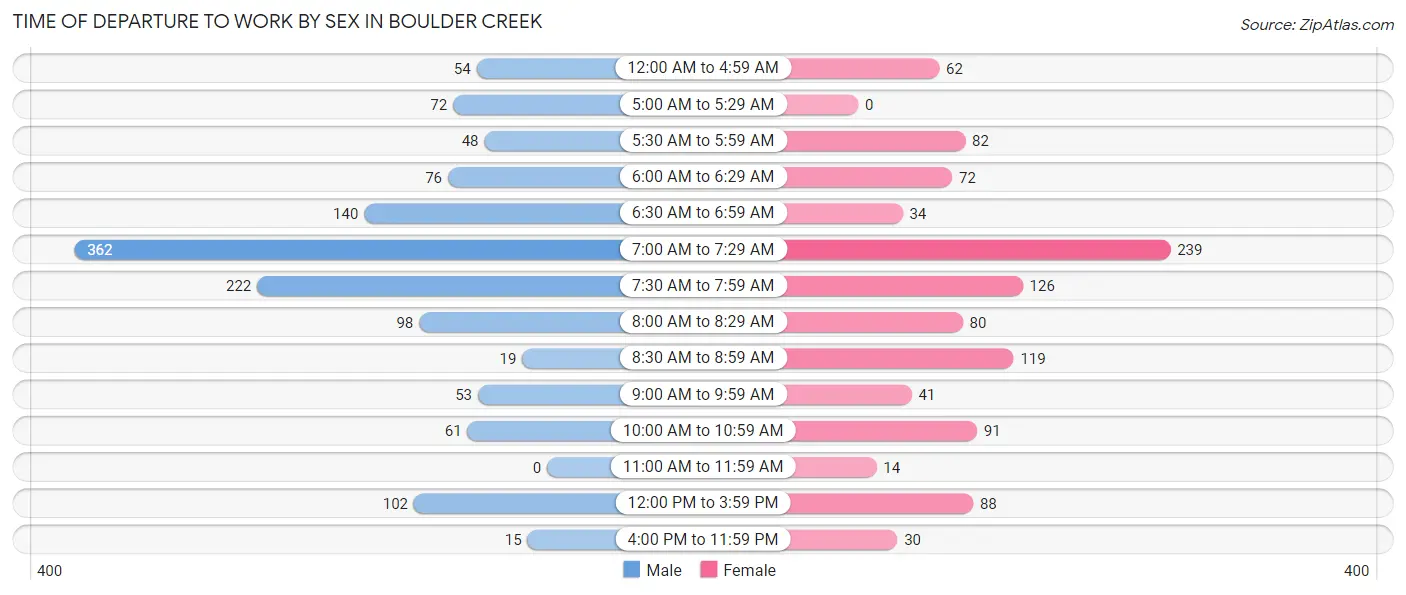
| Time of Departure | Male | Female |
| 12:00 AM to 4:59 AM | 54 (4.1%) | 62 (5.8%) |
| 5:00 AM to 5:29 AM | 72 (5.4%) | 0 (0.0%) |
| 5:30 AM to 5:59 AM | 48 (3.6%) | 82 (7.6%) |
| 6:00 AM to 6:29 AM | 76 (5.8%) | 72 (6.7%) |
| 6:30 AM to 6:59 AM | 140 (10.6%) | 34 (3.2%) |
| 7:00 AM to 7:29 AM | 362 (27.4%) | 239 (22.2%) |
| 7:30 AM to 7:59 AM | 222 (16.8%) | 126 (11.7%) |
| 8:00 AM to 8:29 AM | 98 (7.4%) | 80 (7.4%) |
| 8:30 AM to 8:59 AM | 19 (1.4%) | 119 (11.0%) |
| 9:00 AM to 9:59 AM | 53 (4.0%) | 41 (3.8%) |
| 10:00 AM to 10:59 AM | 61 (4.6%) | 91 (8.4%) |
| 11:00 AM to 11:59 AM | 0 (0.0%) | 14 (1.3%) |
| 12:00 PM to 3:59 PM | 102 (7.7%) | 88 (8.2%) |
| 4:00 PM to 11:59 PM | 15 (1.1%) | 30 (2.8%) |
| Total | 1,322 (100.0%) | 1,078 (100.0%) |
Housing Occupancy in Boulder Creek
Occupancy by Ownership in Boulder Creek
Of the total 2,115 dwellings in Boulder Creek, owner-occupied units account for 1,622 (76.7%), while renter-occupied units make up 493 (23.3%).
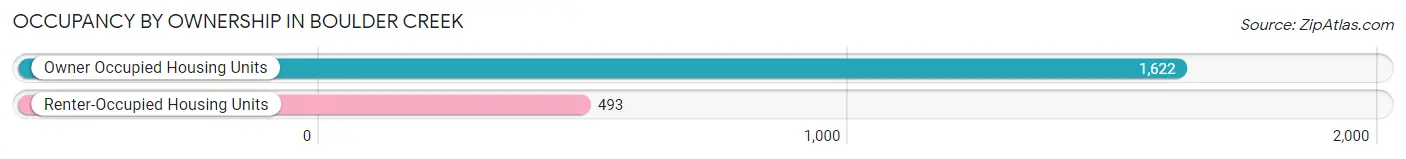
| Occupancy | # Housing Units | % Housing Units |
| Owner Occupied Housing Units | 1,622 | 76.7% |
| Renter-Occupied Housing Units | 493 | 23.3% |
| Total Occupied Housing Units | 2,115 | 100.0% |
Occupancy by Household Size in Boulder Creek
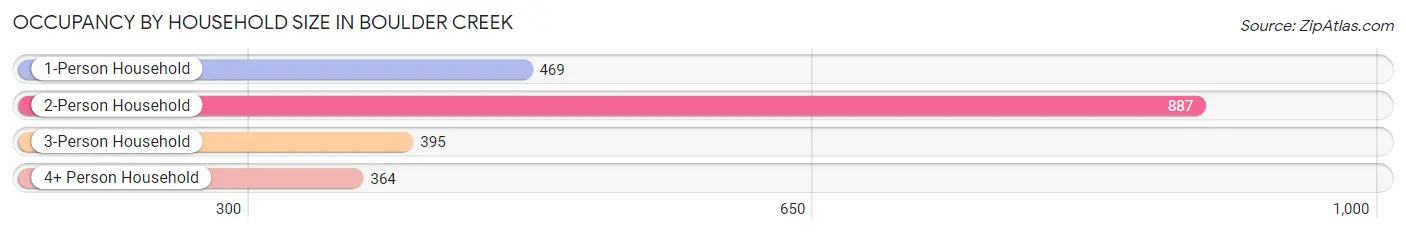
| Household Size | # Housing Units | % Housing Units |
| 1-Person Household | 469 | 22.2% |
| 2-Person Household | 887 | 41.9% |
| 3-Person Household | 395 | 18.7% |
| 4+ Person Household | 364 | 17.2% |
| Total Housing Units | 2,115 | 100.0% |
Occupancy by Ownership by Household Size in Boulder Creek
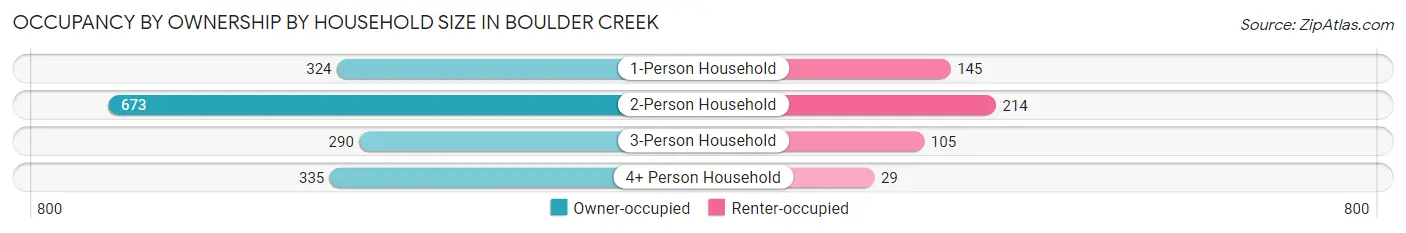
| Household Size | Owner-occupied | Renter-occupied |
| 1-Person Household | 324 (69.1%) | 145 (30.9%) |
| 2-Person Household | 673 (75.9%) | 214 (24.1%) |
| 3-Person Household | 290 (73.4%) | 105 (26.6%) |
| 4+ Person Household | 335 (92.0%) | 29 (8.0%) |
| Total Housing Units | 1,622 (76.7%) | 493 (23.3%) |
Occupancy by Educational Attainment in Boulder Creek
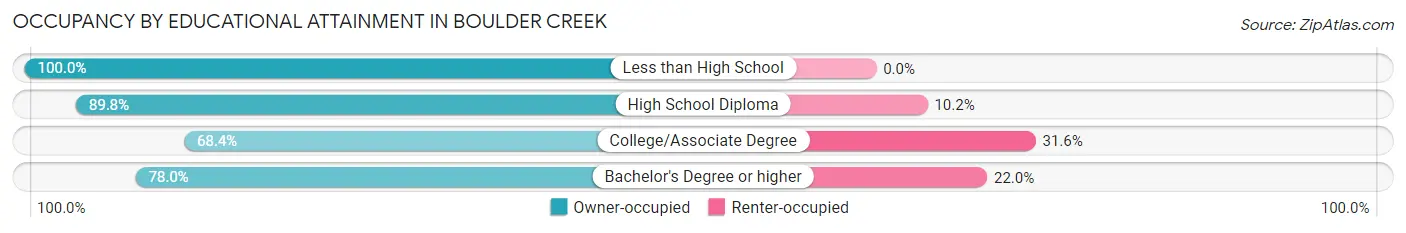
| Household Size | Owner-occupied | Renter-occupied |
| Less than High School | 16 (100.0%) | 0 (0.0%) |
| High School Diploma | 380 (89.8%) | 43 (10.2%) |
| College/Associate Degree | 580 (68.4%) | 268 (31.6%) |
| Bachelor's Degree or higher | 646 (78.0%) | 182 (22.0%) |
Occupancy by Age of Householder in Boulder Creek
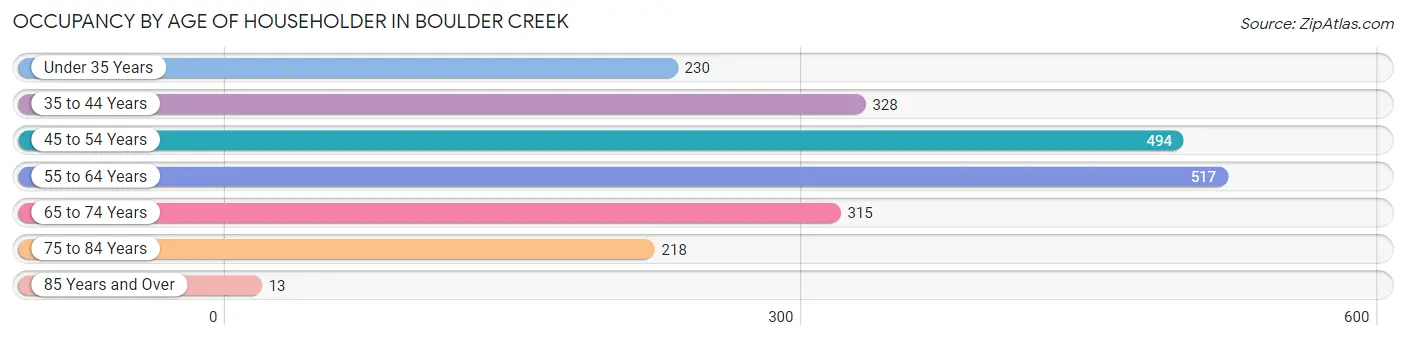
| Age Bracket | # Households | % Households |
| Under 35 Years | 230 | 10.9% |
| 35 to 44 Years | 328 | 15.5% |
| 45 to 54 Years | 494 | 23.4% |
| 55 to 64 Years | 517 | 24.4% |
| 65 to 74 Years | 315 | 14.9% |
| 75 to 84 Years | 218 | 10.3% |
| 85 Years and Over | 13 | 0.6% |
| Total | 2,115 | 100.0% |
Housing Finances in Boulder Creek
Median Income by Occupancy in Boulder Creek
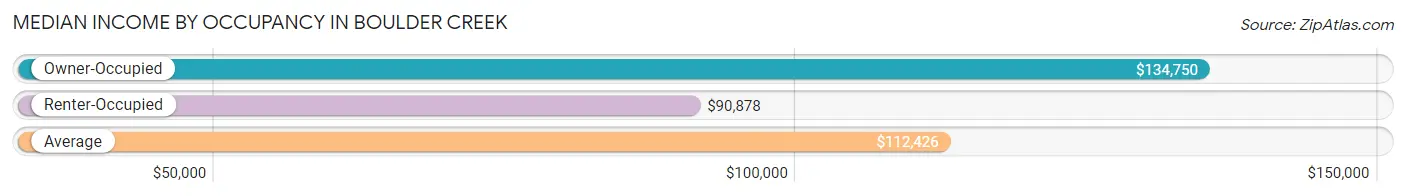
| Occupancy Type | # Households | Median Income |
| Owner-Occupied | 1,622 (76.7%) | $134,750 |
| Renter-Occupied | 493 (23.3%) | $90,878 |
| Average | 2,115 (100.0%) | $112,426 |
Occupancy by Householder Income Bracket in Boulder Creek
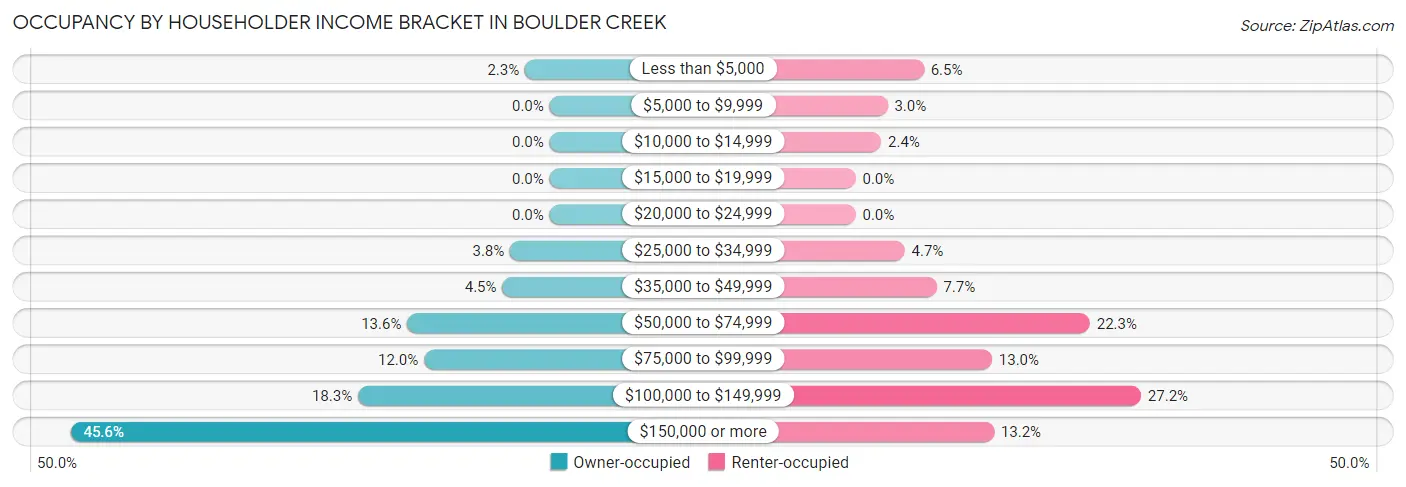
| Income Bracket | Owner-occupied | Renter-occupied |
| Less than $5,000 | 38 (2.3%) | 32 (6.5%) |
| $5,000 to $9,999 | 0 (0.0%) | 15 (3.0%) |
| $10,000 to $14,999 | 0 (0.0%) | 12 (2.4%) |
| $15,000 to $19,999 | 0 (0.0%) | 0 (0.0%) |
| $20,000 to $24,999 | 0 (0.0%) | 0 (0.0%) |
| $25,000 to $34,999 | 61 (3.8%) | 23 (4.7%) |
| $35,000 to $49,999 | 73 (4.5%) | 38 (7.7%) |
| $50,000 to $74,999 | 220 (13.6%) | 110 (22.3%) |
| $75,000 to $99,999 | 194 (12.0%) | 64 (13.0%) |
| $100,000 to $149,999 | 296 (18.2%) | 134 (27.2%) |
| $150,000 or more | 740 (45.6%) | 65 (13.2%) |
| Total | 1,622 (100.0%) | 493 (100.0%) |
Monthly Housing Cost Tiers in Boulder Creek
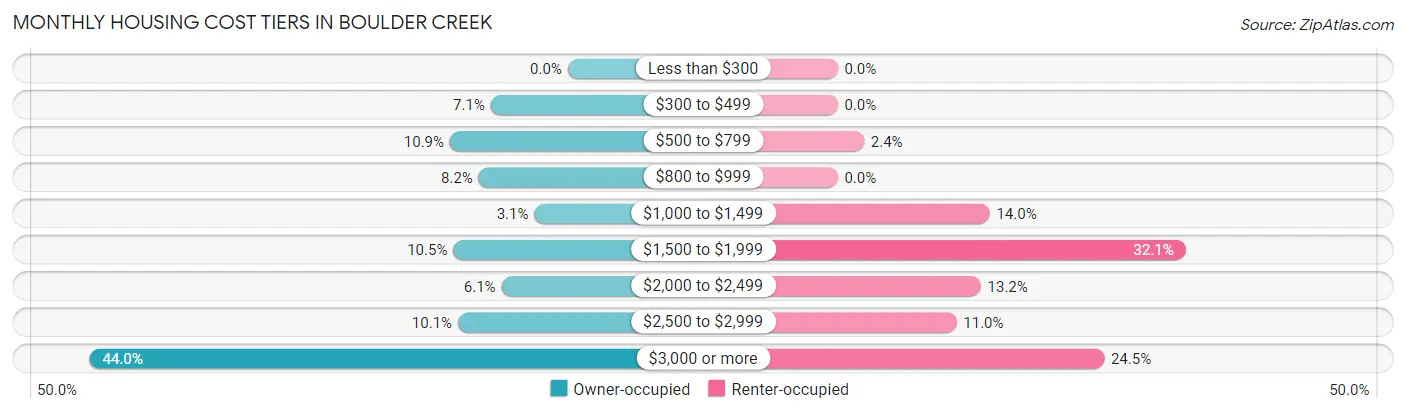
| Monthly Cost | Owner-occupied | Renter-occupied |
| Less than $300 | 0 (0.0%) | 0 (0.0%) |
| $300 to $499 | 115 (7.1%) | 0 (0.0%) |
| $500 to $799 | 176 (10.8%) | 12 (2.4%) |
| $800 to $999 | 133 (8.2%) | 0 (0.0%) |
| $1,000 to $1,499 | 50 (3.1%) | 69 (14.0%) |
| $1,500 to $1,999 | 171 (10.5%) | 158 (32.1%) |
| $2,000 to $2,499 | 99 (6.1%) | 65 (13.2%) |
| $2,500 to $2,999 | 164 (10.1%) | 54 (11.0%) |
| $3,000 or more | 714 (44.0%) | 121 (24.5%) |
| Total | 1,622 (100.0%) | 493 (100.0%) |
Physical Housing Characteristics in Boulder Creek
Housing Structures in Boulder Creek
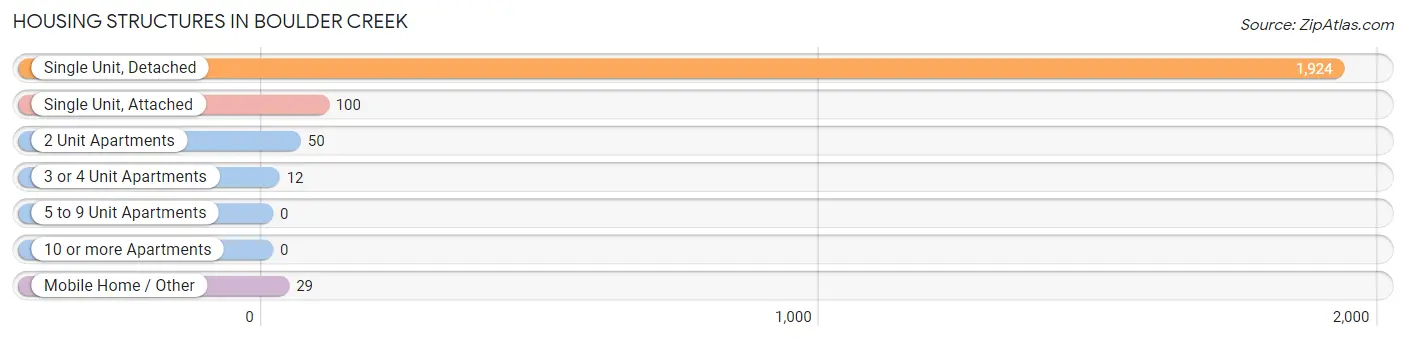
| Structure Type | # Housing Units | % Housing Units |
| Single Unit, Detached | 1,924 | 91.0% |
| Single Unit, Attached | 100 | 4.7% |
| 2 Unit Apartments | 50 | 2.4% |
| 3 or 4 Unit Apartments | 12 | 0.6% |
| 5 to 9 Unit Apartments | 0 | 0.0% |
| 10 or more Apartments | 0 | 0.0% |
| Mobile Home / Other | 29 | 1.4% |
| Total | 2,115 | 100.0% |
Housing Structures by Occupancy in Boulder Creek
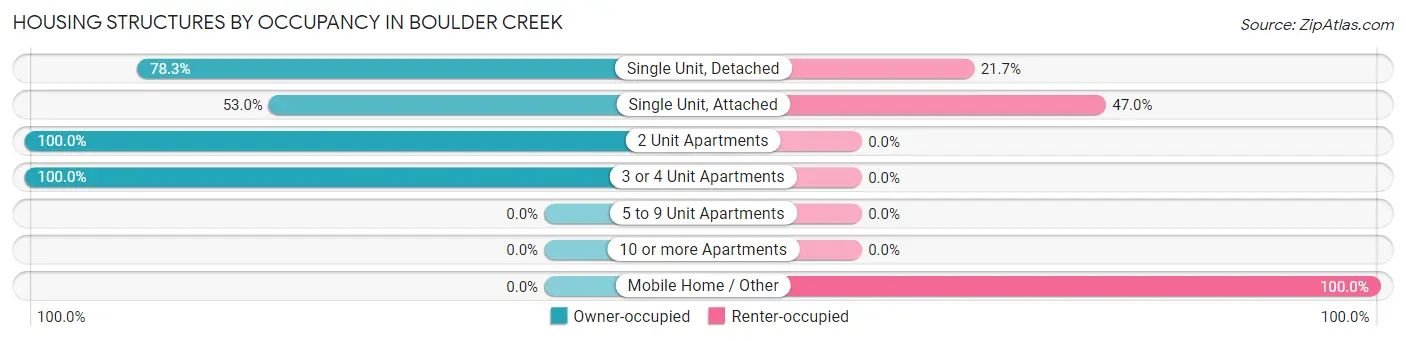
| Structure Type | Owner-occupied | Renter-occupied |
| Single Unit, Detached | 1,507 (78.3%) | 417 (21.7%) |
| Single Unit, Attached | 53 (53.0%) | 47 (47.0%) |
| 2 Unit Apartments | 50 (100.0%) | 0 (0.0%) |
| 3 or 4 Unit Apartments | 12 (100.0%) | 0 (0.0%) |
| 5 to 9 Unit Apartments | 0 (0.0%) | 0 (0.0%) |
| 10 or more Apartments | 0 (0.0%) | 0 (0.0%) |
| Mobile Home / Other | 0 (0.0%) | 29 (100.0%) |
| Total | 1,622 (76.7%) | 493 (23.3%) |
Housing Structures by Number of Rooms in Boulder Creek
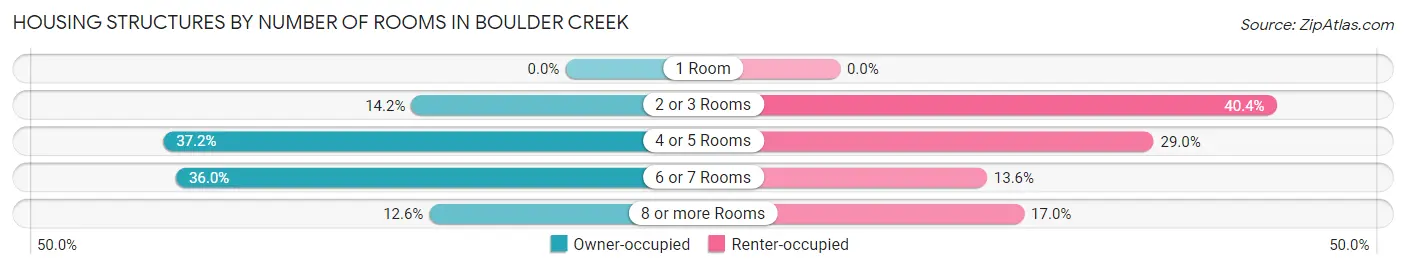
| Number of Rooms | Owner-occupied | Renter-occupied |
| 1 Room | 0 (0.0%) | 0 (0.0%) |
| 2 or 3 Rooms | 231 (14.2%) | 199 (40.4%) |
| 4 or 5 Rooms | 603 (37.2%) | 143 (29.0%) |
| 6 or 7 Rooms | 584 (36.0%) | 67 (13.6%) |
| 8 or more Rooms | 204 (12.6%) | 84 (17.0%) |
| Total | 1,622 (100.0%) | 493 (100.0%) |
Housing Structure by Heating Type in Boulder Creek
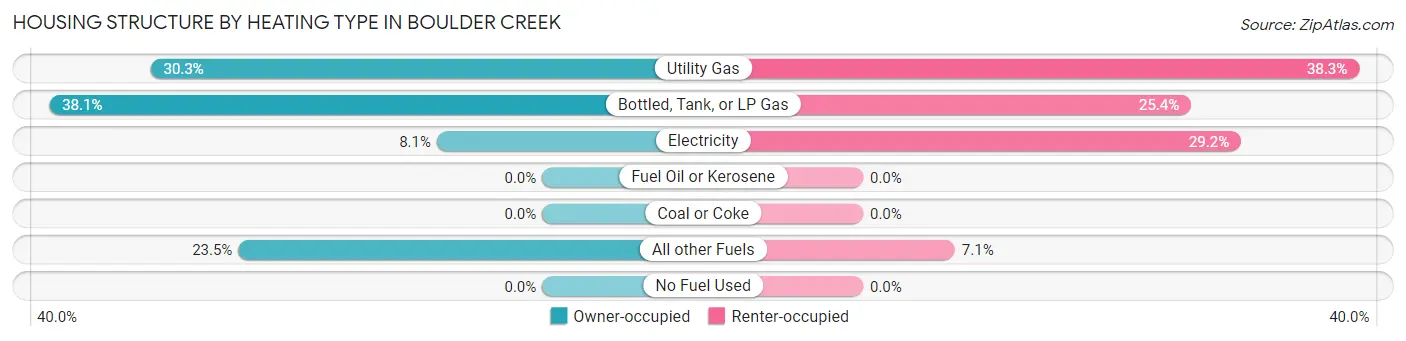
| Heating Type | Owner-occupied | Renter-occupied |
| Utility Gas | 491 (30.3%) | 189 (38.3%) |
| Bottled, Tank, or LP Gas | 618 (38.1%) | 125 (25.4%) |
| Electricity | 132 (8.1%) | 144 (29.2%) |
| Fuel Oil or Kerosene | 0 (0.0%) | 0 (0.0%) |
| Coal or Coke | 0 (0.0%) | 0 (0.0%) |
| All other Fuels | 381 (23.5%) | 35 (7.1%) |
| No Fuel Used | 0 (0.0%) | 0 (0.0%) |
| Total | 1,622 (100.0%) | 493 (100.0%) |
Household Vehicle Usage in Boulder Creek
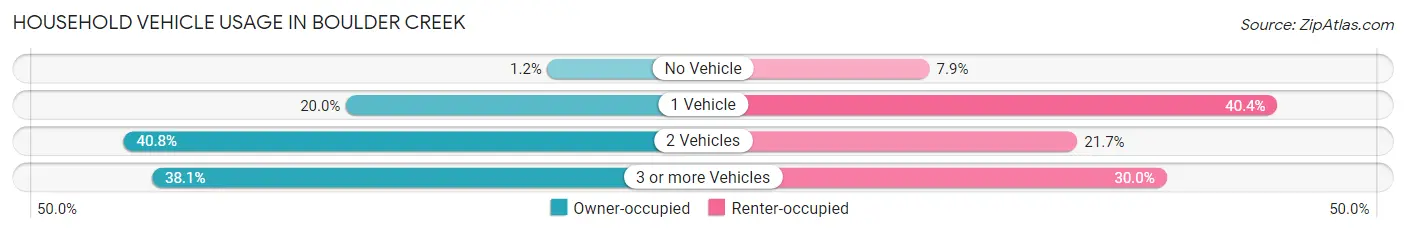
| Vehicles per Household | Owner-occupied | Renter-occupied |
| No Vehicle | 19 (1.2%) | 39 (7.9%) |
| 1 Vehicle | 324 (20.0%) | 199 (40.4%) |
| 2 Vehicles | 661 (40.7%) | 107 (21.7%) |
| 3 or more Vehicles | 618 (38.1%) | 148 (30.0%) |
| Total | 1,622 (100.0%) | 493 (100.0%) |
Real Estate & Mortgages in Boulder Creek
Real Estate and Mortgage Overview in Boulder Creek
| Characteristic | Without Mortgage | With Mortgage |
| Housing Units | 478 | 1,144 |
| Median Property Value | $746,900 | $721,500 |
| Median Household Income | $74,355 | $657 |
| Monthly Housing Costs | $610 | $700 |
| Real Estate Taxes | $2,441 | $0 |
Property Value by Mortgage Status in Boulder Creek
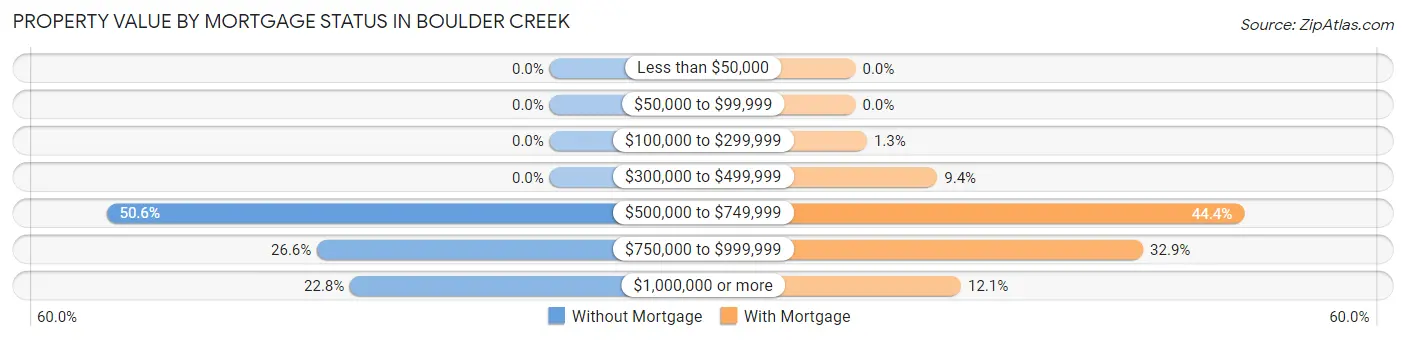
| Property Value | Without Mortgage | With Mortgage |
| Less than $50,000 | 0 (0.0%) | 0 (0.0%) |
| $50,000 to $99,999 | 0 (0.0%) | 0 (0.0%) |
| $100,000 to $299,999 | 0 (0.0%) | 15 (1.3%) |
| $300,000 to $499,999 | 0 (0.0%) | 107 (9.3%) |
| $500,000 to $749,999 | 242 (50.6%) | 508 (44.4%) |
| $750,000 to $999,999 | 127 (26.6%) | 376 (32.9%) |
| $1,000,000 or more | 109 (22.8%) | 138 (12.1%) |
| Total | 478 (100.0%) | 1,144 (100.0%) |
Household Income by Mortgage Status in Boulder Creek
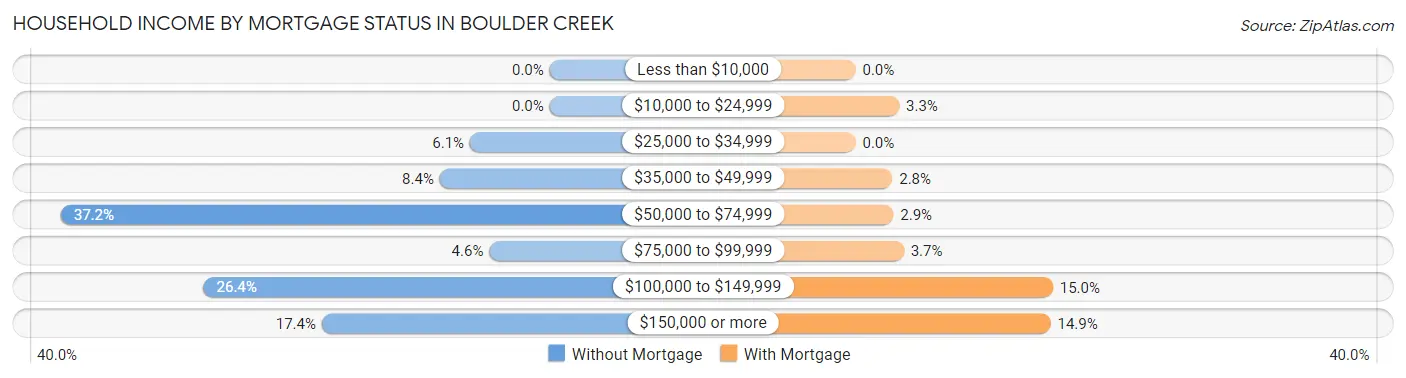
| Household Income | Without Mortgage | With Mortgage |
| Less than $10,000 | 0 (0.0%) | 0 (0.0%) |
| $10,000 to $24,999 | 0 (0.0%) | 38 (3.3%) |
| $25,000 to $34,999 | 29 (6.1%) | 0 (0.0%) |
| $35,000 to $49,999 | 40 (8.4%) | 32 (2.8%) |
| $50,000 to $74,999 | 178 (37.2%) | 33 (2.9%) |
| $75,000 to $99,999 | 22 (4.6%) | 42 (3.7%) |
| $100,000 to $149,999 | 126 (26.4%) | 172 (15.0%) |
| $150,000 or more | 83 (17.4%) | 170 (14.9%) |
| Total | 478 (100.0%) | 1,144 (100.0%) |
Property Value to Household Income Ratio in Boulder Creek
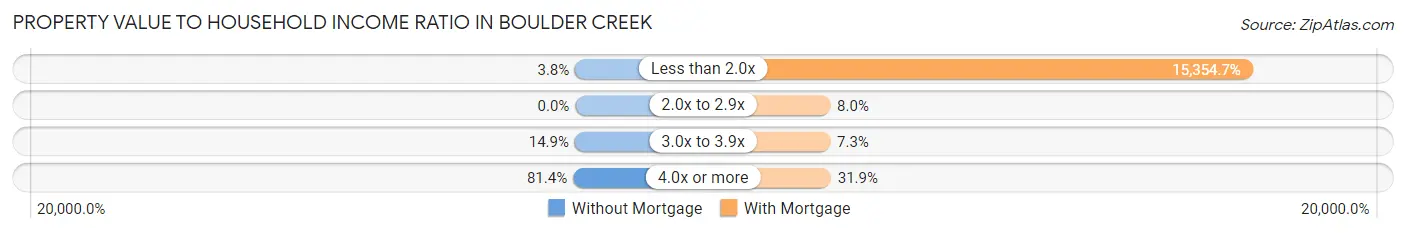
| Value-to-Income Ratio | Without Mortgage | With Mortgage |
| Less than 2.0x | 18 (3.8%) | 175,658 (15,354.7%) |
| 2.0x to 2.9x | 0 (0.0%) | 92 (8.0%) |
| 3.0x to 3.9x | 71 (14.8%) | 84 (7.3%) |
| 4.0x or more | 389 (81.4%) | 365 (31.9%) |
| Total | 478 (100.0%) | 1,144 (100.0%) |
Real Estate Taxes by Mortgage Status in Boulder Creek
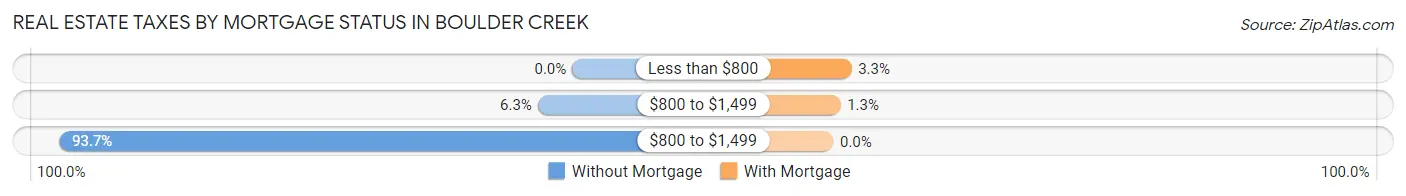
| Property Taxes | Without Mortgage | With Mortgage |
| Less than $800 | 0 (0.0%) | 38 (3.3%) |
| $800 to $1,499 | 30 (6.3%) | 15 (1.3%) |
| $800 to $1,499 | 448 (93.7%) | 0 (0.0%) |
| Total | 478 (100.0%) | 1,144 (100.0%) |
Health & Disability in Boulder Creek
Health Insurance Coverage by Age in Boulder Creek
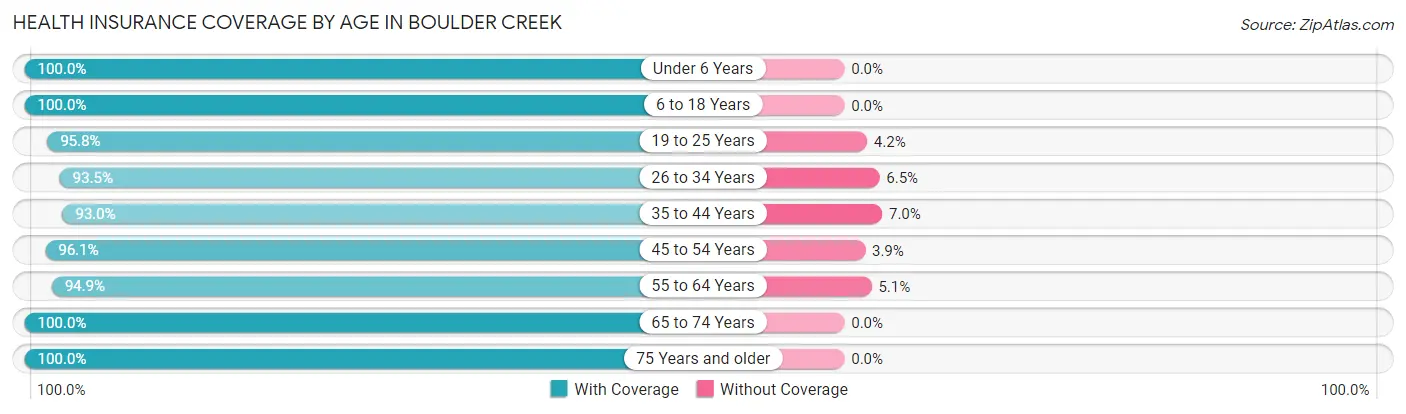
| Age Bracket | With Coverage | Without Coverage |
| Under 6 Years | 139 (100.0%) | 0 (0.0%) |
| 6 to 18 Years | 783 (100.0%) | 0 (0.0%) |
| 19 to 25 Years | 386 (95.8%) | 17 (4.2%) |
| 26 to 34 Years | 529 (93.5%) | 37 (6.5%) |
| 35 to 44 Years | 713 (93.0%) | 54 (7.0%) |
| 45 to 54 Years | 993 (96.1%) | 40 (3.9%) |
| 55 to 64 Years | 713 (94.9%) | 38 (5.1%) |
| 65 to 74 Years | 689 (100.0%) | 0 (0.0%) |
| 75 Years and older | 361 (100.0%) | 0 (0.0%) |
| Total | 5,306 (96.6%) | 186 (3.4%) |
Health Insurance Coverage by Citizenship Status in Boulder Creek
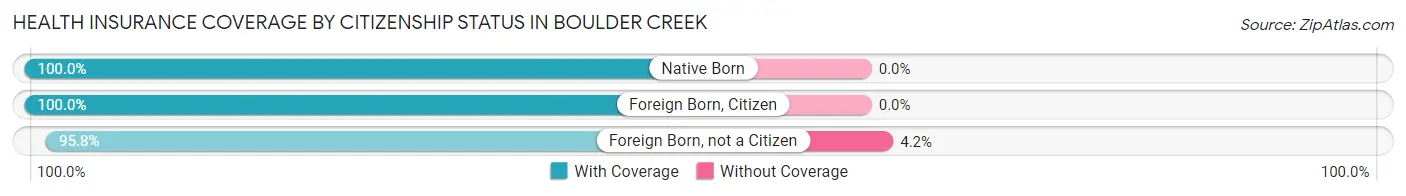
| Citizenship Status | With Coverage | Without Coverage |
| Native Born | 139 (100.0%) | 0 (0.0%) |
| Foreign Born, Citizen | 783 (100.0%) | 0 (0.0%) |
| Foreign Born, not a Citizen | 386 (95.8%) | 17 (4.2%) |
Health Insurance Coverage by Household Income in Boulder Creek
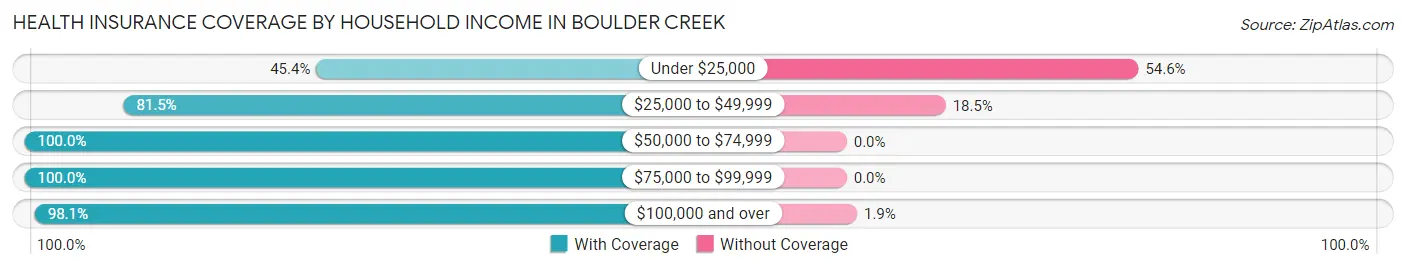
| Household Income | With Coverage | Without Coverage |
| Under $25,000 | 44 (45.4%) | 53 (54.6%) |
| $25,000 to $49,999 | 255 (81.5%) | 58 (18.5%) |
| $50,000 to $74,999 | 635 (100.0%) | 0 (0.0%) |
| $75,000 to $99,999 | 535 (100.0%) | 0 (0.0%) |
| $100,000 and over | 3,832 (98.1%) | 75 (1.9%) |
Public vs Private Health Insurance Coverage by Age in Boulder Creek
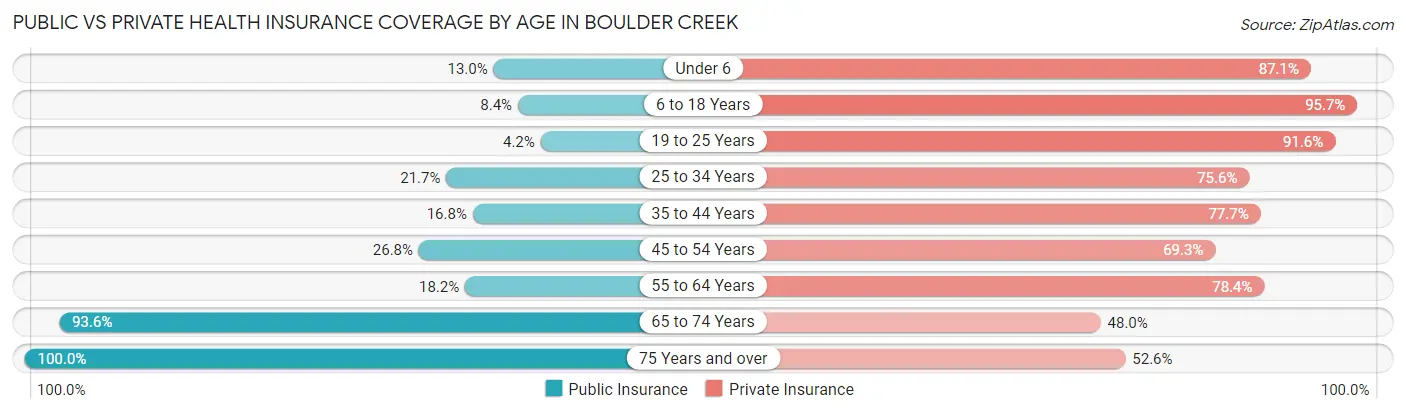
| Age Bracket | Public Insurance | Private Insurance |
| Under 6 | 18 (13.0%) | 121 (87.1%) |
| 6 to 18 Years | 66 (8.4%) | 749 (95.7%) |
| 19 to 25 Years | 17 (4.2%) | 369 (91.6%) |
| 25 to 34 Years | 123 (21.7%) | 428 (75.6%) |
| 35 to 44 Years | 129 (16.8%) | 596 (77.7%) |
| 45 to 54 Years | 277 (26.8%) | 716 (69.3%) |
| 55 to 64 Years | 137 (18.2%) | 589 (78.4%) |
| 65 to 74 Years | 645 (93.6%) | 331 (48.0%) |
| 75 Years and over | 361 (100.0%) | 190 (52.6%) |
| Total | 1,773 (32.3%) | 4,089 (74.5%) |
Disability Status by Sex by Age in Boulder Creek
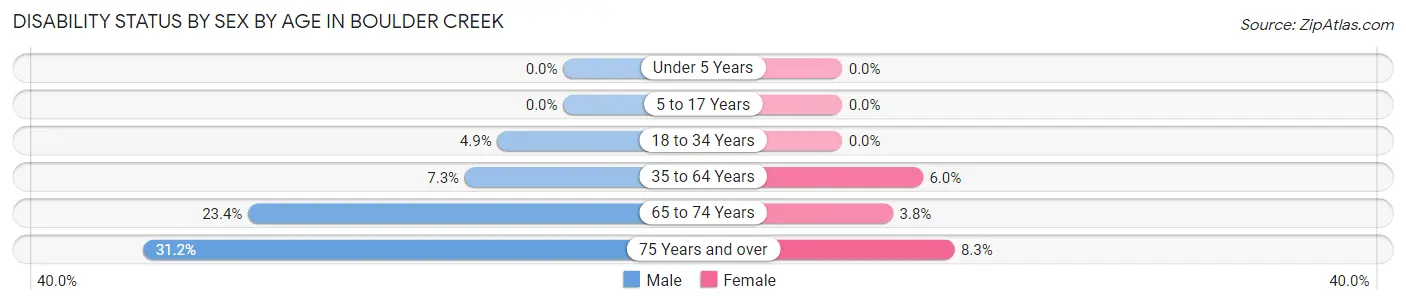
| Age Bracket | Male | Female |
| Under 5 Years | 0 (0.0%) | 0 (0.0%) |
| 5 to 17 Years | 0 (0.0%) | 0 (0.0%) |
| 18 to 34 Years | 29 (4.9%) | 0 (0.0%) |
| 35 to 64 Years | 95 (7.3%) | 75 (6.0%) |
| 65 to 74 Years | 62 (23.4%) | 16 (3.8%) |
| 75 Years and over | 79 (31.2%) | 9 (8.3%) |
Disability Class by Sex by Age in Boulder Creek
Disability Class: Hearing Difficulty
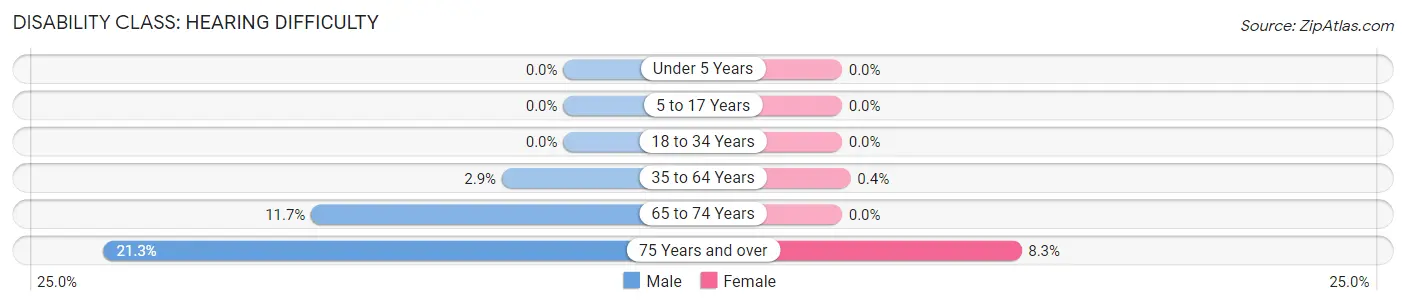
| Age Bracket | Male | Female |
| Under 5 Years | 0 (0.0%) | 0 (0.0%) |
| 5 to 17 Years | 0 (0.0%) | 0 (0.0%) |
| 18 to 34 Years | 0 (0.0%) | 0 (0.0%) |
| 35 to 64 Years | 37 (2.9%) | 5 (0.4%) |
| 65 to 74 Years | 31 (11.7%) | 0 (0.0%) |
| 75 Years and over | 54 (21.3%) | 9 (8.3%) |
Disability Class: Vision Difficulty
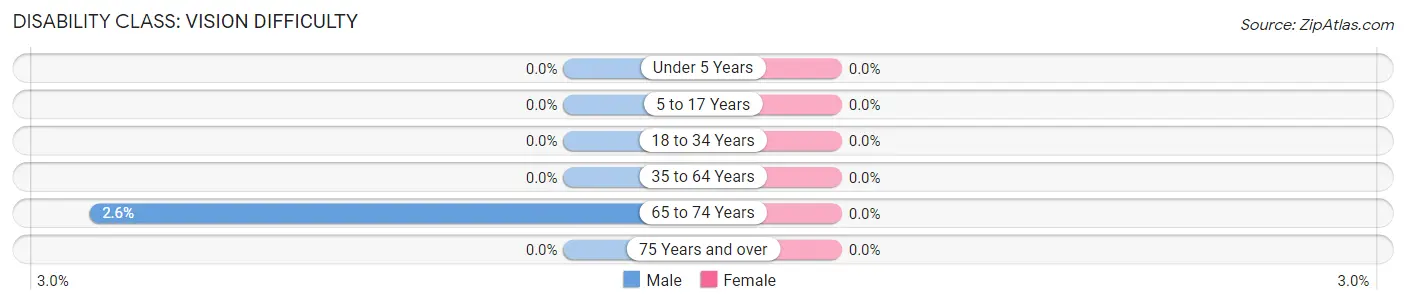
| Age Bracket | Male | Female |
| Under 5 Years | 0 (0.0%) | 0 (0.0%) |
| 5 to 17 Years | 0 (0.0%) | 0 (0.0%) |
| 18 to 34 Years | 0 (0.0%) | 0 (0.0%) |
| 35 to 64 Years | 0 (0.0%) | 0 (0.0%) |
| 65 to 74 Years | 7 (2.6%) | 0 (0.0%) |
| 75 Years and over | 0 (0.0%) | 0 (0.0%) |
Disability Class: Cognitive Difficulty
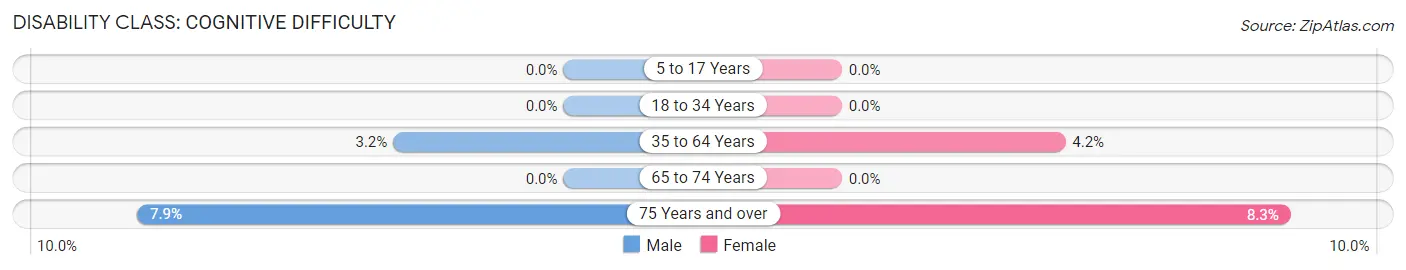
| Age Bracket | Male | Female |
| 5 to 17 Years | 0 (0.0%) | 0 (0.0%) |
| 18 to 34 Years | 0 (0.0%) | 0 (0.0%) |
| 35 to 64 Years | 41 (3.2%) | 52 (4.2%) |
| 65 to 74 Years | 0 (0.0%) | 0 (0.0%) |
| 75 Years and over | 20 (7.9%) | 9 (8.3%) |
Disability Class: Ambulatory Difficulty
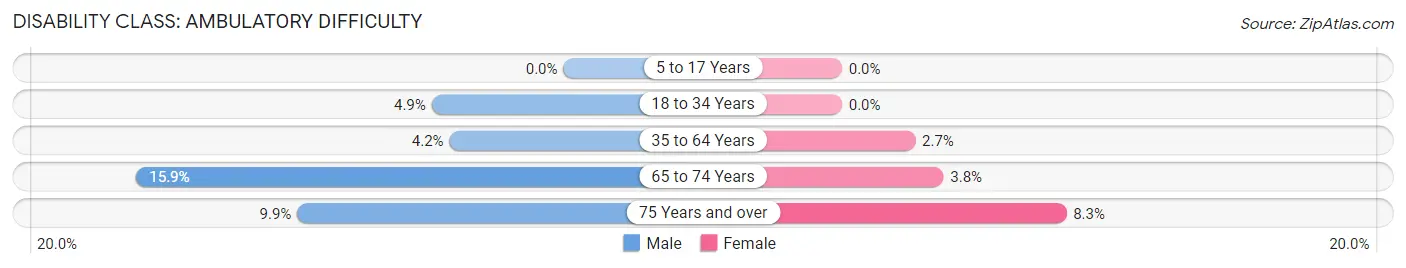
| Age Bracket | Male | Female |
| 5 to 17 Years | 0 (0.0%) | 0 (0.0%) |
| 18 to 34 Years | 29 (4.9%) | 0 (0.0%) |
| 35 to 64 Years | 55 (4.2%) | 34 (2.7%) |
| 65 to 74 Years | 42 (15.9%) | 16 (3.8%) |
| 75 Years and over | 25 (9.9%) | 9 (8.3%) |
Disability Class: Self-Care Difficulty
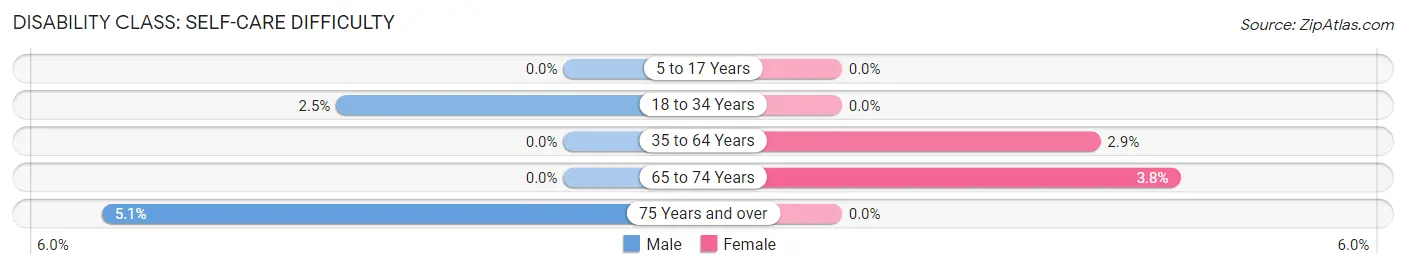
| Age Bracket | Male | Female |
| 5 to 17 Years | 0 (0.0%) | 0 (0.0%) |
| 18 to 34 Years | 15 (2.5%) | 0 (0.0%) |
| 35 to 64 Years | 0 (0.0%) | 36 (2.9%) |
| 65 to 74 Years | 0 (0.0%) | 16 (3.8%) |
| 75 Years and over | 13 (5.1%) | 0 (0.0%) |
Technology Access in Boulder Creek
Computing Device Access in Boulder Creek
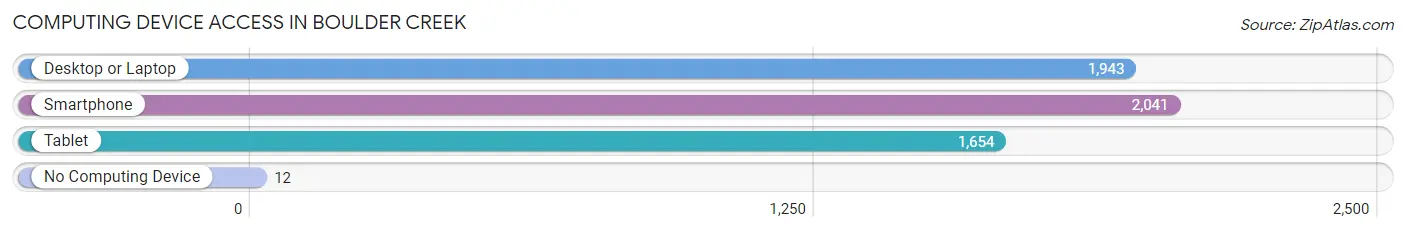
| Device Type | # Households | % Households |
| Desktop or Laptop | 1,943 | 91.9% |
| Smartphone | 2,041 | 96.5% |
| Tablet | 1,654 | 78.2% |
| No Computing Device | 12 | 0.6% |
| Total | 2,115 | 100.0% |
Internet Access in Boulder Creek
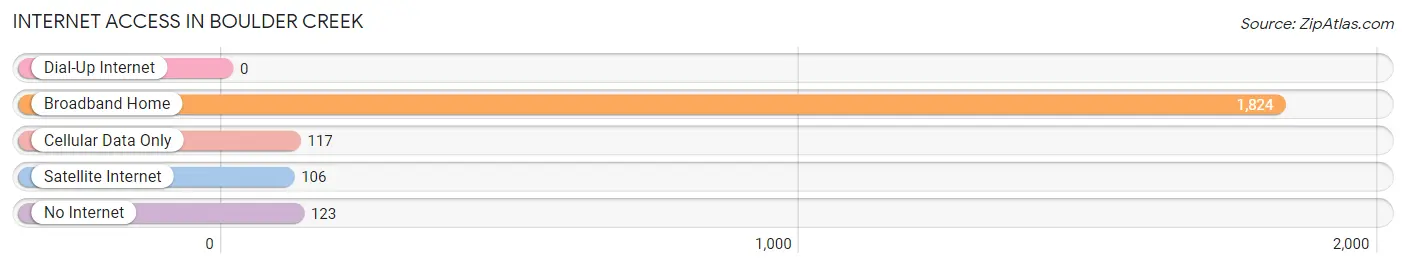
| Internet Type | # Households | % Households |
| Dial-Up Internet | 0 | 0.0% |
| Broadband Home | 1,824 | 86.2% |
| Cellular Data Only | 117 | 5.5% |
| Satellite Internet | 106 | 5.0% |
| No Internet | 123 | 5.8% |
| Total | 2,115 | 100.0% |
Boulder Creek Summary
Boulder Creek is a census-designated place (CDP) located in Santa Cruz County, California, United States. The population was 3,402 at the 2010 census. It is located in the San Lorenzo Valley, about 30 miles (48 km) south of San Jose and 6 miles (10 km) east of the Pacific Ocean.
History
The area now known as Boulder Creek was originally inhabited by the Ohlone people, who lived in the area for thousands of years before the arrival of Europeans. The first Europeans to settle in the area were Spanish missionaries, who established a mission in the area in 1791. The area was later settled by American pioneers in the mid-19th century, and the town of Boulder Creek was officially founded in 1875.
The town was named after the nearby Boulder Creek, which was named for the large boulders that were found in the creek bed. The town quickly grew in size and importance, and by the early 20th century it was a popular tourist destination. The town was also home to several lumber mills, which provided employment for many of the town's residents.
Geography
Boulder Creek is located in the San Lorenzo Valley, about 30 miles (48 km) south of San Jose and 6 miles (10 km) east of the Pacific Ocean. The town is situated at an elevation of 1,100 feet (335 m) above sea level. The town is surrounded by the Santa Cruz Mountains, which provide a scenic backdrop.
The town is located along State Route 9, which runs through the center of town. The town is also served by the Santa Cruz County Regional Transportation Commission, which provides bus service to the town.
Economy
The economy of Boulder Creek is largely based on tourism and the service industry. The town is home to several restaurants, cafes, and shops, as well as a number of bed and breakfasts. The town is also home to several wineries, which attract visitors from all over the world.
The town is also home to several technology companies, including the software company Adobe Systems, which has a large campus in the town. The town is also home to several small businesses, including a number of art galleries and antique stores.
Demographics
As of the 2010 census, there were 3,402 people, 1,521 households, and 890 families residing in the CDP. The population density was 1,845.3 people per square mile (715.2/km2). There were 1,717 housing units at an average density of 937.2 per square mile (362.3/km2). The racial makeup of the CDP was 87.2% White, 0.7% African American, 0.7% Native American, 4.2% Asian, 0.1% Pacific Islander, 4.2% from other races, and 3.0% from two or more races. Hispanic or Latino of any race were 11.2% of the population.
There were 1,521 households, out of which 24.2% had children under the age of 18 living with them, 44.2% were married couples living together, 10.3% had a female householder with no husband present, and 40.7% were non-families. 33.2% of all households were made up of individuals, and 11.2% had someone living alone who was 65 years of age or older. The average household size was 2.23 and the average family size was 2.86.
In the CDP, the population was spread out, with 20.7% under the age of 18, 6.7% from 18 to 24, 25.2% from 25 to 44, 30.2% from 45 to 64, and 17.2% who were 65 years of age or older. The median age was 43 years. For every 100 females, there were 94.2 males. For every 100 females age 18 and over, there were 91.3 males.
The median income for a household in the CDP was $50,938, and the median income for a family was $62,813. Males had a median income of $45,938 versus $35,000 for females. The per capita income for the CDP was $27,945. About 5.2% of families and 8.2% of the population were below the poverty line, including 10.2% of those under age 18 and 4.2% of those age 65 or over.
Common Questions
What is Per Capita Income in Boulder Creek?
Per Capita income in Boulder Creek is $55,778.
What is the Median Family Income in Boulder Creek?
Median Family Income in Boulder Creek is $134,125.
What is the Median Household income in Boulder Creek?
Median Household Income in Boulder Creek is $112,426.
What is Income or Wage Gap in Boulder Creek?
Income or Wage Gap in Boulder Creek is 58.0%.
Women in Boulder Creek earn 42.0 cents for every dollar earned by a man.
What is Inequality or Gini Index in Boulder Creek?
Inequality or Gini Index in Boulder Creek is 0.39.
What is the Total Population of Boulder Creek?
Total Population of Boulder Creek is 5,492.
What is the Total Male Population of Boulder Creek?
Total Male Population of Boulder Creek is 2,897.
What is the Total Female Population of Boulder Creek?
Total Female Population of Boulder Creek is 2,595.
What is the Ratio of Males per 100 Females in Boulder Creek?
There are 111.64 Males per 100 Females in Boulder Creek.
What is the Ratio of Females per 100 Males in Boulder Creek?
There are 89.58 Females per 100 Males in Boulder Creek.
What is the Median Population Age in Boulder Creek?
Median Population Age in Boulder Creek is 45.6 Years.
What is the Average Family Size in Boulder Creek
Average Family Size in Boulder Creek is 3.0 People.
What is the Average Household Size in Boulder Creek
Average Household Size in Boulder Creek is 2.6 People.
How Large is the Labor Force in Boulder Creek?
There are 3,097 People in the Labor Forcein in Boulder Creek.
What is the Percentage of People in the Labor Force in Boulder Creek?
63.8% of People are in the Labor Force in Boulder Creek.
What is the Unemployment Rate in Boulder Creek?
Unemployment Rate in Boulder Creek is 10.0%.