Zip Codes with the Highest Percentage of Population Employed in Architecture & Engineering in San Jose, CA
RELATED REPORTS & OPTIONS
Architecture & Engineering
San Jose
Compare Zip Codes
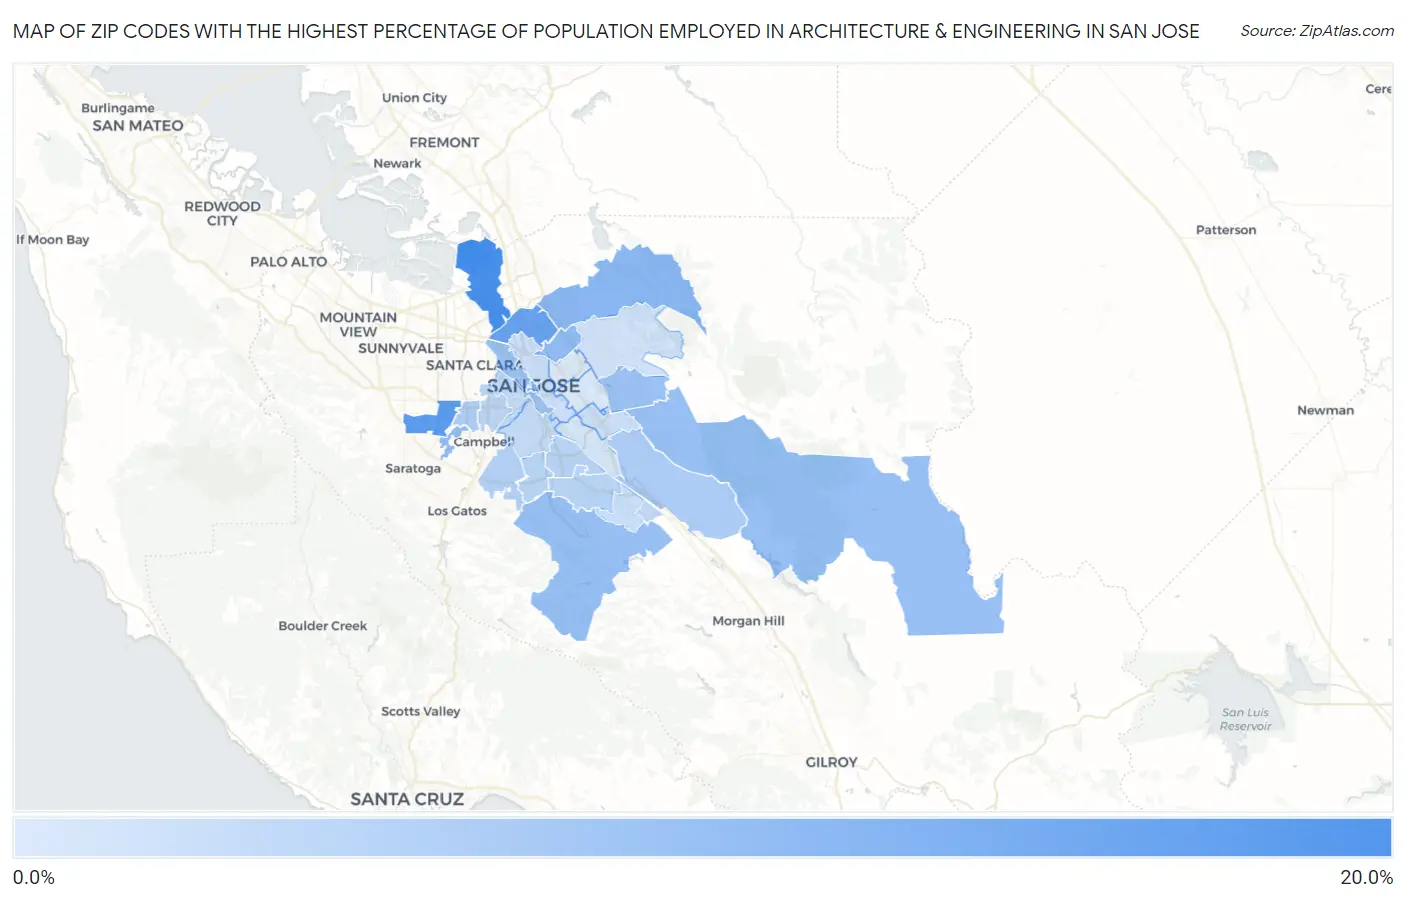
Map of Zip Codes with the Highest Percentage of Population Employed in Architecture & Engineering in San Jose
3.0%
16.5%
Zip Codes with the Highest Percentage of Population Employed in Architecture & Engineering in San Jose, CA
| Zip Code | % Employed | vs State | vs National | |
| 1. | 95134 | 16.5% | 2.6%(+14.0)#10 | 2.1%(+14.4)#130 |
| 2. | 95129 | 14.3% | 2.6%(+11.8)#13 | 2.1%(+12.2)#162 |
| 3. | 95131 | 13.5% | 2.6%(+10.9)#15 | 2.1%(+11.4)#184 |
| 4. | 95113 | 10.9% | 2.6%(+8.32)#24 | 2.1%(+8.72)#291 |
| 5. | 95132 | 10.3% | 2.6%(+7.79)#27 | 2.1%(+8.19)#322 |
| 6. | 95133 | 9.6% | 2.6%(+7.04)#32 | 2.1%(+7.45)#370 |
| 7. | 95130 | 9.5% | 2.6%(+6.93)#33 | 2.1%(+7.34)#376 |
| 8. | 95135 | 9.0% | 2.6%(+6.46)#38 | 2.1%(+6.86)#417 |
| 9. | 95120 | 9.0% | 2.6%(+6.45)#39 | 2.1%(+6.86)#419 |
| 10. | 95148 | 8.8% | 2.6%(+6.23)#43 | 2.1%(+6.63)#446 |
| 11. | 95110 | 8.3% | 2.6%(+5.78)#50 | 2.1%(+6.18)#510 |
| 12. | 95138 | 7.1% | 2.6%(+4.57)#72 | 2.1%(+4.97)#721 |
| 13. | 95117 | 6.7% | 2.6%(+4.15)#82 | 2.1%(+4.56)#823 |
| 14. | 95124 | 6.3% | 2.6%(+3.76)#93 | 2.1%(+4.17)#951 |
| 15. | 95118 | 6.0% | 2.6%(+3.44)#107 | 2.1%(+3.84)#1,082 |
| 16. | 95136 | 6.0% | 2.6%(+3.41)#110 | 2.1%(+3.81)#1,102 |
| 17. | 95123 | 5.9% | 2.6%(+3.36)#112 | 2.1%(+3.77)#1,119 |
| 18. | 95128 | 5.7% | 2.6%(+3.17)#120 | 2.1%(+3.57)#1,214 |
| 19. | 95139 | 5.1% | 2.6%(+2.56)#158 | 2.1%(+2.97)#1,584 |
| 20. | 95125 | 4.9% | 2.6%(+2.35)#168 | 2.1%(+2.75)#1,733 |
| 21. | 95126 | 4.9% | 2.6%(+2.35)#170 | 2.1%(+2.75)#1,740 |
| 22. | 95119 | 4.7% | 2.6%(+2.16)#181 | 2.1%(+2.56)#1,916 |
| 23. | 95112 | 4.5% | 2.6%(+1.94)#198 | 2.1%(+2.34)#2,135 |
| 24. | 95121 | 4.4% | 2.6%(+1.80)#207 | 2.1%(+2.20)#2,317 |
| 25. | 95127 | 3.9% | 2.6%(+1.32)#252 | 2.1%(+1.73)#2,970 |
| 26. | 95111 | 3.5% | 2.6%(+0.924)#314 | 2.1%(+1.33)#3,788 |
| 27. | 95122 | 3.1% | 2.6%(+0.513)#381 | 2.1%(+0.918)#4,826 |
| 28. | 95116 | 3.0% | 2.6%(+0.428)#396 | 2.1%(+0.833)#5,111 |
1
Common Questions
What are the Top 10 Zip Codes with the Highest Percentage of Population Employed in Architecture & Engineering in San Jose, CA?
Top 10 Zip Codes with the Highest Percentage of Population Employed in Architecture & Engineering in San Jose, CA are:
What zip code has the Highest Percentage of Population Employed in Architecture & Engineering in San Jose, CA?
95134 has the Highest Percentage of Population Employed in Architecture & Engineering in San Jose, CA with 16.5%.
What is the Percentage of Population Employed in Architecture & Engineering in San Jose, CA?
Percentage of Population Employed in Architecture & Engineering in San Jose is 7.0%.
What is the Percentage of Population Employed in Architecture & Engineering in California?
Percentage of Population Employed in Architecture & Engineering in California is 2.6%.
What is the Percentage of Population Employed in Architecture & Engineering in the United States?
Percentage of Population Employed in Architecture & Engineering in the United States is 2.1%.