French Gulch, CA Map & Demographics
French Gulch Map
French Gulch Overview
$23,001
PER CAPITA INCOME
$48,750
AVG FAMILY INCOME
$41,563
AVG HOUSEHOLD INCOME
47.4%
WAGE / INCOME GAP [ % ]
52.6¢/ $1
WAGE / INCOME GAP [ $ ]
0.46
INEQUALITY / GINI INDEX
283
TOTAL POPULATION
157
MALE POPULATION
126
FEMALE POPULATION
124.60
MALES / 100 FEMALES
80.25
FEMALES / 100 MALES
55.2
MEDIAN AGE
2.8
AVG FAMILY SIZE
2.6
AVG HOUSEHOLD SIZE
105
LABOR FORCE [ PEOPLE ]
46.1%
PERCENT IN LABOR FORCE
1.9%
UNEMPLOYMENT RATE
French Gulch Zip Codes
French Gulch Area Codes
Income in French Gulch
Income Overview in French Gulch
Per Capita Income in French Gulch is $23,001, while median incomes of families and households are $48,750 and $41,563 respectively.
| Characteristic | Number | Measure |
| Per Capita Income | 283 | $23,001 |
| Median Family Income | 88 | $48,750 |
| Mean Family Income | 88 | $66,332 |
| Median Household Income | 107 | $41,563 |
| Mean Household Income | 107 | $59,739 |
| Income Deficit | 88 | $0 |
| Wage / Income Gap (%) | 283 | 47.39% |
| Wage / Income Gap ($) | 283 | 52.61¢ per $1 |
| Gini / Inequality Index | 283 | 0.46 |
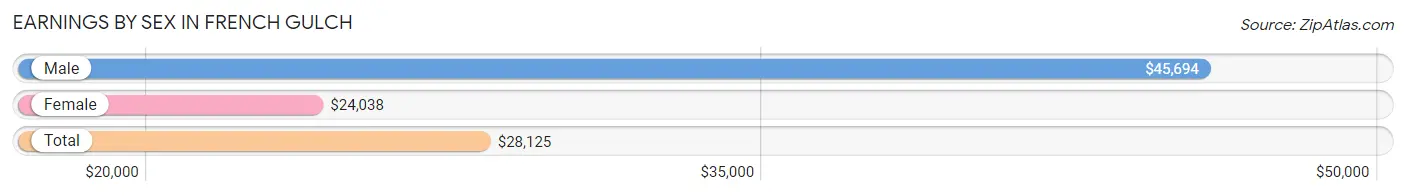
Earnings by Sex in French Gulch
Average Earnings in French Gulch are $28,125, $45,694 for men and $24,038 for women, a difference of 47.4%.
| Sex | Number | Average Earnings |
| Male | 55 (51.4%) | $45,694 |
| Female | 52 (48.6%) | $24,038 |
| Total | 107 (100.0%) | $28,125 |
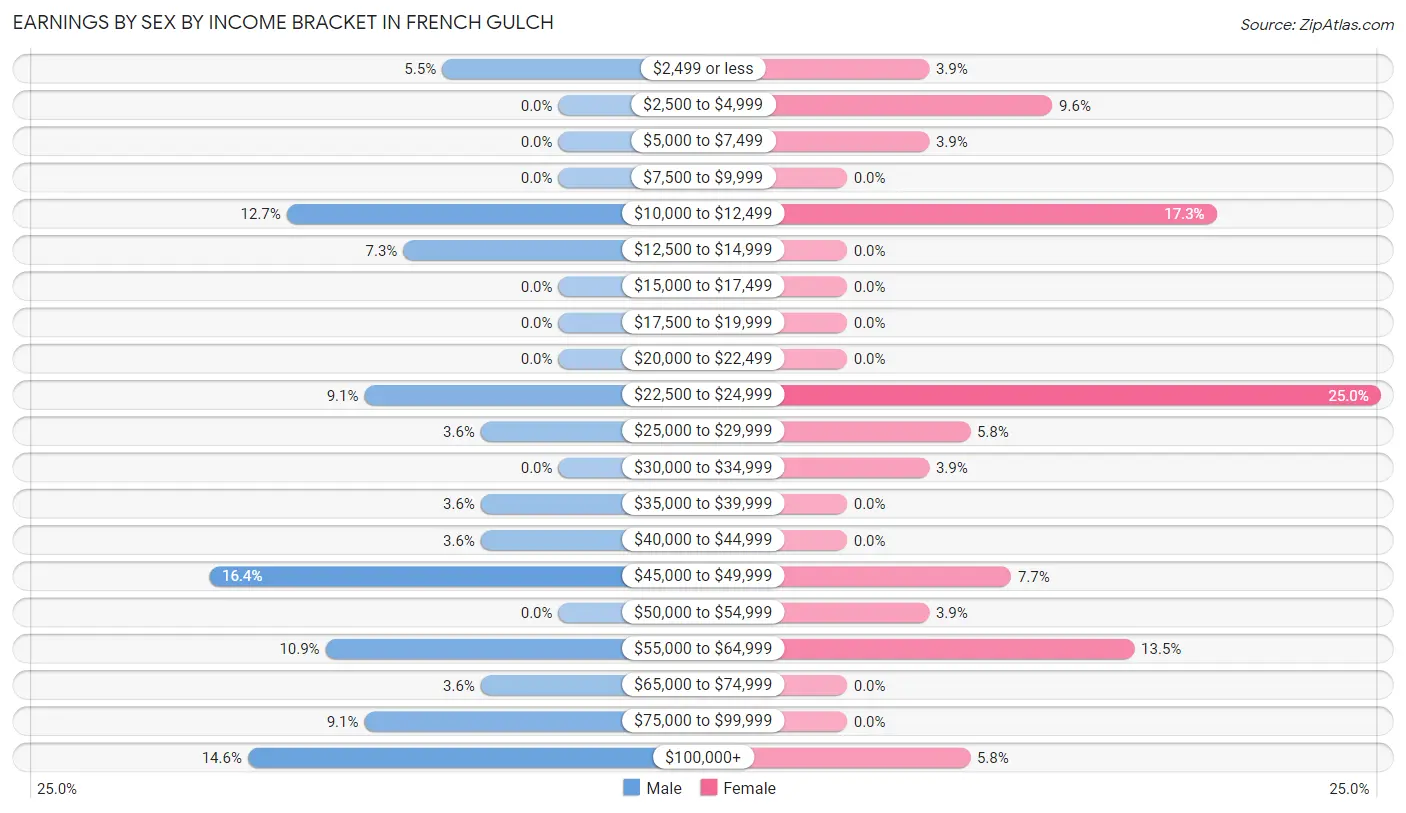
Earnings by Sex by Income Bracket in French Gulch
The most common earnings brackets in French Gulch are $45,000 to $49,999 for men (9 | 16.4%) and $22,500 to $24,999 for women (13 | 25.0%).
| Income | Male | Female |
| $2,499 or less | 3 (5.4%) | 2 (3.8%) |
| $2,500 to $4,999 | 0 (0.0%) | 5 (9.6%) |
| $5,000 to $7,499 | 0 (0.0%) | 2 (3.8%) |
| $7,500 to $9,999 | 0 (0.0%) | 0 (0.0%) |
| $10,000 to $12,499 | 7 (12.7%) | 9 (17.3%) |
| $12,500 to $14,999 | 4 (7.3%) | 0 (0.0%) |
| $15,000 to $17,499 | 0 (0.0%) | 0 (0.0%) |
| $17,500 to $19,999 | 0 (0.0%) | 0 (0.0%) |
| $20,000 to $22,499 | 0 (0.0%) | 0 (0.0%) |
| $22,500 to $24,999 | 5 (9.1%) | 13 (25.0%) |
| $25,000 to $29,999 | 2 (3.6%) | 3 (5.8%) |
| $30,000 to $34,999 | 0 (0.0%) | 2 (3.8%) |
| $35,000 to $39,999 | 2 (3.6%) | 0 (0.0%) |
| $40,000 to $44,999 | 2 (3.6%) | 0 (0.0%) |
| $45,000 to $49,999 | 9 (16.4%) | 4 (7.7%) |
| $50,000 to $54,999 | 0 (0.0%) | 2 (3.8%) |
| $55,000 to $64,999 | 6 (10.9%) | 7 (13.5%) |
| $65,000 to $74,999 | 2 (3.6%) | 0 (0.0%) |
| $75,000 to $99,999 | 5 (9.1%) | 0 (0.0%) |
| $100,000+ | 8 (14.5%) | 3 (5.8%) |
| Total | 55 (100.0%) | 52 (100.0%) |
Earnings by Sex by Educational Attainment in French Gulch
Average earnings in French Gulch are $45,694 for men and $24,519 for women, a difference of 46.3%. Men with an educational attainment of college or associate's degree enjoy the highest average annual earnings of $70,000, while those with high school diploma education earn the least with $28,750. Women with an educational attainment of college or associate's degree earn the most with the average annual earnings of $51,250, while those with bachelor's degree education have the smallest earnings of $23,438.
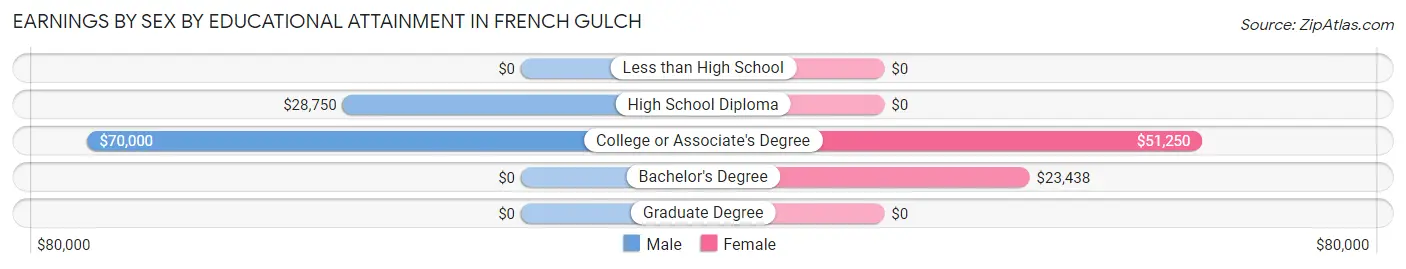
| Educational Attainment | Male Income | Female Income |
| Less than High School | - | - |
| High School Diploma | $28,750 | $0 |
| College or Associate's Degree | $70,000 | $51,250 |
| Bachelor's Degree | - | - |
| Graduate Degree | - | - |
| Total | $45,694 | $24,519 |
Family Income in French Gulch
Family Income Brackets in French Gulch
According to the French Gulch family income data, there are 18 families falling into the $35,000 to $49,999 income range, which is the most common income bracket and makes up 20.4% of all families.
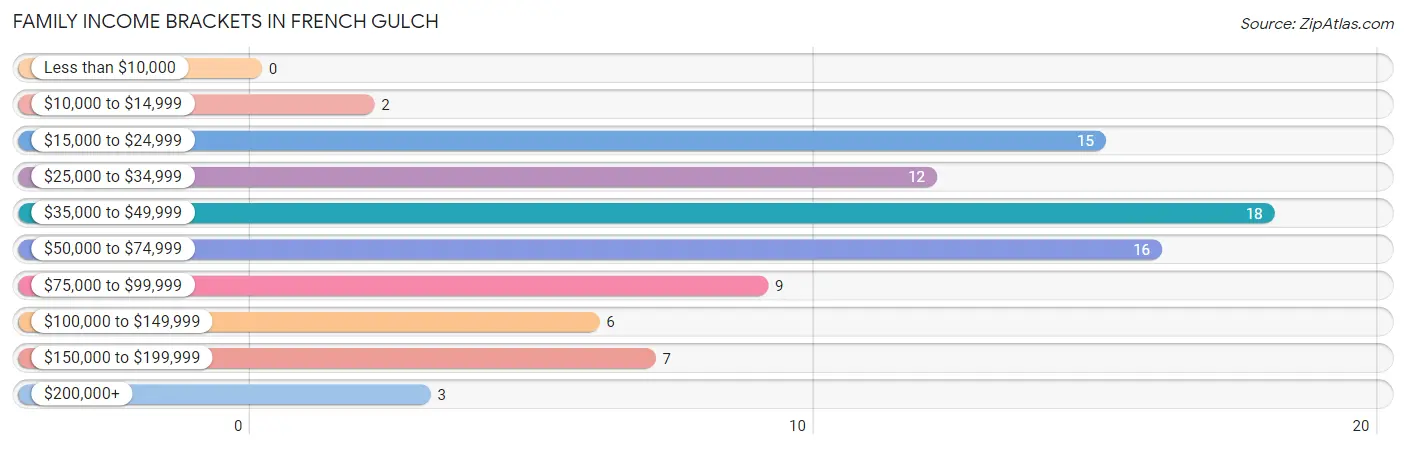
| Income Bracket | # Families | % Families |
| Less than $10,000 | 0 | 0.0% |
| $10,000 to $14,999 | 2 | 2.3% |
| $15,000 to $24,999 | 15 | 17.0% |
| $25,000 to $34,999 | 12 | 13.6% |
| $35,000 to $49,999 | 18 | 20.5% |
| $50,000 to $74,999 | 16 | 18.2% |
| $75,000 to $99,999 | 9 | 10.2% |
| $100,000 to $149,999 | 6 | 6.8% |
| $150,000 to $199,999 | 7 | 8.0% |
| $200,000+ | 3 | 3.4% |
Family Income by Famaliy Size in French Gulch
5-person families (9 | 10.2%) account for the highest median family income in French Gulch with $73,125 per family, while 2-person families (53 | 60.2%) have the highest median income of $17,232 per family member.
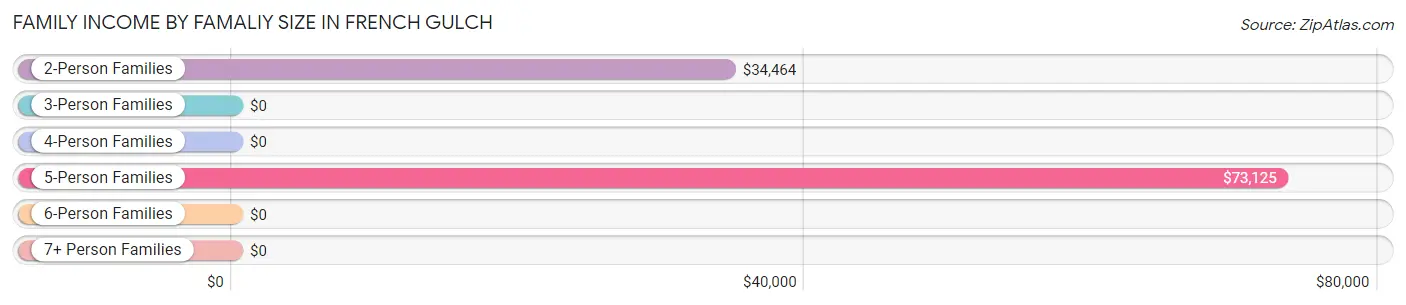
| Income Bracket | # Families | Median Income |
| 2-Person Families | 53 (60.2%) | $34,464 |
| 3-Person Families | 20 (22.7%) | $0 |
| 4-Person Families | 5 (5.7%) | $0 |
| 5-Person Families | 9 (10.2%) | $73,125 |
| 6-Person Families | 0 (0.0%) | $0 |
| 7+ Person Families | 1 (1.1%) | $0 |
| Total | 88 (100.0%) | $48,750 |
Family Income by Number of Earners in French Gulch
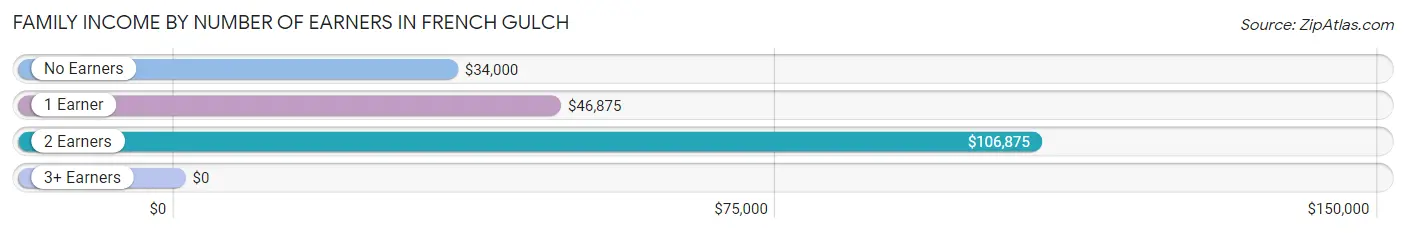
| Number of Earners | # Families | Median Income |
| No Earners | 40 (45.5%) | $34,000 |
| 1 Earner | 17 (19.3%) | $46,875 |
| 2 Earners | 23 (26.1%) | $106,875 |
| 3+ Earners | 8 (9.1%) | $0 |
| Total | 88 (100.0%) | $48,750 |
Household Income in French Gulch
Household Income Brackets in French Gulch
With 22 households falling in the category, the $35,000 to $49,999 income range is the most frequent in French Gulch, accounting for 20.6% of all households. In contrast, only 3 households (2.8%) fall into the $200,000+ income bracket, making it the least populous group.
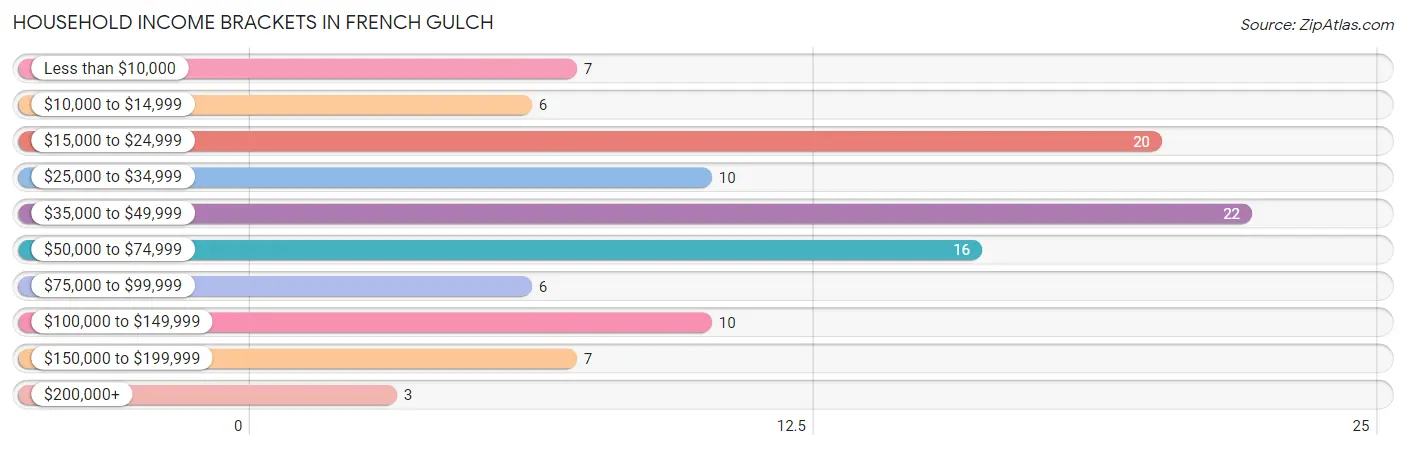
| Income Bracket | # Households | % Households |
| Less than $10,000 | 7 | 6.5% |
| $10,000 to $14,999 | 6 | 5.6% |
| $15,000 to $24,999 | 20 | 18.7% |
| $25,000 to $34,999 | 10 | 9.3% |
| $35,000 to $49,999 | 22 | 20.6% |
| $50,000 to $74,999 | 16 | 15.0% |
| $75,000 to $99,999 | 6 | 5.6% |
| $100,000 to $149,999 | 10 | 9.3% |
| $150,000 to $199,999 | 7 | 6.5% |
| $200,000+ | 3 | 2.8% |
Household Income by Householder Age in French Gulch
The median household income in French Gulch is $41,563, with the highest median household income of $65,000 found in the 25 to 44 years age bracket for the primary householder. A total of 18 households (16.8%) fall into this category.
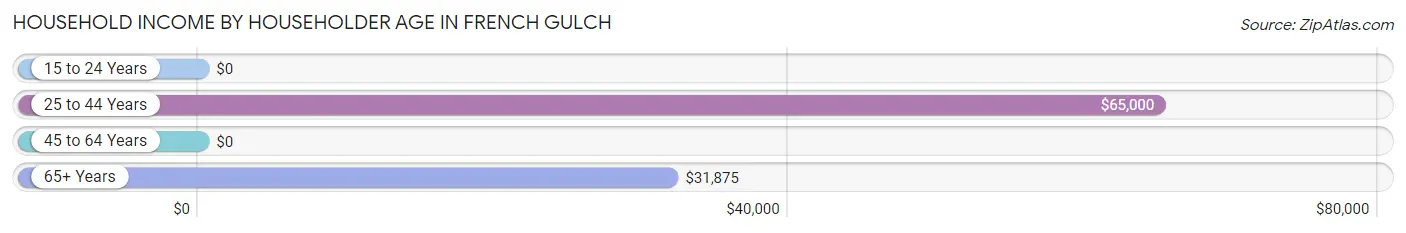
| Income Bracket | # Households | Median Income |
| 15 to 24 Years | 0 (0.0%) | $0 |
| 25 to 44 Years | 18 (16.8%) | $65,000 |
| 45 to 64 Years | 48 (44.9%) | $0 |
| 65+ Years | 41 (38.3%) | $31,875 |
| Total | 107 (100.0%) | $41,563 |
Poverty in French Gulch
Income Below Poverty by Sex and Age in French Gulch
With 6.4% poverty level for males and 10.3% for females among the residents of French Gulch, 25 to 34 year old males and 25 to 34 year old females are the most vulnerable to poverty, with 2 males (12.5%) and 4 females (36.4%) in their respective age groups living below the poverty level.
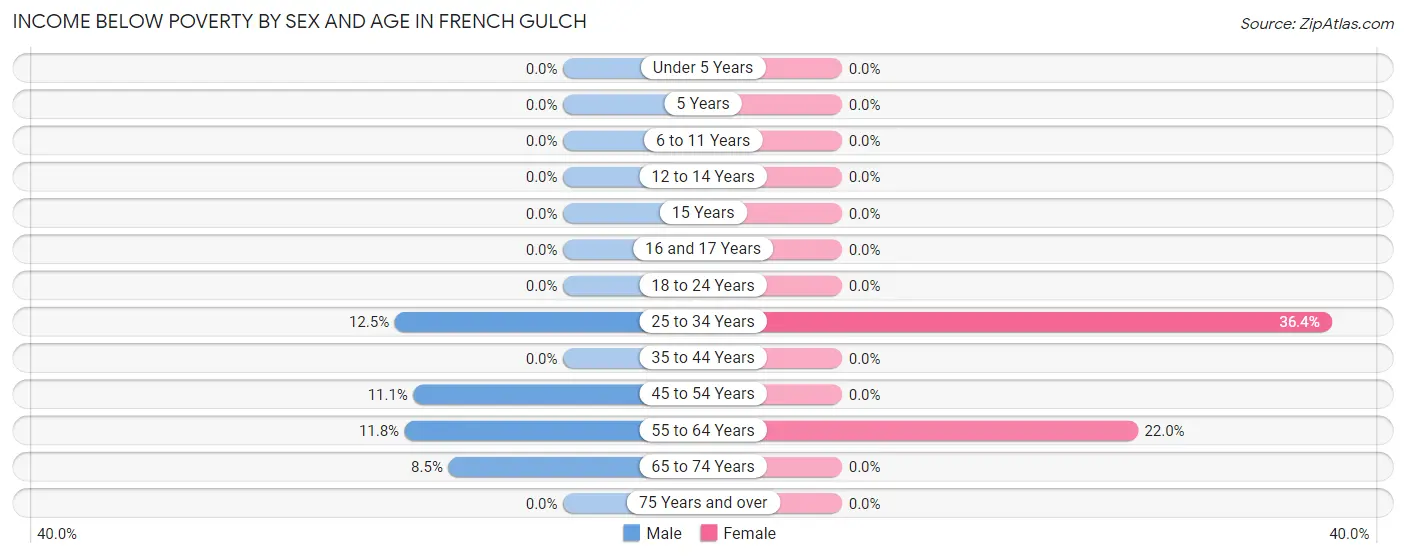
| Age Bracket | Male | Female |
| Under 5 Years | 0 (0.0%) | 0 (0.0%) |
| 5 Years | 0 (0.0%) | 0 (0.0%) |
| 6 to 11 Years | 0 (0.0%) | 0 (0.0%) |
| 12 to 14 Years | 0 (0.0%) | 0 (0.0%) |
| 15 Years | 0 (0.0%) | 0 (0.0%) |
| 16 and 17 Years | 0 (0.0%) | 0 (0.0%) |
| 18 to 24 Years | 0 (0.0%) | 0 (0.0%) |
| 25 to 34 Years | 2 (12.5%) | 4 (36.4%) |
| 35 to 44 Years | 0 (0.0%) | 0 (0.0%) |
| 45 to 54 Years | 2 (11.1%) | 0 (0.0%) |
| 55 to 64 Years | 2 (11.8%) | 9 (22.0%) |
| 65 to 74 Years | 4 (8.5%) | 0 (0.0%) |
| 75 Years and over | 0 (0.0%) | 0 (0.0%) |
| Total | 10 (6.4%) | 13 (10.3%) |
Income Above Poverty by Sex and Age in French Gulch
According to the poverty statistics in French Gulch, males aged under 5 years and females aged under 5 years are the age groups that are most secure financially, with 100.0% of males and 100.0% of females in these age groups living above the poverty line.
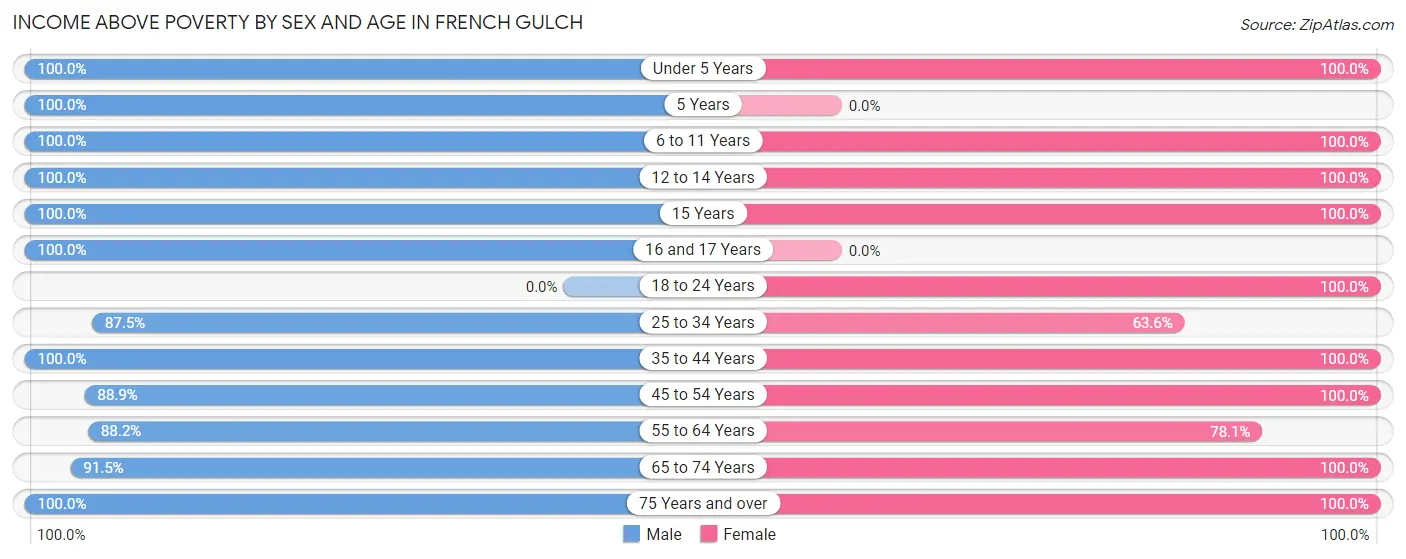
| Age Bracket | Male | Female |
| Under 5 Years | 7 (100.0%) | 4 (100.0%) |
| 5 Years | 2 (100.0%) | 0 (0.0%) |
| 6 to 11 Years | 19 (100.0%) | 6 (100.0%) |
| 12 to 14 Years | 5 (100.0%) | 6 (100.0%) |
| 15 Years | 4 (100.0%) | 2 (100.0%) |
| 16 and 17 Years | 2 (100.0%) | 0 (0.0%) |
| 18 to 24 Years | 0 (0.0%) | 5 (100.0%) |
| 25 to 34 Years | 14 (87.5%) | 7 (63.6%) |
| 35 to 44 Years | 10 (100.0%) | 11 (100.0%) |
| 45 to 54 Years | 16 (88.9%) | 11 (100.0%) |
| 55 to 64 Years | 15 (88.2%) | 32 (78.0%) |
| 65 to 74 Years | 43 (91.5%) | 23 (100.0%) |
| 75 Years and over | 10 (100.0%) | 6 (100.0%) |
| Total | 147 (93.6%) | 113 (89.7%) |
Income Below Poverty Among Married-Couple Families in French Gulch
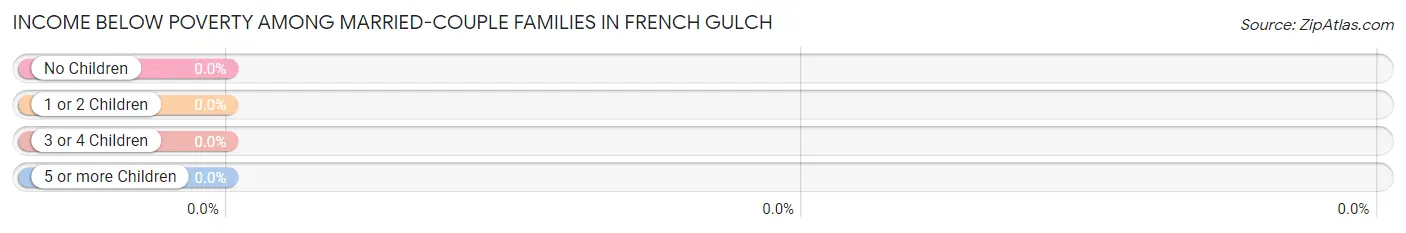
| Children | Above Poverty | Below Poverty |
| No Children | 52 (100.0%) | 0 (0.0%) |
| 1 or 2 Children | 8 (100.0%) | 0 (0.0%) |
| 3 or 4 Children | 7 (100.0%) | 0 (0.0%) |
| 5 or more Children | 0 (0.0%) | 0 (0.0%) |
| Total | 67 (100.0%) | 0 (0.0%) |
Income Below Poverty Among Single-Parent Households in French Gulch
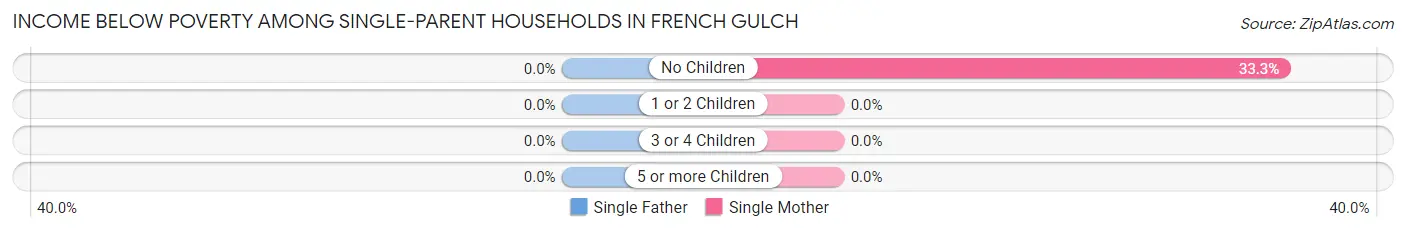
| Children | Single Father | Single Mother |
| No Children | 0 (0.0%) | 2 (33.3%) |
| 1 or 2 Children | 0 (0.0%) | 0 (0.0%) |
| 3 or 4 Children | 0 (0.0%) | 0 (0.0%) |
| 5 or more Children | 0 (0.0%) | 0 (0.0%) |
| Total | 0 (0.0%) | 2 (12.5%) |
Income Below Poverty Among Married-Couple vs Single-Parent Households in French Gulch
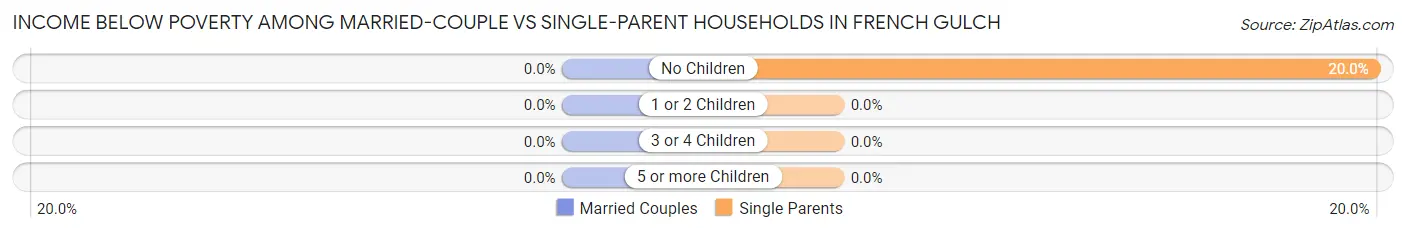
| Children | Married-Couple Families | Single-Parent Households |
| No Children | 0 (0.0%) | 2 (20.0%) |
| 1 or 2 Children | 0 (0.0%) | 0 (0.0%) |
| 3 or 4 Children | 0 (0.0%) | 0 (0.0%) |
| 5 or more Children | 0 (0.0%) | 0 (0.0%) |
| Total | 0 (0.0%) | 2 (9.5%) |
Race in French Gulch
The most populous races in French Gulch are White / Caucasian (233 | 82.3%), Two or more Races (29 | 10.2%), and Hispanic or Latino (27 | 9.5%).
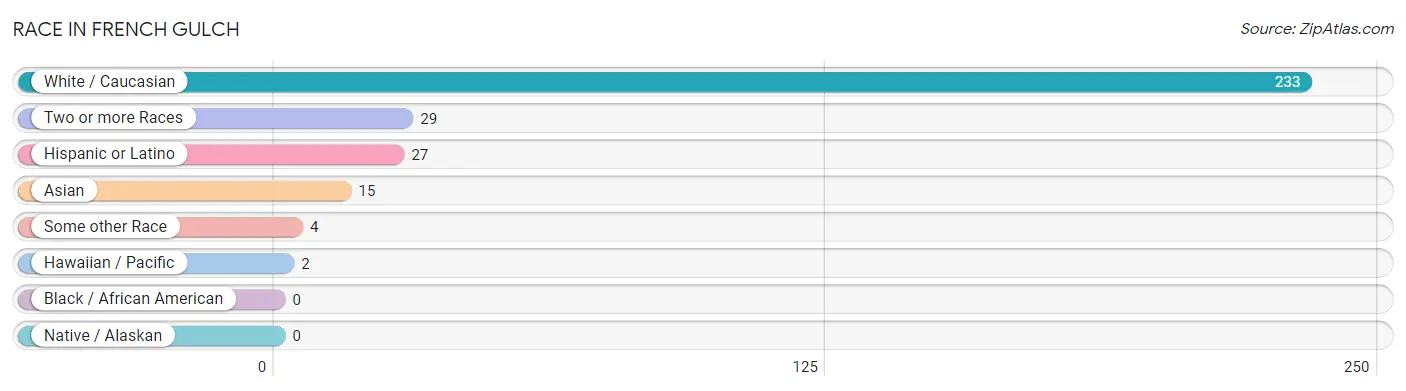
| Race | # Population | % Population |
| Asian | 15 | 5.3% |
| Black / African American | 0 | 0.0% |
| Hawaiian / Pacific | 2 | 0.7% |
| Hispanic or Latino | 27 | 9.5% |
| Native / Alaskan | 0 | 0.0% |
| White / Caucasian | 233 | 82.3% |
| Two or more Races | 29 | 10.2% |
| Some other Race | 4 | 1.4% |
| Total | 283 | 100.0% |
Ancestry in French Gulch
The most populous ancestries reported in French Gulch are Irish (40 | 14.1%), German (32 | 11.3%), English (28 | 9.9%), Northern European (28 | 9.9%), and American (27 | 9.5%), together accounting for 54.8% of all French Gulch residents.
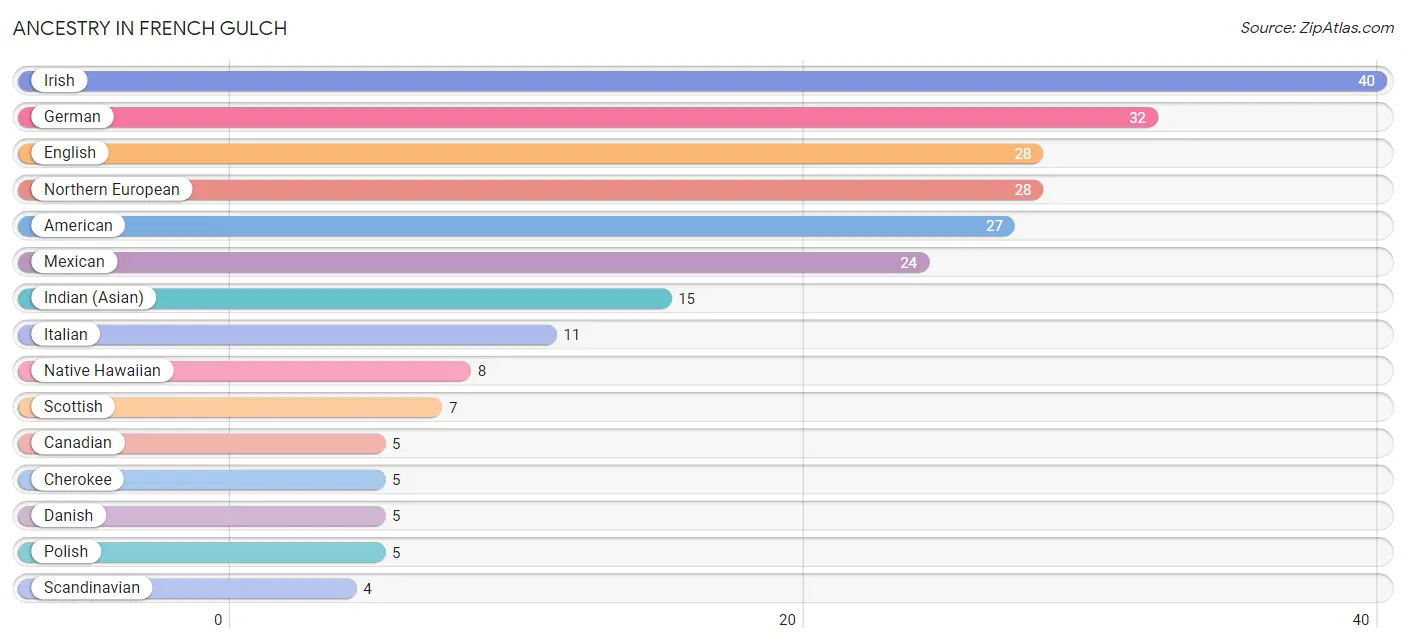
| Ancestry | # Population | % Population |
| American | 27 | 9.5% |
| Canadian | 5 | 1.8% |
| Cherokee | 5 | 1.8% |
| Danish | 5 | 1.8% |
| English | 28 | 9.9% |
| French | 2 | 0.7% |
| German | 32 | 11.3% |
| Indian (Asian) | 15 | 5.3% |
| Inupiat | 3 | 1.1% |
| Irish | 40 | 14.1% |
| Italian | 11 | 3.9% |
| Lithuanian | 2 | 0.7% |
| Mexican | 24 | 8.5% |
| Native Hawaiian | 8 | 2.8% |
| Northern European | 28 | 9.9% |
| Norwegian | 2 | 0.7% |
| Polish | 5 | 1.8% |
| Portuguese | 1 | 0.4% |
| Scandinavian | 4 | 1.4% |
| Scotch-Irish | 3 | 1.1% |
| Scottish | 7 | 2.5% |
| Spanish | 3 | 1.1% |
| Swiss | 2 | 0.7% |
| Welsh | 2 | 0.7% | View All 24 Rows |
Immigrants in French Gulch
The most numerous immigrant groups reported in French Gulch came from Asia (15 | 5.3%), China (15 | 5.3%), Eastern Asia (15 | 5.3%), and Hong Kong (15 | 5.3%), together accounting for 21.2% of all French Gulch residents.
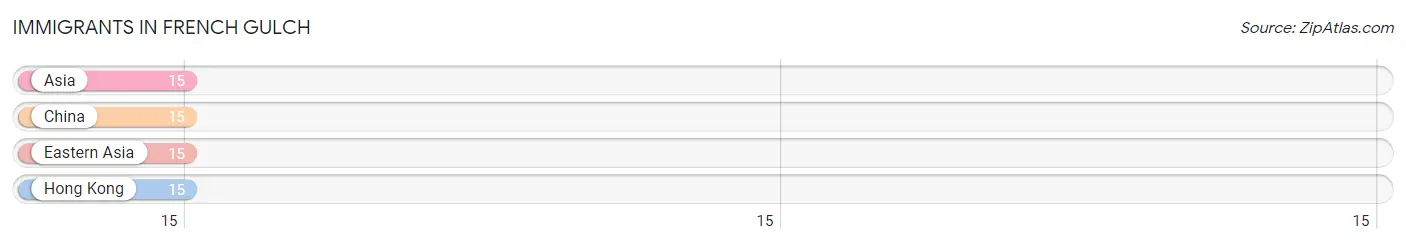
| Immigration Origin | # Population | % Population |
| Asia | 15 | 5.3% |
| China | 15 | 5.3% |
| Eastern Asia | 15 | 5.3% |
| Hong Kong | 15 | 5.3% | View All 4 Rows |
Sex and Age in French Gulch
Sex and Age in French Gulch
The most populous age groups in French Gulch are 70 to 74 Years (25 | 15.9%) for men and 55 to 59 Years (25 | 19.8%) for women.
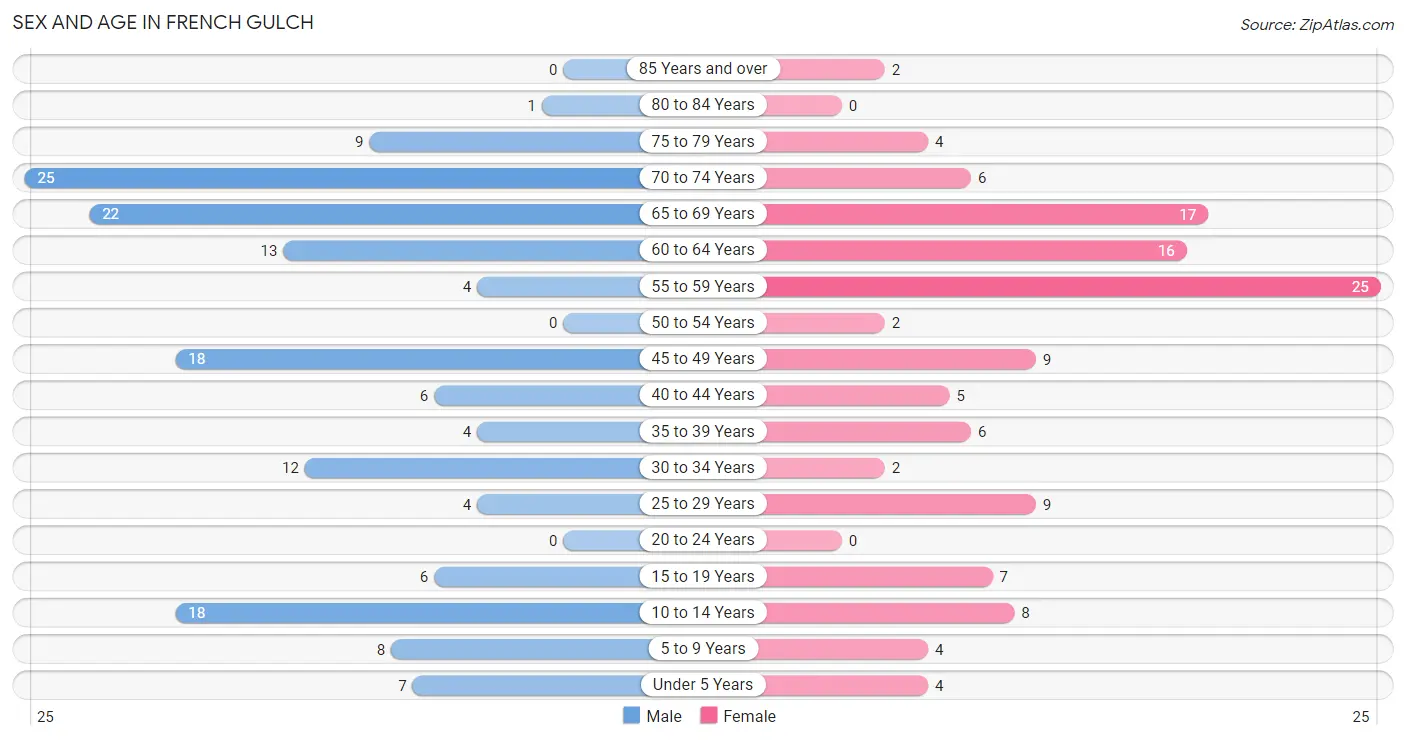
| Age Bracket | Male | Female |
| Under 5 Years | 7 (4.5%) | 4 (3.2%) |
| 5 to 9 Years | 8 (5.1%) | 4 (3.2%) |
| 10 to 14 Years | 18 (11.5%) | 8 (6.4%) |
| 15 to 19 Years | 6 (3.8%) | 7 (5.6%) |
| 20 to 24 Years | 0 (0.0%) | 0 (0.0%) |
| 25 to 29 Years | 4 (2.5%) | 9 (7.1%) |
| 30 to 34 Years | 12 (7.6%) | 2 (1.6%) |
| 35 to 39 Years | 4 (2.5%) | 6 (4.8%) |
| 40 to 44 Years | 6 (3.8%) | 5 (4.0%) |
| 45 to 49 Years | 18 (11.5%) | 9 (7.1%) |
| 50 to 54 Years | 0 (0.0%) | 2 (1.6%) |
| 55 to 59 Years | 4 (2.5%) | 25 (19.8%) |
| 60 to 64 Years | 13 (8.3%) | 16 (12.7%) |
| 65 to 69 Years | 22 (14.0%) | 17 (13.5%) |
| 70 to 74 Years | 25 (15.9%) | 6 (4.8%) |
| 75 to 79 Years | 9 (5.7%) | 4 (3.2%) |
| 80 to 84 Years | 1 (0.6%) | 0 (0.0%) |
| 85 Years and over | 0 (0.0%) | 2 (1.6%) |
| Total | 157 (100.0%) | 126 (100.0%) |
Families and Households in French Gulch
Median Family Size in French Gulch
The median family size in French Gulch is 2.80 persons per family, with single male/father families (5 | 5.7%) accounting for the largest median family size of 3.8 persons per family. On the other hand, single female/mother families (16 | 18.2%) represent the smallest median family size with 2.56 persons per family.
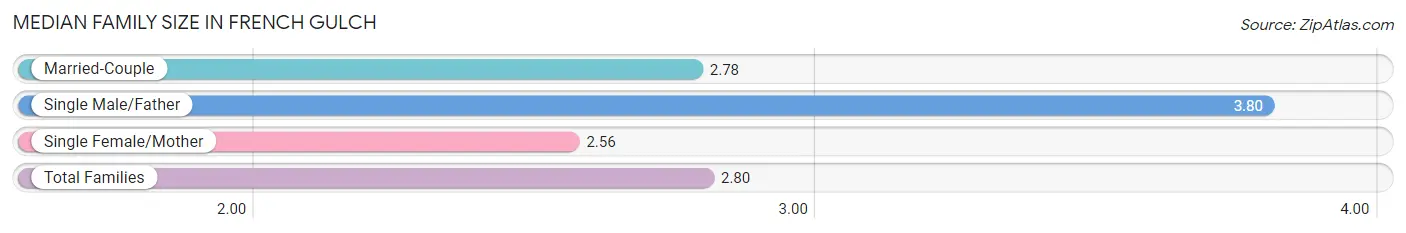
| Family Type | # Families | Family Size |
| Married-Couple | 67 (76.1%) | 2.78 |
| Single Male/Father | 5 (5.7%) | 3.80 |
| Single Female/Mother | 16 (18.2%) | 2.56 |
| Total Families | 88 (100.0%) | 2.80 |
Median Household Size in French Gulch
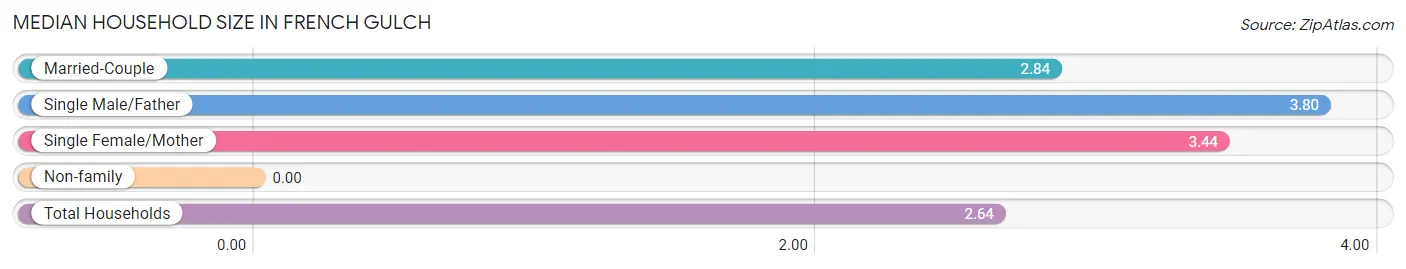
| Household Type | # Households | Household Size |
| Married-Couple | 67 (62.6%) | 2.84 |
| Single Male/Father | 5 (4.7%) | 3.80 |
| Single Female/Mother | 16 (14.9%) | 3.44 |
| Non-family | 19 (17.8%) | - |
| Total Households | 107 (100.0%) | 2.64 |
Household Size by Marriage Status in French Gulch
Out of a total of 107 households in French Gulch, 88 (82.2%) are family households, while 19 (17.8%) are nonfamily households. The most numerous type of family households are 2-person households, comprising 49, and the most common type of nonfamily households are 1-person households, comprising 19.
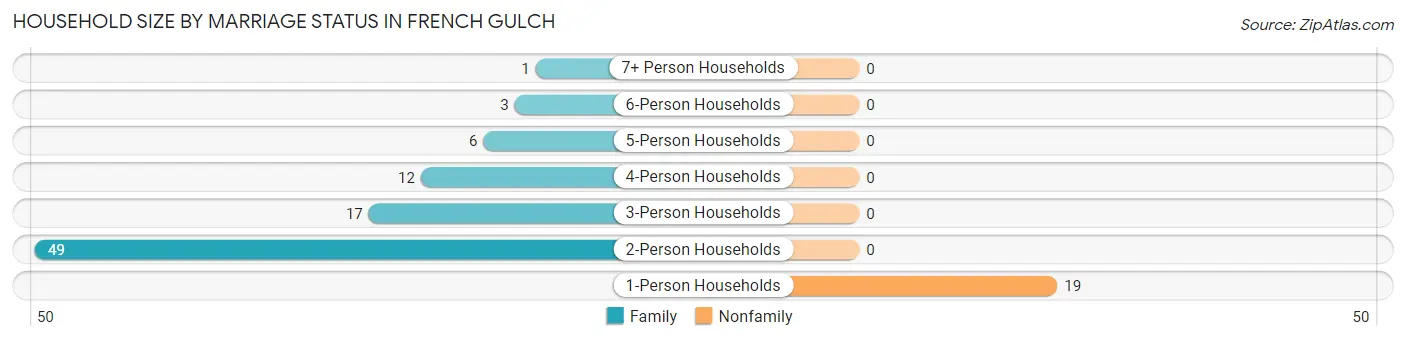
| Household Size | Family Households | Nonfamily Households |
| 1-Person Households | - | 19 (17.8%) |
| 2-Person Households | 49 (45.8%) | 0 (0.0%) |
| 3-Person Households | 17 (15.9%) | 0 (0.0%) |
| 4-Person Households | 12 (11.2%) | 0 (0.0%) |
| 5-Person Households | 6 (5.6%) | 0 (0.0%) |
| 6-Person Households | 3 (2.8%) | 0 (0.0%) |
| 7+ Person Households | 1 (0.9%) | 0 (0.0%) |
| Total | 88 (82.2%) | 19 (17.8%) |
Female Fertility in French Gulch
Fertility by Age in French Gulch
Average fertility rate in French Gulch is 53.0 births per 1,000 women. Women in the age bracket of 20 to 34 years have the highest fertility rate with 182.0 births per 1,000 women. Women in the age bracket of 20 to 34 years acount for 100.0% of all women with births.
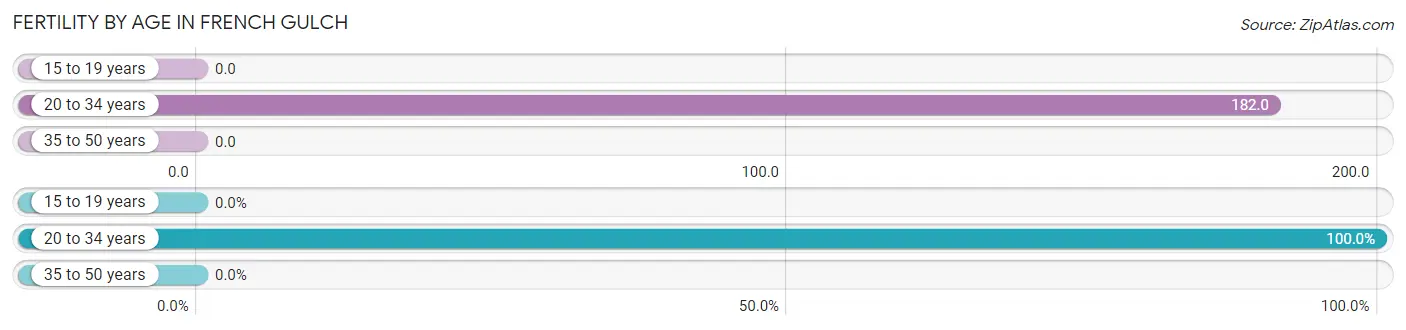
| Age Bracket | Women with Births | Births / 1,000 Women |
| 15 to 19 years | 0 (0.0%) | 0.0 |
| 20 to 34 years | 2 (100.0%) | 182.0 |
| 35 to 50 years | 0 (0.0%) | 0.0 |
| Total | 2 (100.0%) | 53.0 |
Fertility by Age by Marriage Status in French Gulch

| Age Bracket | Married | Unmarried |
| 15 to 19 years | 0 (0.0%) | 0 (0.0%) |
| 20 to 34 years | 2 (100.0%) | 0 (0.0%) |
| 35 to 50 years | 0 (0.0%) | 0 (0.0%) |
| Total | 2 (100.0%) | 0 (0.0%) |
Fertility by Education in French Gulch
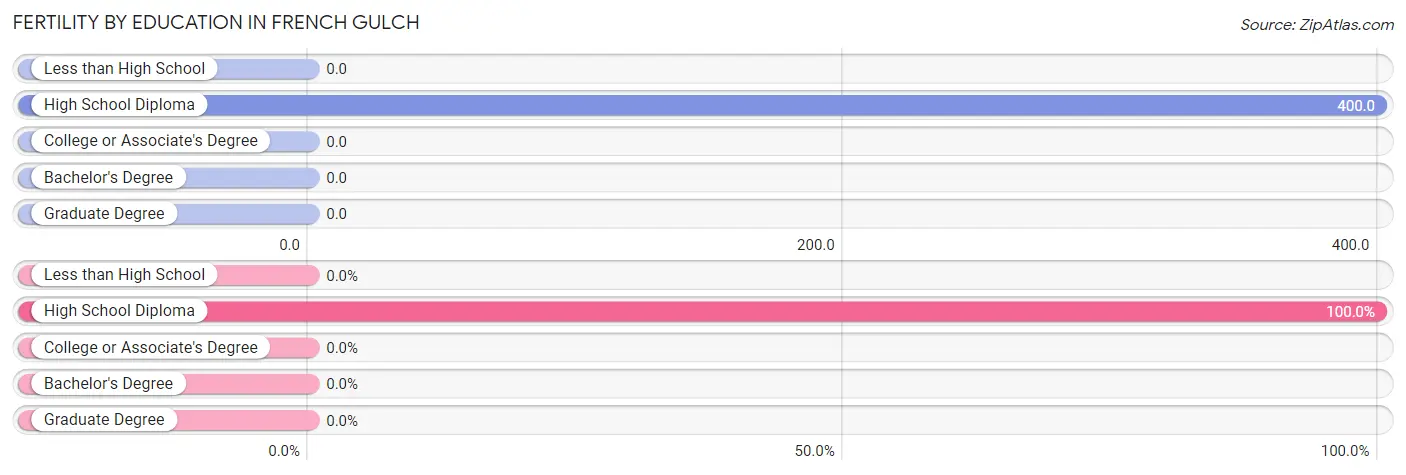
| Educational Attainment | Women with Births | Births / 1,000 Women |
| Less than High School | 0 (0.0%) | 0.0 |
| High School Diploma | 2 (100.0%) | 400.0 |
| College or Associate's Degree | 0 (0.0%) | 0.0 |
| Bachelor's Degree | 0 (0.0%) | 0.0 |
| Graduate Degree | 0 (0.0%) | 0.0 |
| Total | 2 (100.0%) | 53.0 |
Fertility by Education by Marriage Status in French Gulch
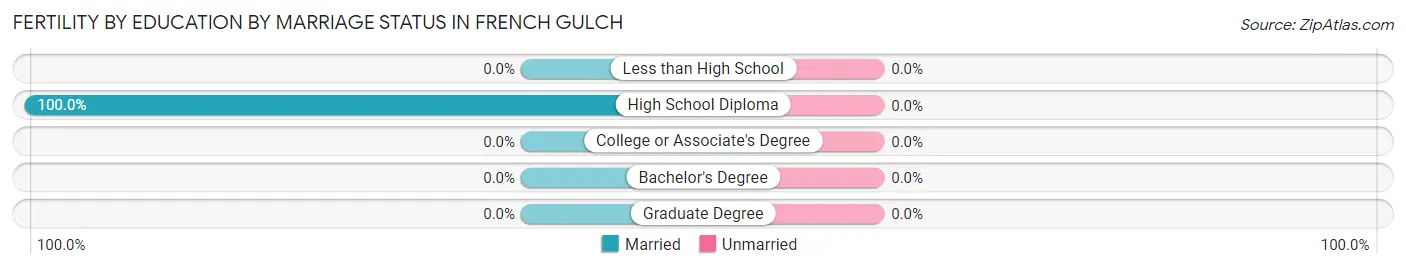
| Educational Attainment | Married | Unmarried |
| Less than High School | 0 (0.0%) | 0 (0.0%) |
| High School Diploma | 2 (100.0%) | 0 (0.0%) |
| College or Associate's Degree | 0 (0.0%) | 0 (0.0%) |
| Bachelor's Degree | 0 (0.0%) | 0 (0.0%) |
| Graduate Degree | 0 (0.0%) | 0 (0.0%) |
| Total | 2 (100.0%) | 0 (0.0%) |
Employment Characteristics in French Gulch
Employment by Class of Employer in French Gulch
Among the 97 employed individuals in French Gulch, private company employees (47 | 48.4%), local government employees (14 | 14.4%), and state government employees (11 | 11.3%) make up the most common classes of employment.
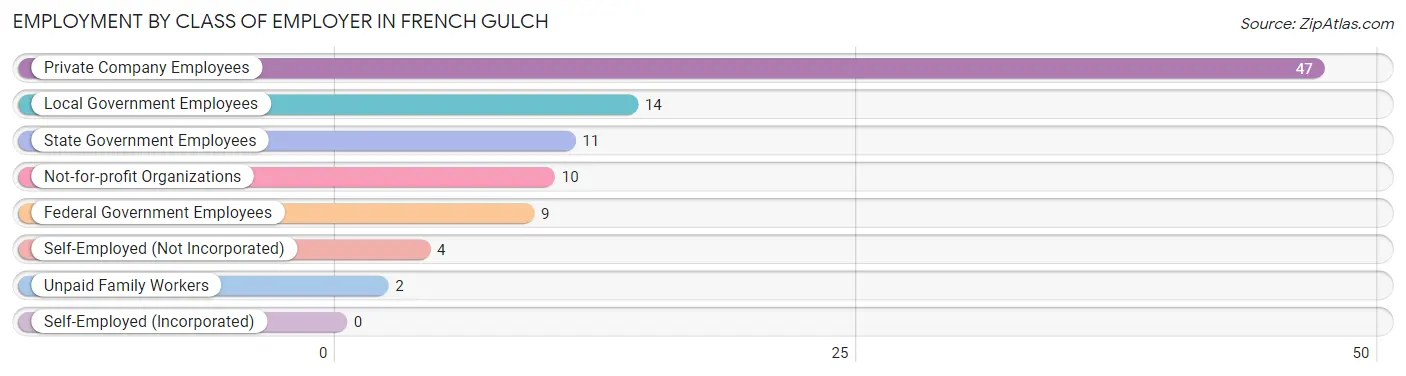
| Employer Class | # Employees | % Employees |
| Private Company Employees | 47 | 48.4% |
| Self-Employed (Incorporated) | 0 | 0.0% |
| Self-Employed (Not Incorporated) | 4 | 4.1% |
| Not-for-profit Organizations | 10 | 10.3% |
| Local Government Employees | 14 | 14.4% |
| State Government Employees | 11 | 11.3% |
| Federal Government Employees | 9 | 9.3% |
| Unpaid Family Workers | 2 | 2.1% |
| Total | 97 | 100.0% |
Employment Status by Age in French Gulch
According to the labor force statistics for French Gulch, out of the total population over 16 years of age (228), 46.1% or 105 individuals are in the labor force, with 1.9% or 2 of them unemployed. The age group with the highest labor force participation rate is 45 to 54 years, with 100.0% or 29 individuals in the labor force. Within the labor force, the 55 to 59 years age range has the highest percentage of unemployed individuals, with 8.7% or 2 of them being unemployed.
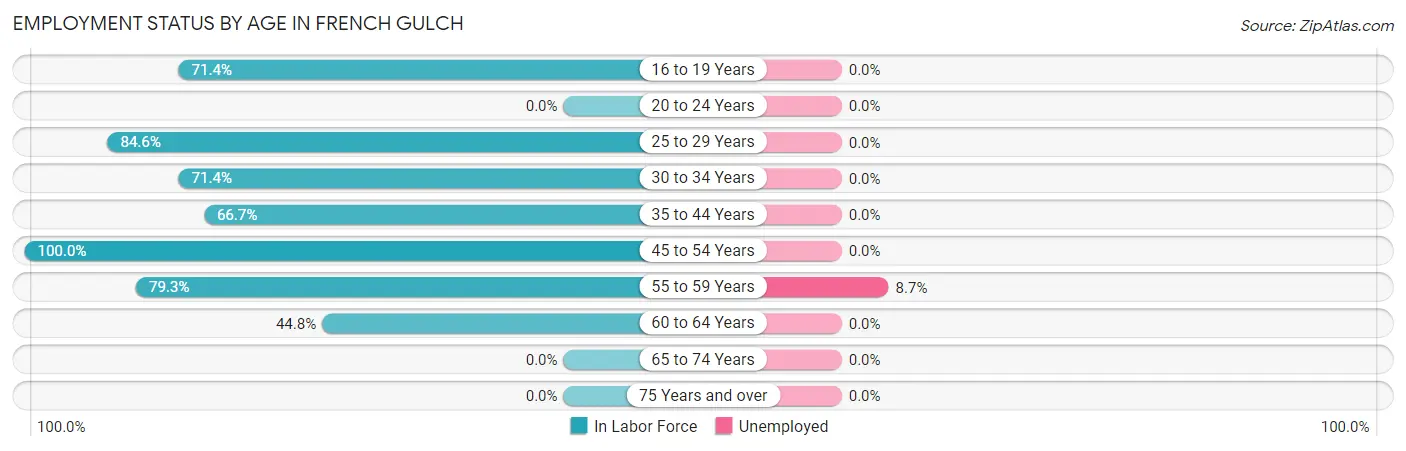
| Age Bracket | In Labor Force | Unemployed |
| 16 to 19 Years | 5 (71.4%) | 0 (0.0%) |
| 20 to 24 Years | 0 (0.0%) | 0 (0.0%) |
| 25 to 29 Years | 11 (84.6%) | 0 (0.0%) |
| 30 to 34 Years | 10 (71.4%) | 0 (0.0%) |
| 35 to 44 Years | 14 (66.7%) | 0 (0.0%) |
| 45 to 54 Years | 29 (100.0%) | 0 (0.0%) |
| 55 to 59 Years | 23 (79.3%) | 2 (8.7%) |
| 60 to 64 Years | 13 (44.8%) | 0 (0.0%) |
| 65 to 74 Years | 0 (0.0%) | 0 (0.0%) |
| 75 Years and over | 0 (0.0%) | 0 (0.0%) |
| Total | 105 (46.1%) | 2 (1.9%) |
Employment Status by Educational Attainment in French Gulch
According to labor force statistics for French Gulch, 74.1% of individuals (100) out of the total population between 25 and 64 years of age (135) are in the labor force, with 2.0% or 2 of them being unemployed. The group with the highest labor force participation rate are those with the educational attainment of less than high school, with 100.0% or 7 individuals in the labor force. Within the labor force, individuals with bachelor's degree or higher education have the highest percentage of unemployment, with 5.6% or 2 of them being unemployed.
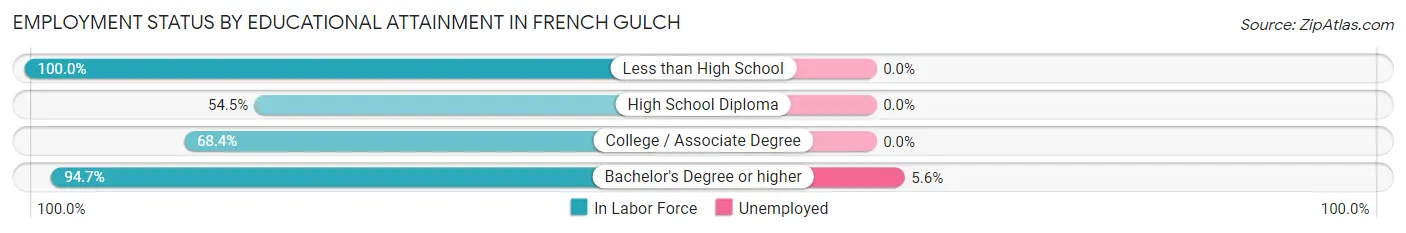
| Educational Attainment | In Labor Force | Unemployed |
| Less than High School | 7 (100.0%) | 0 (0.0%) |
| High School Diploma | 18 (54.5%) | 0 (0.0%) |
| College / Associate Degree | 39 (68.4%) | 0 (0.0%) |
| Bachelor's Degree or higher | 36 (94.7%) | 2 (5.6%) |
| Total | 100 (74.1%) | 3 (2.0%) |
Employment Occupations by Sex in French Gulch
Management, Business, Science and Arts Occupations
The most common Management, Business, Science and Arts occupations in French Gulch are Community & Social Service (15 | 14.6%), Health Diagnosing & Treating (12 | 11.7%), Health Technologists (10 | 9.7%), Education Instruction & Library (9 | 8.7%), and Business & Financial (8 | 7.8%).
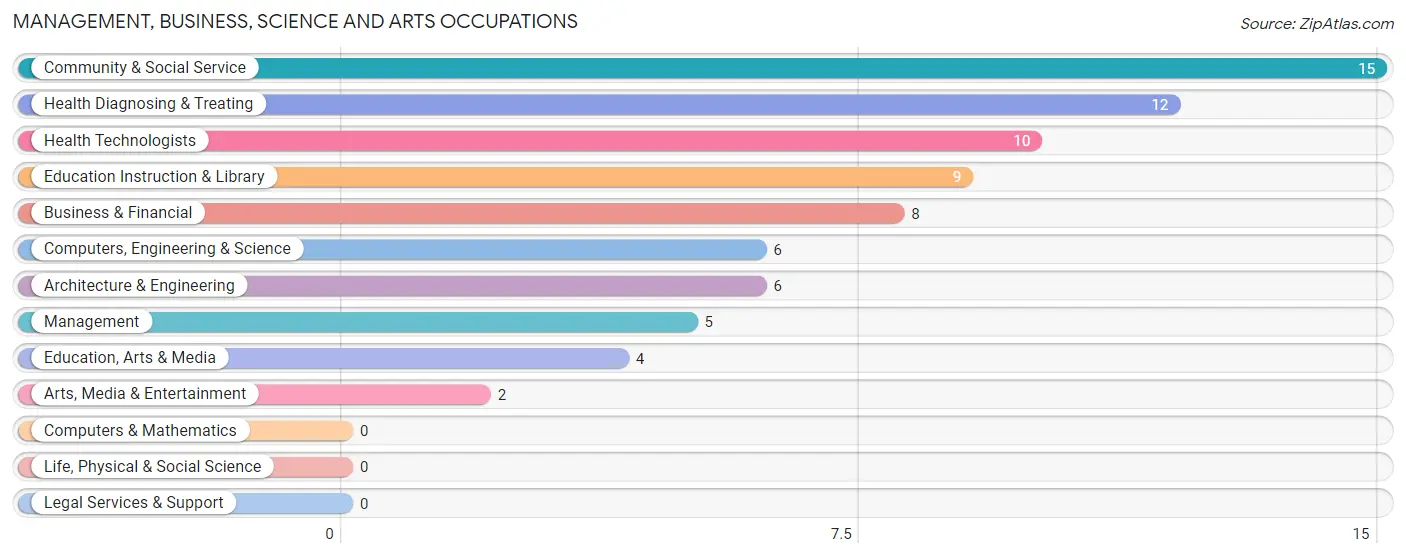
Management, Business, Science and Arts Occupations by Sex
Within the Management, Business, Science and Arts occupations in French Gulch, the most male-oriented occupations are Computers, Engineering & Science (100.0%), Architecture & Engineering (100.0%), and Arts, Media & Entertainment (100.0%), while the most female-oriented occupations are Management (100.0%), Education Instruction & Library (77.8%), and Business & Financial (75.0%).
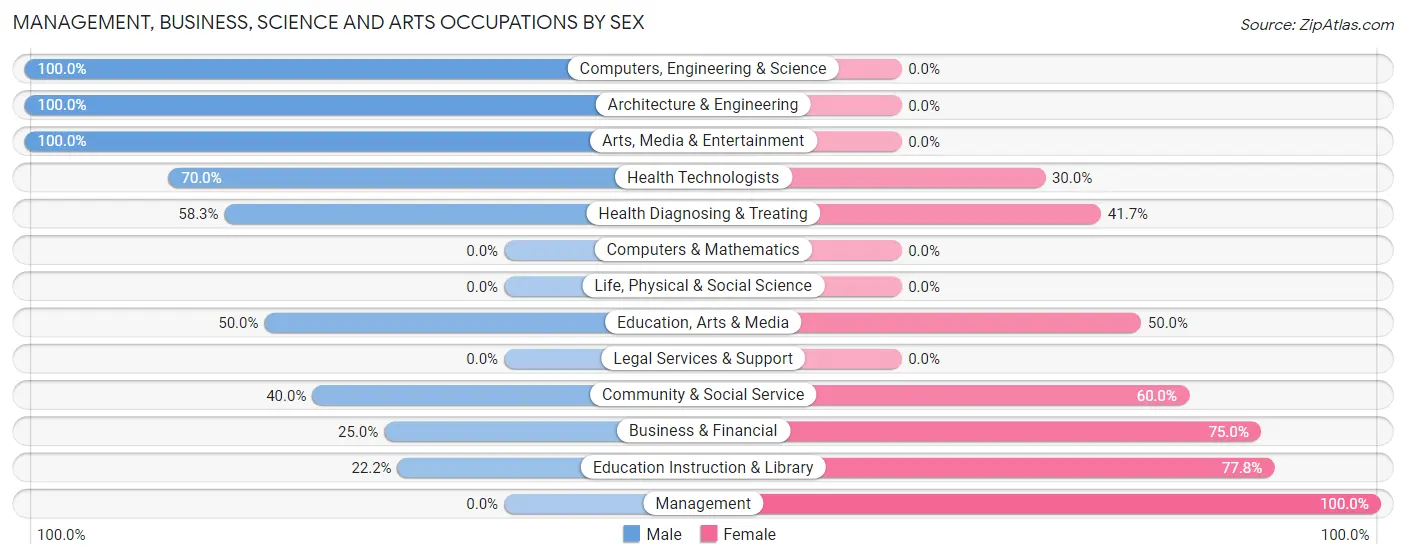
| Occupation | Male | Female |
| Management | 0 (0.0%) | 5 (100.0%) |
| Business & Financial | 2 (25.0%) | 6 (75.0%) |
| Computers, Engineering & Science | 6 (100.0%) | 0 (0.0%) |
| Computers & Mathematics | 0 (0.0%) | 0 (0.0%) |
| Architecture & Engineering | 6 (100.0%) | 0 (0.0%) |
| Life, Physical & Social Science | 0 (0.0%) | 0 (0.0%) |
| Community & Social Service | 6 (40.0%) | 9 (60.0%) |
| Education, Arts & Media | 2 (50.0%) | 2 (50.0%) |
| Legal Services & Support | 0 (0.0%) | 0 (0.0%) |
| Education Instruction & Library | 2 (22.2%) | 7 (77.8%) |
| Arts, Media & Entertainment | 2 (100.0%) | 0 (0.0%) |
| Health Diagnosing & Treating | 7 (58.3%) | 5 (41.7%) |
| Health Technologists | 7 (70.0%) | 3 (30.0%) |
| Total (Category) | 21 (45.7%) | 25 (54.3%) |
| Total (Overall) | 53 (51.5%) | 50 (48.5%) |
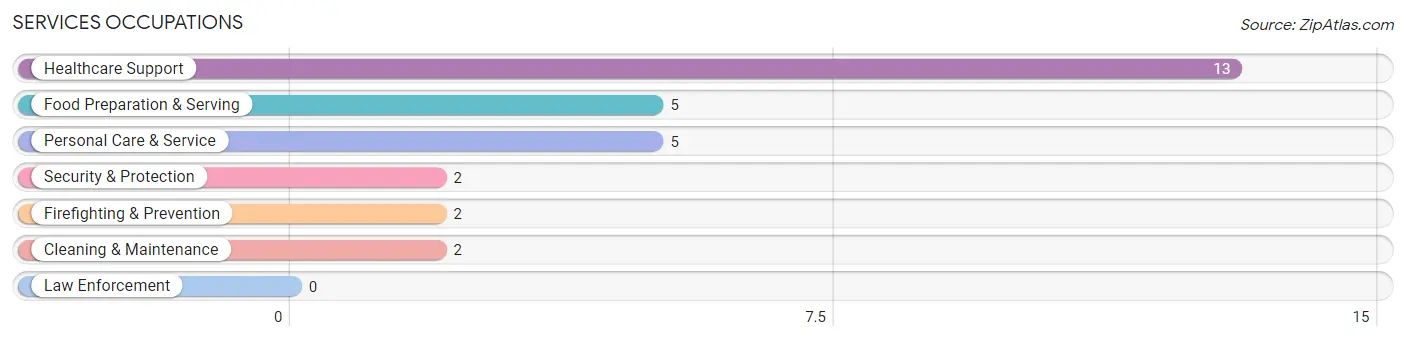
Services Occupations
The most common Services occupations in French Gulch are Healthcare Support (13 | 12.6%), Food Preparation & Serving (5 | 4.9%), Personal Care & Service (5 | 4.9%), Security & Protection (2 | 1.9%), and Firefighting & Prevention (2 | 1.9%).
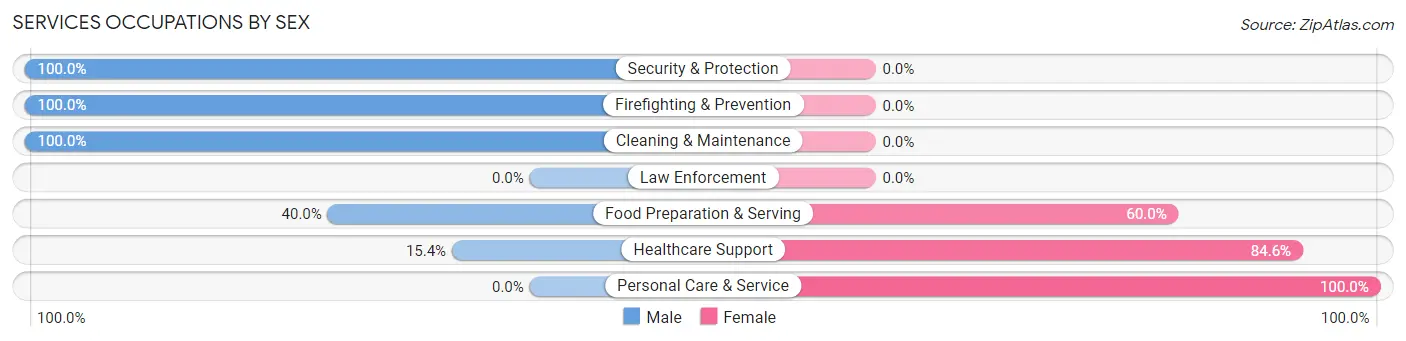
Services Occupations by Sex
Within the Services occupations in French Gulch, the most male-oriented occupations are Security & Protection (100.0%), Firefighting & Prevention (100.0%), and Cleaning & Maintenance (100.0%), while the most female-oriented occupations are Personal Care & Service (100.0%), Healthcare Support (84.6%), and Food Preparation & Serving (60.0%).
| Occupation | Male | Female |
| Healthcare Support | 2 (15.4%) | 11 (84.6%) |
| Security & Protection | 2 (100.0%) | 0 (0.0%) |
| Firefighting & Prevention | 2 (100.0%) | 0 (0.0%) |
| Law Enforcement | 0 (0.0%) | 0 (0.0%) |
| Food Preparation & Serving | 2 (40.0%) | 3 (60.0%) |
| Cleaning & Maintenance | 2 (100.0%) | 0 (0.0%) |
| Personal Care & Service | 0 (0.0%) | 5 (100.0%) |
| Total (Category) | 8 (29.6%) | 19 (70.4%) |
| Total (Overall) | 53 (51.5%) | 50 (48.5%) |
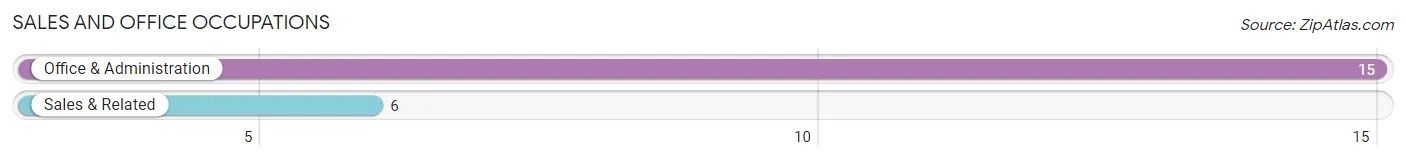
Sales and Office Occupations
The most common Sales and Office occupations in French Gulch are Office & Administration (15 | 14.6%), and Sales & Related (6 | 5.8%).
Sales and Office Occupations by Sex
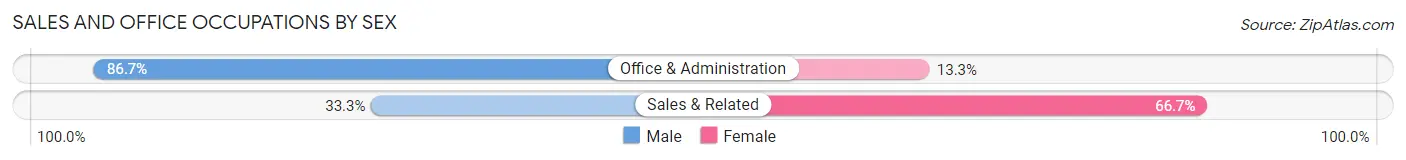
| Occupation | Male | Female |
| Sales & Related | 2 (33.3%) | 4 (66.7%) |
| Office & Administration | 13 (86.7%) | 2 (13.3%) |
| Total (Category) | 15 (71.4%) | 6 (28.6%) |
| Total (Overall) | 53 (51.5%) | 50 (48.5%) |
Natural Resources, Construction and Maintenance Occupations
The most common Natural Resources, Construction and Maintenance occupations in French Gulch are Construction & Extraction (2 | 1.9%), and Installation, Maintenance & Repair (1 | 1.0%).
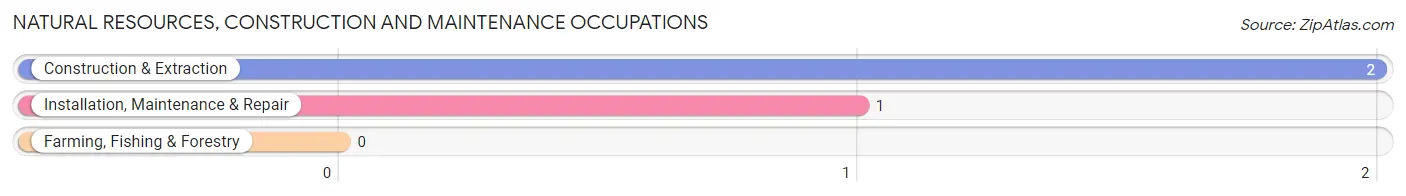
Natural Resources, Construction and Maintenance Occupations by Sex

| Occupation | Male | Female |
| Farming, Fishing & Forestry | 0 (0.0%) | 0 (0.0%) |
| Construction & Extraction | 2 (100.0%) | 0 (0.0%) |
| Installation, Maintenance & Repair | 1 (100.0%) | 0 (0.0%) |
| Total (Category) | 3 (100.0%) | 0 (0.0%) |
| Total (Overall) | 53 (51.5%) | 50 (48.5%) |
Production, Transportation and Moving Occupations
The most common Production, Transportation and Moving occupations in French Gulch are Transportation (5 | 4.9%), and Production (1 | 1.0%).
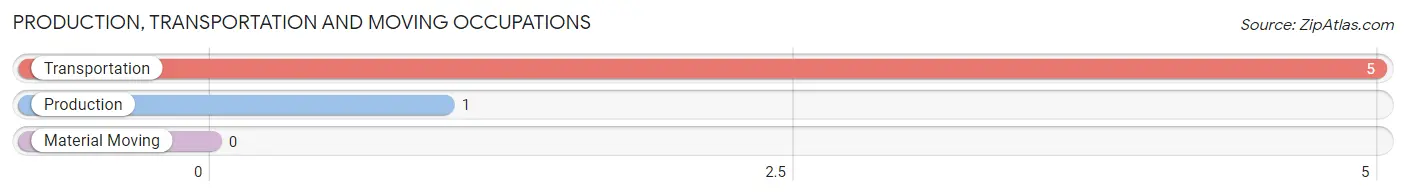
Production, Transportation and Moving Occupations by Sex
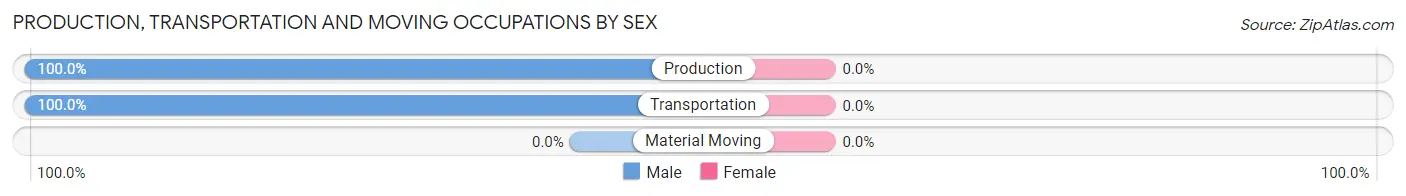
| Occupation | Male | Female |
| Production | 1 (100.0%) | 0 (0.0%) |
| Transportation | 5 (100.0%) | 0 (0.0%) |
| Material Moving | 0 (0.0%) | 0 (0.0%) |
| Total (Category) | 6 (100.0%) | 0 (0.0%) |
| Total (Overall) | 53 (51.5%) | 50 (48.5%) |
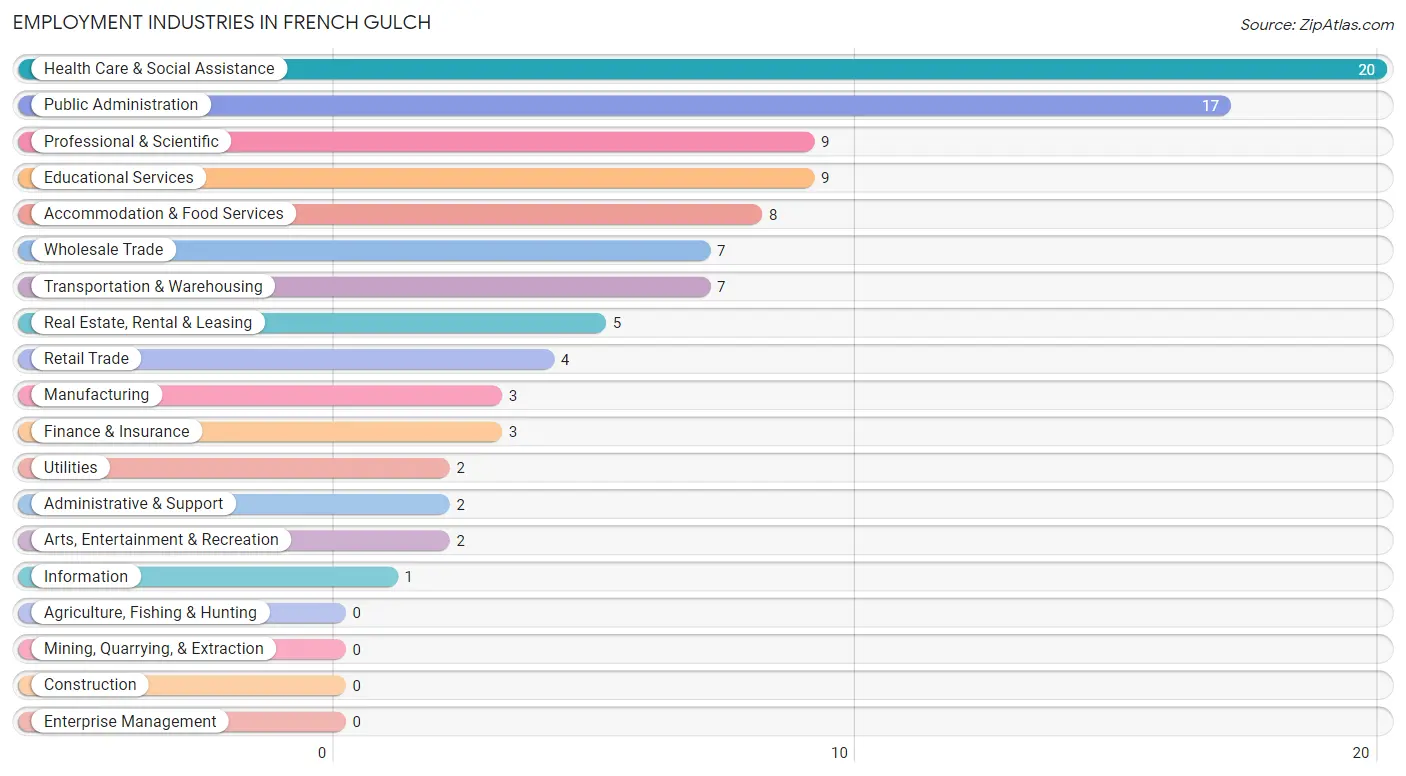
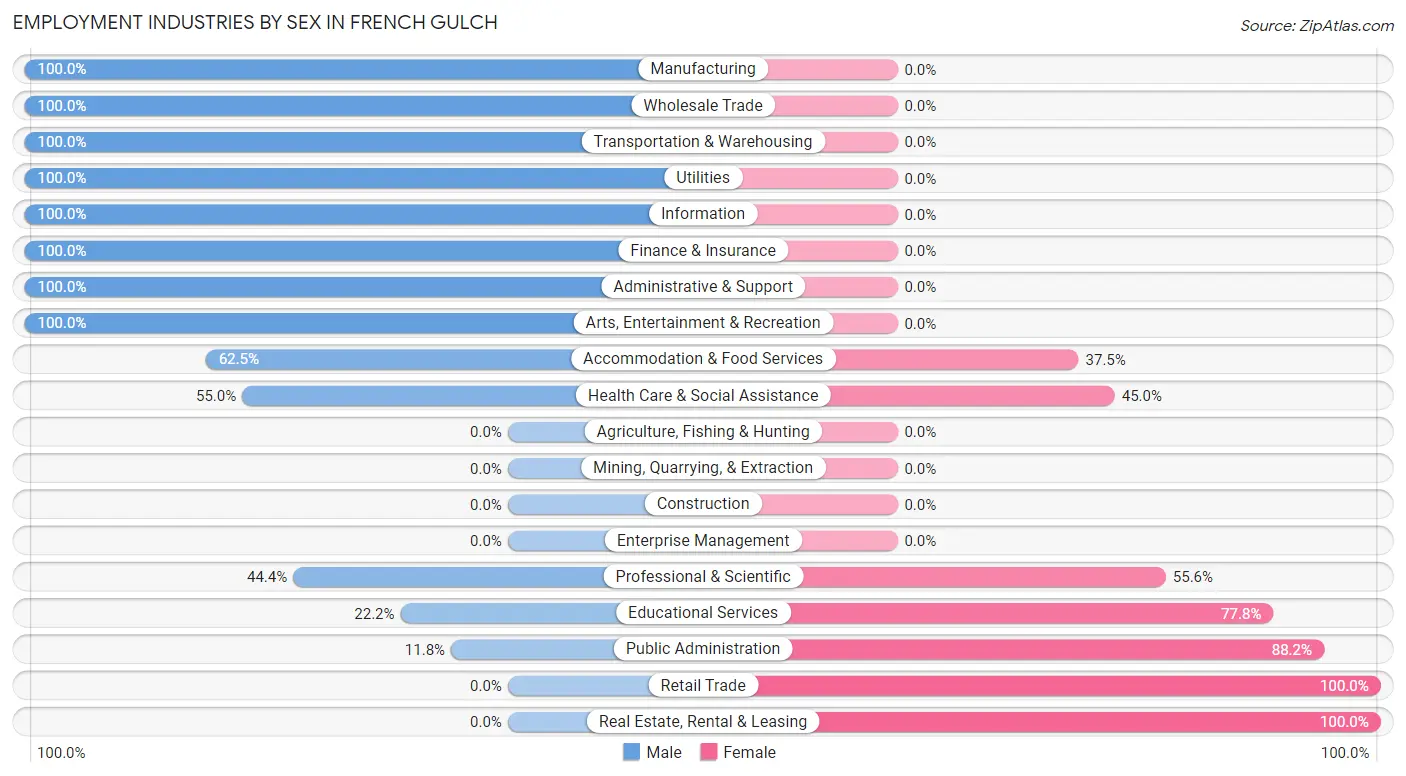
Employment Industries by Sex in French Gulch
Employment Industries in French Gulch
The major employment industries in French Gulch include Health Care & Social Assistance (20 | 19.4%), Public Administration (17 | 16.5%), Professional & Scientific (9 | 8.7%), Educational Services (9 | 8.7%), and Accommodation & Food Services (8 | 7.8%).
Employment Industries by Sex in French Gulch
The French Gulch industries that see more men than women are Manufacturing (100.0%), Wholesale Trade (100.0%), and Transportation & Warehousing (100.0%), whereas the industries that tend to have a higher number of women are Retail Trade (100.0%), Real Estate, Rental & Leasing (100.0%), and Public Administration (88.2%).
| Industry | Male | Female |
| Agriculture, Fishing & Hunting | 0 (0.0%) | 0 (0.0%) |
| Mining, Quarrying, & Extraction | 0 (0.0%) | 0 (0.0%) |
| Construction | 0 (0.0%) | 0 (0.0%) |
| Manufacturing | 3 (100.0%) | 0 (0.0%) |
| Wholesale Trade | 7 (100.0%) | 0 (0.0%) |
| Retail Trade | 0 (0.0%) | 4 (100.0%) |
| Transportation & Warehousing | 7 (100.0%) | 0 (0.0%) |
| Utilities | 2 (100.0%) | 0 (0.0%) |
| Information | 1 (100.0%) | 0 (0.0%) |
| Finance & Insurance | 3 (100.0%) | 0 (0.0%) |
| Real Estate, Rental & Leasing | 0 (0.0%) | 5 (100.0%) |
| Professional & Scientific | 4 (44.4%) | 5 (55.6%) |
| Enterprise Management | 0 (0.0%) | 0 (0.0%) |
| Administrative & Support | 2 (100.0%) | 0 (0.0%) |
| Educational Services | 2 (22.2%) | 7 (77.8%) |
| Health Care & Social Assistance | 11 (55.0%) | 9 (45.0%) |
| Arts, Entertainment & Recreation | 2 (100.0%) | 0 (0.0%) |
| Accommodation & Food Services | 5 (62.5%) | 3 (37.5%) |
| Public Administration | 2 (11.8%) | 15 (88.2%) |
| Total | 53 (51.5%) | 50 (48.5%) |
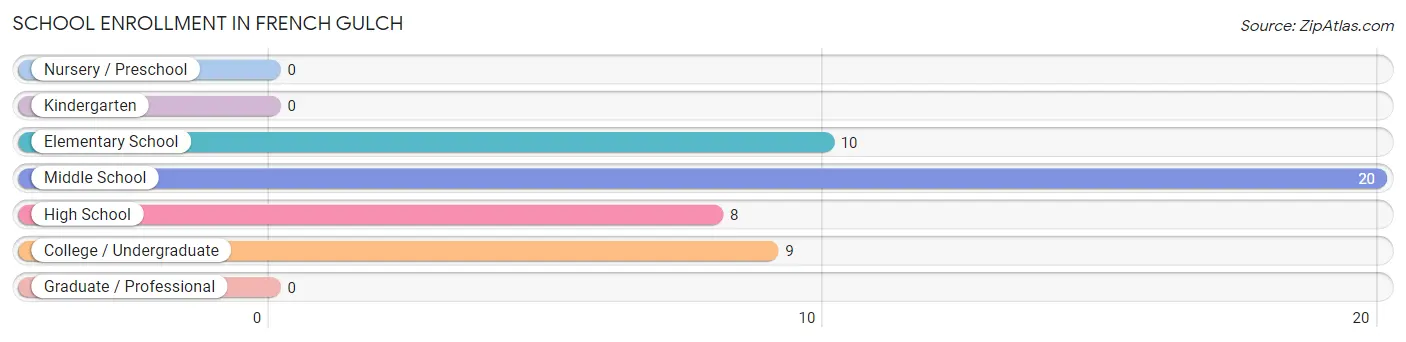
Education in French Gulch
School Enrollment in French Gulch
The most common levels of schooling among the 47 students in French Gulch are middle school (20 | 42.5%), elementary school (10 | 21.3%), and college / undergraduate (9 | 19.2%).
| School Level | # Students | % Students |
| Nursery / Preschool | 0 | 0.0% |
| Kindergarten | 0 | 0.0% |
| Elementary School | 10 | 21.3% |
| Middle School | 20 | 42.5% |
| High School | 8 | 17.0% |
| College / Undergraduate | 9 | 19.2% |
| Graduate / Professional | 0 | 0.0% |
| Total | 47 | 100.0% |
School Enrollment by Age by Funding Source in French Gulch
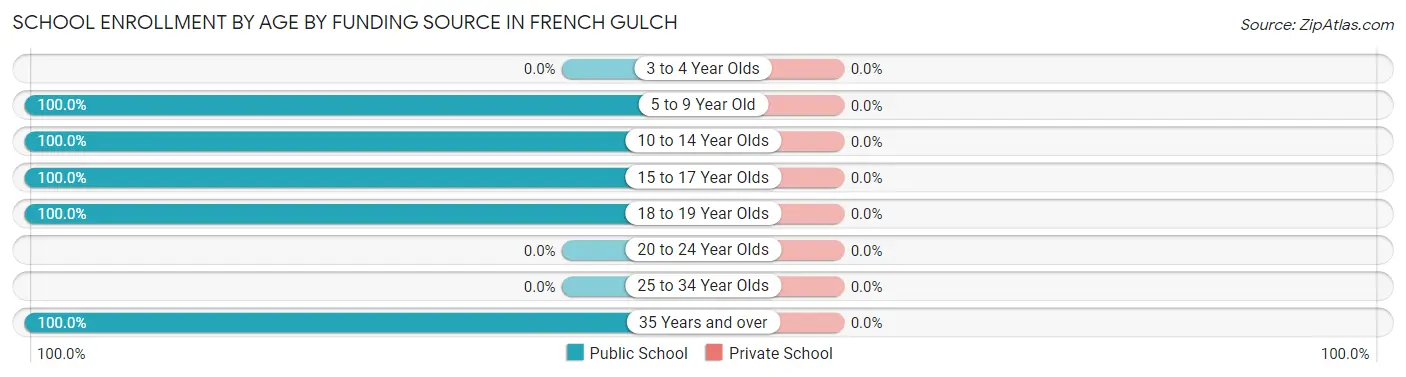
| Age Bracket | Public School | Private School |
| 3 to 4 Year Olds | 0 (0.0%) | 0 (0.0%) |
| 5 to 9 Year Old | 10 (100.0%) | 0 (0.0%) |
| 10 to 14 Year Olds | 20 (100.0%) | 0 (0.0%) |
| 15 to 17 Year Olds | 8 (100.0%) | 0 (0.0%) |
| 18 to 19 Year Olds | 5 (100.0%) | 0 (0.0%) |
| 20 to 24 Year Olds | 0 (0.0%) | 0 (0.0%) |
| 25 to 34 Year Olds | 0 (0.0%) | 0 (0.0%) |
| 35 Years and over | 4 (100.0%) | 0 (0.0%) |
| Total | 47 (100.0%) | 0 (0.0%) |
Educational Attainment by Field of Study in French Gulch
Business (12 | 20.7%), physical & health sciences (7 | 12.1%), psychology (7 | 12.1%), social sciences (7 | 12.1%), and science & technology (6 | 10.3%) are the most common fields of study among 58 individuals in French Gulch who have obtained a bachelor's degree or higher.
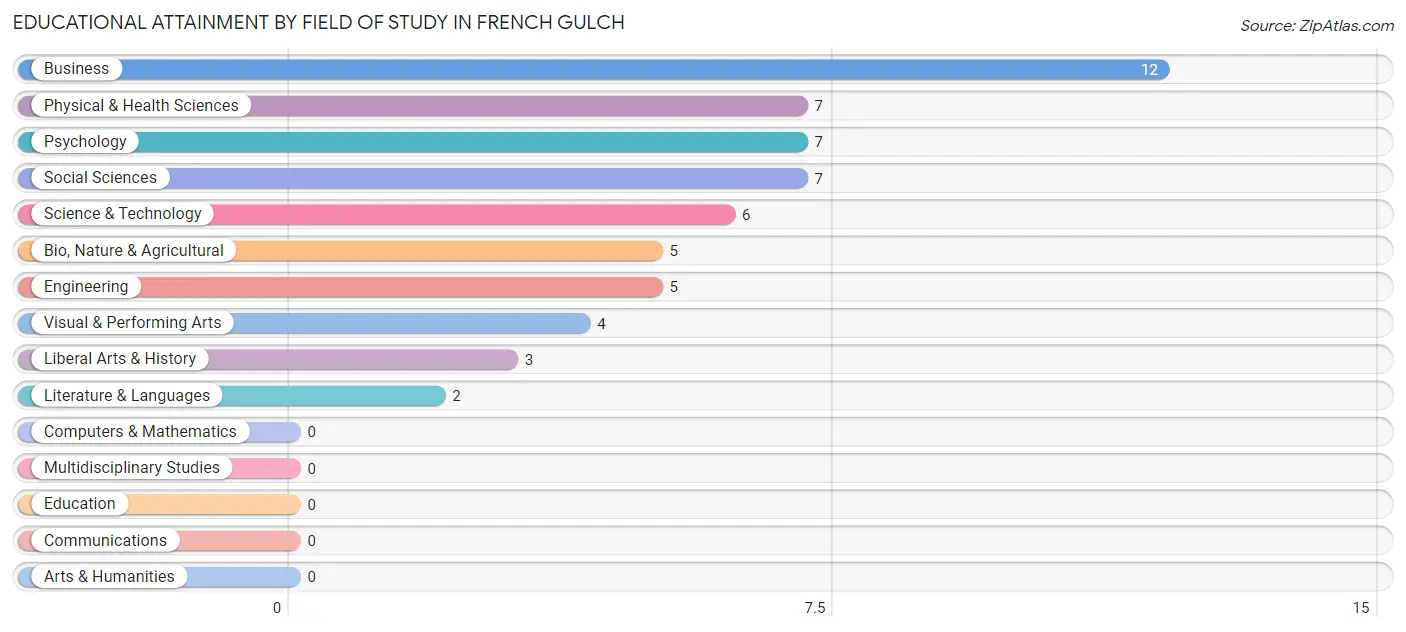
| Field of Study | # Graduates | % Graduates |
| Computers & Mathematics | 0 | 0.0% |
| Bio, Nature & Agricultural | 5 | 8.6% |
| Physical & Health Sciences | 7 | 12.1% |
| Psychology | 7 | 12.1% |
| Social Sciences | 7 | 12.1% |
| Engineering | 5 | 8.6% |
| Multidisciplinary Studies | 0 | 0.0% |
| Science & Technology | 6 | 10.3% |
| Business | 12 | 20.7% |
| Education | 0 | 0.0% |
| Literature & Languages | 2 | 3.5% |
| Liberal Arts & History | 3 | 5.2% |
| Visual & Performing Arts | 4 | 6.9% |
| Communications | 0 | 0.0% |
| Arts & Humanities | 0 | 0.0% |
| Total | 58 | 100.0% |
Transportation & Commute in French Gulch
Vehicle Availability by Sex in French Gulch
The most prevalent vehicle ownership categories in French Gulch are males with 3 vehicles (27, accounting for 52.9%) and females with 3 vehicles (29, making up 58.7%).
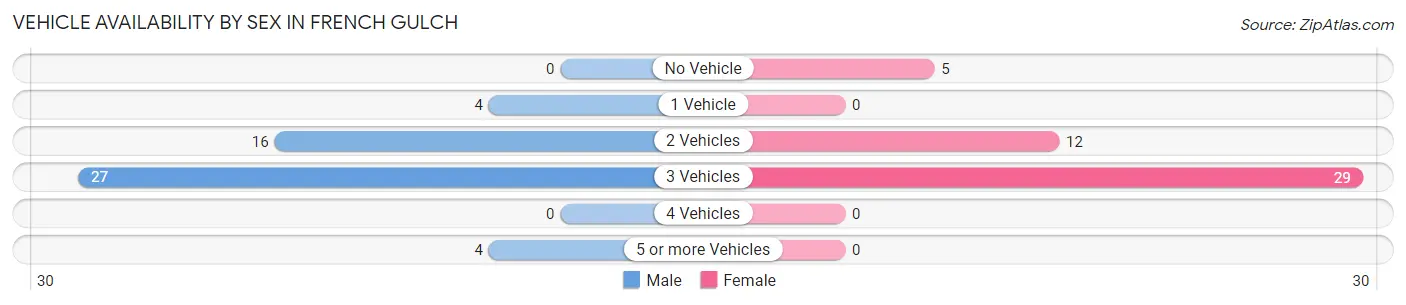
| Vehicles Available | Male | Female |
| No Vehicle | 0 (0.0%) | 5 (10.9%) |
| 1 Vehicle | 4 (7.8%) | 0 (0.0%) |
| 2 Vehicles | 16 (31.4%) | 12 (26.1%) |
| 3 Vehicles | 27 (52.9%) | 29 (63.0%) |
| 4 Vehicles | 0 (0.0%) | 0 (0.0%) |
| 5 or more Vehicles | 4 (7.8%) | 0 (0.0%) |
| Total | 51 (100.0%) | 46 (100.0%) |
Commute Time in French Gulch
The most frequently occuring commute durations in French Gulch are 45 to 59 minutes (18 commuters, 21.7%), 30 to 34 minutes (15 commuters, 18.1%), and 40 to 44 minutes (10 commuters, 12.0%).
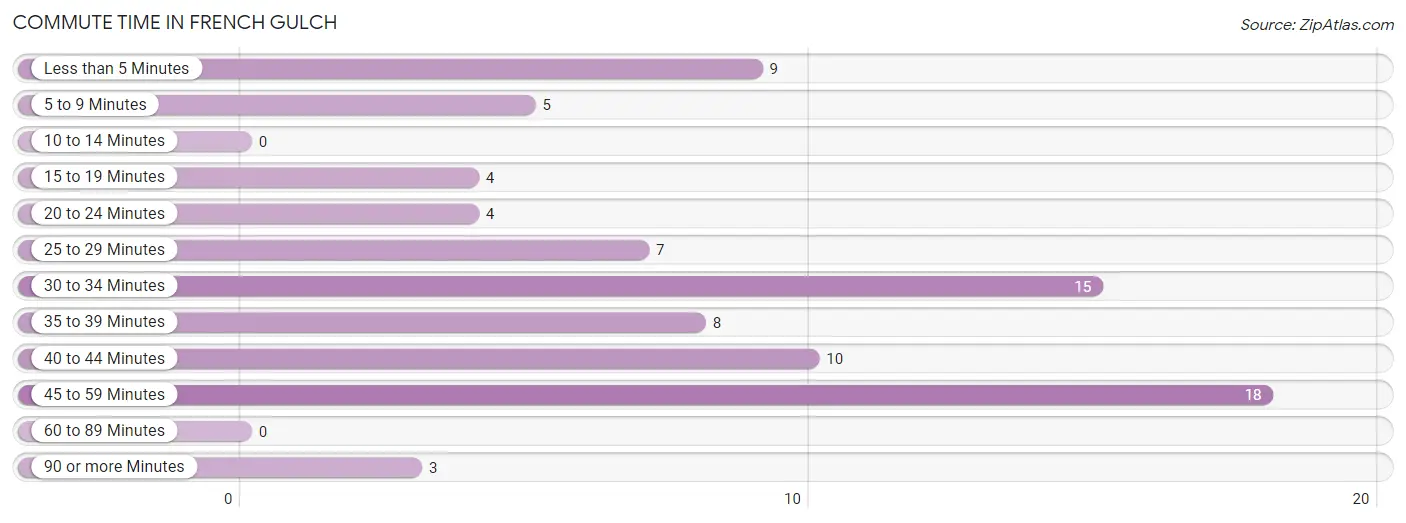
| Commute Time | # Commuters | % Commuters |
| Less than 5 Minutes | 9 | 10.8% |
| 5 to 9 Minutes | 5 | 6.0% |
| 10 to 14 Minutes | 0 | 0.0% |
| 15 to 19 Minutes | 4 | 4.8% |
| 20 to 24 Minutes | 4 | 4.8% |
| 25 to 29 Minutes | 7 | 8.4% |
| 30 to 34 Minutes | 15 | 18.1% |
| 35 to 39 Minutes | 8 | 9.6% |
| 40 to 44 Minutes | 10 | 12.0% |
| 45 to 59 Minutes | 18 | 21.7% |
| 60 to 89 Minutes | 0 | 0.0% |
| 90 or more Minutes | 3 | 3.6% |
Commute Time by Sex in French Gulch
The most common commute times in French Gulch are 45 to 59 minutes (14 commuters, 31.8%) for males and 35 to 39 minutes (8 commuters, 20.5%) for females.
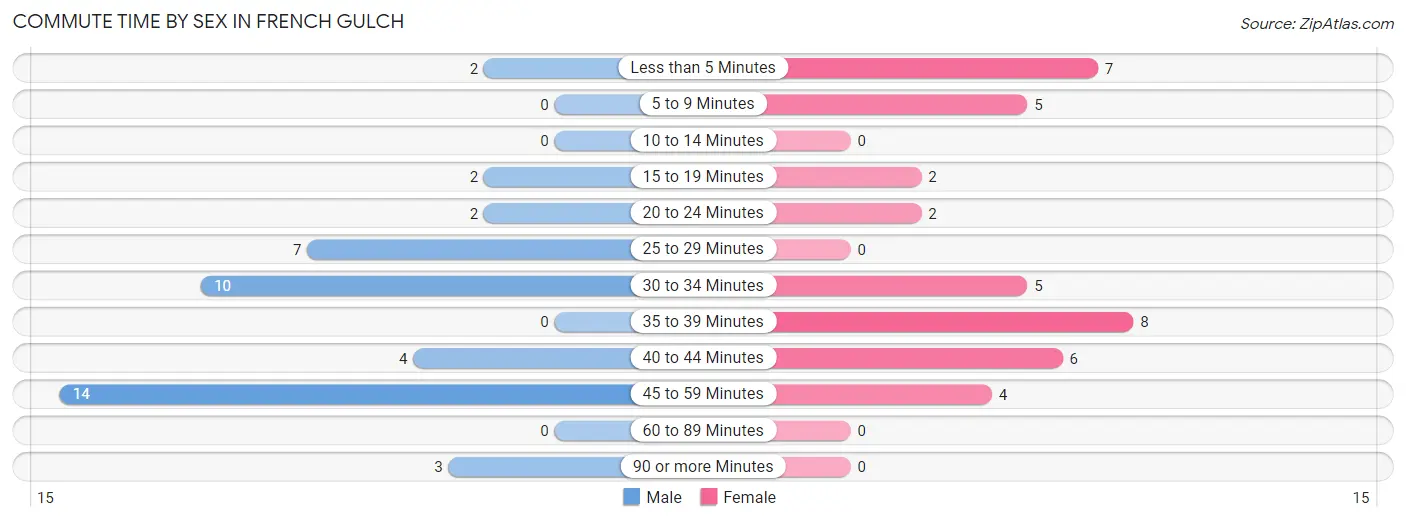
| Commute Time | Male | Female |
| Less than 5 Minutes | 2 (4.5%) | 7 (17.9%) |
| 5 to 9 Minutes | 0 (0.0%) | 5 (12.8%) |
| 10 to 14 Minutes | 0 (0.0%) | 0 (0.0%) |
| 15 to 19 Minutes | 2 (4.5%) | 2 (5.1%) |
| 20 to 24 Minutes | 2 (4.5%) | 2 (5.1%) |
| 25 to 29 Minutes | 7 (15.9%) | 0 (0.0%) |
| 30 to 34 Minutes | 10 (22.7%) | 5 (12.8%) |
| 35 to 39 Minutes | 0 (0.0%) | 8 (20.5%) |
| 40 to 44 Minutes | 4 (9.1%) | 6 (15.4%) |
| 45 to 59 Minutes | 14 (31.8%) | 4 (10.3%) |
| 60 to 89 Minutes | 0 (0.0%) | 0 (0.0%) |
| 90 or more Minutes | 3 (6.8%) | 0 (0.0%) |
Time of Departure to Work by Sex in French Gulch
The most frequent times of departure to work in French Gulch are 7:00 AM to 7:29 AM (10, 22.7%) for males and 7:00 AM to 7:29 AM (18, 46.2%) for females.
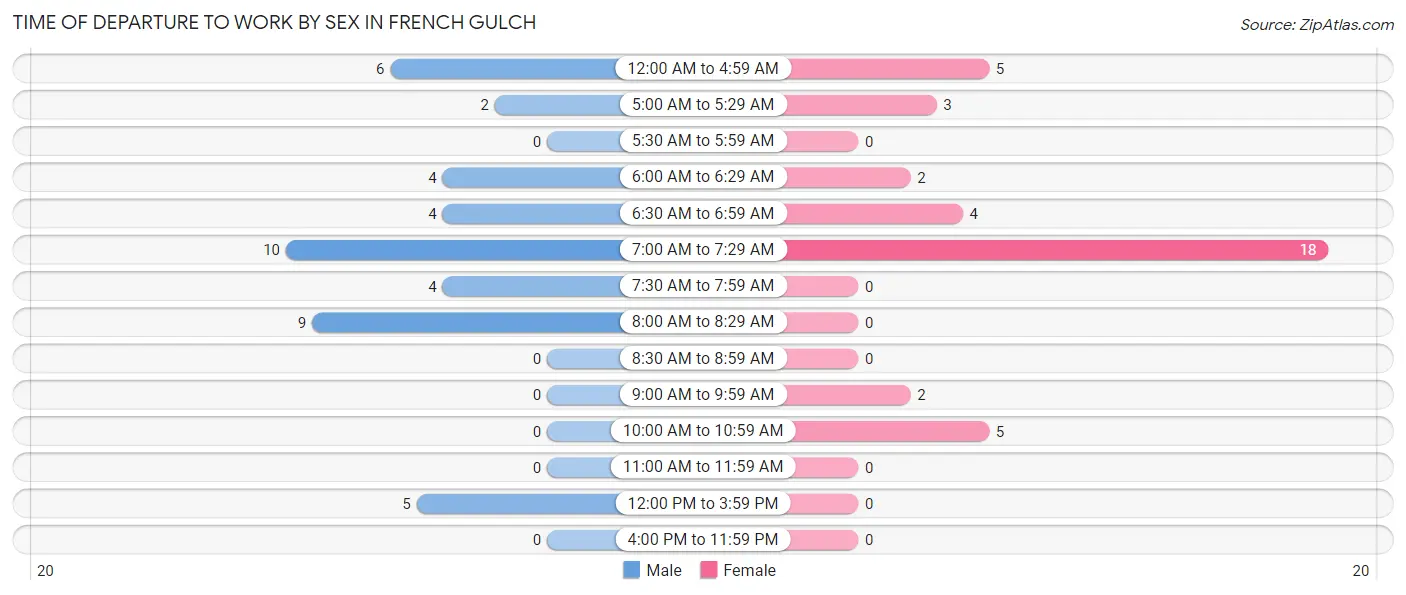
| Time of Departure | Male | Female |
| 12:00 AM to 4:59 AM | 6 (13.6%) | 5 (12.8%) |
| 5:00 AM to 5:29 AM | 2 (4.5%) | 3 (7.7%) |
| 5:30 AM to 5:59 AM | 0 (0.0%) | 0 (0.0%) |
| 6:00 AM to 6:29 AM | 4 (9.1%) | 2 (5.1%) |
| 6:30 AM to 6:59 AM | 4 (9.1%) | 4 (10.3%) |
| 7:00 AM to 7:29 AM | 10 (22.7%) | 18 (46.2%) |
| 7:30 AM to 7:59 AM | 4 (9.1%) | 0 (0.0%) |
| 8:00 AM to 8:29 AM | 9 (20.4%) | 0 (0.0%) |
| 8:30 AM to 8:59 AM | 0 (0.0%) | 0 (0.0%) |
| 9:00 AM to 9:59 AM | 0 (0.0%) | 2 (5.1%) |
| 10:00 AM to 10:59 AM | 0 (0.0%) | 5 (12.8%) |
| 11:00 AM to 11:59 AM | 0 (0.0%) | 0 (0.0%) |
| 12:00 PM to 3:59 PM | 5 (11.4%) | 0 (0.0%) |
| 4:00 PM to 11:59 PM | 0 (0.0%) | 0 (0.0%) |
| Total | 44 (100.0%) | 39 (100.0%) |
Housing Occupancy in French Gulch
Occupancy by Ownership in French Gulch
Of the total 107 dwellings in French Gulch, owner-occupied units account for 84 (78.5%), while renter-occupied units make up 23 (21.5%).
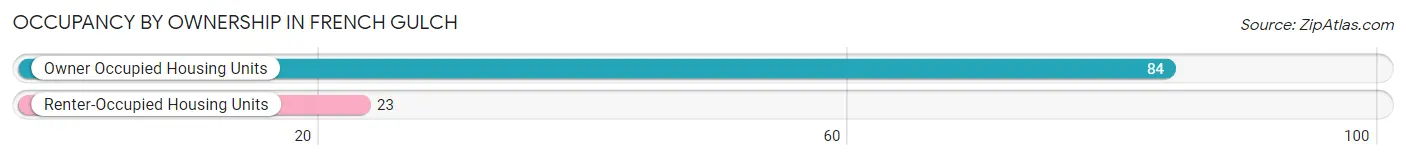
| Occupancy | # Housing Units | % Housing Units |
| Owner Occupied Housing Units | 84 | 78.5% |
| Renter-Occupied Housing Units | 23 | 21.5% |
| Total Occupied Housing Units | 107 | 100.0% |
Occupancy by Household Size in French Gulch
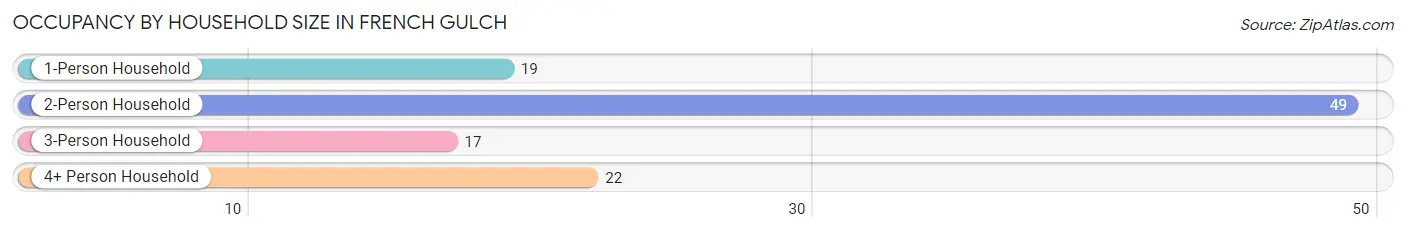
| Household Size | # Housing Units | % Housing Units |
| 1-Person Household | 19 | 17.8% |
| 2-Person Household | 49 | 45.8% |
| 3-Person Household | 17 | 15.9% |
| 4+ Person Household | 22 | 20.6% |
| Total Housing Units | 107 | 100.0% |
Occupancy by Ownership by Household Size in French Gulch
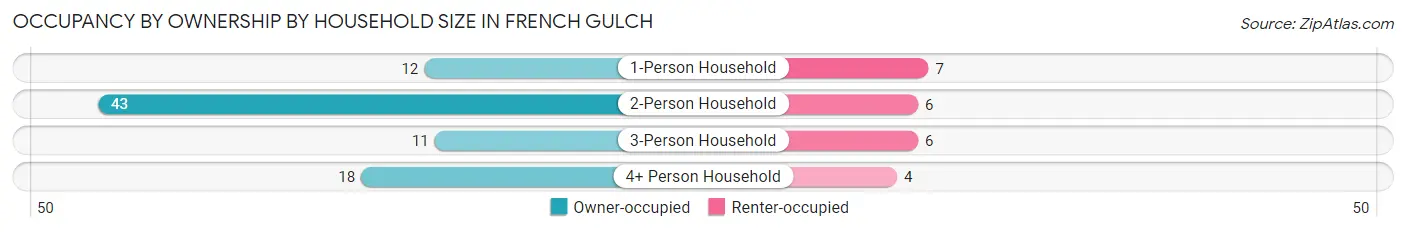
| Household Size | Owner-occupied | Renter-occupied |
| 1-Person Household | 12 (63.2%) | 7 (36.8%) |
| 2-Person Household | 43 (87.8%) | 6 (12.2%) |
| 3-Person Household | 11 (64.7%) | 6 (35.3%) |
| 4+ Person Household | 18 (81.8%) | 4 (18.2%) |
| Total Housing Units | 84 (78.5%) | 23 (21.5%) |
Occupancy by Educational Attainment in French Gulch
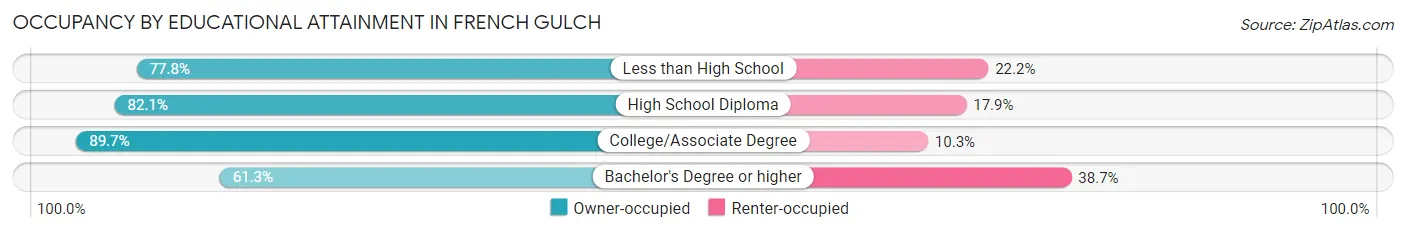
| Household Size | Owner-occupied | Renter-occupied |
| Less than High School | 7 (77.8%) | 2 (22.2%) |
| High School Diploma | 23 (82.1%) | 5 (17.9%) |
| College/Associate Degree | 35 (89.7%) | 4 (10.3%) |
| Bachelor's Degree or higher | 19 (61.3%) | 12 (38.7%) |
Occupancy by Age of Householder in French Gulch
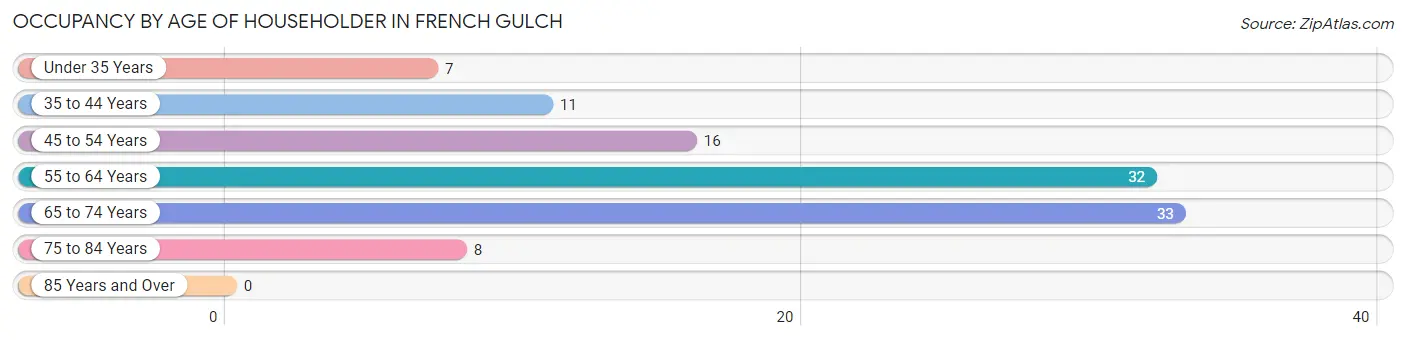
| Age Bracket | # Households | % Households |
| Under 35 Years | 7 | 6.5% |
| 35 to 44 Years | 11 | 10.3% |
| 45 to 54 Years | 16 | 14.9% |
| 55 to 64 Years | 32 | 29.9% |
| 65 to 74 Years | 33 | 30.8% |
| 75 to 84 Years | 8 | 7.5% |
| 85 Years and Over | 0 | 0.0% |
| Total | 107 | 100.0% |
Housing Finances in French Gulch
Median Income by Occupancy in French Gulch
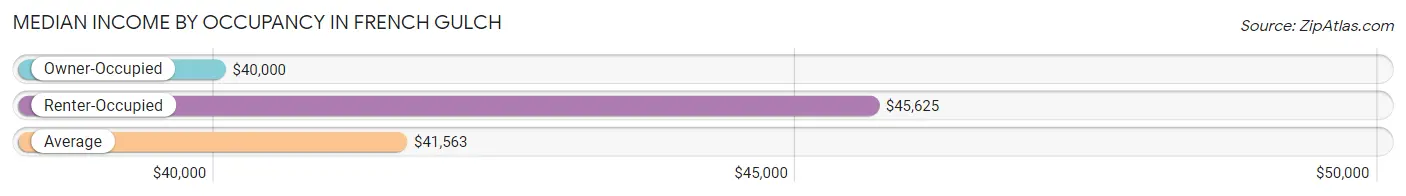
| Occupancy Type | # Households | Median Income |
| Owner-Occupied | 84 (78.5%) | $40,000 |
| Renter-Occupied | 23 (21.5%) | $45,625 |
| Average | 107 (100.0%) | $41,563 |
Occupancy by Householder Income Bracket in French Gulch
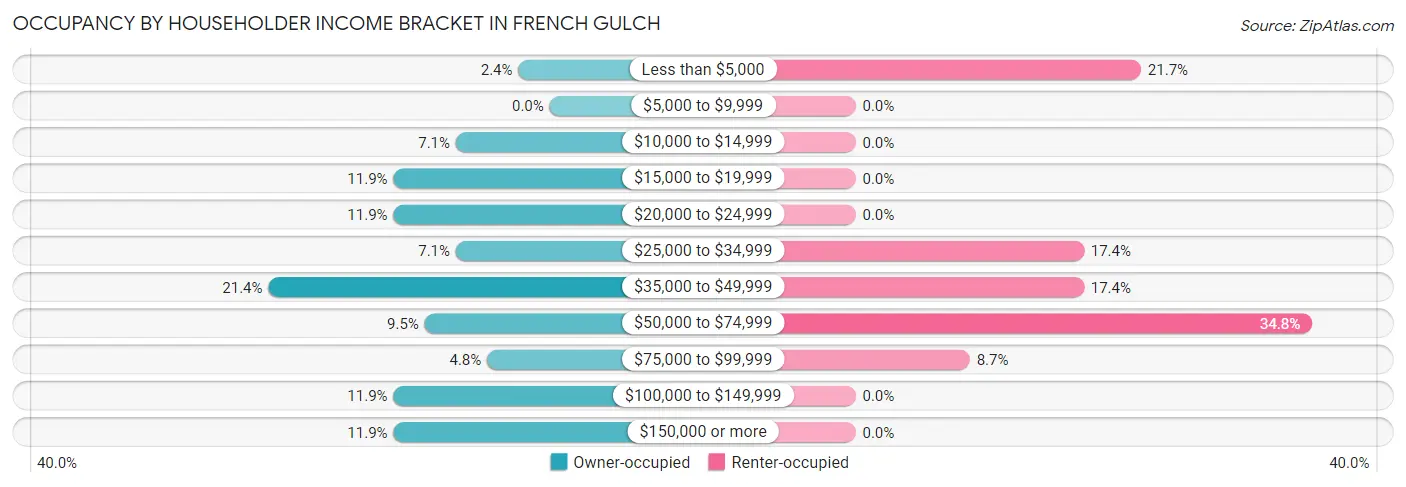
| Income Bracket | Owner-occupied | Renter-occupied |
| Less than $5,000 | 2 (2.4%) | 5 (21.7%) |
| $5,000 to $9,999 | 0 (0.0%) | 0 (0.0%) |
| $10,000 to $14,999 | 6 (7.1%) | 0 (0.0%) |
| $15,000 to $19,999 | 10 (11.9%) | 0 (0.0%) |
| $20,000 to $24,999 | 10 (11.9%) | 0 (0.0%) |
| $25,000 to $34,999 | 6 (7.1%) | 4 (17.4%) |
| $35,000 to $49,999 | 18 (21.4%) | 4 (17.4%) |
| $50,000 to $74,999 | 8 (9.5%) | 8 (34.8%) |
| $75,000 to $99,999 | 4 (4.8%) | 2 (8.7%) |
| $100,000 to $149,999 | 10 (11.9%) | 0 (0.0%) |
| $150,000 or more | 10 (11.9%) | 0 (0.0%) |
| Total | 84 (100.0%) | 23 (100.0%) |
Monthly Housing Cost Tiers in French Gulch
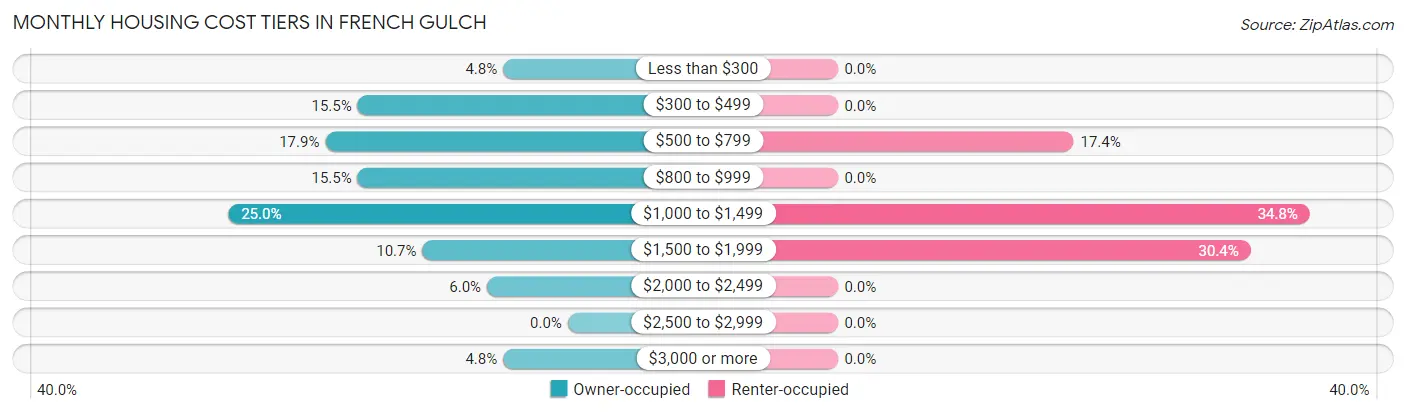
| Monthly Cost | Owner-occupied | Renter-occupied |
| Less than $300 | 4 (4.8%) | 0 (0.0%) |
| $300 to $499 | 13 (15.5%) | 0 (0.0%) |
| $500 to $799 | 15 (17.9%) | 4 (17.4%) |
| $800 to $999 | 13 (15.5%) | 0 (0.0%) |
| $1,000 to $1,499 | 21 (25.0%) | 8 (34.8%) |
| $1,500 to $1,999 | 9 (10.7%) | 7 (30.4%) |
| $2,000 to $2,499 | 5 (5.9%) | 0 (0.0%) |
| $2,500 to $2,999 | 0 (0.0%) | 0 (0.0%) |
| $3,000 or more | 4 (4.8%) | 0 (0.0%) |
| Total | 84 (100.0%) | 23 (100.0%) |
Physical Housing Characteristics in French Gulch
Housing Structures in French Gulch
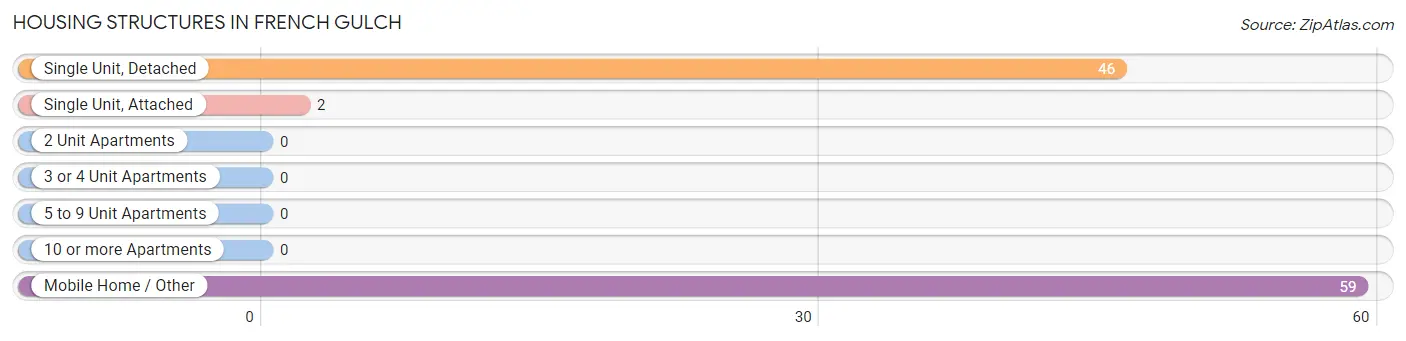
| Structure Type | # Housing Units | % Housing Units |
| Single Unit, Detached | 46 | 43.0% |
| Single Unit, Attached | 2 | 1.9% |
| 2 Unit Apartments | 0 | 0.0% |
| 3 or 4 Unit Apartments | 0 | 0.0% |
| 5 to 9 Unit Apartments | 0 | 0.0% |
| 10 or more Apartments | 0 | 0.0% |
| Mobile Home / Other | 59 | 55.1% |
| Total | 107 | 100.0% |
Housing Structures by Occupancy in French Gulch
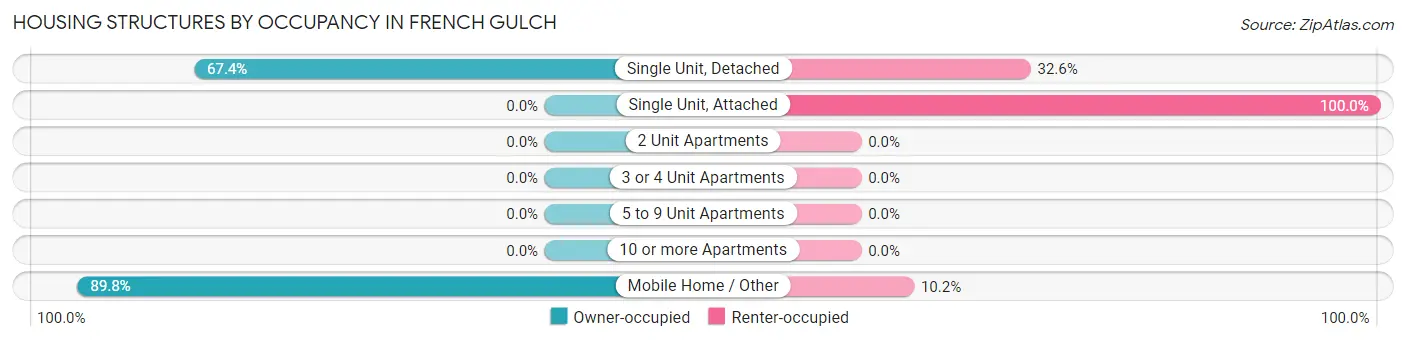
| Structure Type | Owner-occupied | Renter-occupied |
| Single Unit, Detached | 31 (67.4%) | 15 (32.6%) |
| Single Unit, Attached | 0 (0.0%) | 2 (100.0%) |
| 2 Unit Apartments | 0 (0.0%) | 0 (0.0%) |
| 3 or 4 Unit Apartments | 0 (0.0%) | 0 (0.0%) |
| 5 to 9 Unit Apartments | 0 (0.0%) | 0 (0.0%) |
| 10 or more Apartments | 0 (0.0%) | 0 (0.0%) |
| Mobile Home / Other | 53 (89.8%) | 6 (10.2%) |
| Total | 84 (78.5%) | 23 (21.5%) |
Housing Structures by Number of Rooms in French Gulch
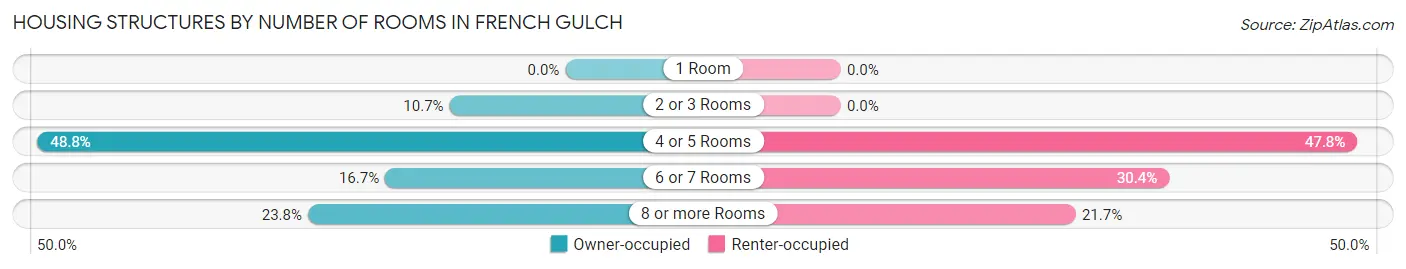
| Number of Rooms | Owner-occupied | Renter-occupied |
| 1 Room | 0 (0.0%) | 0 (0.0%) |
| 2 or 3 Rooms | 9 (10.7%) | 0 (0.0%) |
| 4 or 5 Rooms | 41 (48.8%) | 11 (47.8%) |
| 6 or 7 Rooms | 14 (16.7%) | 7 (30.4%) |
| 8 or more Rooms | 20 (23.8%) | 5 (21.7%) |
| Total | 84 (100.0%) | 23 (100.0%) |
Housing Structure by Heating Type in French Gulch
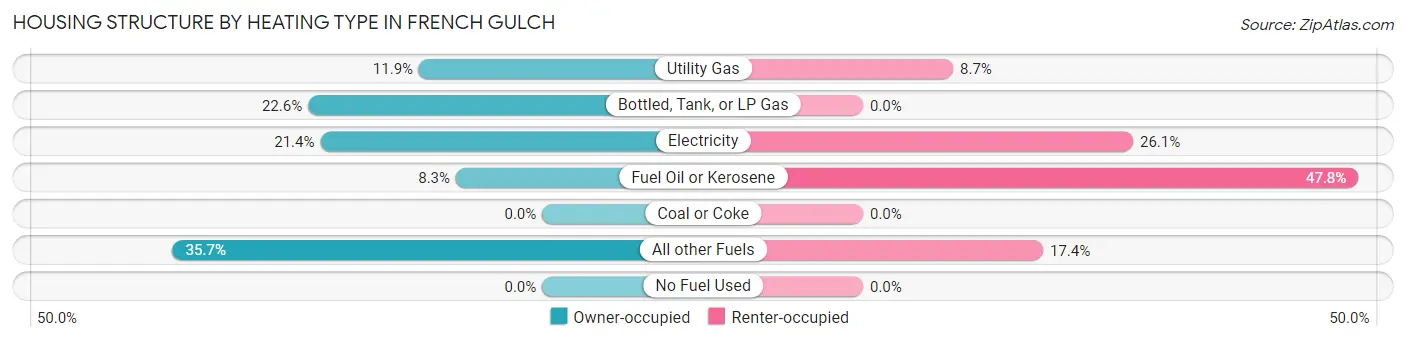
| Heating Type | Owner-occupied | Renter-occupied |
| Utility Gas | 10 (11.9%) | 2 (8.7%) |
| Bottled, Tank, or LP Gas | 19 (22.6%) | 0 (0.0%) |
| Electricity | 18 (21.4%) | 6 (26.1%) |
| Fuel Oil or Kerosene | 7 (8.3%) | 11 (47.8%) |
| Coal or Coke | 0 (0.0%) | 0 (0.0%) |
| All other Fuels | 30 (35.7%) | 4 (17.4%) |
| No Fuel Used | 0 (0.0%) | 0 (0.0%) |
| Total | 84 (100.0%) | 23 (100.0%) |
Household Vehicle Usage in French Gulch
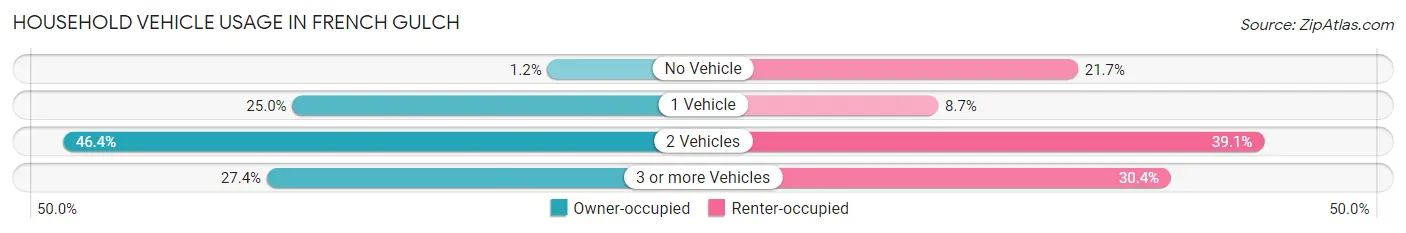
| Vehicles per Household | Owner-occupied | Renter-occupied |
| No Vehicle | 1 (1.2%) | 5 (21.7%) |
| 1 Vehicle | 21 (25.0%) | 2 (8.7%) |
| 2 Vehicles | 39 (46.4%) | 9 (39.1%) |
| 3 or more Vehicles | 23 (27.4%) | 7 (30.4%) |
| Total | 84 (100.0%) | 23 (100.0%) |
Real Estate & Mortgages in French Gulch
Real Estate and Mortgage Overview in French Gulch
| Characteristic | Without Mortgage | With Mortgage |
| Housing Units | 54 | 30 |
| Median Property Value | $82,900 | $212,500 |
| Median Household Income | $35,000 | $3 |
| Monthly Housing Costs | $688 | $4 |
| Real Estate Taxes | $440 | $2 |
Property Value by Mortgage Status in French Gulch
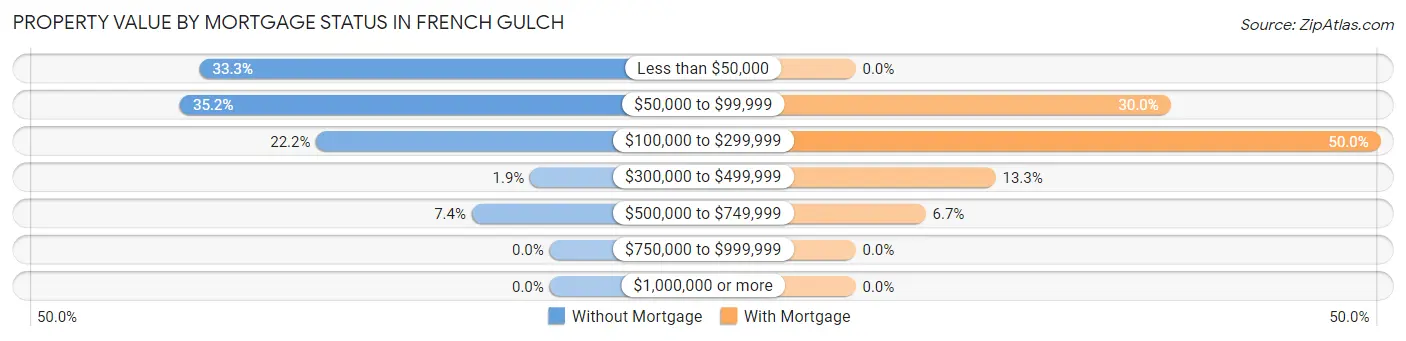
| Property Value | Without Mortgage | With Mortgage |
| Less than $50,000 | 18 (33.3%) | 0 (0.0%) |
| $50,000 to $99,999 | 19 (35.2%) | 9 (30.0%) |
| $100,000 to $299,999 | 12 (22.2%) | 15 (50.0%) |
| $300,000 to $499,999 | 1 (1.8%) | 4 (13.3%) |
| $500,000 to $749,999 | 4 (7.4%) | 2 (6.7%) |
| $750,000 to $999,999 | 0 (0.0%) | 0 (0.0%) |
| $1,000,000 or more | 0 (0.0%) | 0 (0.0%) |
| Total | 54 (100.0%) | 30 (100.0%) |
Household Income by Mortgage Status in French Gulch
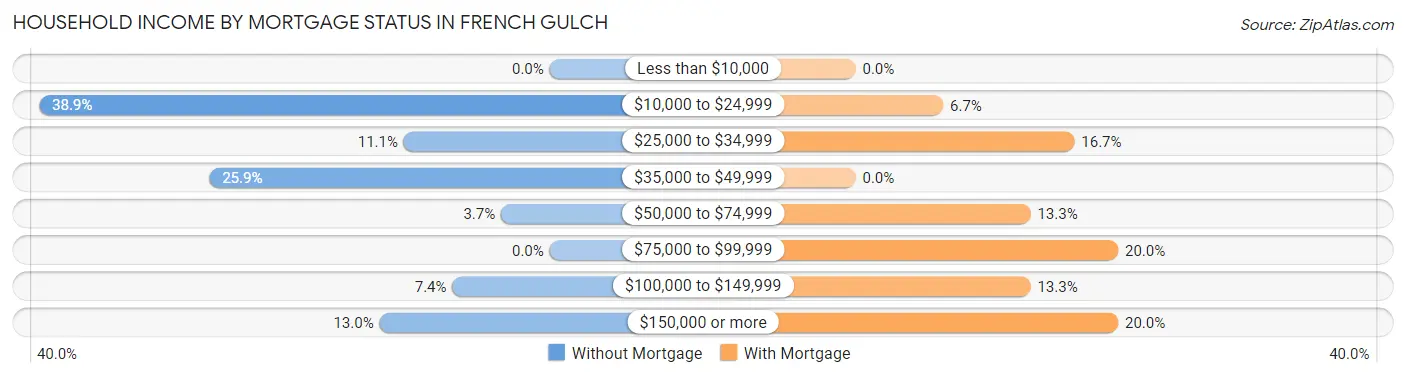
| Household Income | Without Mortgage | With Mortgage |
| Less than $10,000 | 0 (0.0%) | 0 (0.0%) |
| $10,000 to $24,999 | 21 (38.9%) | 2 (6.7%) |
| $25,000 to $34,999 | 6 (11.1%) | 5 (16.7%) |
| $35,000 to $49,999 | 14 (25.9%) | 0 (0.0%) |
| $50,000 to $74,999 | 2 (3.7%) | 4 (13.3%) |
| $75,000 to $99,999 | 0 (0.0%) | 6 (20.0%) |
| $100,000 to $149,999 | 4 (7.4%) | 4 (13.3%) |
| $150,000 or more | 7 (13.0%) | 6 (20.0%) |
| Total | 54 (100.0%) | 30 (100.0%) |
Property Value to Household Income Ratio in French Gulch
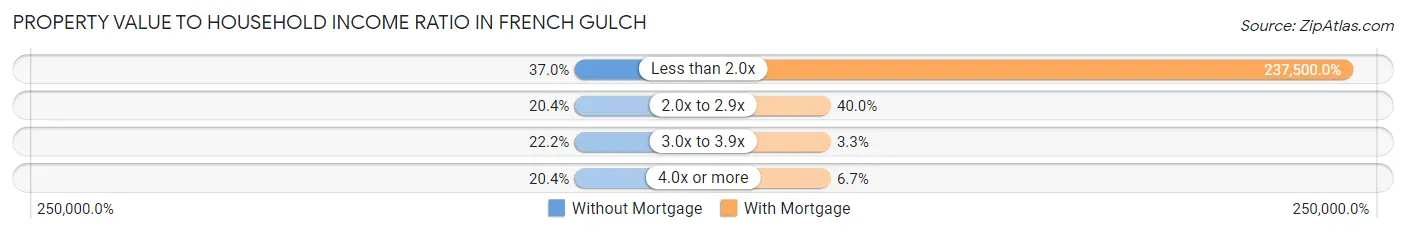
| Value-to-Income Ratio | Without Mortgage | With Mortgage |
| Less than 2.0x | 20 (37.0%) | 71,250 (237,500.0%) |
| 2.0x to 2.9x | 11 (20.4%) | 12 (40.0%) |
| 3.0x to 3.9x | 12 (22.2%) | 1 (3.3%) |
| 4.0x or more | 11 (20.4%) | 2 (6.7%) |
| Total | 54 (100.0%) | 30 (100.0%) |
Real Estate Taxes by Mortgage Status in French Gulch
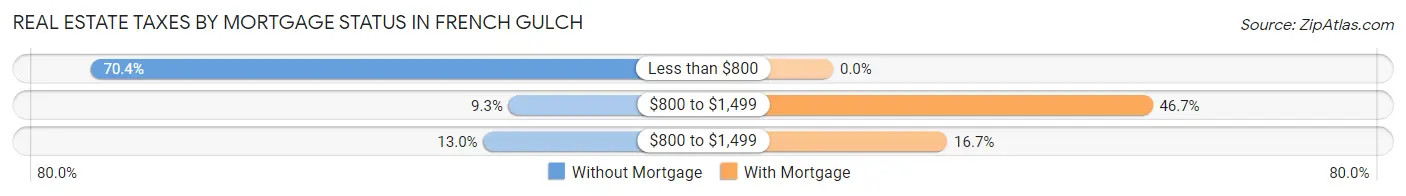
| Property Taxes | Without Mortgage | With Mortgage |
| Less than $800 | 38 (70.4%) | 0 (0.0%) |
| $800 to $1,499 | 5 (9.3%) | 14 (46.7%) |
| $800 to $1,499 | 7 (13.0%) | 5 (16.7%) |
| Total | 54 (100.0%) | 30 (100.0%) |
Health & Disability in French Gulch
Health Insurance Coverage by Age in French Gulch
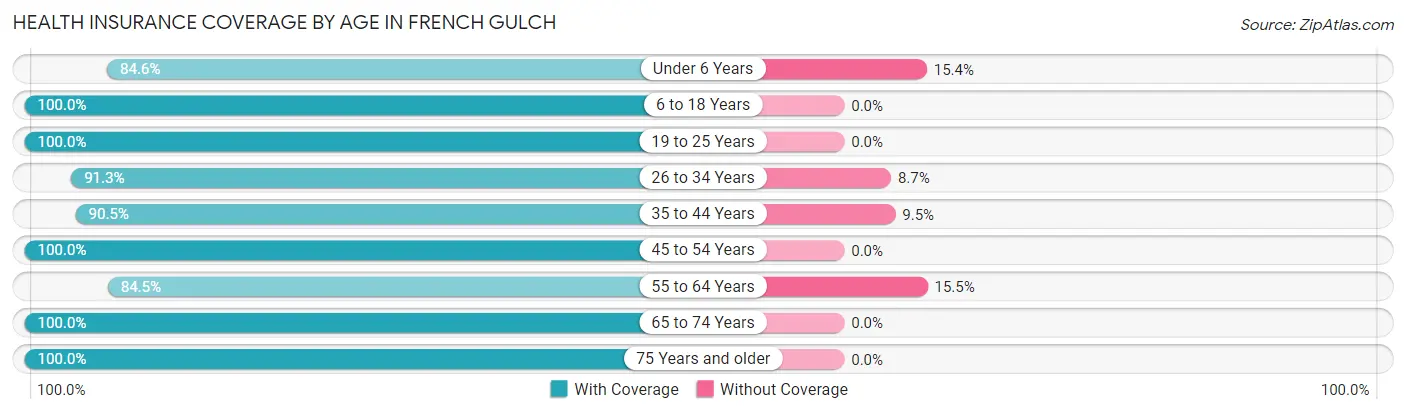
| Age Bracket | With Coverage | Without Coverage |
| Under 6 Years | 11 (84.6%) | 2 (15.4%) |
| 6 to 18 Years | 44 (100.0%) | 0 (0.0%) |
| 19 to 25 Years | 9 (100.0%) | 0 (0.0%) |
| 26 to 34 Years | 21 (91.3%) | 2 (8.7%) |
| 35 to 44 Years | 19 (90.5%) | 2 (9.5%) |
| 45 to 54 Years | 29 (100.0%) | 0 (0.0%) |
| 55 to 64 Years | 49 (84.5%) | 9 (15.5%) |
| 65 to 74 Years | 70 (100.0%) | 0 (0.0%) |
| 75 Years and older | 16 (100.0%) | 0 (0.0%) |
| Total | 268 (94.7%) | 15 (5.3%) |
Health Insurance Coverage by Citizenship Status in French Gulch
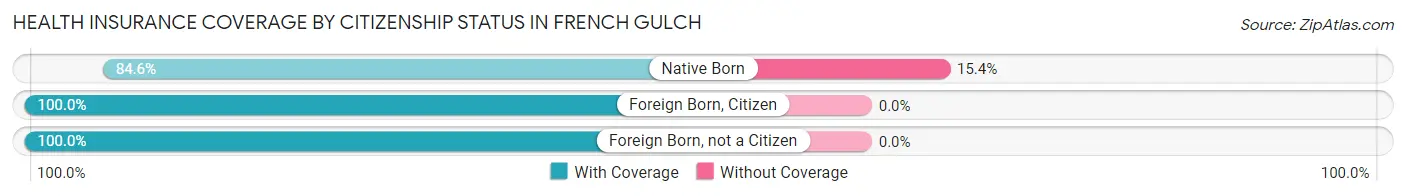
| Citizenship Status | With Coverage | Without Coverage |
| Native Born | 11 (84.6%) | 2 (15.4%) |
| Foreign Born, Citizen | 44 (100.0%) | 0 (0.0%) |
| Foreign Born, not a Citizen | 9 (100.0%) | 0 (0.0%) |
Health Insurance Coverage by Household Income in French Gulch
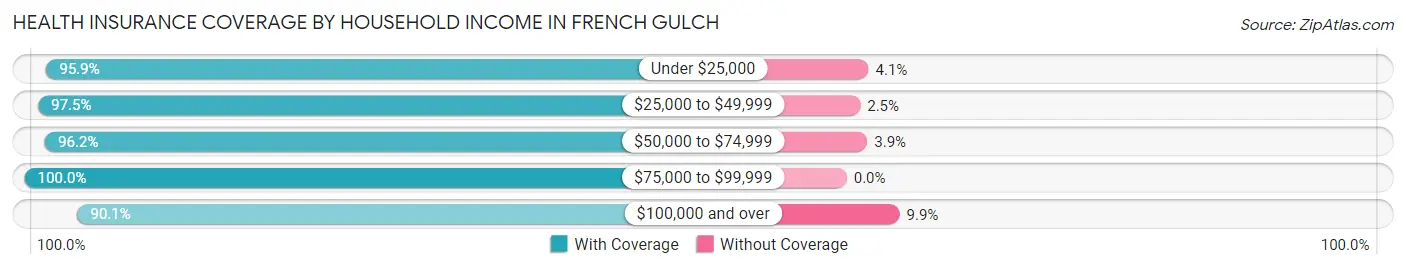
| Household Income | With Coverage | Without Coverage |
| Under $25,000 | 47 (95.9%) | 2 (4.1%) |
| $25,000 to $49,999 | 77 (97.5%) | 2 (2.5%) |
| $50,000 to $74,999 | 50 (96.2%) | 2 (3.8%) |
| $75,000 to $99,999 | 12 (100.0%) | 0 (0.0%) |
| $100,000 and over | 82 (90.1%) | 9 (9.9%) |
Public vs Private Health Insurance Coverage by Age in French Gulch
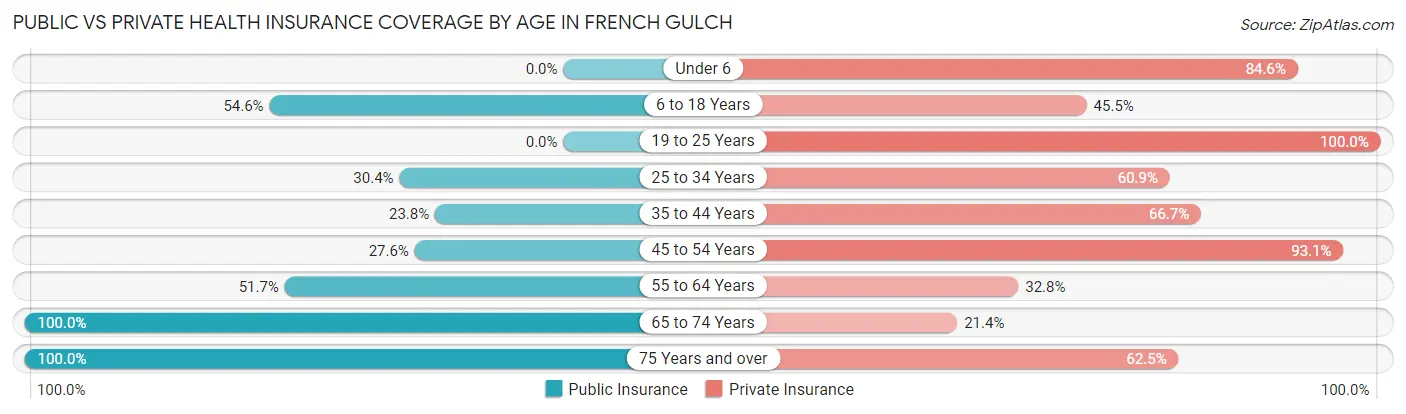
| Age Bracket | Public Insurance | Private Insurance |
| Under 6 | 0 (0.0%) | 11 (84.6%) |
| 6 to 18 Years | 24 (54.5%) | 20 (45.5%) |
| 19 to 25 Years | 0 (0.0%) | 9 (100.0%) |
| 25 to 34 Years | 7 (30.4%) | 14 (60.9%) |
| 35 to 44 Years | 5 (23.8%) | 14 (66.7%) |
| 45 to 54 Years | 8 (27.6%) | 27 (93.1%) |
| 55 to 64 Years | 30 (51.7%) | 19 (32.8%) |
| 65 to 74 Years | 70 (100.0%) | 15 (21.4%) |
| 75 Years and over | 16 (100.0%) | 10 (62.5%) |
| Total | 160 (56.5%) | 139 (49.1%) |
Disability Status by Sex by Age in French Gulch
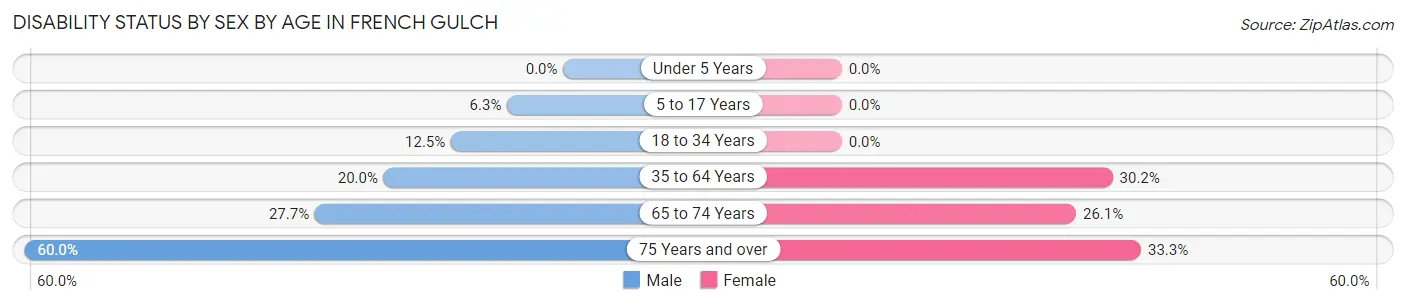
| Age Bracket | Male | Female |
| Under 5 Years | 0 (0.0%) | 0 (0.0%) |
| 5 to 17 Years | 2 (6.2%) | 0 (0.0%) |
| 18 to 34 Years | 2 (12.5%) | 0 (0.0%) |
| 35 to 64 Years | 9 (20.0%) | 19 (30.2%) |
| 65 to 74 Years | 13 (27.7%) | 6 (26.1%) |
| 75 Years and over | 6 (60.0%) | 2 (33.3%) |
Disability Class by Sex by Age in French Gulch
Disability Class: Hearing Difficulty
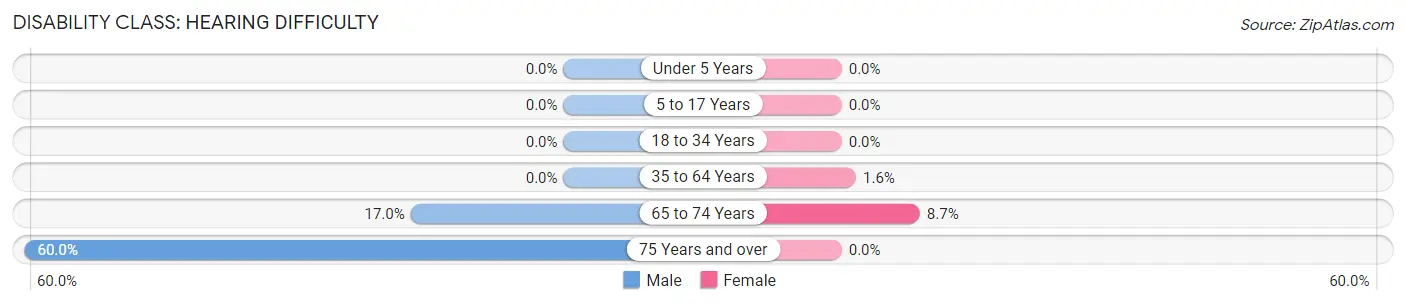
| Age Bracket | Male | Female |
| Under 5 Years | 0 (0.0%) | 0 (0.0%) |
| 5 to 17 Years | 0 (0.0%) | 0 (0.0%) |
| 18 to 34 Years | 0 (0.0%) | 0 (0.0%) |
| 35 to 64 Years | 0 (0.0%) | 1 (1.6%) |
| 65 to 74 Years | 8 (17.0%) | 2 (8.7%) |
| 75 Years and over | 6 (60.0%) | 0 (0.0%) |
Disability Class: Vision Difficulty
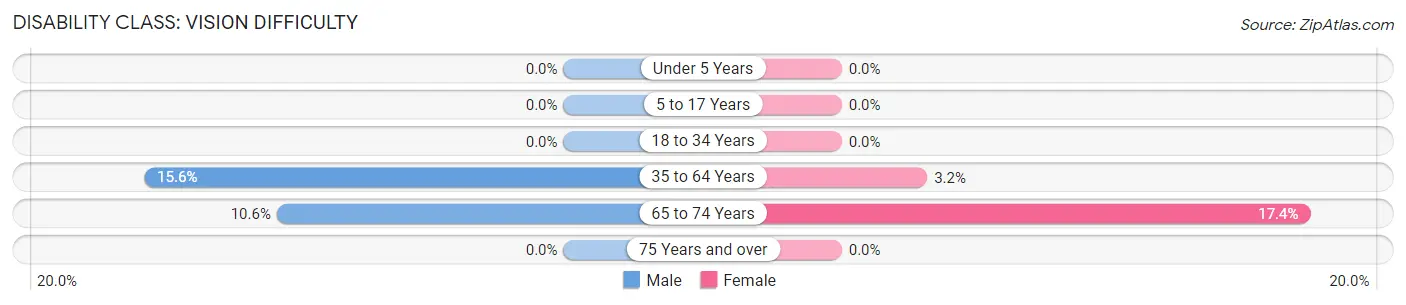
| Age Bracket | Male | Female |
| Under 5 Years | 0 (0.0%) | 0 (0.0%) |
| 5 to 17 Years | 0 (0.0%) | 0 (0.0%) |
| 18 to 34 Years | 0 (0.0%) | 0 (0.0%) |
| 35 to 64 Years | 7 (15.6%) | 2 (3.2%) |
| 65 to 74 Years | 5 (10.6%) | 4 (17.4%) |
| 75 Years and over | 0 (0.0%) | 0 (0.0%) |
Disability Class: Cognitive Difficulty
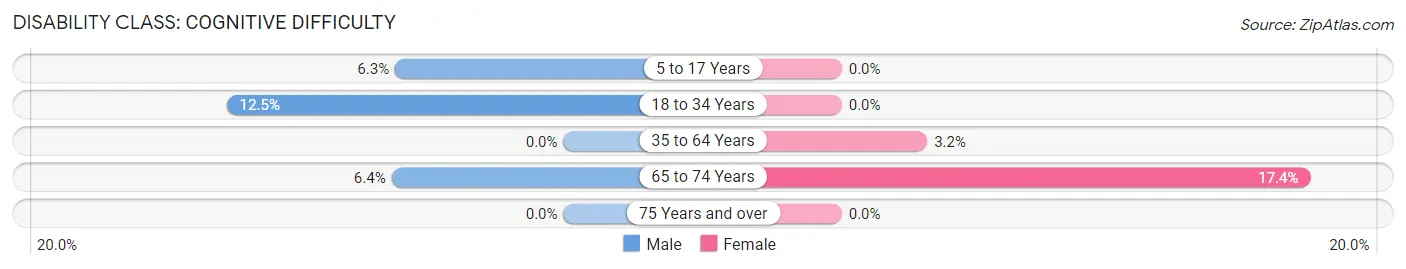
| Age Bracket | Male | Female |
| 5 to 17 Years | 2 (6.2%) | 0 (0.0%) |
| 18 to 34 Years | 2 (12.5%) | 0 (0.0%) |
| 35 to 64 Years | 0 (0.0%) | 2 (3.2%) |
| 65 to 74 Years | 3 (6.4%) | 4 (17.4%) |
| 75 Years and over | 0 (0.0%) | 0 (0.0%) |
Disability Class: Ambulatory Difficulty
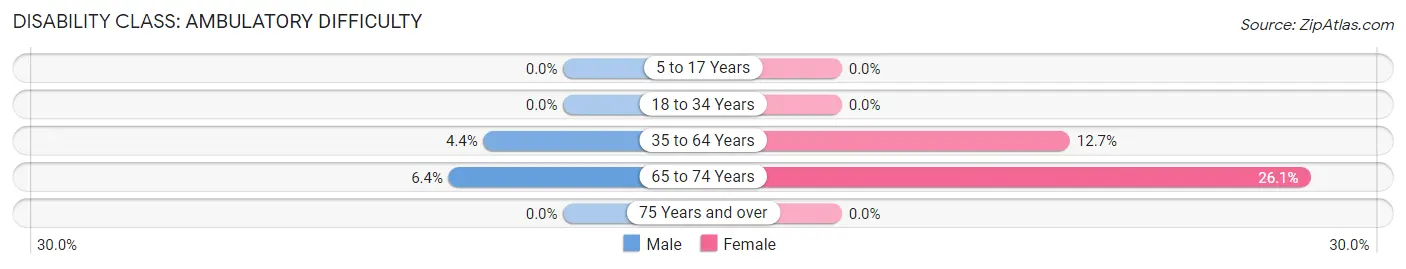
| Age Bracket | Male | Female |
| 5 to 17 Years | 0 (0.0%) | 0 (0.0%) |
| 18 to 34 Years | 0 (0.0%) | 0 (0.0%) |
| 35 to 64 Years | 2 (4.4%) | 8 (12.7%) |
| 65 to 74 Years | 3 (6.4%) | 6 (26.1%) |
| 75 Years and over | 0 (0.0%) | 0 (0.0%) |
Disability Class: Self-Care Difficulty
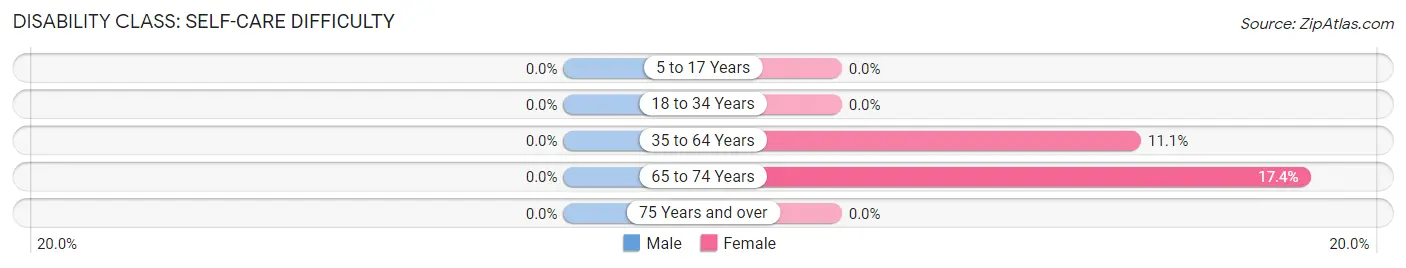
| Age Bracket | Male | Female |
| 5 to 17 Years | 0 (0.0%) | 0 (0.0%) |
| 18 to 34 Years | 0 (0.0%) | 0 (0.0%) |
| 35 to 64 Years | 0 (0.0%) | 7 (11.1%) |
| 65 to 74 Years | 0 (0.0%) | 4 (17.4%) |
| 75 Years and over | 0 (0.0%) | 0 (0.0%) |
Technology Access in French Gulch
Computing Device Access in French Gulch
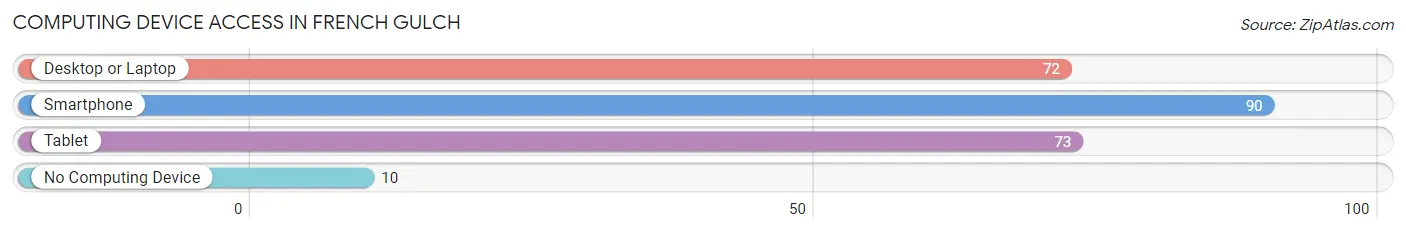
| Device Type | # Households | % Households |
| Desktop or Laptop | 72 | 67.3% |
| Smartphone | 90 | 84.1% |
| Tablet | 73 | 68.2% |
| No Computing Device | 10 | 9.3% |
| Total | 107 | 100.0% |
Internet Access in French Gulch
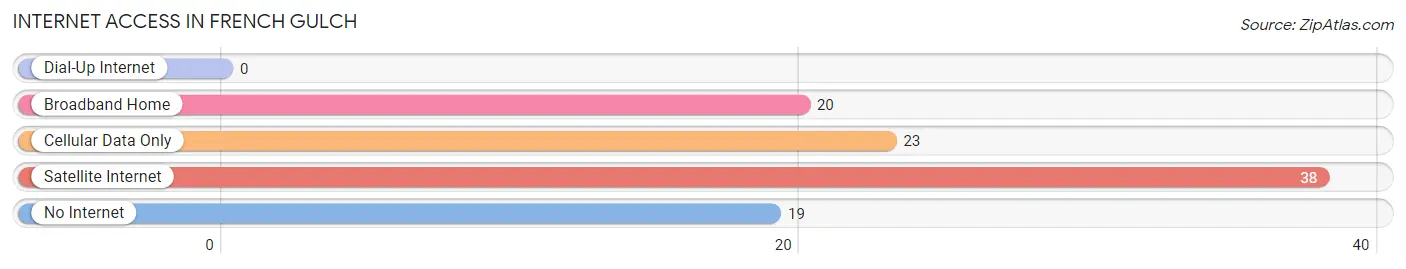
| Internet Type | # Households | % Households |
| Dial-Up Internet | 0 | 0.0% |
| Broadband Home | 20 | 18.7% |
| Cellular Data Only | 23 | 21.5% |
| Satellite Internet | 38 | 35.5% |
| No Internet | 19 | 17.8% |
| Total | 107 | 100.0% |
French Gulch Summary
Gulch History
French Gulch is a small unincorporated community located in Shasta County, California. It is situated in the foothills of the Cascade Range, approximately 8 miles east of Redding. The town was founded in 1849 by French miners who were searching for gold. The miners named the area “French Gulch” after their homeland.
The town was initially populated by French miners, but soon attracted other settlers from the United States and Europe. The town grew rapidly and by 1852, it had a population of over 500 people. The town was home to several businesses, including a hotel, saloon, blacksmith shop, and general store.
In 1854, the town was destroyed by a fire that started in the blacksmith shop. The fire destroyed most of the buildings in the town, but the residents were able to rebuild. The town continued to grow and by the late 1800s, it had a population of over 1,000 people.
The town was home to several mines, including the French Gulch Mine, which was one of the largest gold mines in the area. The mine operated until the early 1900s, when it was closed due to declining gold prices.
The town was also home to several lumber mills, which provided employment for many of the town’s residents. The lumber industry declined in the early 1900s, and the town’s population began to decline as well.
By the mid-1900s, the town’s population had dropped to less than 200 people. The town’s economy was largely based on ranching and farming.
Geography
French Gulch is located in the foothills of the Cascade Range, approximately 8 miles east of Redding. The town is situated at an elevation of 1,890 feet above sea level.
The town is surrounded by rolling hills and is located near several creeks and rivers, including the Sacramento River. The town is located in a temperate climate, with hot summers and mild winters.
Economy
The economy of French Gulch is largely based on ranching and farming. The town is home to several ranches, which raise cattle and other livestock. The town is also home to several farms, which grow a variety of crops, including hay, wheat, and corn.
The town is also home to several small businesses, including a general store, a restaurant, and a gas station.
Demographics
As of the 2010 census, the population of French Gulch was 1,093. The town is predominantly white, with 92.3% of the population identifying as white. The town also has a small Hispanic population, with 4.3% of the population identifying as Hispanic or Latino.
The median household income in French Gulch is $45,000, and the median home value is $179,000. The town has a poverty rate of 11.3%, which is slightly higher than the national average.
Conclusion
French Gulch is a small unincorporated community located in Shasta County, California. The town was founded in 1849 by French miners who were searching for gold. The town was initially populated by French miners, but soon attracted other settlers from the United States and Europe. The town was home to several businesses, including a hotel, saloon, blacksmith shop, and general store. The town’s economy is largely based on ranching and farming, and the town is home to several small businesses. The population of French Gulch is predominantly white, with 92.3% of the population identifying as white. The median household income in French Gulch is $45,000, and the median home value is $179,000.
Common Questions
What is Per Capita Income in French Gulch?
Per Capita income in French Gulch is $23,001.
What is the Median Family Income in French Gulch?
Median Family Income in French Gulch is $48,750.
What is the Median Household income in French Gulch?
Median Household Income in French Gulch is $41,563.
What is Income or Wage Gap in French Gulch?
Income or Wage Gap in French Gulch is 47.4%.
Women in French Gulch earn 52.6 cents for every dollar earned by a man.
What is Inequality or Gini Index in French Gulch?
Inequality or Gini Index in French Gulch is 0.46.
What is the Total Population of French Gulch?
Total Population of French Gulch is 283.
What is the Total Male Population of French Gulch?
Total Male Population of French Gulch is 157.
What is the Total Female Population of French Gulch?
Total Female Population of French Gulch is 126.
What is the Ratio of Males per 100 Females in French Gulch?
There are 124.60 Males per 100 Females in French Gulch.
What is the Ratio of Females per 100 Males in French Gulch?
There are 80.25 Females per 100 Males in French Gulch.
What is the Median Population Age in French Gulch?
Median Population Age in French Gulch is 55.2 Years.
What is the Average Family Size in French Gulch
Average Family Size in French Gulch is 2.8 People.
What is the Average Household Size in French Gulch
Average Household Size in French Gulch is 2.6 People.
How Large is the Labor Force in French Gulch?
There are 105 People in the Labor Forcein in French Gulch.
What is the Percentage of People in the Labor Force in French Gulch?
46.1% of People are in the Labor Force in French Gulch.
What is the Unemployment Rate in French Gulch?
Unemployment Rate in French Gulch is 1.9%.