Mountain View, CA Map & Demographics
Mountain View Map
Mountain View Overview
$102,077
PER CAPITA INCOME
$213,279
AVG FAMILY INCOME
$174,156
AVG HOUSEHOLD INCOME
37.8%
WAGE / INCOME GAP [ % ]
62.2¢/ $1
WAGE / INCOME GAP [ $ ]
0.47
INEQUALITY / GINI INDEX
82,132
TOTAL POPULATION
42,855
MALE POPULATION
39,277
FEMALE POPULATION
109.11
MALES / 100 FEMALES
91.65
FEMALES / 100 MALES
35.5
MEDIAN AGE
3.1
AVG FAMILY SIZE
2.4
AVG HOUSEHOLD SIZE
48,860
LABOR FORCE [ PEOPLE ]
73.0%
PERCENT IN LABOR FORCE
3.4%
UNEMPLOYMENT RATE
Mountain View Area Codes
Income in Mountain View
Income Overview in Mountain View
Per Capita Income in Mountain View is $102,077, while median incomes of families and households are $213,279 and $174,156 respectively.
| Characteristic | Number | Measure |
| Per Capita Income | 82,132 | $102,077 |
| Median Family Income | 19,129 | $213,279 |
| Mean Family Income | 19,129 | $289,596 |
| Median Household Income | 34,516 | $174,156 |
| Mean Household Income | 34,516 | $239,238 |
| Income Deficit | 19,129 | $0 |
| Wage / Income Gap (%) | 82,132 | 37.77% |
| Wage / Income Gap ($) | 82,132 | 62.23¢ per $1 |
| Gini / Inequality Index | 82,132 | 0.47 |
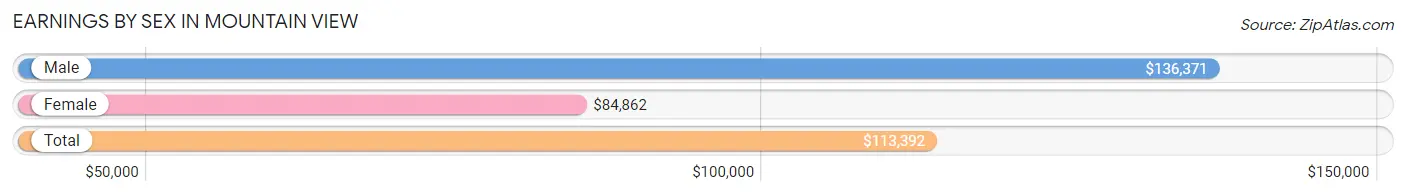
Earnings by Sex in Mountain View
Average Earnings in Mountain View are $113,392, $136,371 for men and $84,862 for women, a difference of 37.8%.
| Sex | Number | Average Earnings |
| Male | 29,076 (57.7%) | $136,371 |
| Female | 21,336 (42.3%) | $84,862 |
| Total | 50,412 (100.0%) | $113,392 |
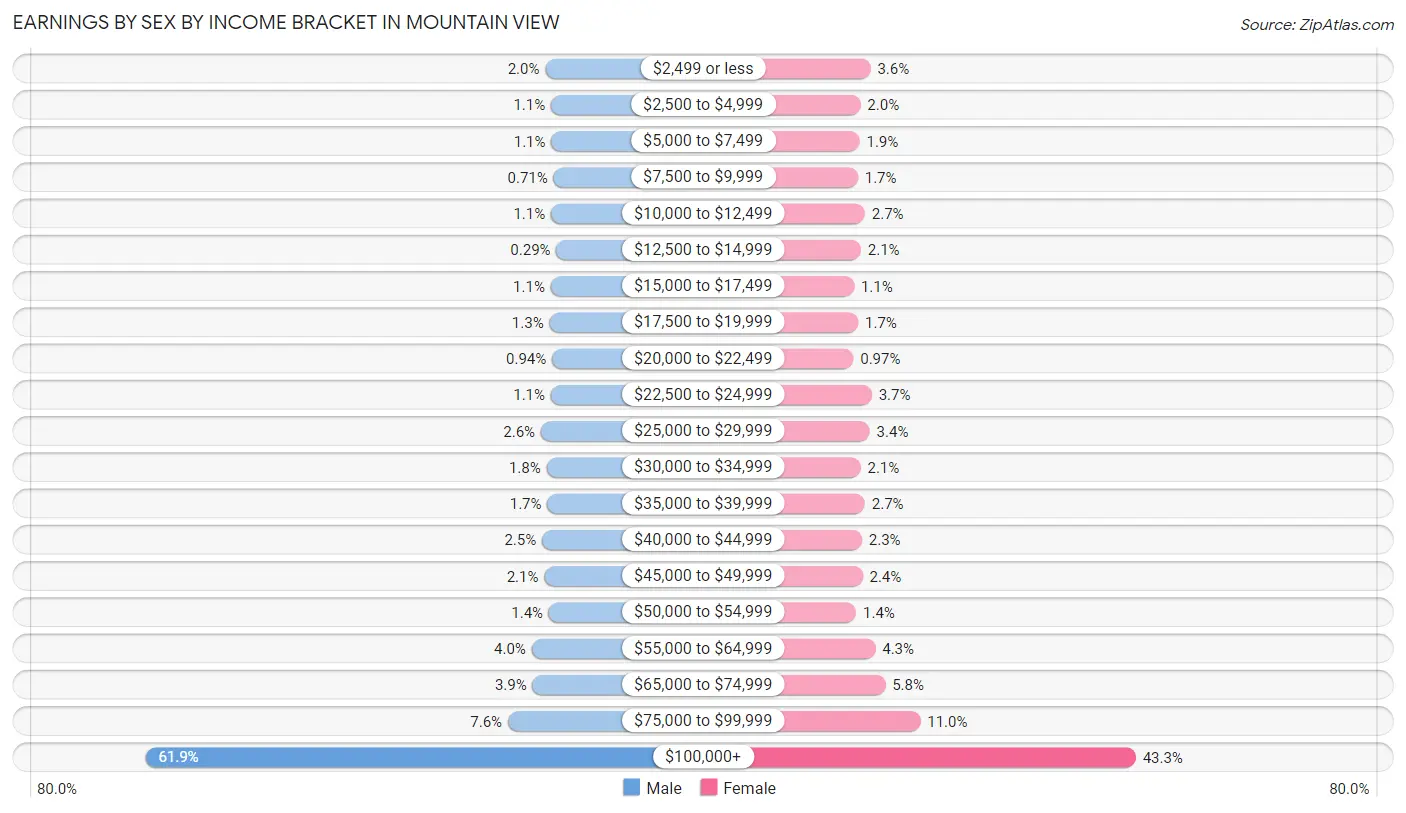
Earnings by Sex by Income Bracket in Mountain View
The most common earnings brackets in Mountain View are $100,000+ for men (17,993 | 61.9%) and $100,000+ for women (9,238 | 43.3%).
| Income | Male | Female |
| $2,499 or less | 567 (1.9%) | 758 (3.5%) |
| $2,500 to $4,999 | 318 (1.1%) | 435 (2.0%) |
| $5,000 to $7,499 | 305 (1.1%) | 407 (1.9%) |
| $7,500 to $9,999 | 206 (0.7%) | 351 (1.7%) |
| $10,000 to $12,499 | 316 (1.1%) | 577 (2.7%) |
| $12,500 to $14,999 | 83 (0.3%) | 450 (2.1%) |
| $15,000 to $17,499 | 332 (1.1%) | 231 (1.1%) |
| $17,500 to $19,999 | 388 (1.3%) | 360 (1.7%) |
| $20,000 to $22,499 | 274 (0.9%) | 208 (1.0%) |
| $22,500 to $24,999 | 326 (1.1%) | 799 (3.7%) |
| $25,000 to $29,999 | 758 (2.6%) | 731 (3.4%) |
| $30,000 to $34,999 | 514 (1.8%) | 440 (2.1%) |
| $35,000 to $39,999 | 480 (1.7%) | 578 (2.7%) |
| $40,000 to $44,999 | 711 (2.5%) | 483 (2.3%) |
| $45,000 to $49,999 | 612 (2.1%) | 503 (2.4%) |
| $50,000 to $54,999 | 409 (1.4%) | 296 (1.4%) |
| $55,000 to $64,999 | 1,162 (4.0%) | 912 (4.3%) |
| $65,000 to $74,999 | 1,124 (3.9%) | 1,230 (5.8%) |
| $75,000 to $99,999 | 2,198 (7.6%) | 2,349 (11.0%) |
| $100,000+ | 17,993 (61.9%) | 9,238 (43.3%) |
| Total | 29,076 (100.0%) | 21,336 (100.0%) |
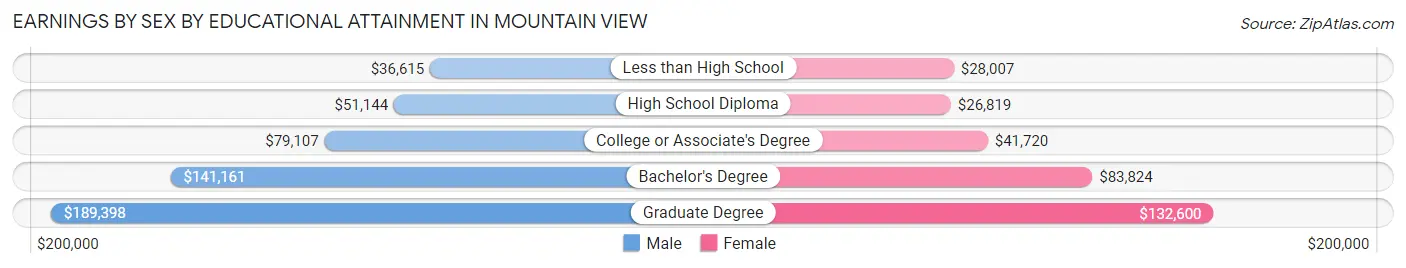
Earnings by Sex by Educational Attainment in Mountain View
Average earnings in Mountain View are $144,732 for men and $90,674 for women, a difference of 37.3%. Men with an educational attainment of graduate degree enjoy the highest average annual earnings of $189,398, while those with less than high school education earn the least with $36,615. Women with an educational attainment of graduate degree earn the most with the average annual earnings of $132,600, while those with high school diploma education have the smallest earnings of $26,819.
| Educational Attainment | Male Income | Female Income |
| Less than High School | $36,615 | $28,007 |
| High School Diploma | $51,144 | $26,819 |
| College or Associate's Degree | $79,107 | $41,720 |
| Bachelor's Degree | $141,161 | $83,824 |
| Graduate Degree | $189,398 | $132,600 |
| Total | $144,732 | $90,674 |
Family Income in Mountain View
Family Income Brackets in Mountain View
According to the Mountain View family income data, there are 10,311 families falling into the $200,000+ income range, which is the most common income bracket and makes up 53.9% of all families. Conversely, the $10,000 to $14,999 income bracket is the least frequent group with only 153 families (0.8%) belonging to this category.
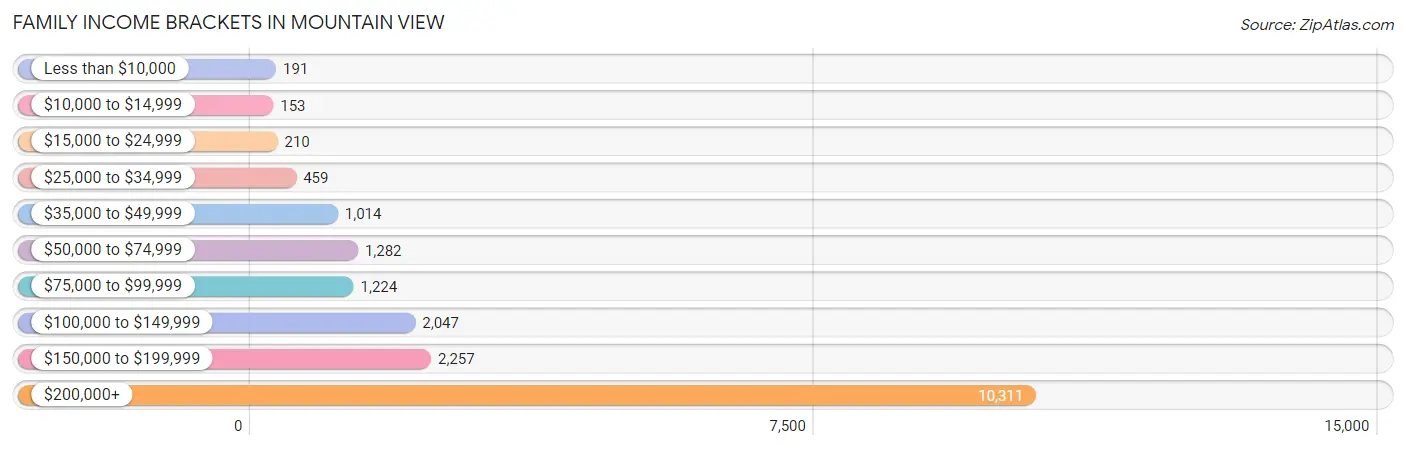
| Income Bracket | # Families | % Families |
| Less than $10,000 | 191 | 1.0% |
| $10,000 to $14,999 | 153 | 0.8% |
| $15,000 to $24,999 | 210 | 1.1% |
| $25,000 to $34,999 | 459 | 2.4% |
| $35,000 to $49,999 | 1,014 | 5.3% |
| $50,000 to $74,999 | 1,282 | 6.7% |
| $75,000 to $99,999 | 1,224 | 6.4% |
| $100,000 to $149,999 | 2,047 | 10.7% |
| $150,000 to $199,999 | 2,257 | 11.8% |
| $200,000+ | 10,311 | 53.9% |
Family Income by Famaliy Size in Mountain View
4-person families (4,148 | 21.7%) account for the highest median family income in Mountain View with $250,001 per family, while 2-person families (8,409 | 44.0%) have the highest median income of $99,950 per family member.
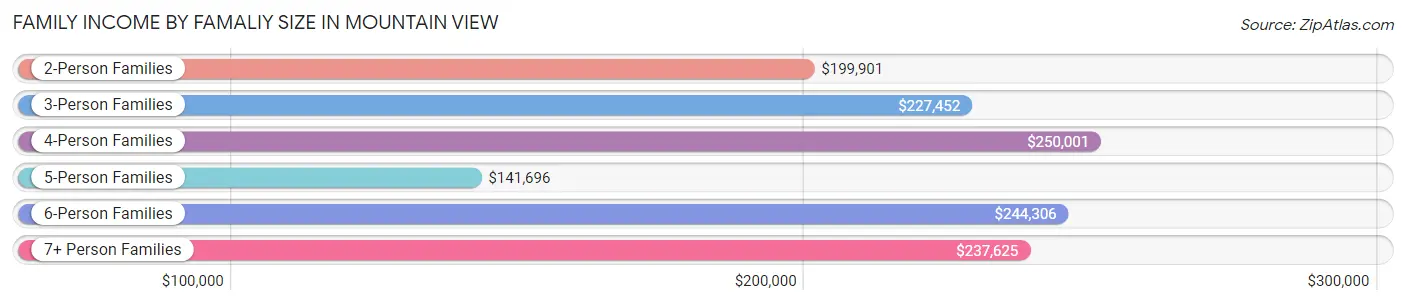
| Income Bracket | # Families | Median Income |
| 2-Person Families | 8,409 (44.0%) | $199,901 |
| 3-Person Families | 4,813 (25.2%) | $227,452 |
| 4-Person Families | 4,148 (21.7%) | $250,001 |
| 5-Person Families | 1,374 (7.2%) | $141,696 |
| 6-Person Families | 295 (1.5%) | $244,306 |
| 7+ Person Families | 90 (0.5%) | $237,625 |
| Total | 19,129 (100.0%) | $213,279 |
Family Income by Number of Earners in Mountain View
The median family income in Mountain View is $213,279, with families comprising 2 earners (10,106) having the highest median family income of $250,001, while families with no earners (1,443) have the lowest median family income of $77,804, accounting for 52.8% and 7.5% of families, respectively.
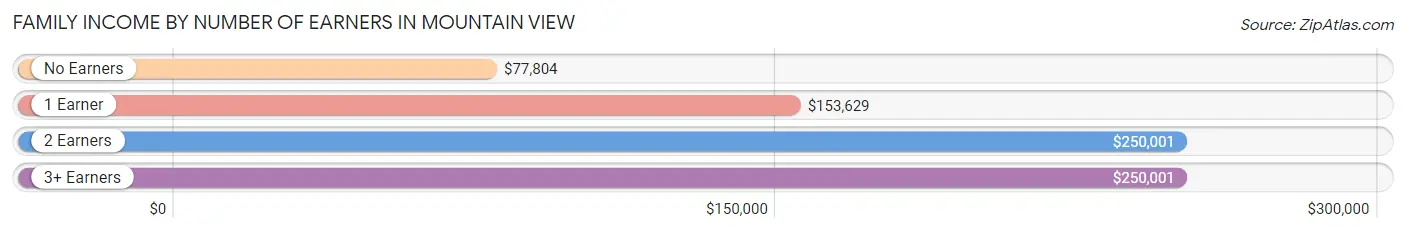
| Number of Earners | # Families | Median Income |
| No Earners | 1,443 (7.5%) | $77,804 |
| 1 Earner | 6,058 (31.7%) | $153,629 |
| 2 Earners | 10,106 (52.8%) | $250,001 |
| 3+ Earners | 1,522 (8.0%) | $250,001 |
| Total | 19,129 (100.0%) | $213,279 |
Household Income in Mountain View
Household Income Brackets in Mountain View
With 15,153 households falling in the category, the $200,000+ income range is the most frequent in Mountain View, accounting for 43.9% of all households. In contrast, only 587 households (1.7%) fall into the $10,000 to $14,999 income bracket, making it the least populous group.
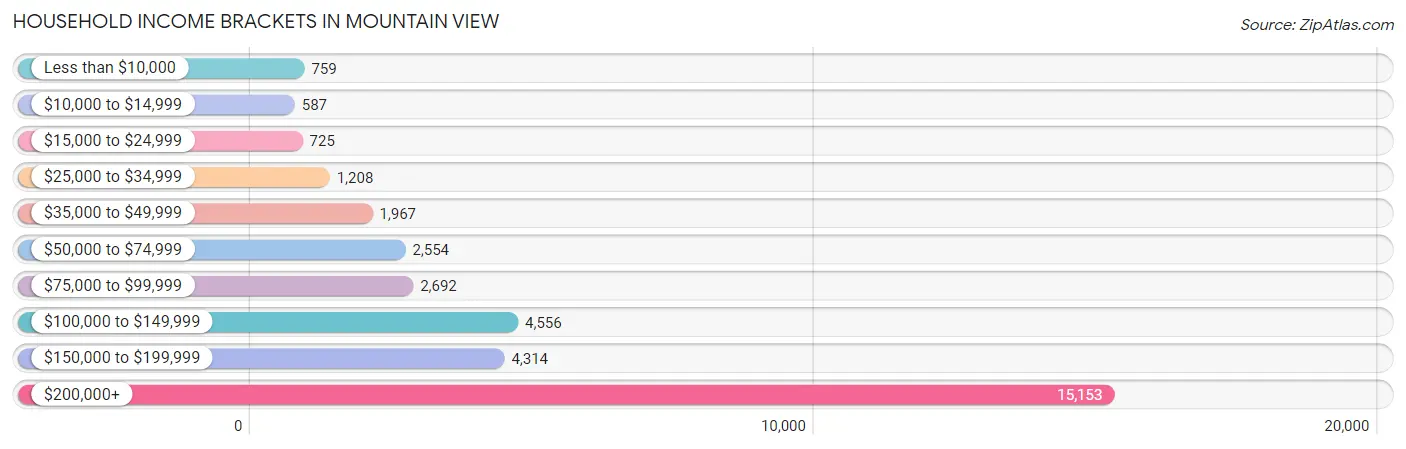
| Income Bracket | # Households | % Households |
| Less than $10,000 | 759 | 2.2% |
| $10,000 to $14,999 | 587 | 1.7% |
| $15,000 to $24,999 | 725 | 2.1% |
| $25,000 to $34,999 | 1,208 | 3.5% |
| $35,000 to $49,999 | 1,967 | 5.7% |
| $50,000 to $74,999 | 2,554 | 7.4% |
| $75,000 to $99,999 | 2,692 | 7.8% |
| $100,000 to $149,999 | 4,556 | 13.2% |
| $150,000 to $199,999 | 4,314 | 12.5% |
| $200,000+ | 15,153 | 43.9% |
Household Income by Householder Age in Mountain View
The median household income in Mountain View is $174,156, with the highest median household income of $210,318 found in the 25 to 44 years age bracket for the primary householder. A total of 16,928 households (49.0%) fall into this category. Meanwhile, the 65+ years age bracket for the primary householder has the lowest median household income of $74,956, with 5,970 households (17.3%) in this group.
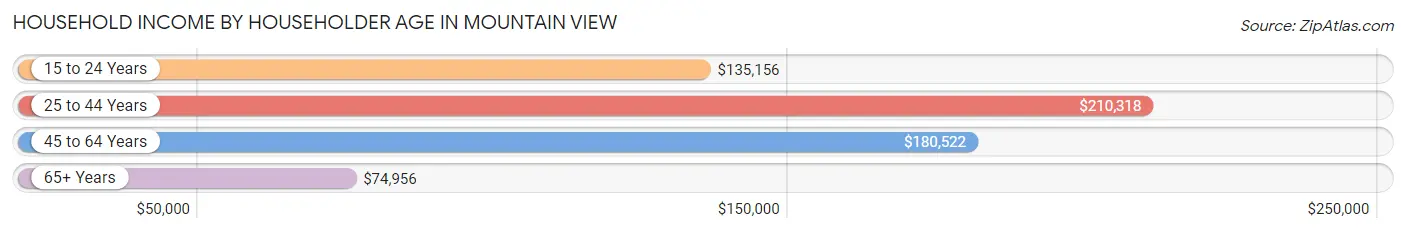
| Income Bracket | # Households | Median Income |
| 15 to 24 Years | 1,234 (3.6%) | $135,156 |
| 25 to 44 Years | 16,928 (49.0%) | $210,318 |
| 45 to 64 Years | 10,384 (30.1%) | $180,522 |
| 65+ Years | 5,970 (17.3%) | $74,956 |
| Total | 34,516 (100.0%) | $174,156 |
Poverty in Mountain View
Income Below Poverty by Sex and Age in Mountain View
With 4.4% poverty level for males and 6.6% for females among the residents of Mountain View, 16 and 17 year old males and 18 to 24 year old females are the most vulnerable to poverty, with 135 males (15.8%) and 483 females (20.5%) in their respective age groups living below the poverty level.
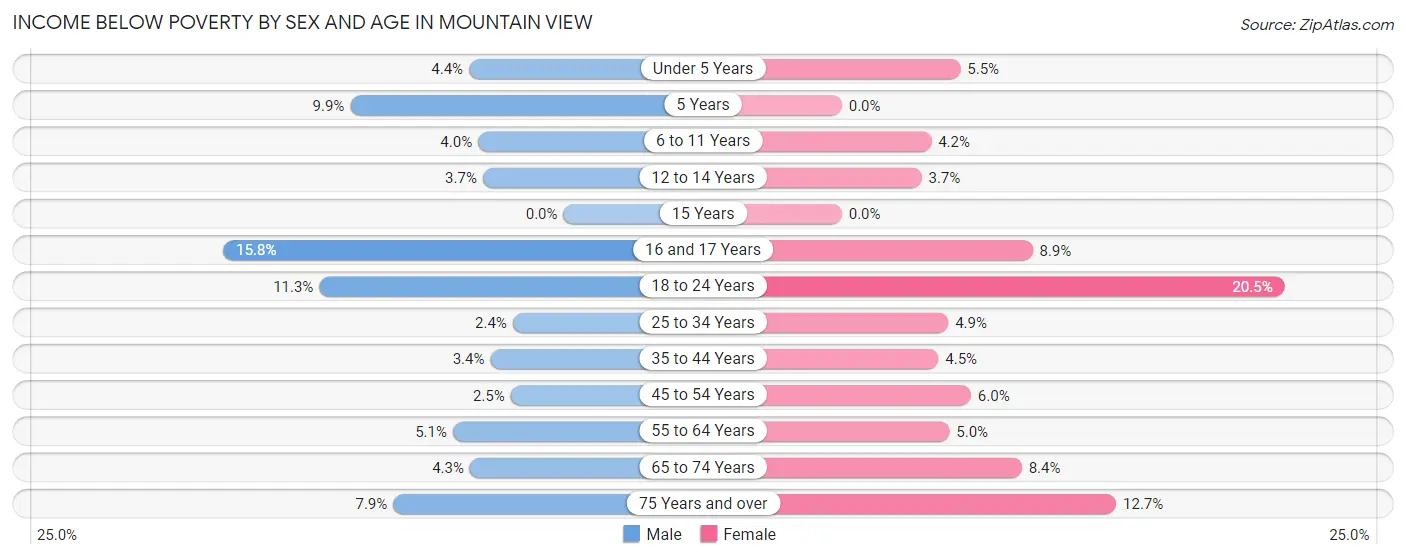
| Age Bracket | Male | Female |
| Under 5 Years | 105 (4.4%) | 145 (5.5%) |
| 5 Years | 37 (9.9%) | 0 (0.0%) |
| 6 to 11 Years | 116 (4.0%) | 111 (4.2%) |
| 12 to 14 Years | 50 (3.7%) | 45 (3.7%) |
| 15 Years | 0 (0.0%) | 0 (0.0%) |
| 16 and 17 Years | 135 (15.8%) | 66 (8.8%) |
| 18 to 24 Years | 369 (11.3%) | 483 (20.5%) |
| 25 to 34 Years | 233 (2.4%) | 385 (4.9%) |
| 35 to 44 Years | 265 (3.4%) | 293 (4.5%) |
| 45 to 54 Years | 123 (2.5%) | 300 (6.0%) |
| 55 to 64 Years | 213 (5.1%) | 202 (5.0%) |
| 65 to 74 Years | 110 (4.3%) | 233 (8.4%) |
| 75 Years and over | 119 (7.9%) | 307 (12.7%) |
| Total | 1,875 (4.4%) | 2,570 (6.6%) |
Income Above Poverty by Sex and Age in Mountain View
According to the poverty statistics in Mountain View, males aged 15 years and females aged 5 years are the age groups that are most secure financially, with 100.0% of males and 100.0% of females in these age groups living above the poverty line.
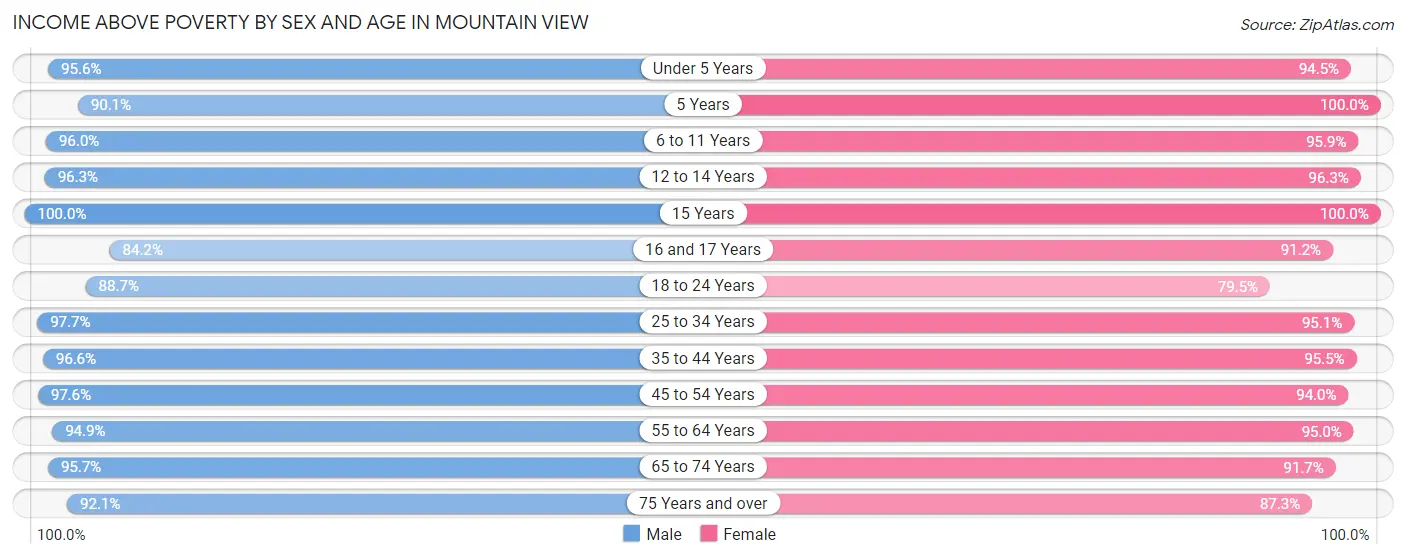
| Age Bracket | Male | Female |
| Under 5 Years | 2,291 (95.6%) | 2,490 (94.5%) |
| 5 Years | 337 (90.1%) | 379 (100.0%) |
| 6 to 11 Years | 2,810 (96.0%) | 2,562 (95.9%) |
| 12 to 14 Years | 1,287 (96.3%) | 1,171 (96.3%) |
| 15 Years | 567 (100.0%) | 496 (100.0%) |
| 16 and 17 Years | 720 (84.2%) | 680 (91.1%) |
| 18 to 24 Years | 2,887 (88.7%) | 1,869 (79.5%) |
| 25 to 34 Years | 9,701 (97.7%) | 7,407 (95.1%) |
| 35 to 44 Years | 7,551 (96.6%) | 6,243 (95.5%) |
| 45 to 54 Years | 4,902 (97.6%) | 4,711 (94.0%) |
| 55 to 64 Years | 3,942 (94.9%) | 3,846 (95.0%) |
| 65 to 74 Years | 2,422 (95.7%) | 2,557 (91.6%) |
| 75 Years and over | 1,388 (92.1%) | 2,104 (87.3%) |
| Total | 40,805 (95.6%) | 36,515 (93.4%) |
Income Below Poverty Among Married-Couple Families in Mountain View
The poverty statistics for married-couple families in Mountain View show that 1.7% or 273 of the total 15,954 families live below the poverty line. Families with 3 or 4 children have the highest poverty rate of 6.8%, comprising of 61 families. On the other hand, families with 1 or 2 children have the lowest poverty rate of 0.4%, which includes 24 families.
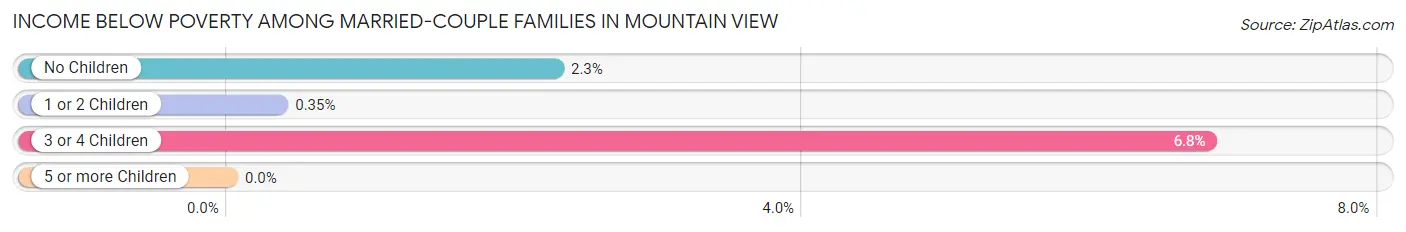
| Children | Above Poverty | Below Poverty |
| No Children | 8,106 (97.7%) | 188 (2.3%) |
| 1 or 2 Children | 6,741 (99.7%) | 24 (0.4%) |
| 3 or 4 Children | 834 (93.2%) | 61 (6.8%) |
| 5 or more Children | 0 (0.0%) | 0 (0.0%) |
| Total | 15,681 (98.3%) | 273 (1.7%) |
Income Below Poverty Among Single-Parent Households in Mountain View
According to the poverty data in Mountain View, 0.9% or 10 single-father households and 10.5% or 210 single-mother households are living below the poverty line. Among single-father households, those with no children have the highest poverty rate, with 10 households (1.7%) experiencing poverty. Likewise, among single-mother households, those with 5 or more children have the highest poverty rate, with 33 households (100.0%) falling below the poverty line.
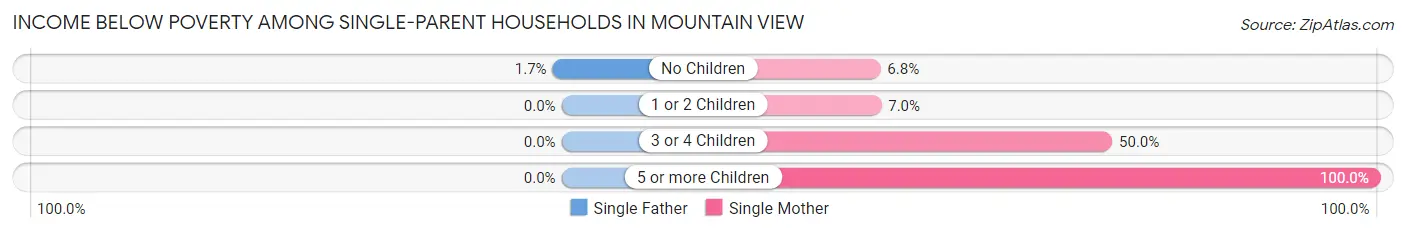
| Children | Single Father | Single Mother |
| No Children | 10 (1.7%) | 59 (6.8%) |
| 1 or 2 Children | 0 (0.0%) | 71 (7.0%) |
| 3 or 4 Children | 0 (0.0%) | 47 (50.0%) |
| 5 or more Children | 0 (0.0%) | 33 (100.0%) |
| Total | 10 (0.9%) | 210 (10.5%) |
Income Below Poverty Among Married-Couple vs Single-Parent Households in Mountain View
The poverty data for Mountain View shows that 273 of the married-couple family households (1.7%) and 220 of the single-parent households (6.9%) are living below the poverty level. Within the married-couple family households, those with 3 or 4 children have the highest poverty rate, with 61 households (6.8%) falling below the poverty line. Among the single-parent households, those with 5 or more children have the highest poverty rate, with 33 household (100.0%) living below poverty.
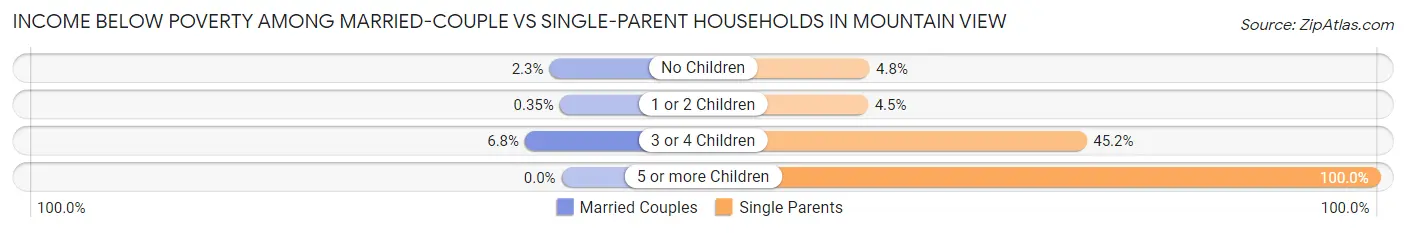
| Children | Married-Couple Families | Single-Parent Households |
| No Children | 188 (2.3%) | 69 (4.8%) |
| 1 or 2 Children | 24 (0.4%) | 71 (4.5%) |
| 3 or 4 Children | 61 (6.8%) | 47 (45.2%) |
| 5 or more Children | 0 (0.0%) | 33 (100.0%) |
| Total | 273 (1.7%) | 220 (6.9%) |
Race in Mountain View
The most populous races in Mountain View are White / Caucasian (37,862 | 46.1%), Asian (27,290 | 33.2%), and Hispanic or Latino (15,035 | 18.3%).
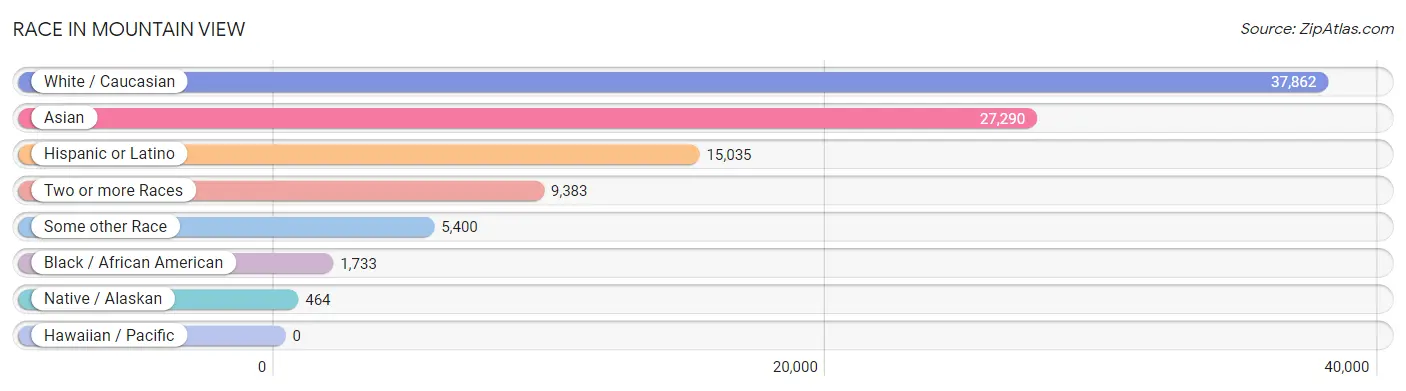
| Race | # Population | % Population |
| Asian | 27,290 | 33.2% |
| Black / African American | 1,733 | 2.1% |
| Hawaiian / Pacific | 0 | 0.0% |
| Hispanic or Latino | 15,035 | 18.3% |
| Native / Alaskan | 464 | 0.6% |
| White / Caucasian | 37,862 | 46.1% |
| Two or more Races | 9,383 | 11.4% |
| Some other Race | 5,400 | 6.6% |
| Total | 82,132 | 100.0% |
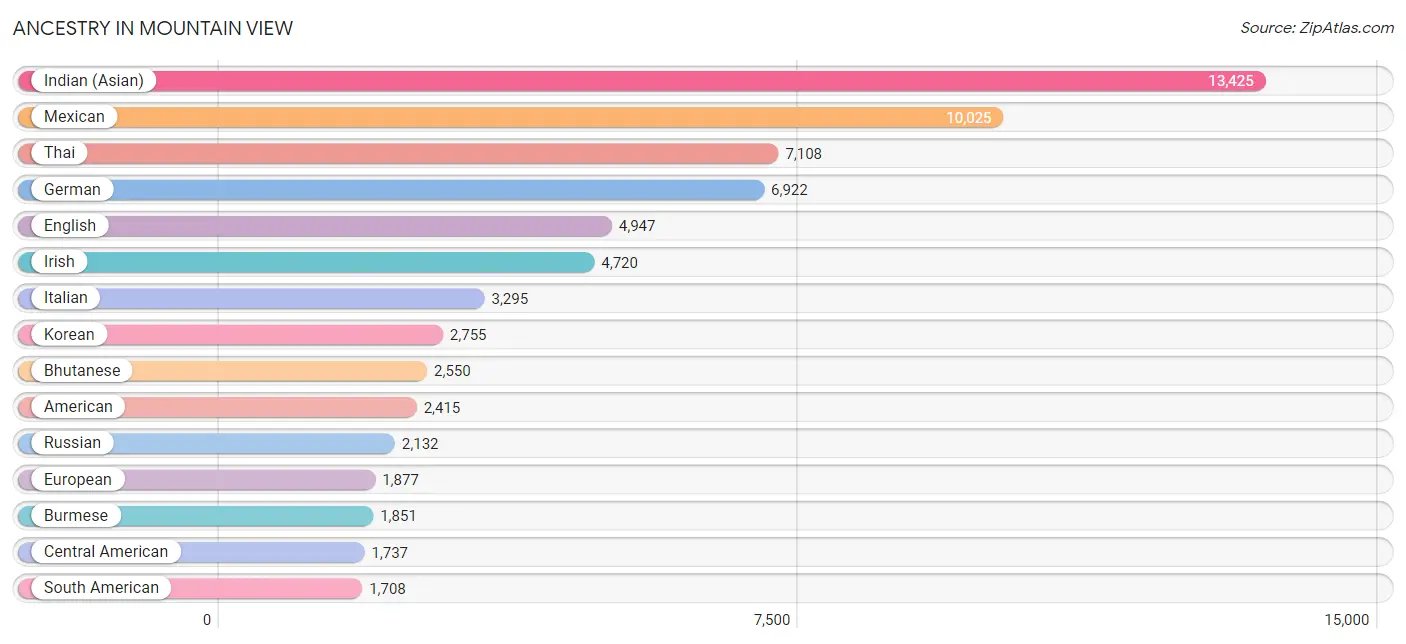
Ancestry in Mountain View
The most populous ancestries reported in Mountain View are Indian (Asian) (13,425 | 16.4%), Mexican (10,025 | 12.2%), Thai (7,108 | 8.6%), German (6,922 | 8.4%), and English (4,947 | 6.0%), together accounting for 51.7% of all Mountain View residents.
| Ancestry | # Population | % Population |
| Afghan | 28 | 0.0% |
| African | 272 | 0.3% |
| Albanian | 19 | 0.0% |
| American | 2,415 | 2.9% |
| Apache | 31 | 0.0% |
| Arab | 436 | 0.5% |
| Argentinean | 219 | 0.3% |
| Armenian | 195 | 0.2% |
| Australian | 194 | 0.2% |
| Austrian | 142 | 0.2% |
| Basque | 17 | 0.0% |
| Belgian | 122 | 0.2% |
| Bhutanese | 2,550 | 3.1% |
| Blackfeet | 32 | 0.0% |
| Bolivian | 139 | 0.2% |
| Brazilian | 247 | 0.3% |
| British | 890 | 1.1% |
| Bulgarian | 80 | 0.1% |
| Burmese | 1,851 | 2.2% |
| Cajun | 9 | 0.0% |
| Cambodian | 71 | 0.1% |
| Canadian | 306 | 0.4% |
| Cape Verdean | 9 | 0.0% |
| Central American | 1,737 | 2.1% |
| Central American Indian | 168 | 0.2% |
| Cherokee | 176 | 0.2% |
| Chilean | 74 | 0.1% |
| Chinese | 7 | 0.0% |
| Chippewa | 41 | 0.1% |
| Colombian | 586 | 0.7% |
| Croatian | 197 | 0.2% |
| Cuban | 32 | 0.0% |
| Czech | 404 | 0.5% |
| Czechoslovakian | 51 | 0.1% |
| Danish | 345 | 0.4% |
| Dominican | 118 | 0.1% |
| Dutch | 868 | 1.1% |
| Eastern European | 732 | 0.9% |
| Ecuadorian | 171 | 0.2% |
| Egyptian | 47 | 0.1% |
| English | 4,947 | 6.0% |
| Estonian | 16 | 0.0% |
| Ethiopian | 43 | 0.1% |
| European | 1,877 | 2.3% |
| Filipino | 1,588 | 1.9% |
| Finnish | 100 | 0.1% |
| French | 1,619 | 2.0% |
| French Canadian | 316 | 0.4% |
| German | 6,922 | 8.4% |
| Greek | 326 | 0.4% |
| Guatemalan | 621 | 0.8% |
| Guyanese | 66 | 0.1% |
| Honduran | 52 | 0.1% |
| Hungarian | 260 | 0.3% |
| Icelander | 30 | 0.0% |
| Indian (Asian) | 13,425 | 16.4% |
| Indonesian | 15 | 0.0% |
| Iranian | 741 | 0.9% |
| Iraqi | 40 | 0.1% |
| Irish | 4,720 | 5.8% |
| Israeli | 314 | 0.4% |
| Italian | 3,295 | 4.0% |
| Jamaican | 50 | 0.1% |
| Japanese | 30 | 0.0% |
| Kenyan | 53 | 0.1% |
| Korean | 2,755 | 3.4% |
| Laotian | 99 | 0.1% |
| Lebanese | 148 | 0.2% |
| Lithuanian | 312 | 0.4% |
| Lumbee | 20 | 0.0% |
| Luxembourger | 18 | 0.0% |
| Maltese | 93 | 0.1% |
| Mexican | 10,025 | 12.2% |
| Mexican American Indian | 407 | 0.5% |
| Mongolian | 25 | 0.0% |
| Native Hawaiian | 71 | 0.1% |
| New Zealander | 55 | 0.1% |
| Nicaraguan | 96 | 0.1% |
| Nigerian | 109 | 0.1% |
| Northern European | 395 | 0.5% |
| Norwegian | 610 | 0.7% |
| Okinawan | 12 | 0.0% |
| Pakistani | 161 | 0.2% |
| Pennsylvania German | 40 | 0.1% |
| Peruvian | 403 | 0.5% |
| Polish | 1,702 | 2.1% |
| Portuguese | 484 | 0.6% |
| Pueblo | 32 | 0.0% |
| Puerto Rican | 361 | 0.4% |
| Romanian | 180 | 0.2% |
| Russian | 2,132 | 2.6% |
| Salvadoran | 968 | 1.2% |
| Scandinavian | 93 | 0.1% |
| Scotch-Irish | 354 | 0.4% |
| Scottish | 746 | 0.9% |
| Senegalese | 333 | 0.4% |
| Serbian | 105 | 0.1% |
| Sioux | 22 | 0.0% |
| Slavic | 43 | 0.1% |
| Slovak | 177 | 0.2% |
| South African | 223 | 0.3% |
| South American | 1,708 | 2.1% |
| South American Indian | 9 | 0.0% |
| Spaniard | 440 | 0.5% |
| Spanish | 432 | 0.5% |
| Sri Lankan | 1,548 | 1.9% |
| Subsaharan African | 1,085 | 1.3% |
| Sudanese | 31 | 0.0% |
| Swedish | 535 | 0.6% |
| Swiss | 285 | 0.4% |
| Syrian | 77 | 0.1% |
| Taiwanese | 13 | 0.0% |
| Thai | 7,108 | 8.6% |
| Trinidadian and Tobagonian | 14 | 0.0% |
| Turkish | 470 | 0.6% |
| Ukrainian | 964 | 1.2% |
| Uruguayan | 23 | 0.0% |
| Venezuelan | 93 | 0.1% |
| Vietnamese | 8 | 0.0% |
| Welsh | 143 | 0.2% |
| West Indian | 33 | 0.0% |
| Yaqui | 7 | 0.0% |
| Yugoslavian | 35 | 0.0% | View All 123 Rows |
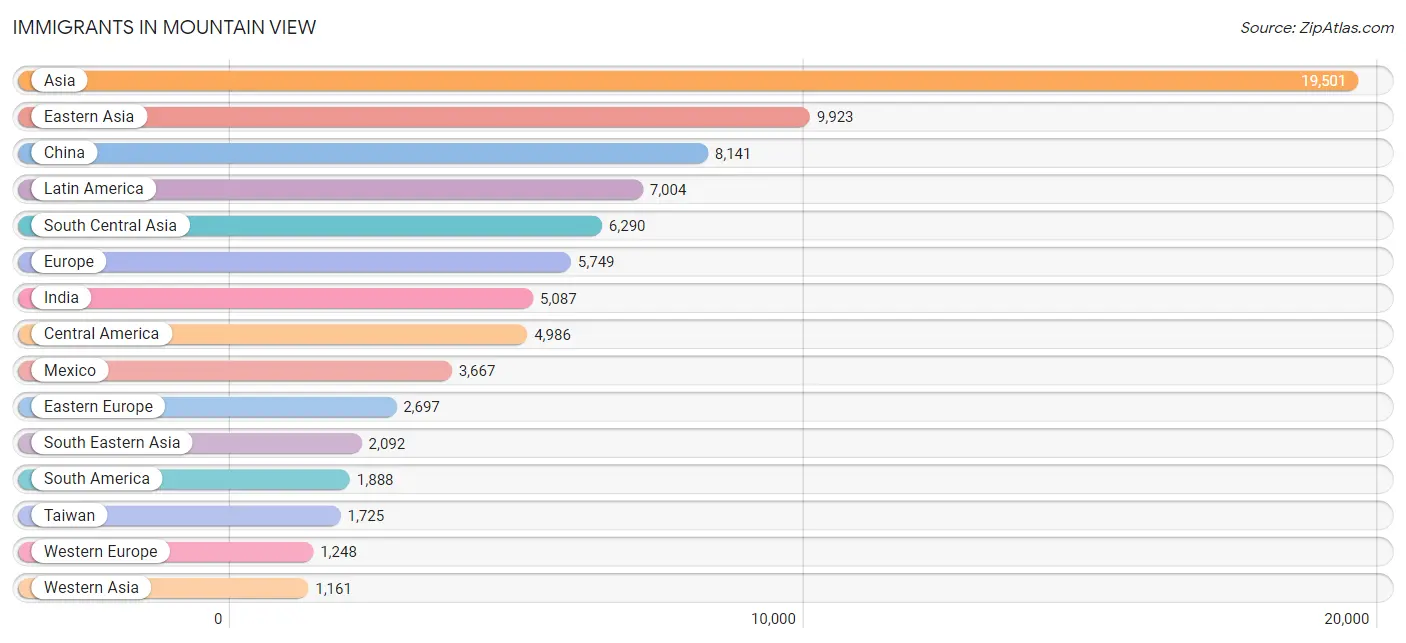
Immigrants in Mountain View
The most numerous immigrant groups reported in Mountain View came from Asia (19,501 | 23.7%), Eastern Asia (9,923 | 12.1%), China (8,141 | 9.9%), Latin America (7,004 | 8.5%), and South Central Asia (6,290 | 7.7%), together accounting for 61.9% of all Mountain View residents.
| Immigration Origin | # Population | % Population |
| Afghanistan | 24 | 0.0% |
| Africa | 761 | 0.9% |
| Albania | 16 | 0.0% |
| Argentina | 226 | 0.3% |
| Armenia | 69 | 0.1% |
| Asia | 19,501 | 23.7% |
| Australia | 426 | 0.5% |
| Austria | 71 | 0.1% |
| Bangladesh | 8 | 0.0% |
| Barbados | 14 | 0.0% |
| Belarus | 91 | 0.1% |
| Belgium | 56 | 0.1% |
| Bolivia | 16 | 0.0% |
| Bosnia and Herzegovina | 73 | 0.1% |
| Brazil | 521 | 0.6% |
| Bulgaria | 62 | 0.1% |
| Canada | 920 | 1.1% |
| Caribbean | 130 | 0.2% |
| Central America | 4,986 | 6.1% |
| Chile | 58 | 0.1% |
| China | 8,141 | 9.9% |
| Colombia | 556 | 0.7% |
| Croatia | 46 | 0.1% |
| Cuba | 19 | 0.0% |
| Czechoslovakia | 148 | 0.2% |
| Dominican Republic | 30 | 0.0% |
| Eastern Africa | 81 | 0.1% |
| Eastern Asia | 9,923 | 12.1% |
| Eastern Europe | 2,697 | 3.3% |
| Ecuador | 92 | 0.1% |
| Egypt | 17 | 0.0% |
| El Salvador | 535 | 0.6% |
| England | 145 | 0.2% |
| Ethiopia | 43 | 0.1% |
| Europe | 5,749 | 7.0% |
| France | 469 | 0.6% |
| Germany | 473 | 0.6% |
| Greece | 108 | 0.1% |
| Guatemala | 667 | 0.8% |
| Honduras | 71 | 0.1% |
| Hong Kong | 605 | 0.7% |
| Hungary | 59 | 0.1% |
| India | 5,087 | 6.2% |
| Indonesia | 65 | 0.1% |
| Iran | 511 | 0.6% |
| Iraq | 6 | 0.0% |
| Ireland | 166 | 0.2% |
| Israel | 495 | 0.6% |
| Italy | 366 | 0.4% |
| Jamaica | 42 | 0.1% |
| Japan | 669 | 0.8% |
| Jordan | 6 | 0.0% |
| Kazakhstan | 113 | 0.1% |
| Kenya | 27 | 0.0% |
| Korea | 1,045 | 1.3% |
| Kuwait | 6 | 0.0% |
| Latin America | 7,004 | 8.5% |
| Latvia | 11 | 0.0% |
| Lebanon | 31 | 0.0% |
| Liberia | 24 | 0.0% |
| Lithuania | 31 | 0.0% |
| Malaysia | 102 | 0.1% |
| Mexico | 3,667 | 4.5% |
| Middle Africa | 12 | 0.0% |
| Moldova | 72 | 0.1% |
| Nepal | 89 | 0.1% |
| Netherlands | 137 | 0.2% |
| Nicaragua | 36 | 0.0% |
| Nigeria | 37 | 0.1% |
| Northern Africa | 48 | 0.1% |
| Northern Europe | 1,146 | 1.4% |
| Norway | 32 | 0.0% |
| Oceania | 489 | 0.6% |
| Pakistan | 258 | 0.3% |
| Panama | 10 | 0.0% |
| Peru | 272 | 0.3% |
| Philippines | 1,061 | 1.3% |
| Poland | 106 | 0.1% |
| Portugal | 83 | 0.1% |
| Romania | 74 | 0.1% |
| Russia | 875 | 1.1% |
| Saudi Arabia | 47 | 0.1% |
| Senegal | 333 | 0.4% |
| Serbia | 65 | 0.1% |
| Singapore | 67 | 0.1% |
| South Africa | 226 | 0.3% |
| South America | 1,888 | 2.3% |
| South Central Asia | 6,290 | 7.7% |
| South Eastern Asia | 2,092 | 2.5% |
| Southern Europe | 658 | 0.8% |
| Spain | 101 | 0.1% |
| Sri Lanka | 23 | 0.0% |
| Sudan | 31 | 0.0% |
| Sweden | 105 | 0.1% |
| Switzerland | 42 | 0.1% |
| Syria | 34 | 0.0% |
| Taiwan | 1,725 | 2.1% |
| Thailand | 98 | 0.1% |
| Trinidad and Tobago | 25 | 0.0% |
| Turkey | 393 | 0.5% |
| Ukraine | 625 | 0.8% |
| Uruguay | 62 | 0.1% |
| Uzbekistan | 84 | 0.1% |
| Venezuela | 85 | 0.1% |
| Vietnam | 680 | 0.8% |
| Western Africa | 394 | 0.5% |
| Western Asia | 1,161 | 1.4% |
| Western Europe | 1,248 | 1.5% |
| Zimbabwe | 11 | 0.0% | View All 109 Rows |
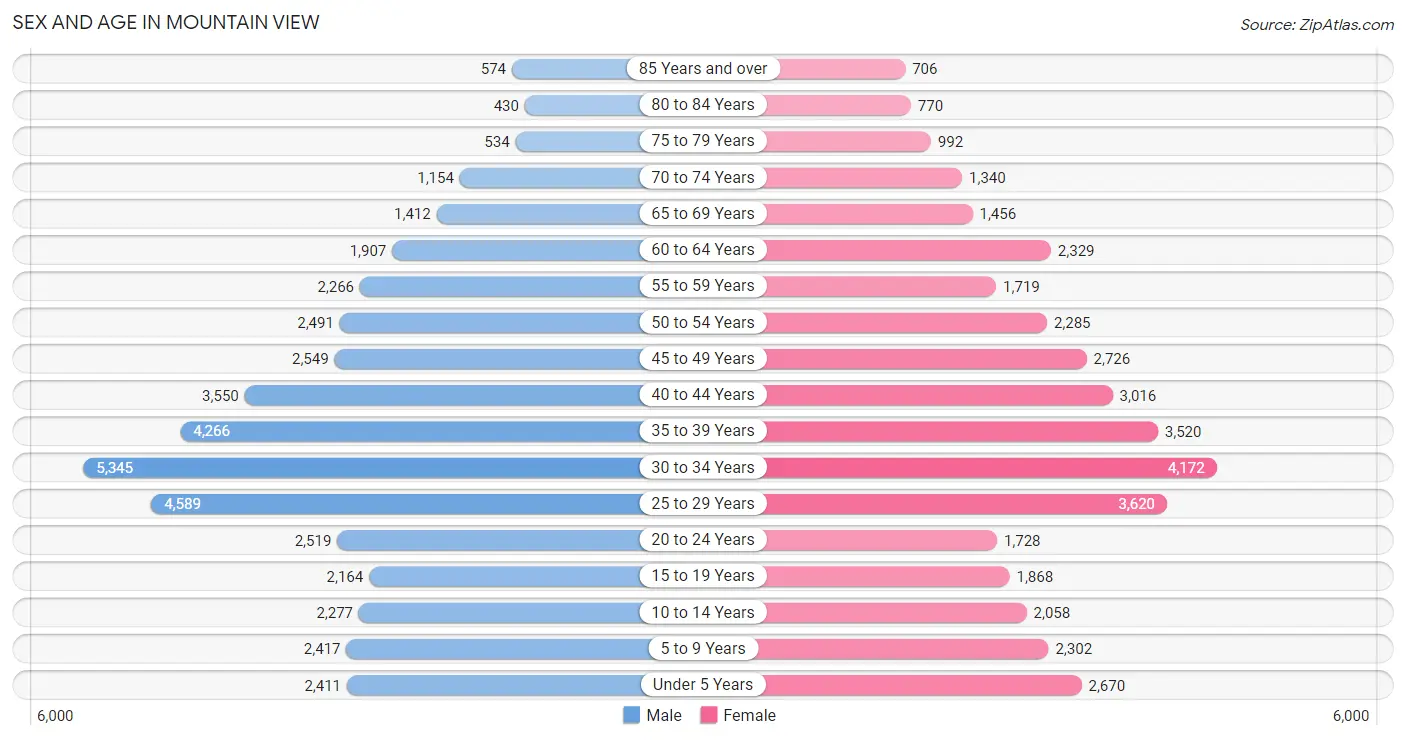
Sex and Age in Mountain View
Sex and Age in Mountain View
The most populous age groups in Mountain View are 30 to 34 Years (5,345 | 12.5%) for men and 30 to 34 Years (4,172 | 10.6%) for women.
| Age Bracket | Male | Female |
| Under 5 Years | 2,411 (5.6%) | 2,670 (6.8%) |
| 5 to 9 Years | 2,417 (5.6%) | 2,302 (5.9%) |
| 10 to 14 Years | 2,277 (5.3%) | 2,058 (5.2%) |
| 15 to 19 Years | 2,164 (5.1%) | 1,868 (4.8%) |
| 20 to 24 Years | 2,519 (5.9%) | 1,728 (4.4%) |
| 25 to 29 Years | 4,589 (10.7%) | 3,620 (9.2%) |
| 30 to 34 Years | 5,345 (12.5%) | 4,172 (10.6%) |
| 35 to 39 Years | 4,266 (10.0%) | 3,520 (9.0%) |
| 40 to 44 Years | 3,550 (8.3%) | 3,016 (7.7%) |
| 45 to 49 Years | 2,549 (5.9%) | 2,726 (6.9%) |
| 50 to 54 Years | 2,491 (5.8%) | 2,285 (5.8%) |
| 55 to 59 Years | 2,266 (5.3%) | 1,719 (4.4%) |
| 60 to 64 Years | 1,907 (4.4%) | 2,329 (5.9%) |
| 65 to 69 Years | 1,412 (3.3%) | 1,456 (3.7%) |
| 70 to 74 Years | 1,154 (2.7%) | 1,340 (3.4%) |
| 75 to 79 Years | 534 (1.3%) | 992 (2.5%) |
| 80 to 84 Years | 430 (1.0%) | 770 (2.0%) |
| 85 Years and over | 574 (1.3%) | 706 (1.8%) |
| Total | 42,855 (100.0%) | 39,277 (100.0%) |
Families and Households in Mountain View
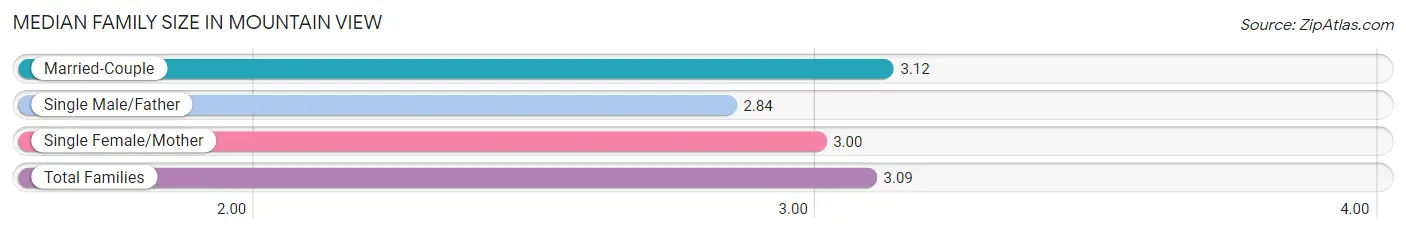
Median Family Size in Mountain View
The median family size in Mountain View is 3.09 persons per family, with married-couple families (15,954 | 83.4%) accounting for the largest median family size of 3.12 persons per family. On the other hand, single male/father families (1,171 | 6.1%) represent the smallest median family size with 2.84 persons per family.
| Family Type | # Families | Family Size |
| Married-Couple | 15,954 (83.4%) | 3.12 |
| Single Male/Father | 1,171 (6.1%) | 2.84 |
| Single Female/Mother | 2,004 (10.5%) | 3.00 |
| Total Families | 19,129 (100.0%) | 3.09 |
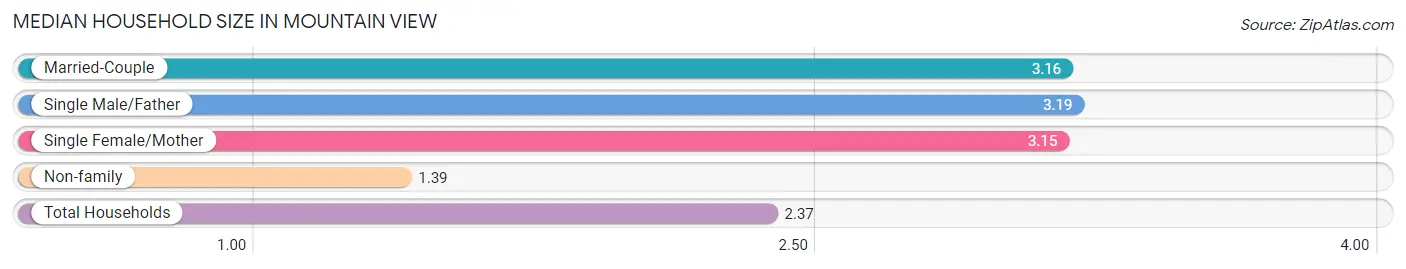
Median Household Size in Mountain View
The median household size in Mountain View is 2.37 persons per household, with single male/father households (1,171 | 3.4%) accounting for the largest median household size of 3.19 persons per household. non-family households (15,387 | 44.6%) represent the smallest median household size with 1.39 persons per household.
| Household Type | # Households | Household Size |
| Married-Couple | 15,954 (46.2%) | 3.16 |
| Single Male/Father | 1,171 (3.4%) | 3.19 |
| Single Female/Mother | 2,004 (5.8%) | 3.15 |
| Non-family | 15,387 (44.6%) | 1.39 |
| Total Households | 34,516 (100.0%) | 2.37 |
Household Size by Marriage Status in Mountain View
Out of a total of 34,516 households in Mountain View, 19,129 (55.4%) are family households, while 15,387 (44.6%) are nonfamily households. The most numerous type of family households are 2-person households, comprising 8,081, and the most common type of nonfamily households are 1-person households, comprising 11,065.
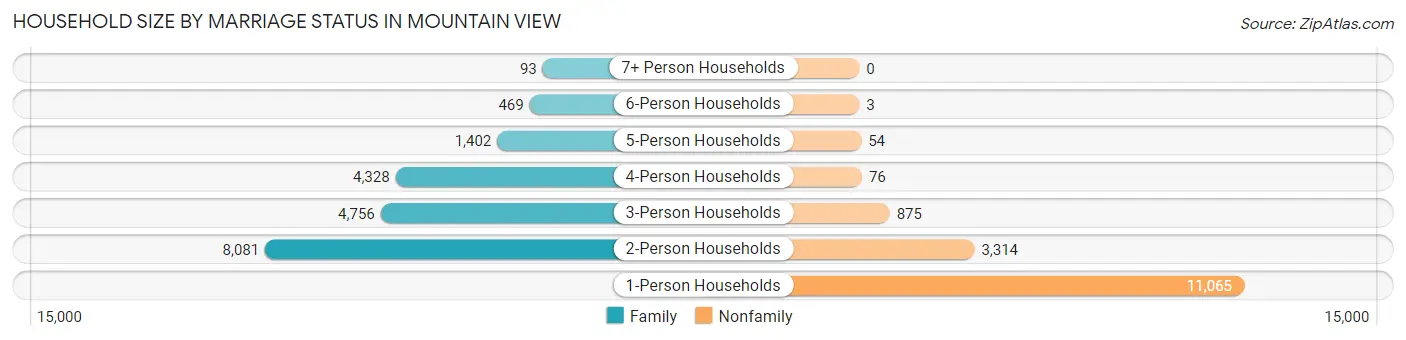
| Household Size | Family Households | Nonfamily Households |
| 1-Person Households | - | 11,065 (32.1%) |
| 2-Person Households | 8,081 (23.4%) | 3,314 (9.6%) |
| 3-Person Households | 4,756 (13.8%) | 875 (2.5%) |
| 4-Person Households | 4,328 (12.5%) | 76 (0.2%) |
| 5-Person Households | 1,402 (4.1%) | 54 (0.2%) |
| 6-Person Households | 469 (1.4%) | 3 (0.0%) |
| 7+ Person Households | 93 (0.3%) | 0 (0.0%) |
| Total | 19,129 (55.4%) | 15,387 (44.6%) |
Female Fertility in Mountain View
Fertility by Age in Mountain View
Average fertility rate in Mountain View is 37.0 births per 1,000 women. Women in the age bracket of 20 to 34 years have the highest fertility rate with 43.0 births per 1,000 women. Women in the age bracket of 20 to 34 years acount for 52.3% of all women with births.
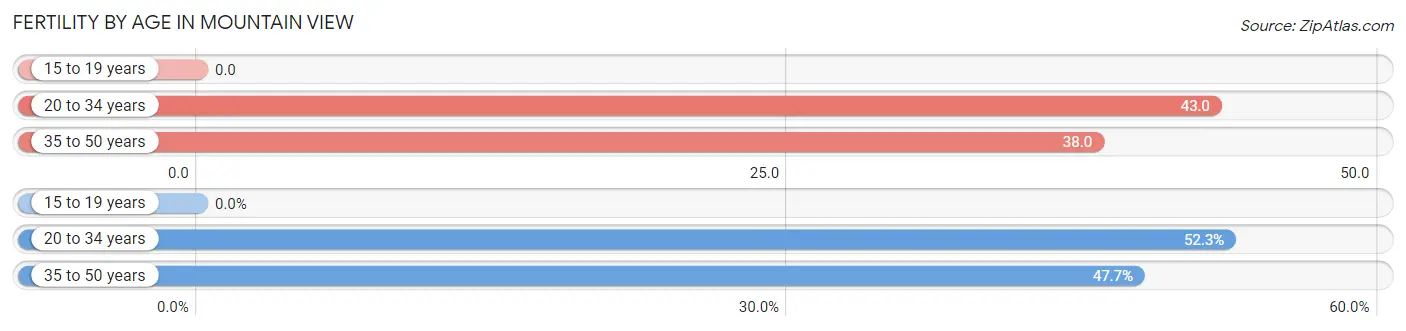
| Age Bracket | Women with Births | Births / 1,000 Women |
| 15 to 19 years | 0 (0.0%) | 0.0 |
| 20 to 34 years | 406 (52.3%) | 43.0 |
| 35 to 50 years | 370 (47.7%) | 38.0 |
| Total | 776 (100.0%) | 37.0 |
Fertility by Age by Marriage Status in Mountain View
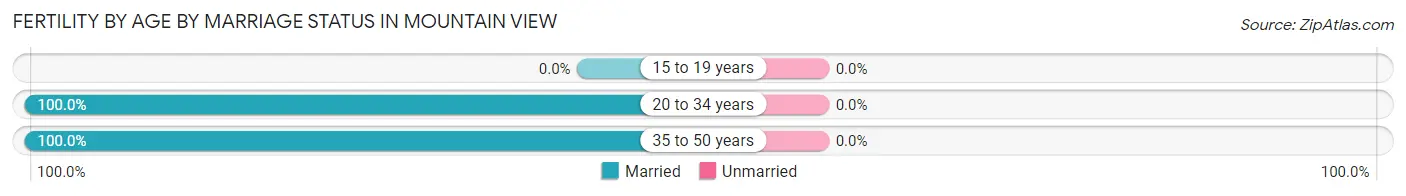
| Age Bracket | Married | Unmarried |
| 15 to 19 years | 0 (0.0%) | 0 (0.0%) |
| 20 to 34 years | 406 (100.0%) | 0 (0.0%) |
| 35 to 50 years | 370 (100.0%) | 0 (0.0%) |
| Total | 776 (100.0%) | 0 (0.0%) |
Fertility by Education in Mountain View
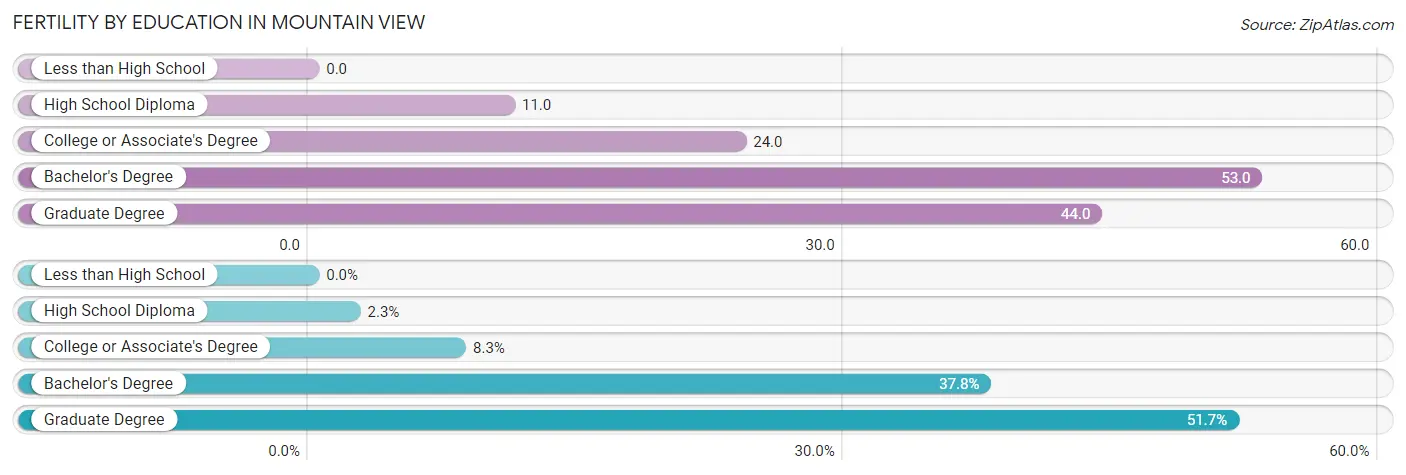
| Educational Attainment | Women with Births | Births / 1,000 Women |
| Less than High School | 0 (0.0%) | 0.0 |
| High School Diploma | 18 (2.3%) | 11.0 |
| College or Associate's Degree | 64 (8.3%) | 24.0 |
| Bachelor's Degree | 293 (37.8%) | 53.0 |
| Graduate Degree | 401 (51.7%) | 44.0 |
| Total | 776 (100.0%) | 37.0 |
Fertility by Education by Marriage Status in Mountain View
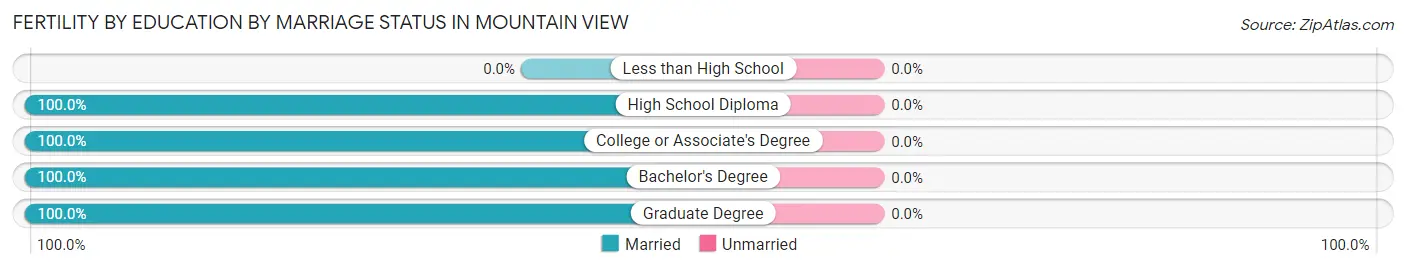
| Educational Attainment | Married | Unmarried |
| Less than High School | 0 (0.0%) | 0 (0.0%) |
| High School Diploma | 18 (100.0%) | 0 (0.0%) |
| College or Associate's Degree | 64 (100.0%) | 0 (0.0%) |
| Bachelor's Degree | 293 (100.0%) | 0 (0.0%) |
| Graduate Degree | 401 (100.0%) | 0 (0.0%) |
| Total | 776 (100.0%) | 0 (0.0%) |
Employment Characteristics in Mountain View
Employment by Class of Employer in Mountain View
Among the 46,481 employed individuals in Mountain View, private company employees (36,037 | 77.5%), not-for-profit organizations (3,777 | 8.1%), and local government employees (2,370 | 5.1%) make up the most common classes of employment.
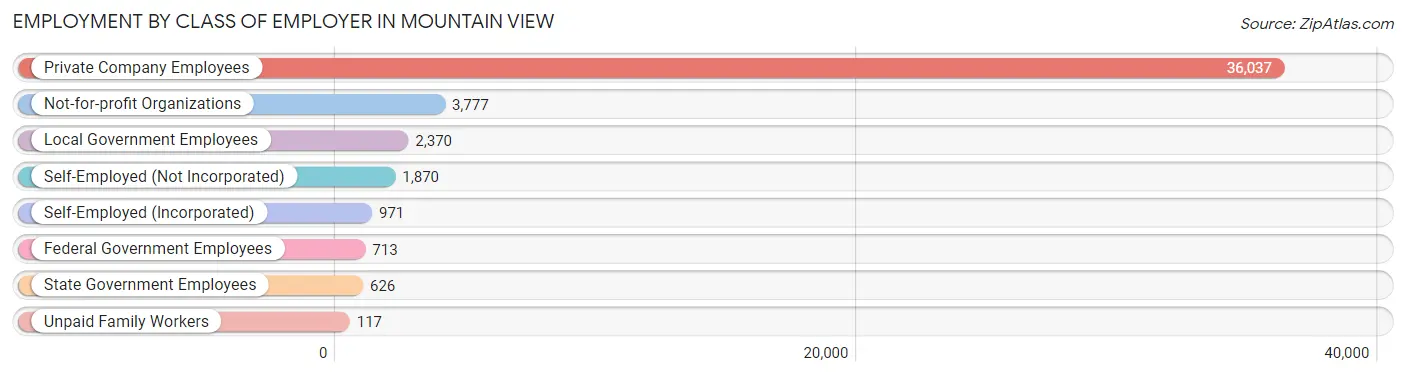
| Employer Class | # Employees | % Employees |
| Private Company Employees | 36,037 | 77.5% |
| Self-Employed (Incorporated) | 971 | 2.1% |
| Self-Employed (Not Incorporated) | 1,870 | 4.0% |
| Not-for-profit Organizations | 3,777 | 8.1% |
| Local Government Employees | 2,370 | 5.1% |
| State Government Employees | 626 | 1.3% |
| Federal Government Employees | 713 | 1.5% |
| Unpaid Family Workers | 117 | 0.3% |
| Total | 46,481 | 100.0% |
Employment Status by Age in Mountain View
According to the labor force statistics for Mountain View, out of the total population over 16 years of age (66,932), 73.0% or 48,860 individuals are in the labor force, with 3.4% or 1,661 of them unemployed. The age group with the highest labor force participation rate is 30 to 34 years, with 91.2% or 8,680 individuals in the labor force. Within the labor force, the 16 to 19 years age range has the highest percentage of unemployed individuals, with 7.7% or 65 of them being unemployed.
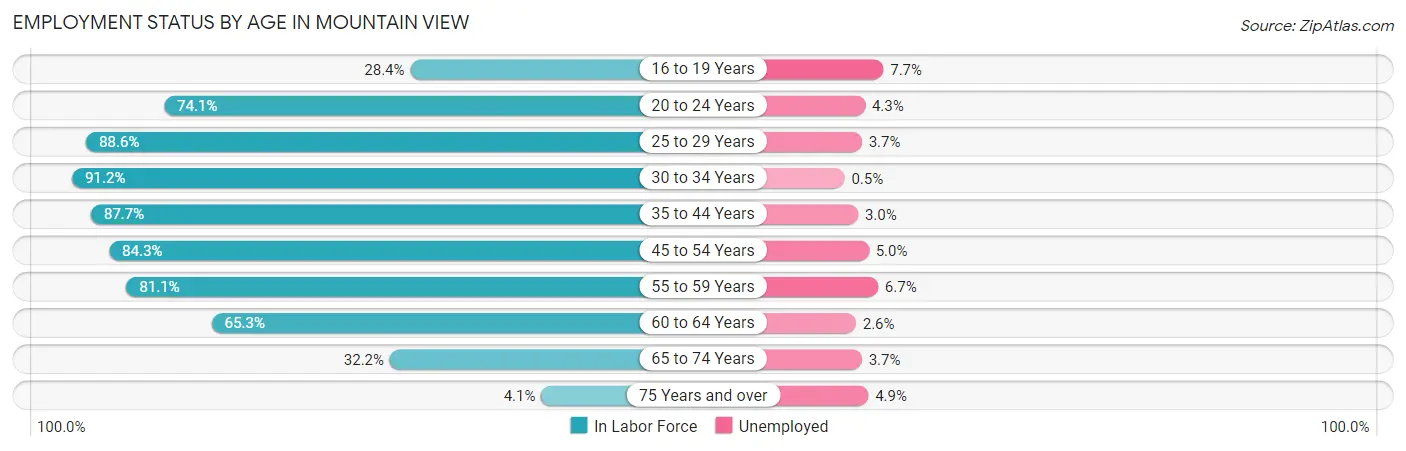
| Age Bracket | In Labor Force | Unemployed |
| 16 to 19 Years | 843 (28.4%) | 65 (7.7%) |
| 20 to 24 Years | 3,147 (74.1%) | 135 (4.3%) |
| 25 to 29 Years | 7,273 (88.6%) | 269 (3.7%) |
| 30 to 34 Years | 8,680 (91.2%) | 43 (0.5%) |
| 35 to 44 Years | 12,587 (87.7%) | 378 (3.0%) |
| 45 to 54 Years | 8,473 (84.3%) | 424 (5.0%) |
| 55 to 59 Years | 3,232 (81.1%) | 217 (6.7%) |
| 60 to 64 Years | 2,766 (65.3%) | 72 (2.6%) |
| 65 to 74 Years | 1,727 (32.2%) | 64 (3.7%) |
| 75 Years and over | 164 (4.1%) | 8 (4.9%) |
| Total | 48,860 (73.0%) | 1,661 (3.4%) |
Employment Status by Educational Attainment in Mountain View
According to labor force statistics for Mountain View, 85.4% of individuals (42,999) out of the total population between 25 and 64 years of age (50,350) are in the labor force, with 3.3% or 1,419 of them being unemployed. The group with the highest labor force participation rate are those with the educational attainment of bachelor's degree or higher, with 89.3% or 34,483 individuals in the labor force. Within the labor force, individuals with college / associate degree education have the highest percentage of unemployment, with 9.4% or 430 of them being unemployed.
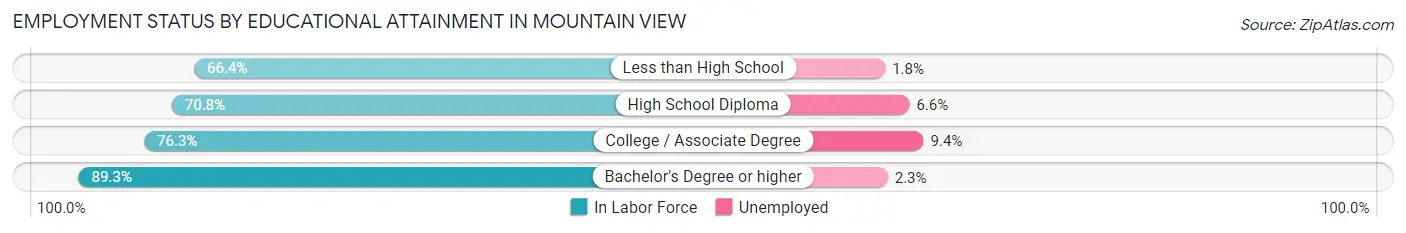
| Educational Attainment | In Labor Force | Unemployed |
| Less than High School | 1,588 (66.4%) | 43 (1.8%) |
| High School Diploma | 2,370 (70.8%) | 221 (6.6%) |
| College / Associate Degree | 4,575 (76.3%) | 564 (9.4%) |
| Bachelor's Degree or higher | 34,483 (89.3%) | 888 (2.3%) |
| Total | 42,999 (85.4%) | 1,662 (3.3%) |
Employment Occupations by Sex in Mountain View
Management, Business, Science and Arts Occupations
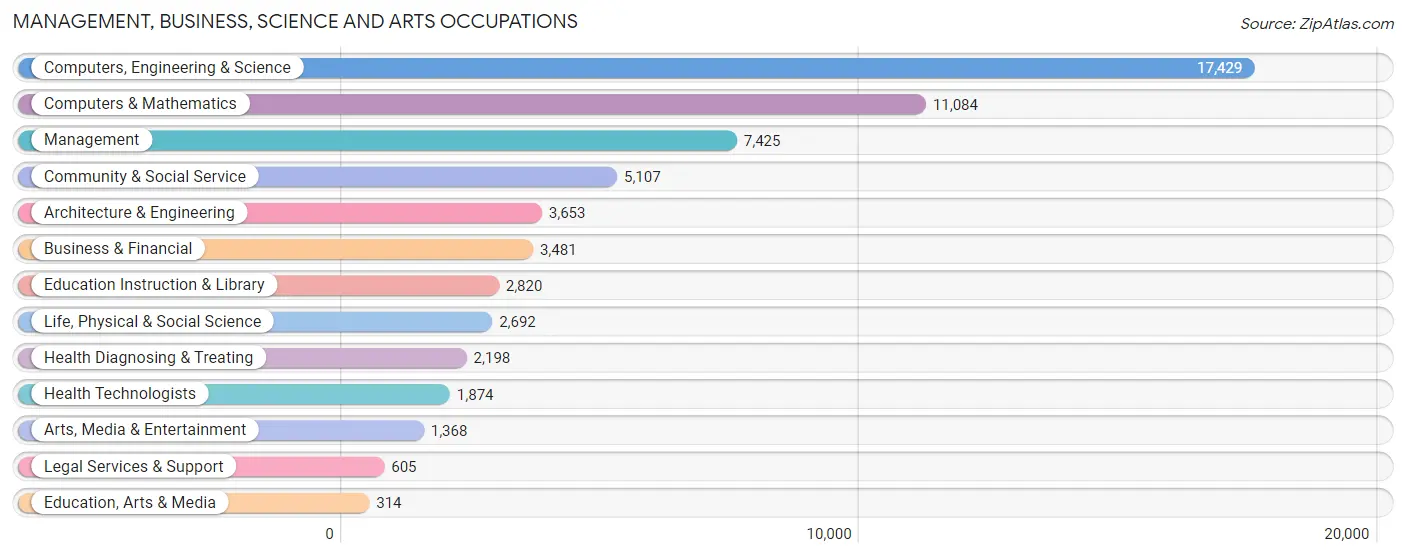
The most common Management, Business, Science and Arts occupations in Mountain View are Computers, Engineering & Science (17,429 | 37.0%), Computers & Mathematics (11,084 | 23.5%), Management (7,425 | 15.8%), Community & Social Service (5,107 | 10.8%), and Architecture & Engineering (3,653 | 7.7%).
Management, Business, Science and Arts Occupations by Sex
Within the Management, Business, Science and Arts occupations in Mountain View, the most male-oriented occupations are Computers & Mathematics (78.5%), Architecture & Engineering (78.2%), and Computers, Engineering & Science (74.0%), while the most female-oriented occupations are Education Instruction & Library (66.6%), Legal Services & Support (65.3%), and Health Diagnosing & Treating (64.9%).
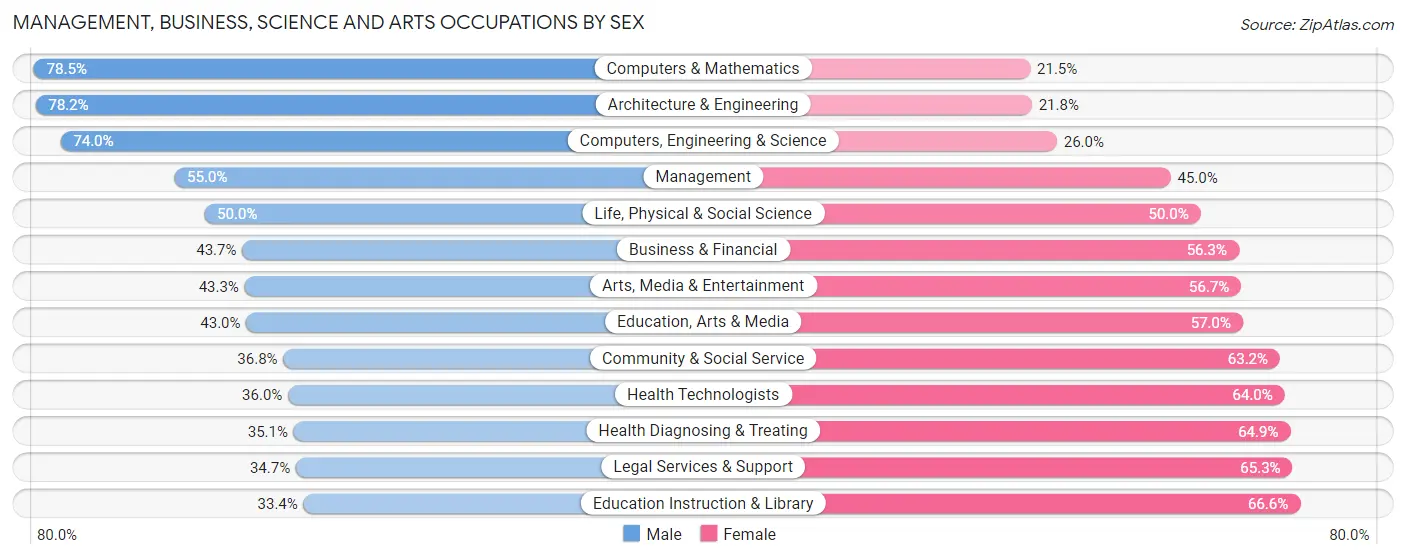
| Occupation | Male | Female |
| Management | 4,087 (55.0%) | 3,338 (45.0%) |
| Business & Financial | 1,520 (43.7%) | 1,961 (56.3%) |
| Computers, Engineering & Science | 12,903 (74.0%) | 4,526 (26.0%) |
| Computers & Mathematics | 8,699 (78.5%) | 2,385 (21.5%) |
| Architecture & Engineering | 2,857 (78.2%) | 796 (21.8%) |
| Life, Physical & Social Science | 1,347 (50.0%) | 1,345 (50.0%) |
| Community & Social Service | 1,880 (36.8%) | 3,227 (63.2%) |
| Education, Arts & Media | 135 (43.0%) | 179 (57.0%) |
| Legal Services & Support | 210 (34.7%) | 395 (65.3%) |
| Education Instruction & Library | 943 (33.4%) | 1,877 (66.6%) |
| Arts, Media & Entertainment | 592 (43.3%) | 776 (56.7%) |
| Health Diagnosing & Treating | 771 (35.1%) | 1,427 (64.9%) |
| Health Technologists | 675 (36.0%) | 1,199 (64.0%) |
| Total (Category) | 21,161 (59.4%) | 14,479 (40.6%) |
| Total (Overall) | 27,695 (58.8%) | 19,418 (41.2%) |
Services Occupations
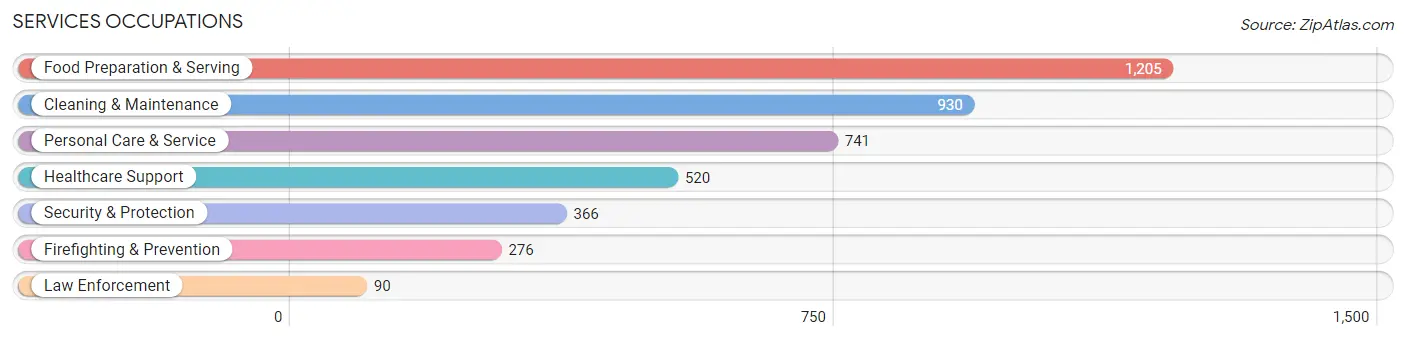
The most common Services occupations in Mountain View are Food Preparation & Serving (1,205 | 2.6%), Cleaning & Maintenance (930 | 2.0%), Personal Care & Service (741 | 1.6%), Healthcare Support (520 | 1.1%), and Security & Protection (366 | 0.8%).
Services Occupations by Sex
Within the Services occupations in Mountain View, the most male-oriented occupations are Firefighting & Prevention (91.7%), Security & Protection (89.6%), and Law Enforcement (83.3%), while the most female-oriented occupations are Personal Care & Service (77.9%), Healthcare Support (77.5%), and Cleaning & Maintenance (38.3%).
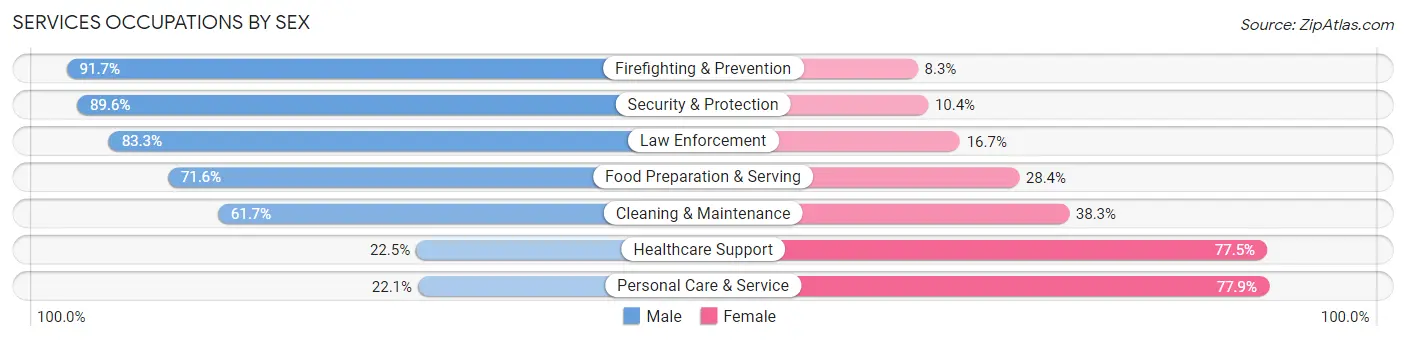
| Occupation | Male | Female |
| Healthcare Support | 117 (22.5%) | 403 (77.5%) |
| Security & Protection | 328 (89.6%) | 38 (10.4%) |
| Firefighting & Prevention | 253 (91.7%) | 23 (8.3%) |
| Law Enforcement | 75 (83.3%) | 15 (16.7%) |
| Food Preparation & Serving | 863 (71.6%) | 342 (28.4%) |
| Cleaning & Maintenance | 574 (61.7%) | 356 (38.3%) |
| Personal Care & Service | 164 (22.1%) | 577 (77.9%) |
| Total (Category) | 2,046 (54.4%) | 1,716 (45.6%) |
| Total (Overall) | 27,695 (58.8%) | 19,418 (41.2%) |
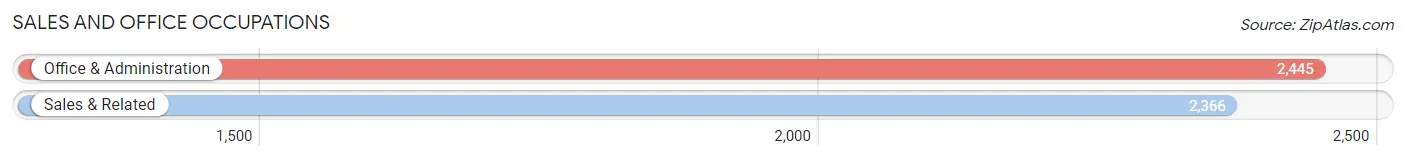
Sales and Office Occupations
The most common Sales and Office occupations in Mountain View are Office & Administration (2,445 | 5.2%), and Sales & Related (2,366 | 5.0%).
Sales and Office Occupations by Sex
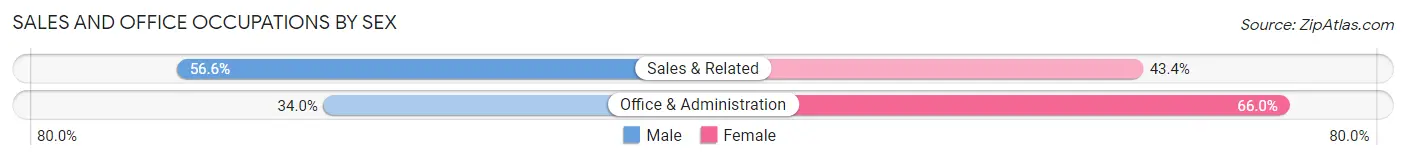
| Occupation | Male | Female |
| Sales & Related | 1,339 (56.6%) | 1,027 (43.4%) |
| Office & Administration | 831 (34.0%) | 1,614 (66.0%) |
| Total (Category) | 2,170 (45.1%) | 2,641 (54.9%) |
| Total (Overall) | 27,695 (58.8%) | 19,418 (41.2%) |
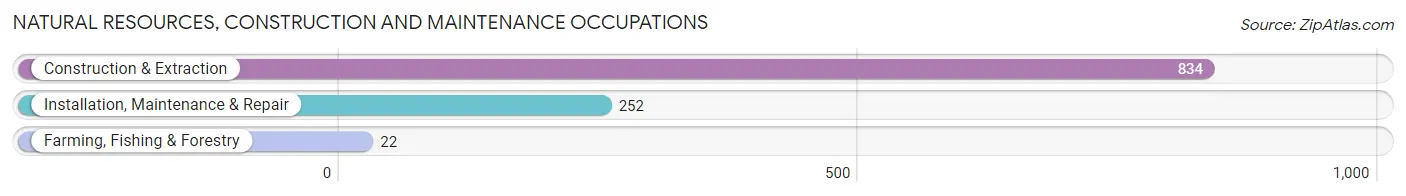
Natural Resources, Construction and Maintenance Occupations
The most common Natural Resources, Construction and Maintenance occupations in Mountain View are Construction & Extraction (834 | 1.8%), Installation, Maintenance & Repair (252 | 0.5%), and Farming, Fishing & Forestry (22 | 0.1%).
Natural Resources, Construction and Maintenance Occupations by Sex
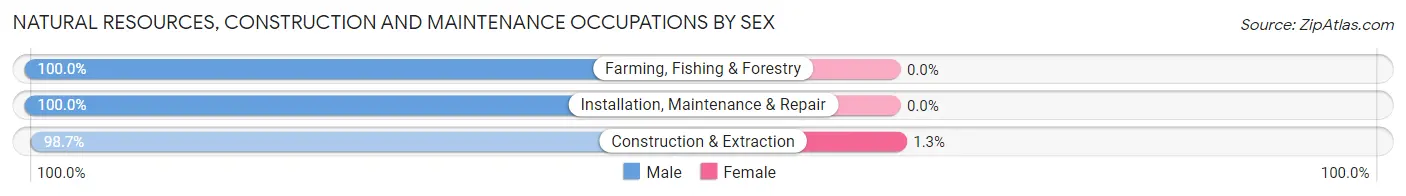
| Occupation | Male | Female |
| Farming, Fishing & Forestry | 22 (100.0%) | 0 (0.0%) |
| Construction & Extraction | 823 (98.7%) | 11 (1.3%) |
| Installation, Maintenance & Repair | 252 (100.0%) | 0 (0.0%) |
| Total (Category) | 1,097 (99.0%) | 11 (1.0%) |
| Total (Overall) | 27,695 (58.8%) | 19,418 (41.2%) |
Production, Transportation and Moving Occupations
The most common Production, Transportation and Moving occupations in Mountain View are Production (750 | 1.6%), Material Moving (578 | 1.2%), and Transportation (464 | 1.0%).
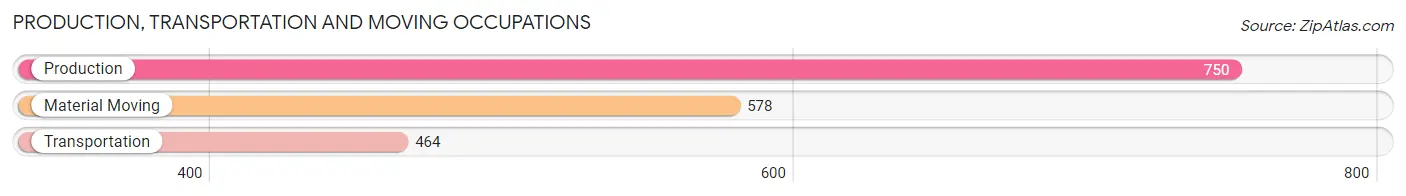
Production, Transportation and Moving Occupations by Sex
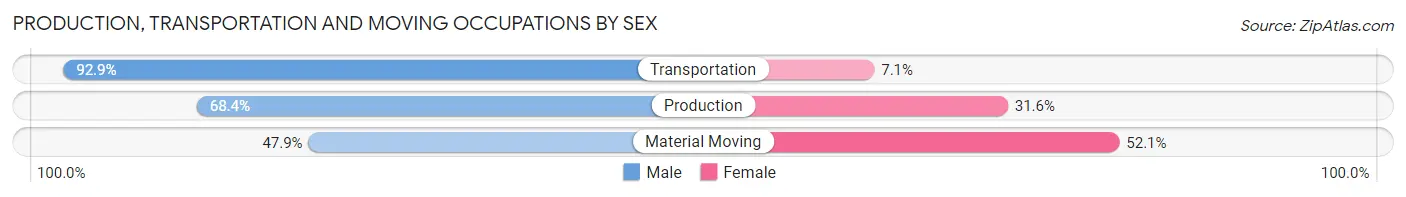
| Occupation | Male | Female |
| Production | 513 (68.4%) | 237 (31.6%) |
| Transportation | 431 (92.9%) | 33 (7.1%) |
| Material Moving | 277 (47.9%) | 301 (52.1%) |
| Total (Category) | 1,221 (68.1%) | 571 (31.9%) |
| Total (Overall) | 27,695 (58.8%) | 19,418 (41.2%) |
Employment Industries by Sex in Mountain View
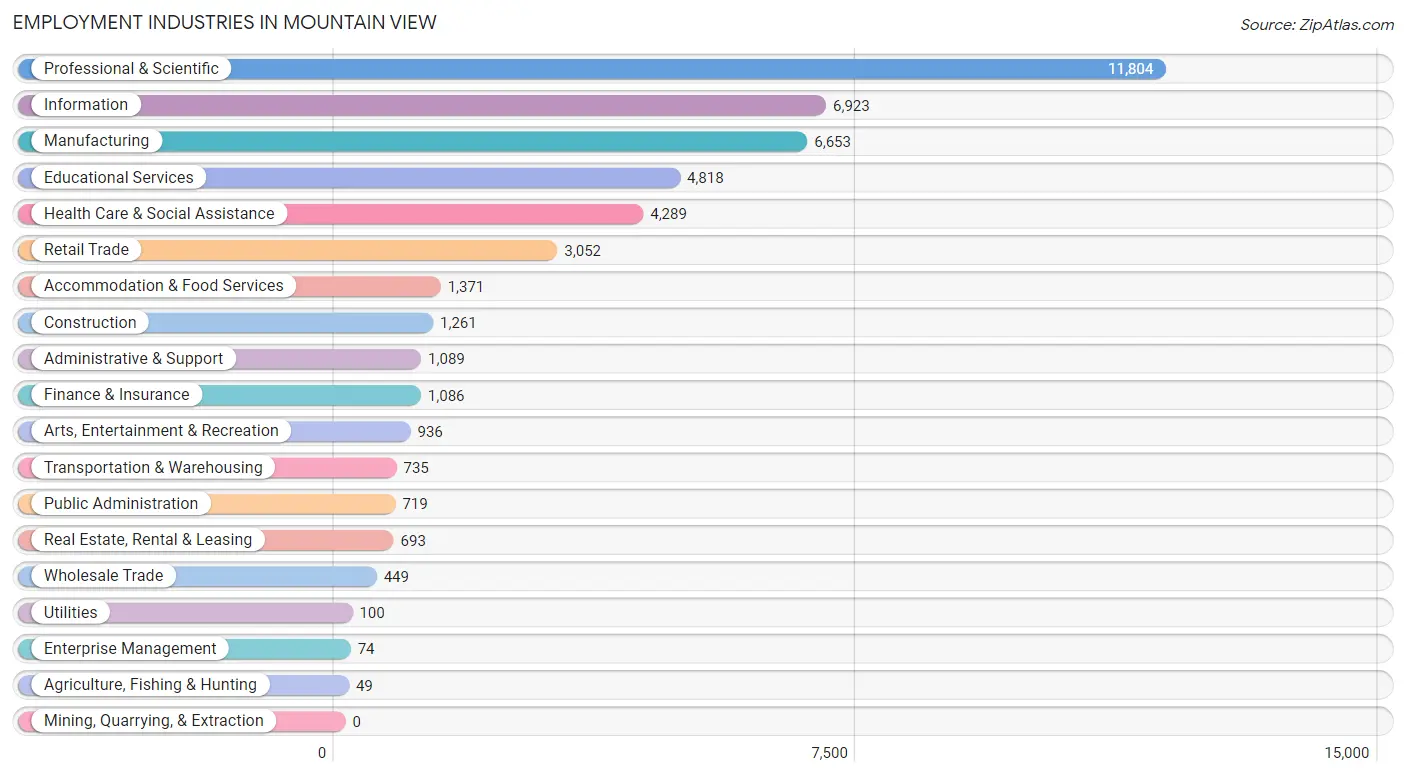
Employment Industries in Mountain View
The major employment industries in Mountain View include Professional & Scientific (11,804 | 25.1%), Information (6,923 | 14.7%), Manufacturing (6,653 | 14.1%), Educational Services (4,818 | 10.2%), and Health Care & Social Assistance (4,289 | 9.1%).
Employment Industries by Sex in Mountain View
The Mountain View industries that see more men than women are Construction (86.2%), Transportation & Warehousing (83.8%), and Information (69.3%), whereas the industries that tend to have a higher number of women are Health Care & Social Assistance (66.0%), Educational Services (62.4%), and Utilities (50.0%).
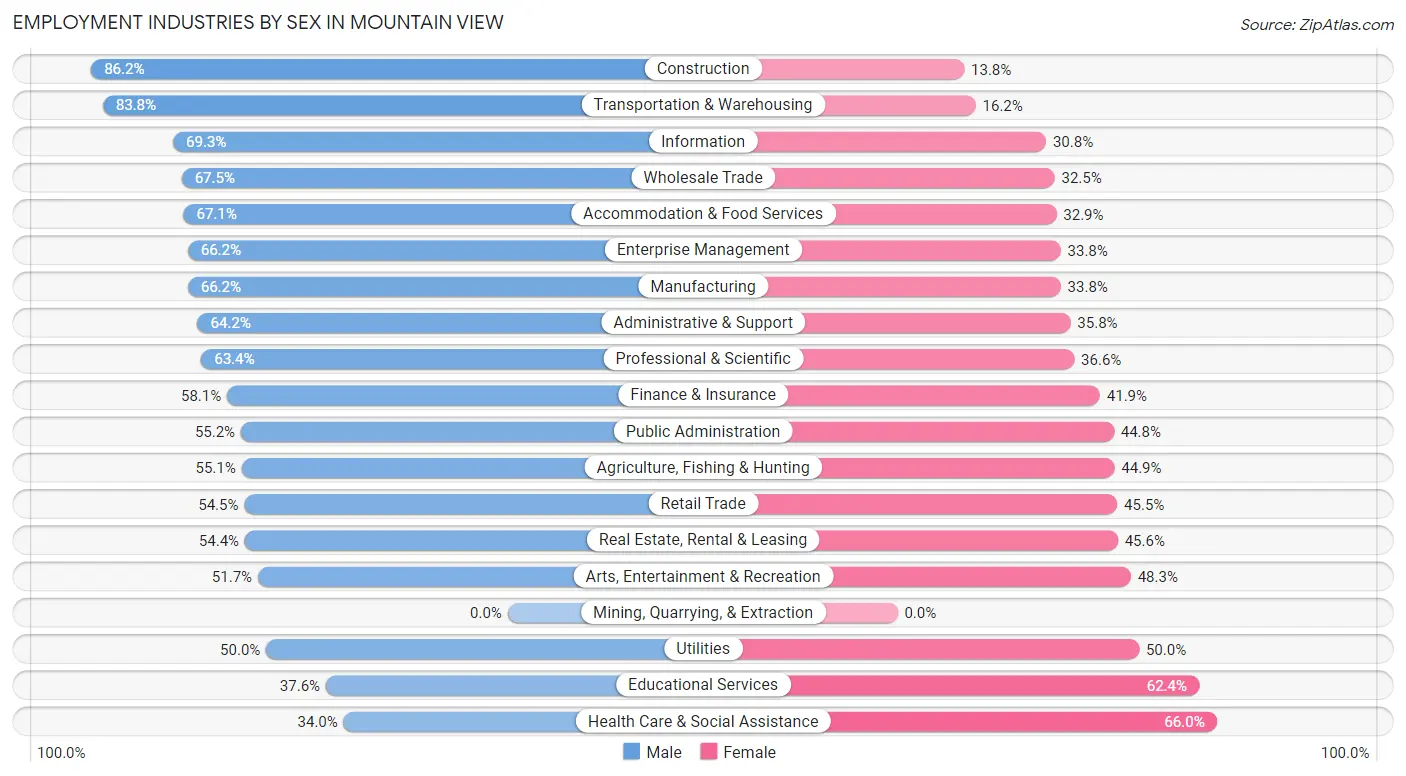
| Industry | Male | Female |
| Agriculture, Fishing & Hunting | 27 (55.1%) | 22 (44.9%) |
| Mining, Quarrying, & Extraction | 0 (0.0%) | 0 (0.0%) |
| Construction | 1,087 (86.2%) | 174 (13.8%) |
| Manufacturing | 4,405 (66.2%) | 2,248 (33.8%) |
| Wholesale Trade | 303 (67.5%) | 146 (32.5%) |
| Retail Trade | 1,664 (54.5%) | 1,388 (45.5%) |
| Transportation & Warehousing | 616 (83.8%) | 119 (16.2%) |
| Utilities | 50 (50.0%) | 50 (50.0%) |
| Information | 4,794 (69.3%) | 2,129 (30.7%) |
| Finance & Insurance | 631 (58.1%) | 455 (41.9%) |
| Real Estate, Rental & Leasing | 377 (54.4%) | 316 (45.6%) |
| Professional & Scientific | 7,486 (63.4%) | 4,318 (36.6%) |
| Enterprise Management | 49 (66.2%) | 25 (33.8%) |
| Administrative & Support | 699 (64.2%) | 390 (35.8%) |
| Educational Services | 1,813 (37.6%) | 3,005 (62.4%) |
| Health Care & Social Assistance | 1,457 (34.0%) | 2,832 (66.0%) |
| Arts, Entertainment & Recreation | 484 (51.7%) | 452 (48.3%) |
| Accommodation & Food Services | 920 (67.1%) | 451 (32.9%) |
| Public Administration | 397 (55.2%) | 322 (44.8%) |
| Total | 27,695 (58.8%) | 19,418 (41.2%) |
Education in Mountain View
School Enrollment in Mountain View
The most common levels of schooling among the 18,532 students in Mountain View are elementary school (4,155 | 22.4%), high school (3,792 | 20.5%), and college / undergraduate (3,267 | 17.6%).
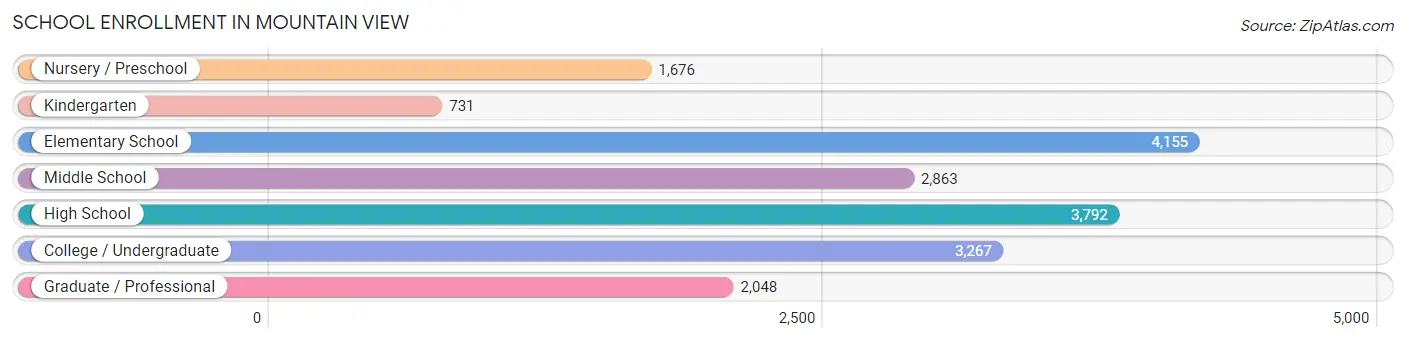
| School Level | # Students | % Students |
| Nursery / Preschool | 1,676 | 9.0% |
| Kindergarten | 731 | 3.9% |
| Elementary School | 4,155 | 22.4% |
| Middle School | 2,863 | 15.4% |
| High School | 3,792 | 20.5% |
| College / Undergraduate | 3,267 | 17.6% |
| Graduate / Professional | 2,048 | 11.1% |
| Total | 18,532 | 100.0% |
School Enrollment by Age by Funding Source in Mountain View
Out of a total of 18,532 students who are enrolled in schools in Mountain View, 5,170 (27.9%) attend a private institution, while the remaining 13,362 (72.1%) are enrolled in public schools. The age group of 3 to 4 year olds has the highest likelihood of being enrolled in private schools, with 1,102 (78.7% in the age bracket) enrolled. Conversely, the age group of 5 to 9 year old has the lowest likelihood of being enrolled in a private school, with 3,725 (82.2% in the age bracket) attending a public institution.
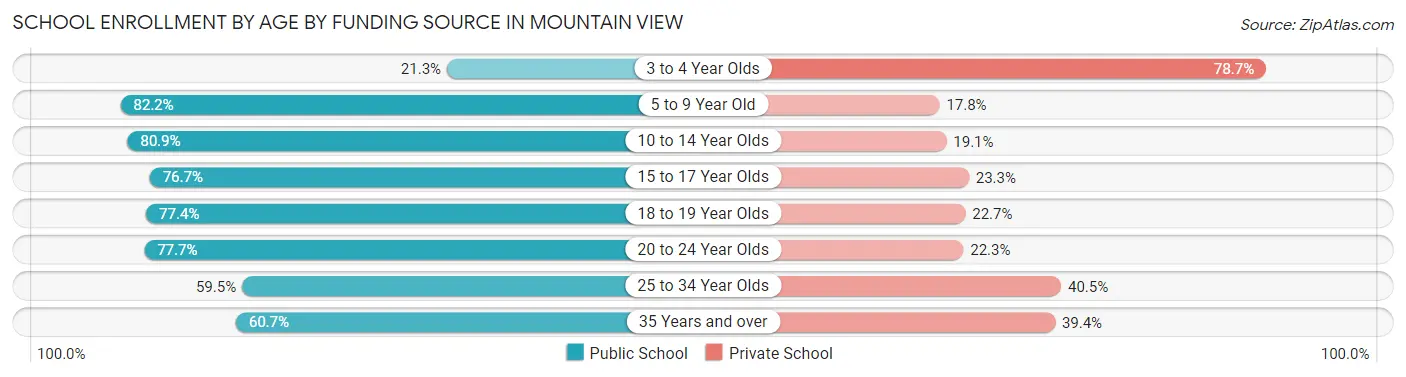
| Age Bracket | Public School | Private School |
| 3 to 4 Year Olds | 299 (21.3%) | 1,102 (78.7%) |
| 5 to 9 Year Old | 3,725 (82.2%) | 809 (17.8%) |
| 10 to 14 Year Olds | 3,440 (80.9%) | 814 (19.1%) |
| 15 to 17 Year Olds | 2,033 (76.7%) | 618 (23.3%) |
| 18 to 19 Year Olds | 871 (77.3%) | 255 (22.7%) |
| 20 to 24 Year Olds | 1,137 (77.7%) | 326 (22.3%) |
| 25 to 34 Year Olds | 1,148 (59.5%) | 781 (40.5%) |
| 35 Years and over | 712 (60.7%) | 462 (39.4%) |
| Total | 13,362 (72.1%) | 5,170 (27.9%) |
Educational Attainment by Field of Study in Mountain View
Engineering (11,806 | 24.6%), computers & mathematics (8,144 | 16.9%), business (4,610 | 9.6%), social sciences (4,005 | 8.3%), and bio, nature & agricultural (3,236 | 6.7%) are the most common fields of study among 48,066 individuals in Mountain View who have obtained a bachelor's degree or higher.
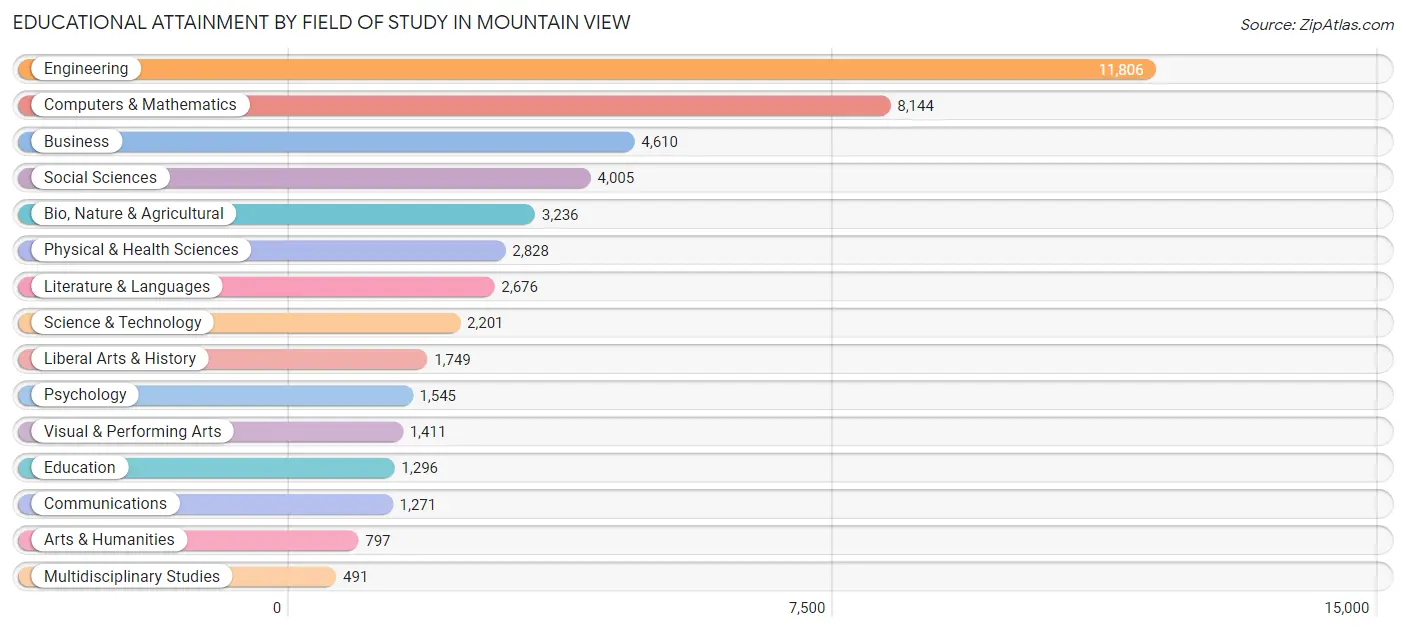
| Field of Study | # Graduates | % Graduates |
| Computers & Mathematics | 8,144 | 16.9% |
| Bio, Nature & Agricultural | 3,236 | 6.7% |
| Physical & Health Sciences | 2,828 | 5.9% |
| Psychology | 1,545 | 3.2% |
| Social Sciences | 4,005 | 8.3% |
| Engineering | 11,806 | 24.6% |
| Multidisciplinary Studies | 491 | 1.0% |
| Science & Technology | 2,201 | 4.6% |
| Business | 4,610 | 9.6% |
| Education | 1,296 | 2.7% |
| Literature & Languages | 2,676 | 5.6% |
| Liberal Arts & History | 1,749 | 3.6% |
| Visual & Performing Arts | 1,411 | 2.9% |
| Communications | 1,271 | 2.6% |
| Arts & Humanities | 797 | 1.7% |
| Total | 48,066 | 100.0% |
Transportation & Commute in Mountain View
Vehicle Availability by Sex in Mountain View
The most prevalent vehicle ownership categories in Mountain View are males with 2 vehicles (11,062, accounting for 40.2%) and females with 2 vehicles (8,253, making up 58.3%).
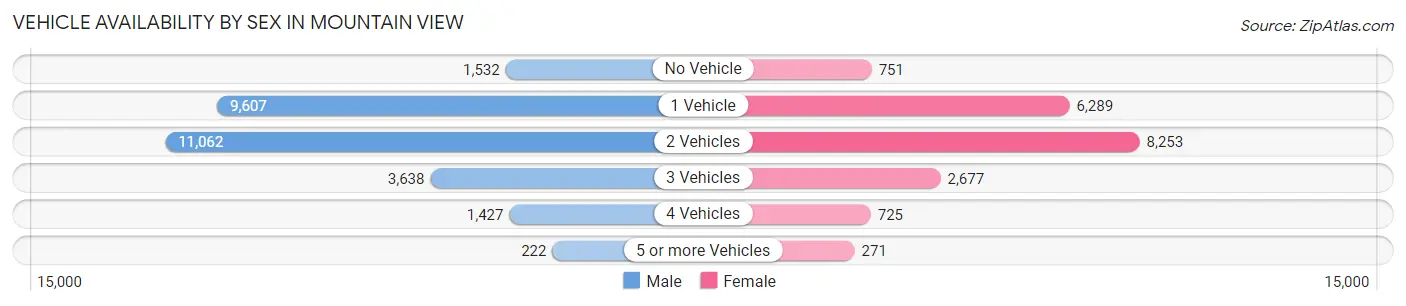
| Vehicles Available | Male | Female |
| No Vehicle | 1,532 (5.6%) | 751 (4.0%) |
| 1 Vehicle | 9,607 (34.9%) | 6,289 (33.2%) |
| 2 Vehicles | 11,062 (40.2%) | 8,253 (43.5%) |
| 3 Vehicles | 3,638 (13.2%) | 2,677 (14.1%) |
| 4 Vehicles | 1,427 (5.2%) | 725 (3.8%) |
| 5 or more Vehicles | 222 (0.8%) | 271 (1.4%) |
| Total | 27,488 (100.0%) | 18,966 (100.0%) |
Commute Time in Mountain View
The most frequently occuring commute durations in Mountain View are 20 to 24 minutes (7,493 commuters, 21.6%), 15 to 19 minutes (6,789 commuters, 19.6%), and 10 to 14 minutes (5,194 commuters, 15.0%).
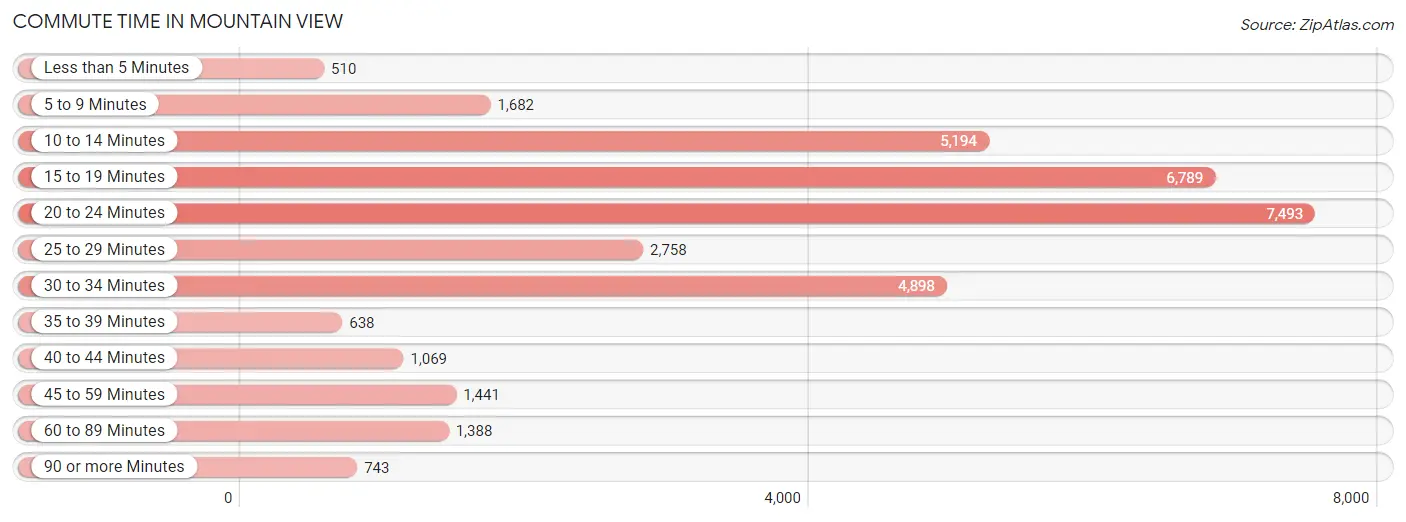
| Commute Time | # Commuters | % Commuters |
| Less than 5 Minutes | 510 | 1.5% |
| 5 to 9 Minutes | 1,682 | 4.9% |
| 10 to 14 Minutes | 5,194 | 15.0% |
| 15 to 19 Minutes | 6,789 | 19.6% |
| 20 to 24 Minutes | 7,493 | 21.6% |
| 25 to 29 Minutes | 2,758 | 8.0% |
| 30 to 34 Minutes | 4,898 | 14.1% |
| 35 to 39 Minutes | 638 | 1.8% |
| 40 to 44 Minutes | 1,069 | 3.1% |
| 45 to 59 Minutes | 1,441 | 4.2% |
| 60 to 89 Minutes | 1,388 | 4.0% |
| 90 or more Minutes | 743 | 2.1% |
Commute Time by Sex in Mountain View
The most common commute times in Mountain View are 20 to 24 minutes (4,425 commuters, 22.1%) for males and 20 to 24 minutes (3,068 commuters, 21.1%) for females.
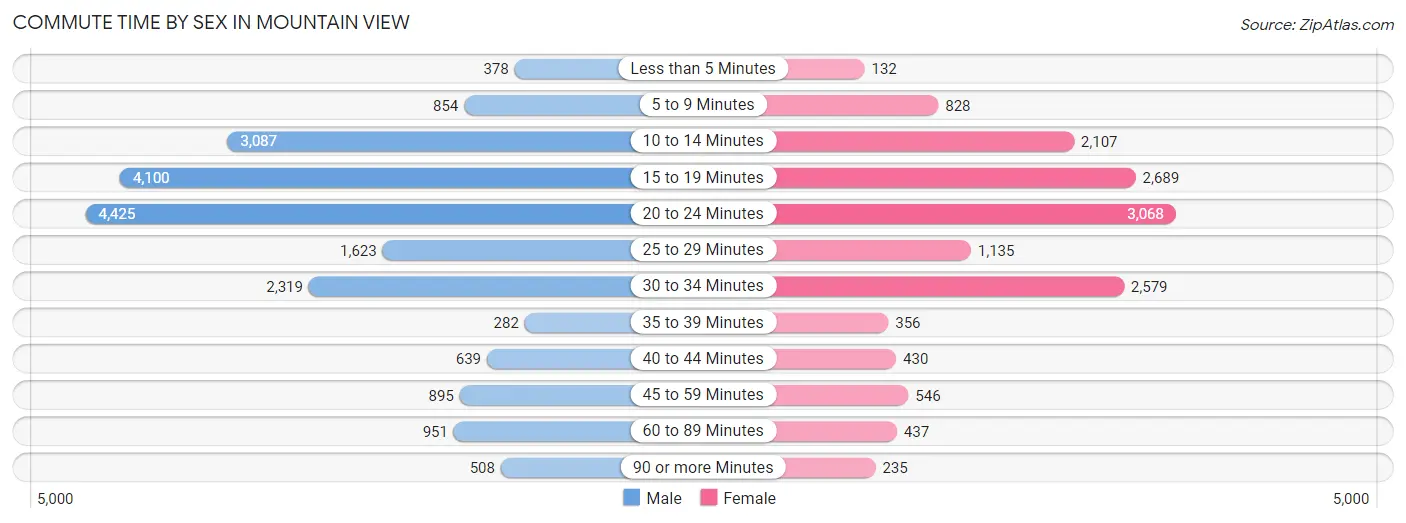
| Commute Time | Male | Female |
| Less than 5 Minutes | 378 (1.9%) | 132 (0.9%) |
| 5 to 9 Minutes | 854 (4.3%) | 828 (5.7%) |
| 10 to 14 Minutes | 3,087 (15.4%) | 2,107 (14.5%) |
| 15 to 19 Minutes | 4,100 (20.4%) | 2,689 (18.5%) |
| 20 to 24 Minutes | 4,425 (22.1%) | 3,068 (21.1%) |
| 25 to 29 Minutes | 1,623 (8.1%) | 1,135 (7.8%) |
| 30 to 34 Minutes | 2,319 (11.6%) | 2,579 (17.7%) |
| 35 to 39 Minutes | 282 (1.4%) | 356 (2.5%) |
| 40 to 44 Minutes | 639 (3.2%) | 430 (3.0%) |
| 45 to 59 Minutes | 895 (4.5%) | 546 (3.7%) |
| 60 to 89 Minutes | 951 (4.7%) | 437 (3.0%) |
| 90 or more Minutes | 508 (2.5%) | 235 (1.6%) |
Time of Departure to Work by Sex in Mountain View
The most frequent times of departure to work in Mountain View are 9:00 AM to 9:59 AM (4,325, 21.6%) for males and 8:00 AM to 8:29 AM (2,875, 19.8%) for females.
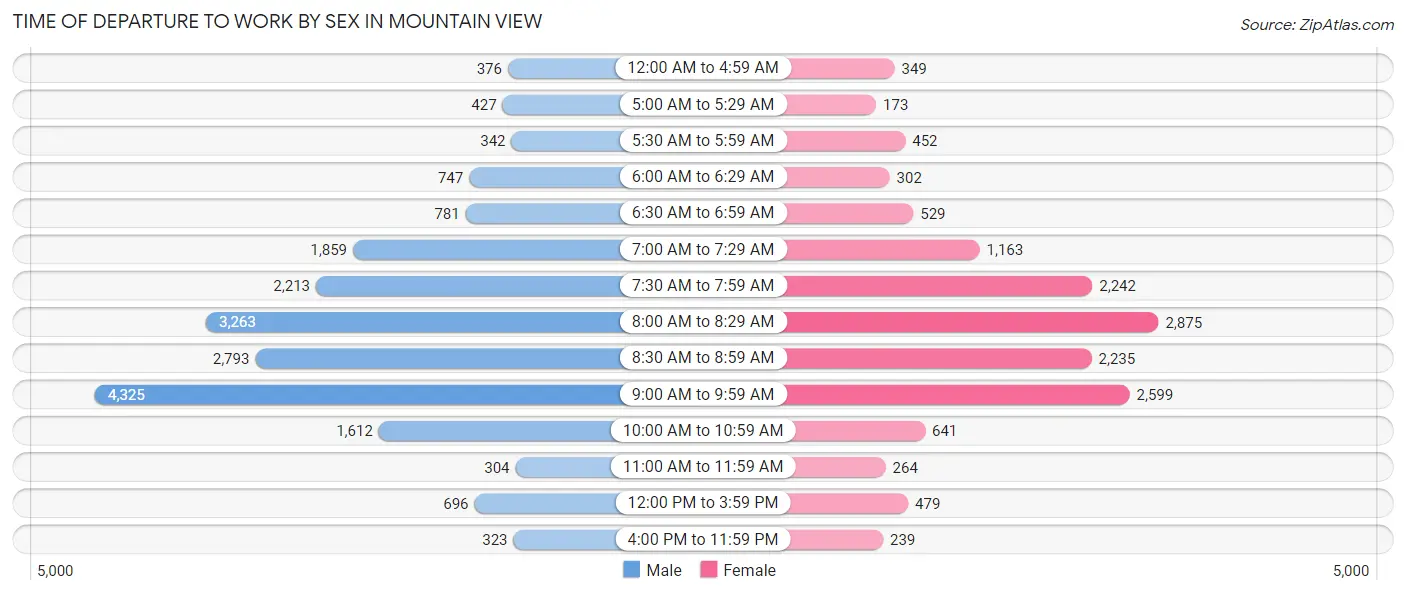
| Time of Departure | Male | Female |
| 12:00 AM to 4:59 AM | 376 (1.9%) | 349 (2.4%) |
| 5:00 AM to 5:29 AM | 427 (2.1%) | 173 (1.2%) |
| 5:30 AM to 5:59 AM | 342 (1.7%) | 452 (3.1%) |
| 6:00 AM to 6:29 AM | 747 (3.7%) | 302 (2.1%) |
| 6:30 AM to 6:59 AM | 781 (3.9%) | 529 (3.6%) |
| 7:00 AM to 7:29 AM | 1,859 (9.3%) | 1,163 (8.0%) |
| 7:30 AM to 7:59 AM | 2,213 (11.0%) | 2,242 (15.4%) |
| 8:00 AM to 8:29 AM | 3,263 (16.3%) | 2,875 (19.8%) |
| 8:30 AM to 8:59 AM | 2,793 (13.9%) | 2,235 (15.4%) |
| 9:00 AM to 9:59 AM | 4,325 (21.6%) | 2,599 (17.9%) |
| 10:00 AM to 10:59 AM | 1,612 (8.0%) | 641 (4.4%) |
| 11:00 AM to 11:59 AM | 304 (1.5%) | 264 (1.8%) |
| 12:00 PM to 3:59 PM | 696 (3.5%) | 479 (3.3%) |
| 4:00 PM to 11:59 PM | 323 (1.6%) | 239 (1.6%) |
| Total | 20,061 (100.0%) | 14,542 (100.0%) |
Housing Occupancy in Mountain View
Occupancy by Ownership in Mountain View
Of the total 34,516 dwellings in Mountain View, owner-occupied units account for 13,660 (39.6%), while renter-occupied units make up 20,856 (60.4%).
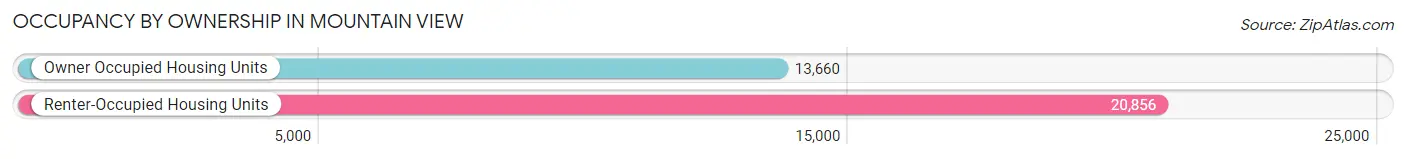
| Occupancy | # Housing Units | % Housing Units |
| Owner Occupied Housing Units | 13,660 | 39.6% |
| Renter-Occupied Housing Units | 20,856 | 60.4% |
| Total Occupied Housing Units | 34,516 | 100.0% |
Occupancy by Household Size in Mountain View
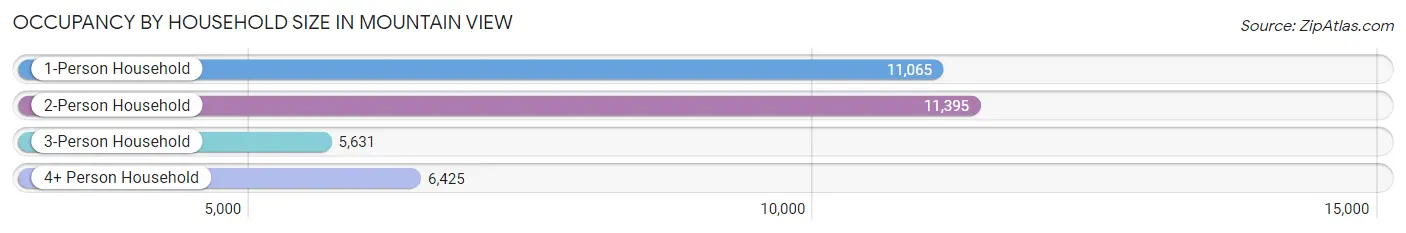
| Household Size | # Housing Units | % Housing Units |
| 1-Person Household | 11,065 | 32.1% |
| 2-Person Household | 11,395 | 33.0% |
| 3-Person Household | 5,631 | 16.3% |
| 4+ Person Household | 6,425 | 18.6% |
| Total Housing Units | 34,516 | 100.0% |
Occupancy by Ownership by Household Size in Mountain View
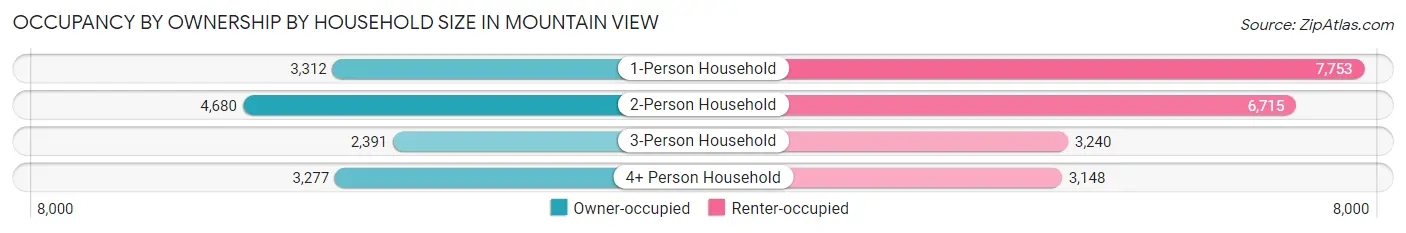
| Household Size | Owner-occupied | Renter-occupied |
| 1-Person Household | 3,312 (29.9%) | 7,753 (70.1%) |
| 2-Person Household | 4,680 (41.1%) | 6,715 (58.9%) |
| 3-Person Household | 2,391 (42.5%) | 3,240 (57.5%) |
| 4+ Person Household | 3,277 (51.0%) | 3,148 (49.0%) |
| Total Housing Units | 13,660 (39.6%) | 20,856 (60.4%) |
Occupancy by Educational Attainment in Mountain View
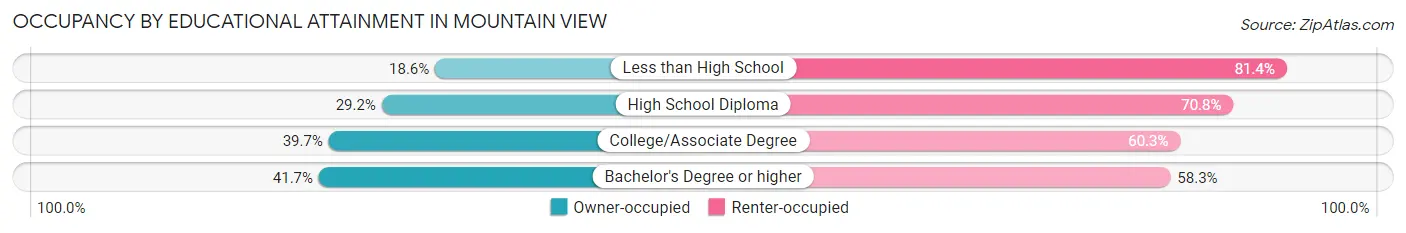
| Household Size | Owner-occupied | Renter-occupied |
| Less than High School | 299 (18.6%) | 1,308 (81.4%) |
| High School Diploma | 621 (29.2%) | 1,506 (70.8%) |
| College/Associate Degree | 1,721 (39.7%) | 2,613 (60.3%) |
| Bachelor's Degree or higher | 11,019 (41.7%) | 15,429 (58.3%) |
Occupancy by Age of Householder in Mountain View
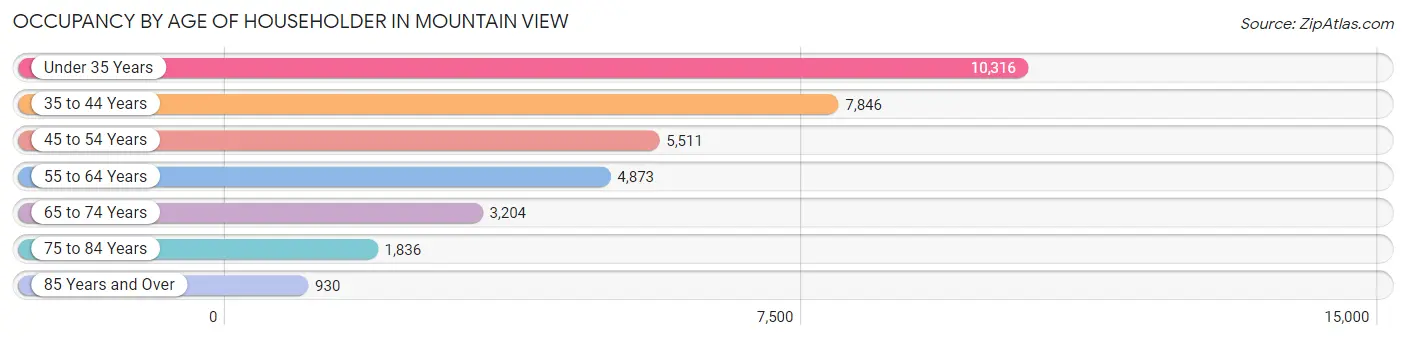
| Age Bracket | # Households | % Households |
| Under 35 Years | 10,316 | 29.9% |
| 35 to 44 Years | 7,846 | 22.7% |
| 45 to 54 Years | 5,511 | 16.0% |
| 55 to 64 Years | 4,873 | 14.1% |
| 65 to 74 Years | 3,204 | 9.3% |
| 75 to 84 Years | 1,836 | 5.3% |
| 85 Years and Over | 930 | 2.7% |
| Total | 34,516 | 100.0% |
Housing Finances in Mountain View
Median Income by Occupancy in Mountain View
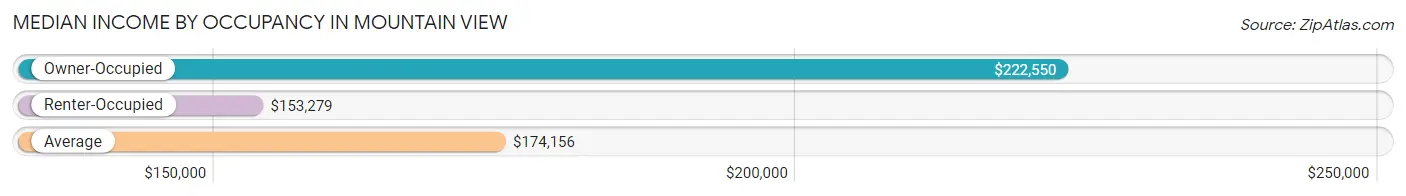
| Occupancy Type | # Households | Median Income |
| Owner-Occupied | 13,660 (39.6%) | $222,550 |
| Renter-Occupied | 20,856 (60.4%) | $153,279 |
| Average | 34,516 (100.0%) | $174,156 |
Occupancy by Householder Income Bracket in Mountain View
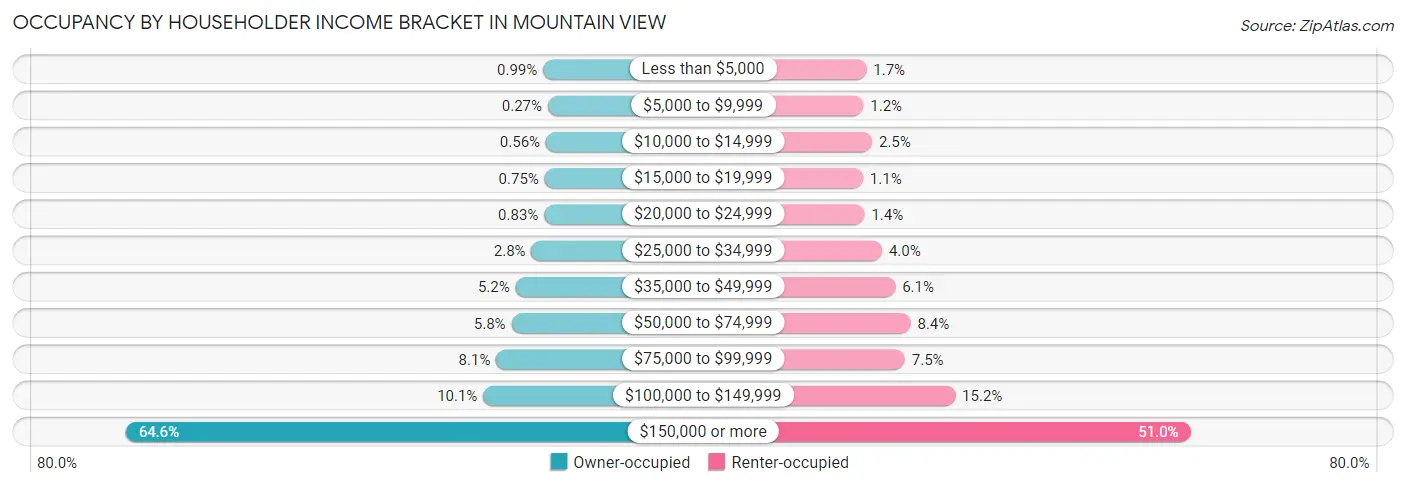
| Income Bracket | Owner-occupied | Renter-occupied |
| Less than $5,000 | 135 (1.0%) | 345 (1.7%) |
| $5,000 to $9,999 | 37 (0.3%) | 248 (1.2%) |
| $10,000 to $14,999 | 77 (0.6%) | 524 (2.5%) |
| $15,000 to $19,999 | 103 (0.7%) | 234 (1.1%) |
| $20,000 to $24,999 | 113 (0.8%) | 283 (1.4%) |
| $25,000 to $34,999 | 379 (2.8%) | 840 (4.0%) |
| $35,000 to $49,999 | 709 (5.2%) | 1,261 (6.0%) |
| $50,000 to $74,999 | 793 (5.8%) | 1,748 (8.4%) |
| $75,000 to $99,999 | 1,110 (8.1%) | 1,567 (7.5%) |
| $100,000 to $149,999 | 1,383 (10.1%) | 3,165 (15.2%) |
| $150,000 or more | 8,821 (64.6%) | 10,641 (51.0%) |
| Total | 13,660 (100.0%) | 20,856 (100.0%) |
Monthly Housing Cost Tiers in Mountain View
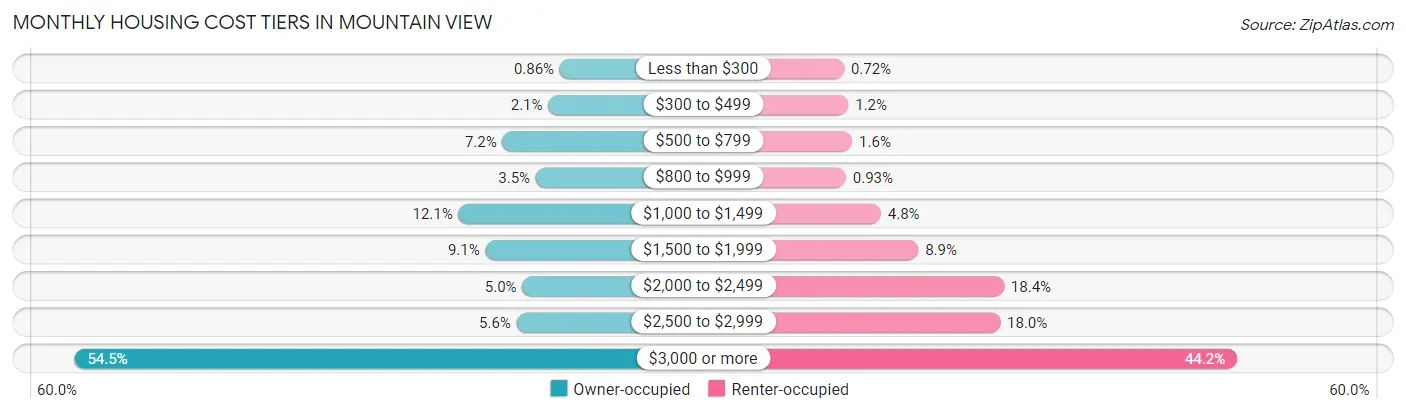
| Monthly Cost | Owner-occupied | Renter-occupied |
| Less than $300 | 118 (0.9%) | 151 (0.7%) |
| $300 to $499 | 293 (2.1%) | 250 (1.2%) |
| $500 to $799 | 983 (7.2%) | 340 (1.6%) |
| $800 to $999 | 480 (3.5%) | 195 (0.9%) |
| $1,000 to $1,499 | 1,648 (12.1%) | 1,001 (4.8%) |
| $1,500 to $1,999 | 1,241 (9.1%) | 1,862 (8.9%) |
| $2,000 to $2,499 | 683 (5.0%) | 3,835 (18.4%) |
| $2,500 to $2,999 | 770 (5.6%) | 3,747 (18.0%) |
| $3,000 or more | 7,444 (54.5%) | 9,208 (44.2%) |
| Total | 13,660 (100.0%) | 20,856 (100.0%) |
Physical Housing Characteristics in Mountain View
Housing Structures in Mountain View
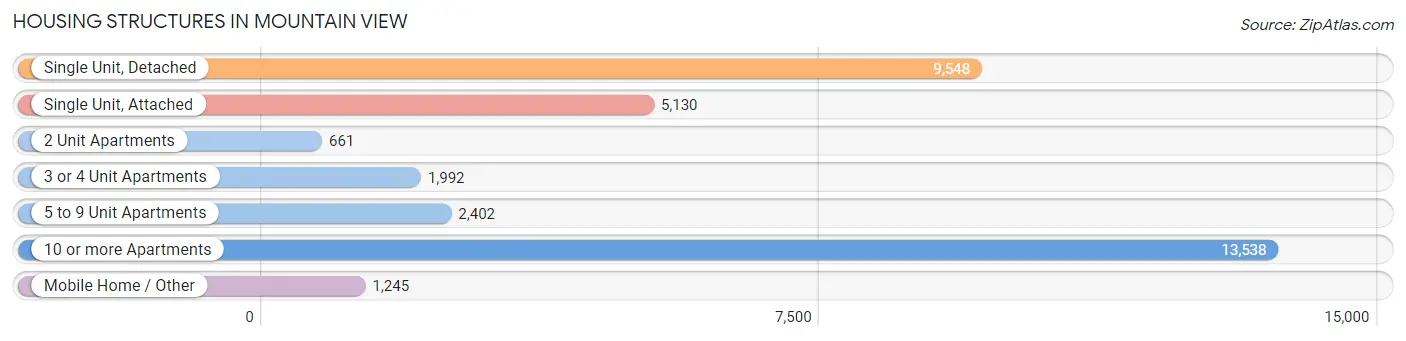
| Structure Type | # Housing Units | % Housing Units |
| Single Unit, Detached | 9,548 | 27.7% |
| Single Unit, Attached | 5,130 | 14.9% |
| 2 Unit Apartments | 661 | 1.9% |
| 3 or 4 Unit Apartments | 1,992 | 5.8% |
| 5 to 9 Unit Apartments | 2,402 | 7.0% |
| 10 or more Apartments | 13,538 | 39.2% |
| Mobile Home / Other | 1,245 | 3.6% |
| Total | 34,516 | 100.0% |
Housing Structures by Occupancy in Mountain View
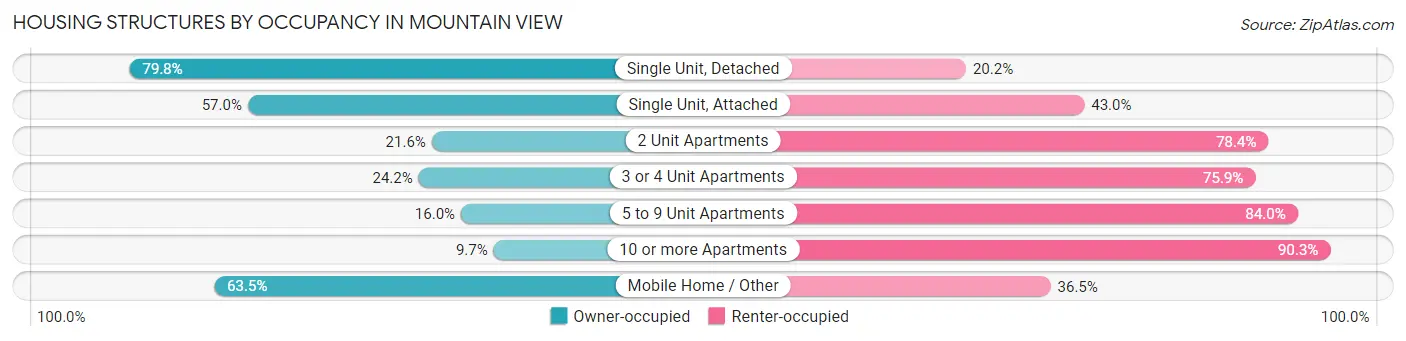
| Structure Type | Owner-occupied | Renter-occupied |
| Single Unit, Detached | 7,621 (79.8%) | 1,927 (20.2%) |
| Single Unit, Attached | 2,926 (57.0%) | 2,204 (43.0%) |
| 2 Unit Apartments | 143 (21.6%) | 518 (78.4%) |
| 3 or 4 Unit Apartments | 481 (24.1%) | 1,511 (75.8%) |
| 5 to 9 Unit Apartments | 384 (16.0%) | 2,018 (84.0%) |
| 10 or more Apartments | 1,314 (9.7%) | 12,224 (90.3%) |
| Mobile Home / Other | 791 (63.5%) | 454 (36.5%) |
| Total | 13,660 (39.6%) | 20,856 (60.4%) |
Housing Structures by Number of Rooms in Mountain View
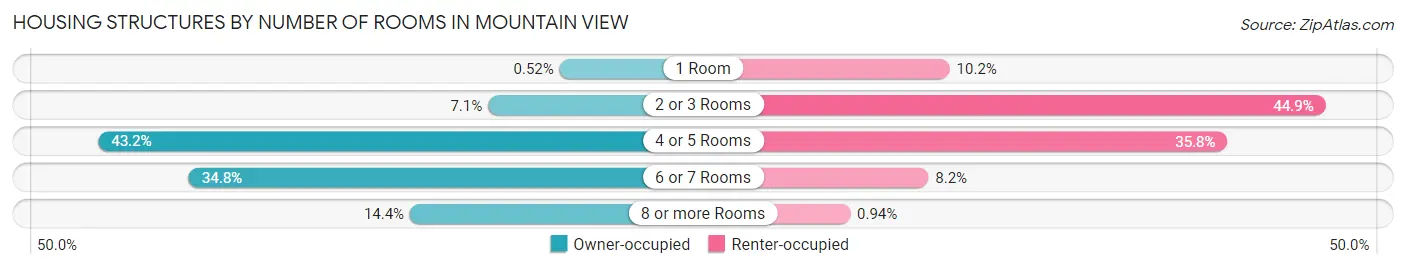
| Number of Rooms | Owner-occupied | Renter-occupied |
| 1 Room | 71 (0.5%) | 2,116 (10.2%) |
| 2 or 3 Rooms | 976 (7.1%) | 9,367 (44.9%) |
| 4 or 5 Rooms | 5,898 (43.2%) | 7,472 (35.8%) |
| 6 or 7 Rooms | 4,753 (34.8%) | 1,705 (8.2%) |
| 8 or more Rooms | 1,962 (14.4%) | 196 (0.9%) |
| Total | 13,660 (100.0%) | 20,856 (100.0%) |
Housing Structure by Heating Type in Mountain View
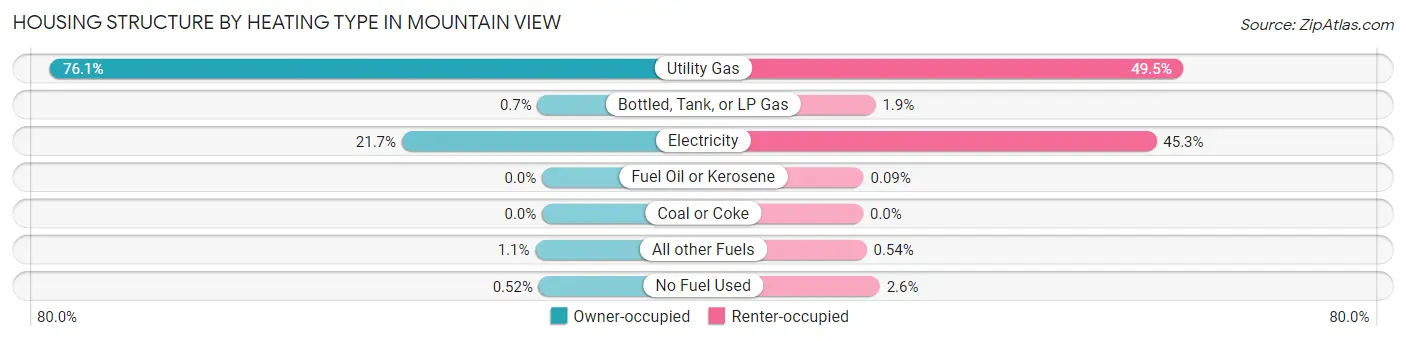
| Heating Type | Owner-occupied | Renter-occupied |
| Utility Gas | 10,388 (76.0%) | 10,330 (49.5%) |
| Bottled, Tank, or LP Gas | 95 (0.7%) | 400 (1.9%) |
| Electricity | 2,962 (21.7%) | 9,457 (45.3%) |
| Fuel Oil or Kerosene | 0 (0.0%) | 18 (0.1%) |
| Coal or Coke | 0 (0.0%) | 0 (0.0%) |
| All other Fuels | 144 (1.1%) | 112 (0.5%) |
| No Fuel Used | 71 (0.5%) | 539 (2.6%) |
| Total | 13,660 (100.0%) | 20,856 (100.0%) |
Household Vehicle Usage in Mountain View
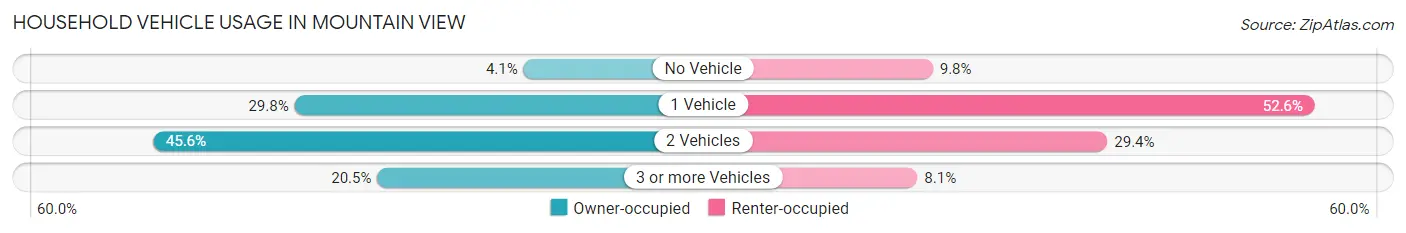
| Vehicles per Household | Owner-occupied | Renter-occupied |
| No Vehicle | 562 (4.1%) | 2,052 (9.8%) |
| 1 Vehicle | 4,066 (29.8%) | 10,979 (52.6%) |
| 2 Vehicles | 6,233 (45.6%) | 6,132 (29.4%) |
| 3 or more Vehicles | 2,799 (20.5%) | 1,693 (8.1%) |
| Total | 13,660 (100.0%) | 20,856 (100.0%) |
Real Estate & Mortgages in Mountain View
Real Estate and Mortgage Overview in Mountain View
| Characteristic | Without Mortgage | With Mortgage |
| Housing Units | 4,289 | 9,371 |
| Median Property Value | $1,633,400 | $1,905,000 |
| Median Household Income | $124,306 | $6,986 |
| Monthly Housing Costs | $1,137 | $7,330 |
| Real Estate Taxes | $5,704 | $94 |
Property Value by Mortgage Status in Mountain View
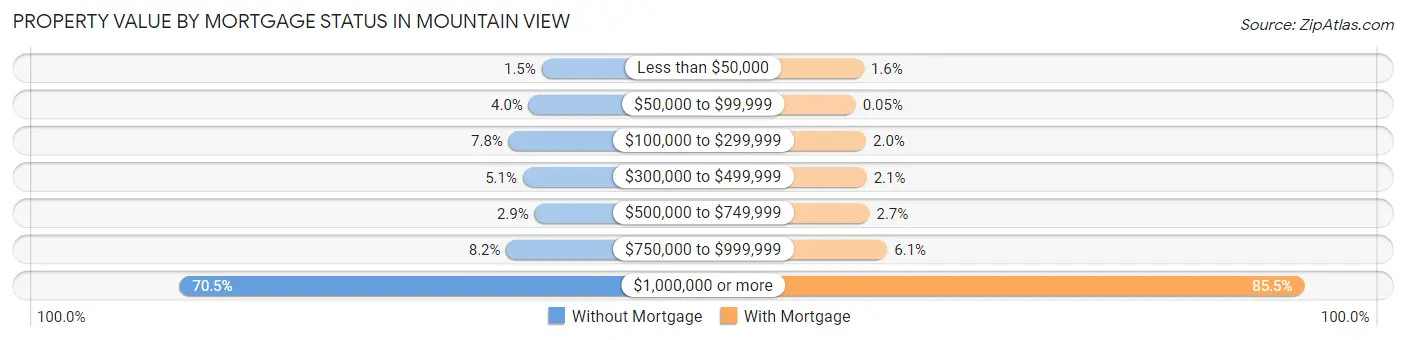
| Property Value | Without Mortgage | With Mortgage |
| Less than $50,000 | 65 (1.5%) | 151 (1.6%) |
| $50,000 to $99,999 | 171 (4.0%) | 5 (0.1%) |
| $100,000 to $299,999 | 334 (7.8%) | 188 (2.0%) |
| $300,000 to $499,999 | 219 (5.1%) | 200 (2.1%) |
| $500,000 to $749,999 | 123 (2.9%) | 249 (2.7%) |
| $750,000 to $999,999 | 353 (8.2%) | 568 (6.1%) |
| $1,000,000 or more | 3,024 (70.5%) | 8,010 (85.5%) |
| Total | 4,289 (100.0%) | 9,371 (100.0%) |
Household Income by Mortgage Status in Mountain View
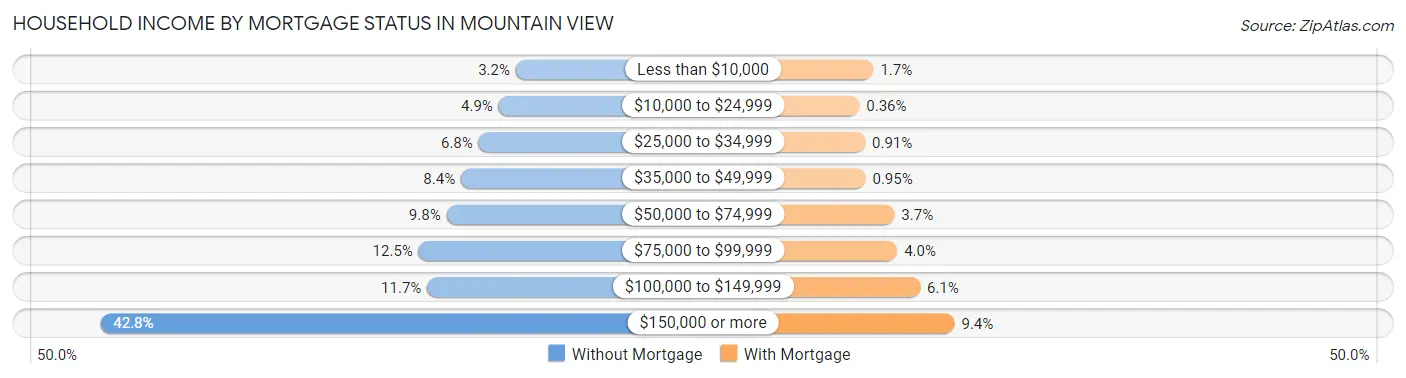
| Household Income | Without Mortgage | With Mortgage |
| Less than $10,000 | 138 (3.2%) | 160 (1.7%) |
| $10,000 to $24,999 | 208 (4.9%) | 34 (0.4%) |
| $25,000 to $34,999 | 290 (6.8%) | 85 (0.9%) |
| $35,000 to $49,999 | 362 (8.4%) | 89 (0.9%) |
| $50,000 to $74,999 | 421 (9.8%) | 347 (3.7%) |
| $75,000 to $99,999 | 535 (12.5%) | 372 (4.0%) |
| $100,000 to $149,999 | 500 (11.7%) | 575 (6.1%) |
| $150,000 or more | 1,835 (42.8%) | 883 (9.4%) |
| Total | 4,289 (100.0%) | 9,371 (100.0%) |
Property Value to Household Income Ratio in Mountain View
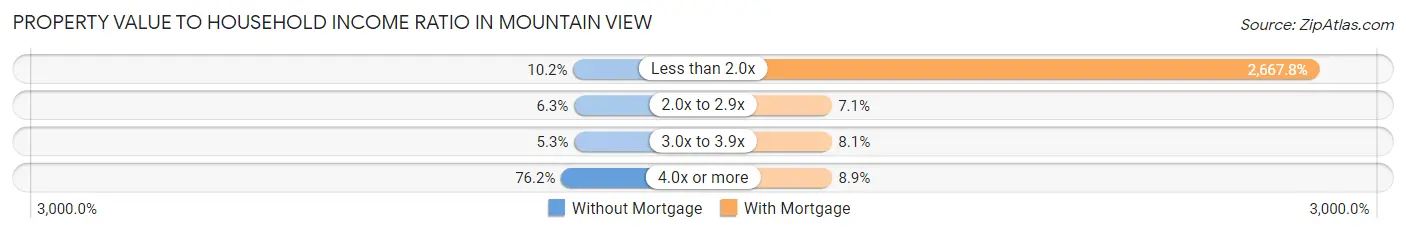
| Value-to-Income Ratio | Without Mortgage | With Mortgage |
| Less than 2.0x | 438 (10.2%) | 250,001 (2,667.8%) |
| 2.0x to 2.9x | 269 (6.3%) | 668 (7.1%) |
| 3.0x to 3.9x | 228 (5.3%) | 761 (8.1%) |
| 4.0x or more | 3,266 (76.1%) | 831 (8.9%) |
| Total | 4,289 (100.0%) | 9,371 (100.0%) |
Real Estate Taxes by Mortgage Status in Mountain View
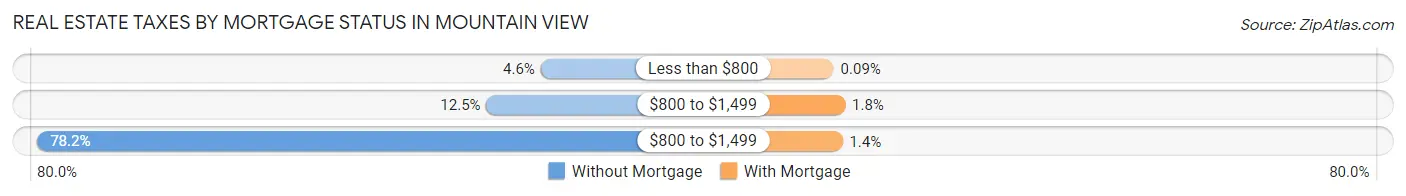
| Property Taxes | Without Mortgage | With Mortgage |
| Less than $800 | 197 (4.6%) | 8 (0.1%) |
| $800 to $1,499 | 537 (12.5%) | 165 (1.8%) |
| $800 to $1,499 | 3,352 (78.1%) | 128 (1.4%) |
| Total | 4,289 (100.0%) | 9,371 (100.0%) |
Health & Disability in Mountain View
Health Insurance Coverage by Age in Mountain View
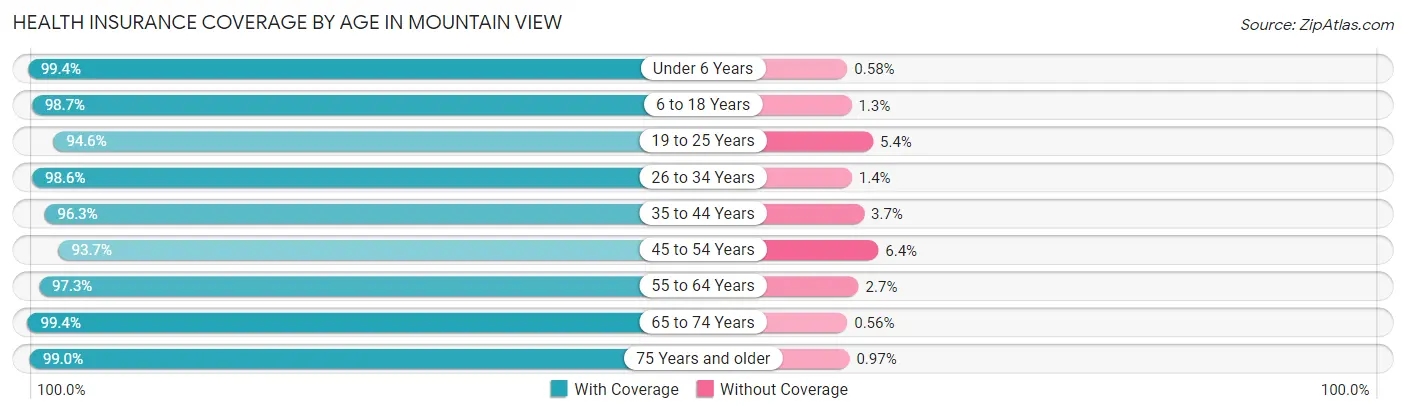
| Age Bracket | With Coverage | Without Coverage |
| Under 6 Years | 5,838 (99.4%) | 34 (0.6%) |
| 6 to 18 Years | 11,597 (98.7%) | 156 (1.3%) |
| 19 to 25 Years | 6,058 (94.6%) | 344 (5.4%) |
| 26 to 34 Years | 15,840 (98.6%) | 226 (1.4%) |
| 35 to 44 Years | 13,790 (96.3%) | 528 (3.7%) |
| 45 to 54 Years | 9,364 (93.6%) | 635 (6.4%) |
| 55 to 64 Years | 7,983 (97.3%) | 220 (2.7%) |
| 65 to 74 Years | 5,292 (99.4%) | 30 (0.6%) |
| 75 Years and older | 3,880 (99.0%) | 38 (1.0%) |
| Total | 79,642 (97.3%) | 2,211 (2.7%) |
Health Insurance Coverage by Citizenship Status in Mountain View
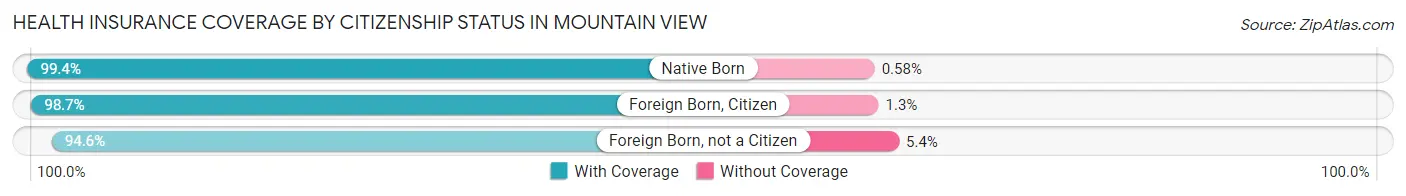
| Citizenship Status | With Coverage | Without Coverage |
| Native Born | 5,838 (99.4%) | 34 (0.6%) |
| Foreign Born, Citizen | 11,597 (98.7%) | 156 (1.3%) |
| Foreign Born, not a Citizen | 6,058 (94.6%) | 344 (5.4%) |
Health Insurance Coverage by Household Income in Mountain View
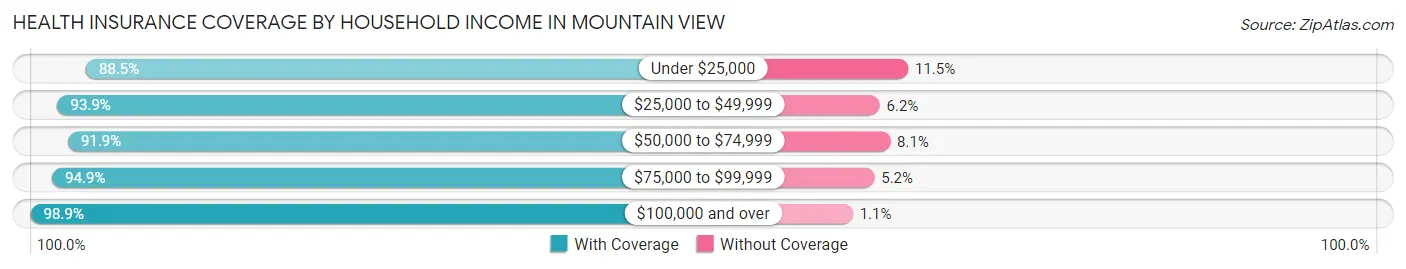
| Household Income | With Coverage | Without Coverage |
| Under $25,000 | 2,768 (88.5%) | 359 (11.5%) |
| $25,000 to $49,999 | 6,343 (93.9%) | 416 (6.1%) |
| $50,000 to $74,999 | 5,414 (91.9%) | 478 (8.1%) |
| $75,000 to $99,999 | 5,138 (94.9%) | 279 (5.1%) |
| $100,000 and over | 59,806 (98.9%) | 670 (1.1%) |
Public vs Private Health Insurance Coverage by Age in Mountain View
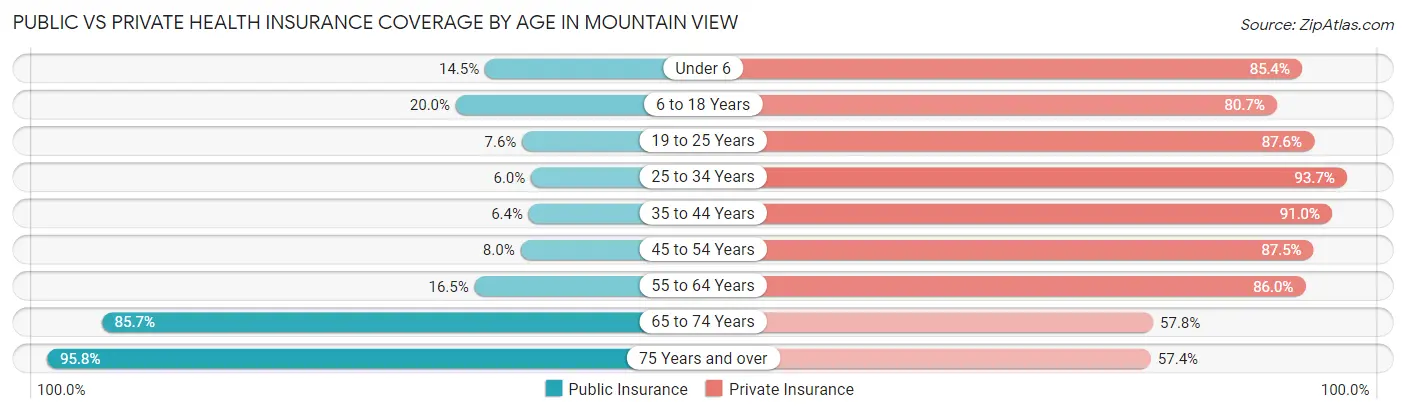
| Age Bracket | Public Insurance | Private Insurance |
| Under 6 | 854 (14.5%) | 5,013 (85.4%) |
| 6 to 18 Years | 2,345 (20.0%) | 9,486 (80.7%) |
| 19 to 25 Years | 489 (7.6%) | 5,608 (87.6%) |
| 25 to 34 Years | 961 (6.0%) | 15,054 (93.7%) |
| 35 to 44 Years | 918 (6.4%) | 13,024 (91.0%) |
| 45 to 54 Years | 796 (8.0%) | 8,753 (87.5%) |
| 55 to 64 Years | 1,353 (16.5%) | 7,055 (86.0%) |
| 65 to 74 Years | 4,561 (85.7%) | 3,075 (57.8%) |
| 75 Years and over | 3,755 (95.8%) | 2,248 (57.4%) |
| Total | 16,032 (19.6%) | 69,316 (84.7%) |
Disability Status by Sex by Age in Mountain View
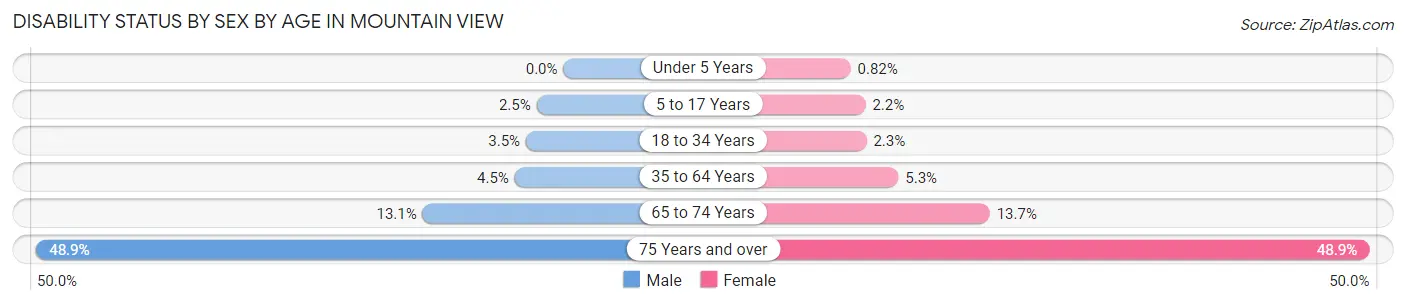
| Age Bracket | Male | Female |
| Under 5 Years | 0 (0.0%) | 22 (0.8%) |
| 5 to 17 Years | 152 (2.5%) | 123 (2.2%) |
| 18 to 34 Years | 457 (3.5%) | 232 (2.3%) |
| 35 to 64 Years | 765 (4.5%) | 818 (5.2%) |
| 65 to 74 Years | 331 (13.1%) | 383 (13.7%) |
| 75 Years and over | 737 (48.9%) | 1,180 (48.9%) |
Disability Class by Sex by Age in Mountain View
Disability Class: Hearing Difficulty
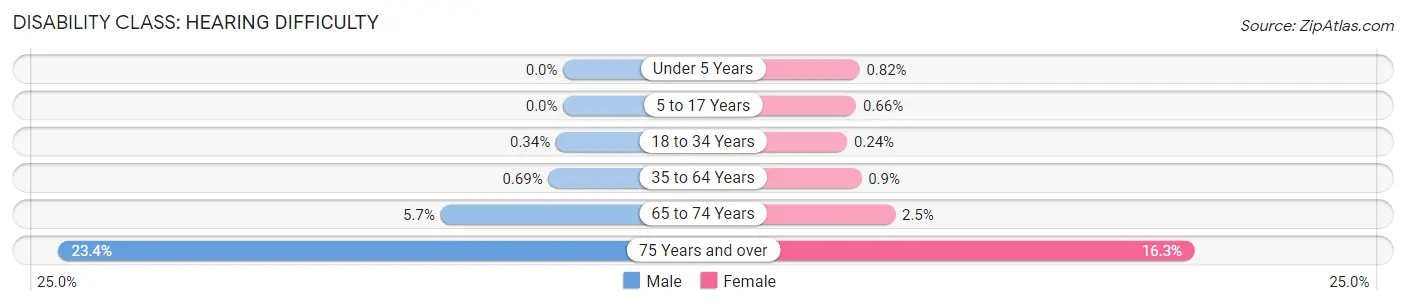
| Age Bracket | Male | Female |
| Under 5 Years | 0 (0.0%) | 22 (0.8%) |
| 5 to 17 Years | 0 (0.0%) | 37 (0.7%) |
| 18 to 34 Years | 45 (0.3%) | 24 (0.2%) |
| 35 to 64 Years | 117 (0.7%) | 141 (0.9%) |
| 65 to 74 Years | 144 (5.7%) | 69 (2.5%) |
| 75 Years and over | 353 (23.4%) | 394 (16.3%) |
Disability Class: Vision Difficulty
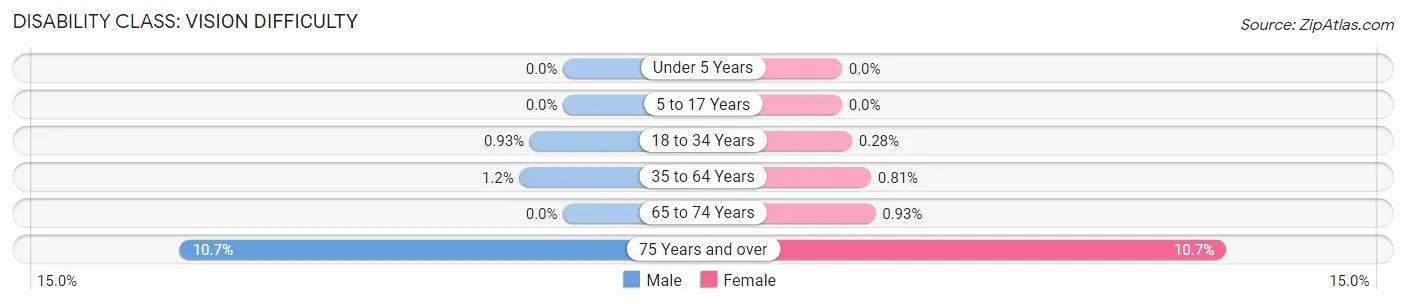
| Age Bracket | Male | Female |
| Under 5 Years | 0 (0.0%) | 0 (0.0%) |
| 5 to 17 Years | 0 (0.0%) | 0 (0.0%) |
| 18 to 34 Years | 122 (0.9%) | 28 (0.3%) |
| 35 to 64 Years | 206 (1.2%) | 126 (0.8%) |
| 65 to 74 Years | 0 (0.0%) | 26 (0.9%) |
| 75 Years and over | 161 (10.7%) | 258 (10.7%) |
Disability Class: Cognitive Difficulty
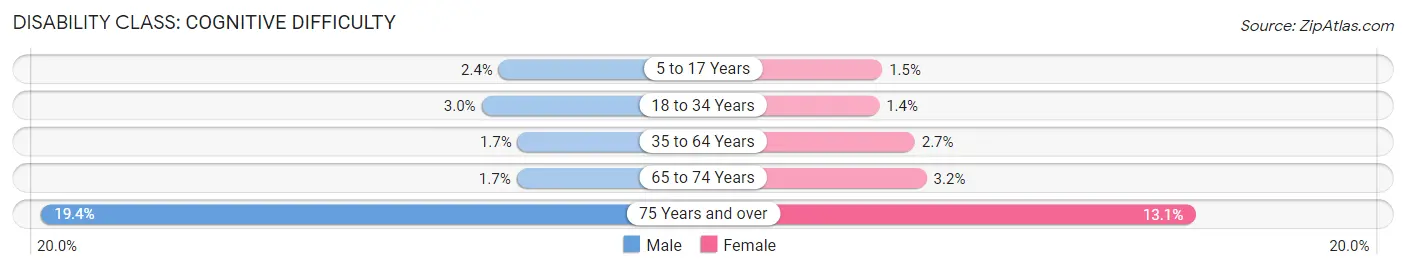
| Age Bracket | Male | Female |
| 5 to 17 Years | 147 (2.4%) | 84 (1.5%) |
| 18 to 34 Years | 400 (3.0%) | 141 (1.4%) |
| 35 to 64 Years | 287 (1.7%) | 422 (2.7%) |
| 65 to 74 Years | 44 (1.7%) | 88 (3.2%) |
| 75 Years and over | 292 (19.4%) | 316 (13.1%) |
Disability Class: Ambulatory Difficulty
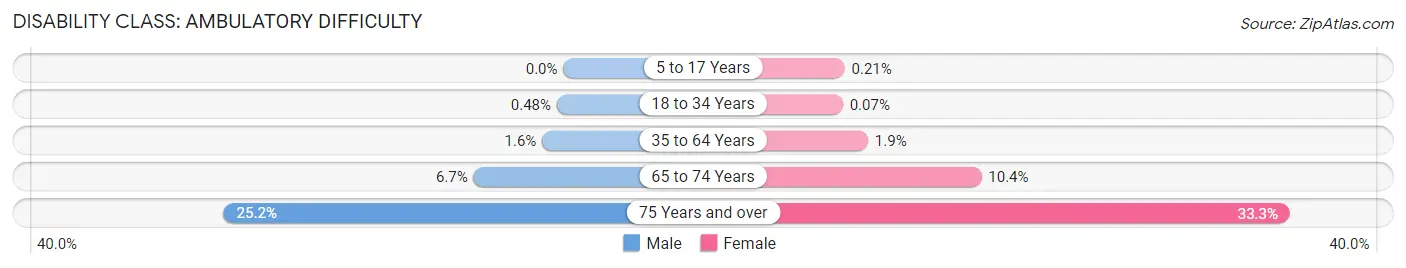
| Age Bracket | Male | Female |
| 5 to 17 Years | 0 (0.0%) | 12 (0.2%) |
| 18 to 34 Years | 63 (0.5%) | 7 (0.1%) |
| 35 to 64 Years | 265 (1.6%) | 303 (1.9%) |
| 65 to 74 Years | 169 (6.7%) | 289 (10.4%) |
| 75 Years and over | 380 (25.2%) | 802 (33.3%) |
Disability Class: Self-Care Difficulty
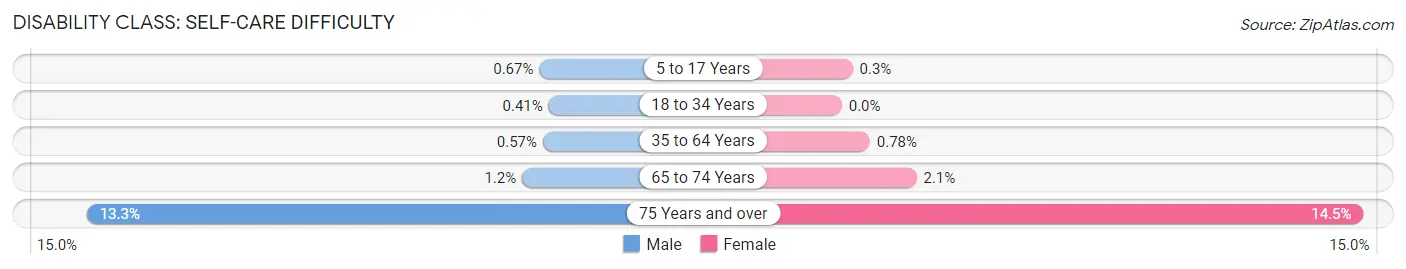
| Age Bracket | Male | Female |
| 5 to 17 Years | 41 (0.7%) | 17 (0.3%) |
| 18 to 34 Years | 54 (0.4%) | 0 (0.0%) |
| 35 to 64 Years | 96 (0.6%) | 121 (0.8%) |
| 65 to 74 Years | 29 (1.1%) | 58 (2.1%) |
| 75 Years and over | 200 (13.3%) | 350 (14.5%) |
Technology Access in Mountain View
Computing Device Access in Mountain View
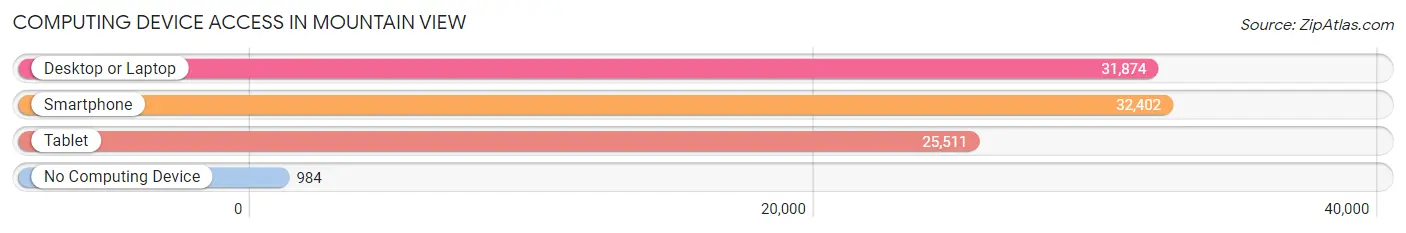
| Device Type | # Households | % Households |
| Desktop or Laptop | 31,874 | 92.3% |
| Smartphone | 32,402 | 93.9% |
| Tablet | 25,511 | 73.9% |
| No Computing Device | 984 | 2.9% |
| Total | 34,516 | 100.0% |
Internet Access in Mountain View
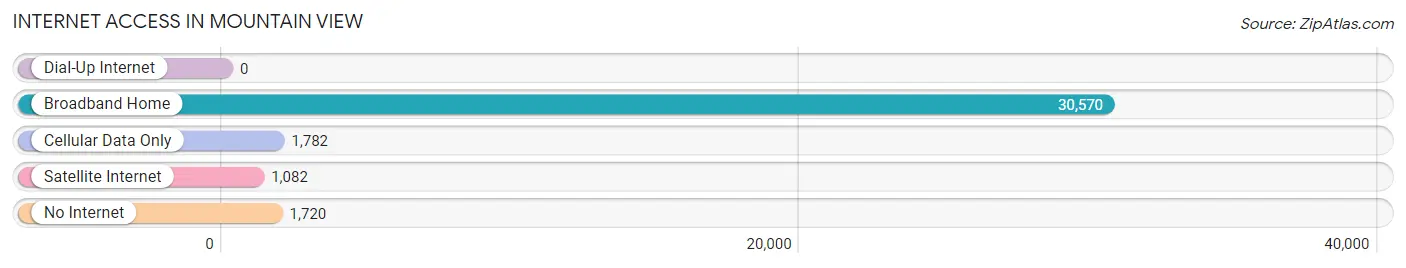
| Internet Type | # Households | % Households |
| Dial-Up Internet | 0 | 0.0% |
| Broadband Home | 30,570 | 88.6% |
| Cellular Data Only | 1,782 | 5.2% |
| Satellite Internet | 1,082 | 3.1% |
| No Internet | 1,720 | 5.0% |
| Total | 34,516 | 100.0% |
Mountain View Summary
Mountain View, California is a city located in Santa Clara County, in the San Francisco Bay Area. It is situated in the southern portion of the San Francisco Peninsula, and is bordered by the cities of Palo Alto, Los Altos, and Sunnyvale. The city has a population of approximately 80,000 people, and is home to many technology companies, including Google, Symantec, and Intuit.
History
Mountain View was originally inhabited by the Ohlone people, who lived in the area for thousands of years before the arrival of Europeans. The first Europeans to settle in the area were the Spanish, who established the Mission Santa Clara de Asís in 1777. The mission was the eighth of twenty-one missions established in California by the Spanish.
In 1852, the first American settlers arrived in the area, led by William E. Howard. Howard purchased land from the Mexican government, and established a stagecoach stop and a general store. The area was known as "Howard's Station" until 1868, when it was renamed "Mountain View". The name was chosen due to the view of the Santa Cruz Mountains from the area.
In the late 19th century, Mountain View became a popular destination for vacationers from San Francisco. The city was incorporated in 1902, and the first mayor was elected in 1903.
Geography
Mountain View is located in the southern portion of the San Francisco Peninsula, and is bordered by the cities of Palo Alto, Los Altos, and Sunnyvale. The city is situated at the base of the Santa Cruz Mountains, and is surrounded by several parks and open spaces, including Shoreline Park, Stevens Creek County Park, and the Palo Alto Baylands Nature Preserve.
The city has a total area of 12.2 square miles, of which 11.8 square miles is land and 0.4 square miles is water. The city is located at an elevation of 82 feet above sea level.
Economy
Mountain View is home to many technology companies, including Google, Symantec, and Intuit. The city is also home to several research and development centers, including the NASA Ames Research Center and the Googleplex.
The city's economy is also supported by a number of other industries, including retail, healthcare, and education. The city is home to several shopping centers, including the San Antonio Shopping Center and the Mountain View Center. The city is also home to several hospitals, including El Camino Hospital and the Palo Alto Medical Foundation.
Demographics
As of the 2010 census, Mountain View had a population of 74,066 people. The racial makeup of the city was 57.2% White, 2.2% African American, 0.4% Native American, 33.2% Asian, 0.2% Pacific Islander, 3.2% from other races, and 3.7% from two or more races. Hispanic or Latino of any race were 11.2% of the population.
The median household income in Mountain View was $103,611, and the median family income was $118,871. The per capita income for the city was $45,936. About 8.2% of the population was below the poverty line.
Common Questions
What is Per Capita Income in Mountain View?
Per Capita income in Mountain View is $102,077.
What is the Median Family Income in Mountain View?
Median Family Income in Mountain View is $213,279.
What is the Median Household income in Mountain View?
Median Household Income in Mountain View is $174,156.
What is Income or Wage Gap in Mountain View?
Income or Wage Gap in Mountain View is 37.8%.
Women in Mountain View earn 62.2 cents for every dollar earned by a man.
What is Inequality or Gini Index in Mountain View?
Inequality or Gini Index in Mountain View is 0.47.
What is the Total Population of Mountain View?
Total Population of Mountain View is 82,132.
What is the Total Male Population of Mountain View?
Total Male Population of Mountain View is 42,855.
What is the Total Female Population of Mountain View?
Total Female Population of Mountain View is 39,277.
What is the Ratio of Males per 100 Females in Mountain View?
There are 109.11 Males per 100 Females in Mountain View.
What is the Ratio of Females per 100 Males in Mountain View?
There are 91.65 Females per 100 Males in Mountain View.
What is the Median Population Age in Mountain View?
Median Population Age in Mountain View is 35.5 Years.
What is the Average Family Size in Mountain View
Average Family Size in Mountain View is 3.1 People.
What is the Average Household Size in Mountain View
Average Household Size in Mountain View is 2.4 People.
How Large is the Labor Force in Mountain View?
There are 48,860 People in the Labor Forcein in Mountain View.
What is the Percentage of People in the Labor Force in Mountain View?
73.0% of People are in the Labor Force in Mountain View.
What is the Unemployment Rate in Mountain View?
Unemployment Rate in Mountain View is 3.4%.