Clearlake Riviera, CA Map & Demographics
Clearlake Riviera Map
Clearlake Riviera Overview
$47,790
PER CAPITA INCOME
$102,237
AVG FAMILY INCOME
$93,750
AVG HOUSEHOLD INCOME
41.8%
WAGE / INCOME GAP [ % ]
58.2¢/ $1
WAGE / INCOME GAP [ $ ]
0.46
INEQUALITY / GINI INDEX
4,461
TOTAL POPULATION
2,181
MALE POPULATION
2,280
FEMALE POPULATION
95.66
MALES / 100 FEMALES
104.54
FEMALES / 100 MALES
37.9
MEDIAN AGE
3.6
AVG FAMILY SIZE
3.0
AVG HOUSEHOLD SIZE
2,294
LABOR FORCE [ PEOPLE ]
63.3%
PERCENT IN LABOR FORCE
11.5%
UNEMPLOYMENT RATE
Income in Clearlake Riviera
Income Overview in Clearlake Riviera
Per Capita Income in Clearlake Riviera is $47,790, while median incomes of families and households are $102,237 and $93,750 respectively.
| Characteristic | Number | Measure |
| Per Capita Income | 4,461 | $47,790 |
| Median Family Income | 1,038 | $102,237 |
| Mean Family Income | 1,038 | $165,362 |
| Median Household Income | 1,492 | $93,750 |
| Mean Household Income | 1,492 | $136,981 |
| Income Deficit | 1,038 | $0 |
| Wage / Income Gap (%) | 4,461 | 41.82% |
| Wage / Income Gap ($) | 4,461 | 58.18¢ per $1 |
| Gini / Inequality Index | 4,461 | 0.46 |
Earnings by Sex in Clearlake Riviera
Average Earnings in Clearlake Riviera are $43,367, $49,828 for men and $28,988 for women, a difference of 41.8%.
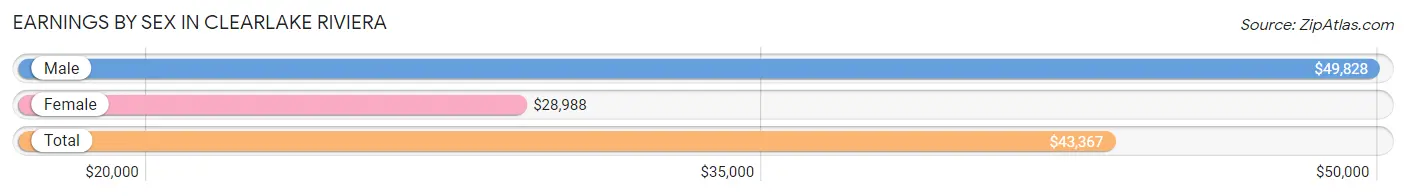
| Sex | Number | Average Earnings |
| Male | 1,074 (45.8%) | $49,828 |
| Female | 1,273 (54.2%) | $28,988 |
| Total | 2,347 (100.0%) | $43,367 |
Earnings by Sex by Income Bracket in Clearlake Riviera
The most common earnings brackets in Clearlake Riviera are $45,000 to $49,999 for men (192 | 17.9%) and $22,500 to $24,999 for women (399 | 31.3%).
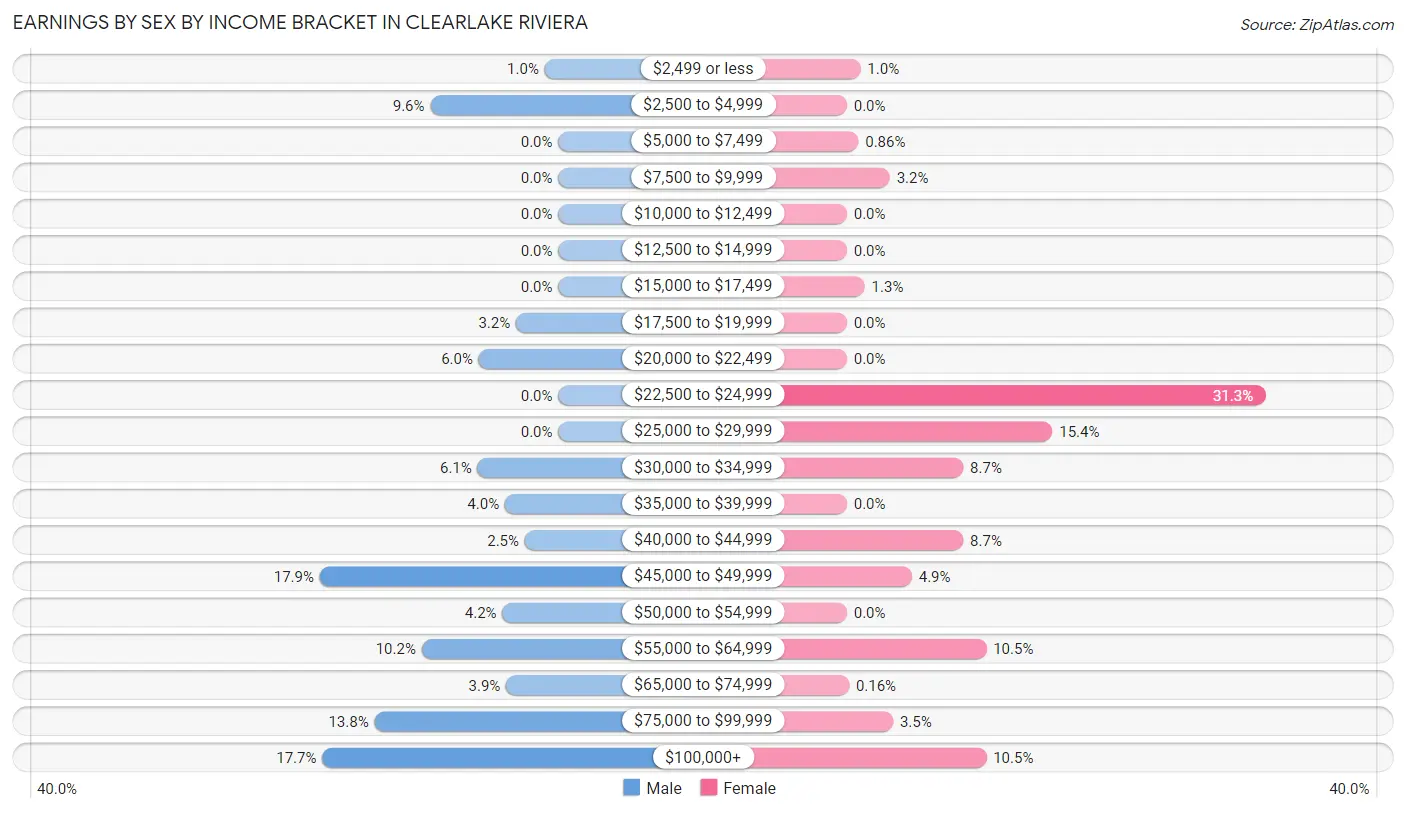
| Income | Male | Female |
| $2,499 or less | 11 (1.0%) | 13 (1.0%) |
| $2,500 to $4,999 | 103 (9.6%) | 0 (0.0%) |
| $5,000 to $7,499 | 0 (0.0%) | 11 (0.9%) |
| $7,500 to $9,999 | 0 (0.0%) | 41 (3.2%) |
| $10,000 to $12,499 | 0 (0.0%) | 0 (0.0%) |
| $12,500 to $14,999 | 0 (0.0%) | 0 (0.0%) |
| $15,000 to $17,499 | 0 (0.0%) | 17 (1.3%) |
| $17,500 to $19,999 | 34 (3.2%) | 0 (0.0%) |
| $20,000 to $22,499 | 64 (6.0%) | 0 (0.0%) |
| $22,500 to $24,999 | 0 (0.0%) | 399 (31.3%) |
| $25,000 to $29,999 | 0 (0.0%) | 196 (15.4%) |
| $30,000 to $34,999 | 65 (6.0%) | 111 (8.7%) |
| $35,000 to $39,999 | 43 (4.0%) | 0 (0.0%) |
| $40,000 to $44,999 | 27 (2.5%) | 111 (8.7%) |
| $45,000 to $49,999 | 192 (17.9%) | 62 (4.9%) |
| $50,000 to $54,999 | 45 (4.2%) | 0 (0.0%) |
| $55,000 to $64,999 | 110 (10.2%) | 133 (10.4%) |
| $65,000 to $74,999 | 42 (3.9%) | 2 (0.2%) |
| $75,000 to $99,999 | 148 (13.8%) | 44 (3.5%) |
| $100,000+ | 190 (17.7%) | 133 (10.4%) |
| Total | 1,074 (100.0%) | 1,273 (100.0%) |
Earnings by Sex by Educational Attainment in Clearlake Riviera
Average earnings in Clearlake Riviera are $55,294 for men and $42,759 for women, a difference of 22.7%. Men with an educational attainment of bachelor's degree enjoy the highest average annual earnings of $76,419, while those with college or associate's degree education earn the least with $46,664. Women with an educational attainment of graduate degree earn the most with the average annual earnings of $140,500, while those with high school diploma education have the smallest earnings of $24,183.
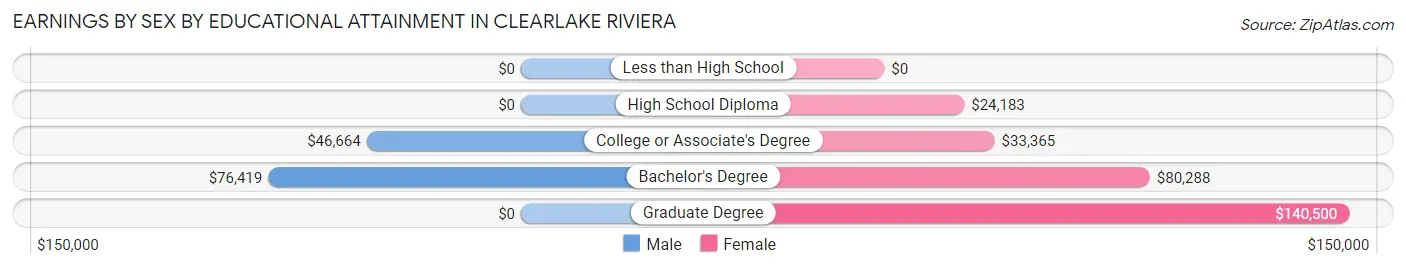
| Educational Attainment | Male Income | Female Income |
| Less than High School | - | - |
| High School Diploma | - | - |
| College or Associate's Degree | $46,664 | $33,365 |
| Bachelor's Degree | $76,419 | $80,288 |
| Graduate Degree | - | - |
| Total | $55,294 | $42,759 |
Family Income in Clearlake Riviera
Family Income Brackets in Clearlake Riviera
According to the Clearlake Riviera family income data, there are 439 families falling into the $100,000 to $149,999 income range, which is the most common income bracket and makes up 42.3% of all families.
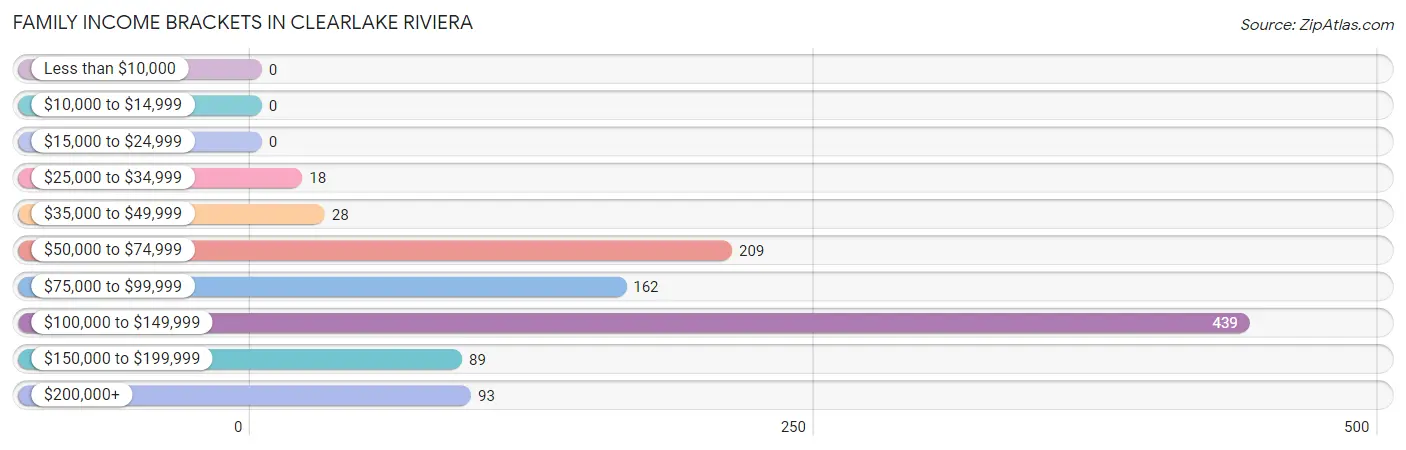
| Income Bracket | # Families | % Families |
| Less than $10,000 | 0 | 0.0% |
| $10,000 to $14,999 | 0 | 0.0% |
| $15,000 to $24,999 | 0 | 0.0% |
| $25,000 to $34,999 | 18 | 1.7% |
| $35,000 to $49,999 | 28 | 2.7% |
| $50,000 to $74,999 | 209 | 20.1% |
| $75,000 to $99,999 | 162 | 15.6% |
| $100,000 to $149,999 | 439 | 42.3% |
| $150,000 to $199,999 | 89 | 8.6% |
| $200,000+ | 93 | 9.0% |
Family Income by Famaliy Size in Clearlake Riviera
5-person families (162 | 15.6%) account for the highest median family income in Clearlake Riviera with $200,543 per family, while 2-person families (565 | 54.4%) have the highest median income of $50,828 per family member.
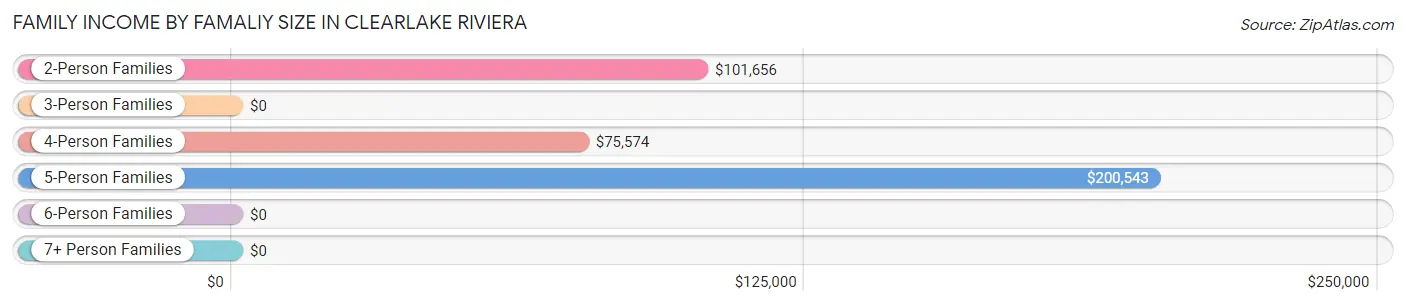
| Income Bracket | # Families | Median Income |
| 2-Person Families | 565 (54.4%) | $101,656 |
| 3-Person Families | 23 (2.2%) | $0 |
| 4-Person Families | 208 (20.0%) | $75,574 |
| 5-Person Families | 162 (15.6%) | $200,543 |
| 6-Person Families | 31 (3.0%) | $0 |
| 7+ Person Families | 49 (4.7%) | $0 |
| Total | 1,038 (100.0%) | $102,237 |
Family Income by Number of Earners in Clearlake Riviera
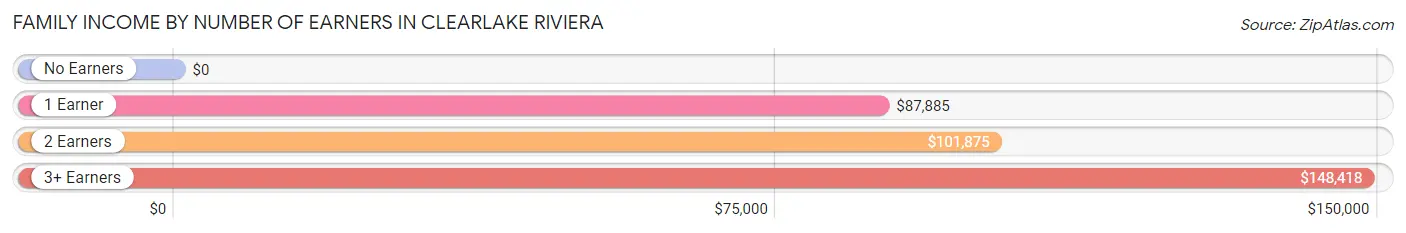
| Number of Earners | # Families | Median Income |
| No Earners | 140 (13.5%) | $0 |
| 1 Earner | 328 (31.6%) | $87,885 |
| 2 Earners | 382 (36.8%) | $101,875 |
| 3+ Earners | 188 (18.1%) | $148,418 |
| Total | 1,038 (100.0%) | $102,237 |
Household Income in Clearlake Riviera
Household Income Brackets in Clearlake Riviera
With 522 households falling in the category, the $100,000 to $149,999 income range is the most frequent in Clearlake Riviera, accounting for 35.0% of all households.
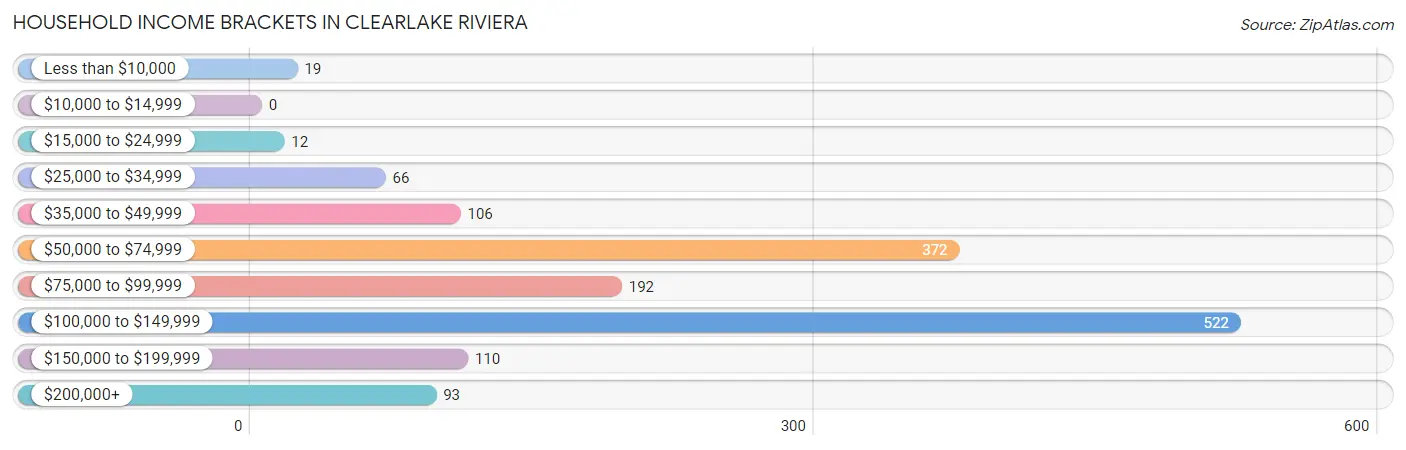
| Income Bracket | # Households | % Households |
| Less than $10,000 | 19 | 1.3% |
| $10,000 to $14,999 | 0 | 0.0% |
| $15,000 to $24,999 | 12 | 0.8% |
| $25,000 to $34,999 | 66 | 4.4% |
| $35,000 to $49,999 | 106 | 7.1% |
| $50,000 to $74,999 | 372 | 24.9% |
| $75,000 to $99,999 | 192 | 12.9% |
| $100,000 to $149,999 | 522 | 35.0% |
| $150,000 to $199,999 | 110 | 7.4% |
| $200,000+ | 93 | 6.2% |
Household Income by Householder Age in Clearlake Riviera
The median household income in Clearlake Riviera is $93,750, with the highest median household income of $139,139 found in the 45 to 64 years age bracket for the primary householder. A total of 529 households (35.5%) fall into this category. Meanwhile, the 15 to 24 years age bracket for the primary householder has the lowest median household income of $0, with 2 households (0.1%) in this group.
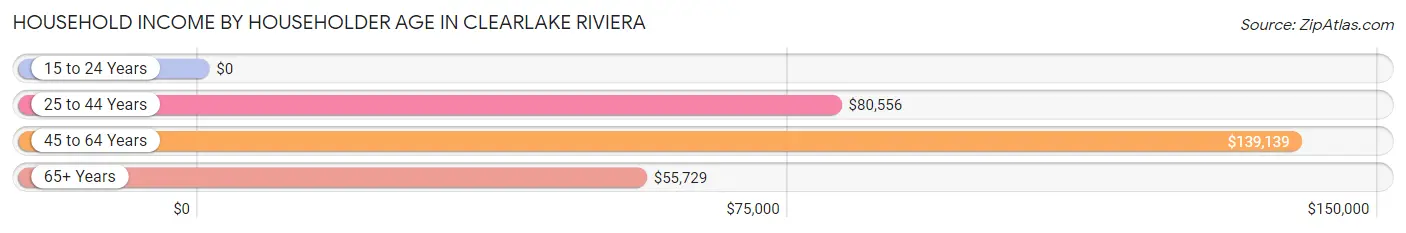
| Income Bracket | # Households | Median Income |
| 15 to 24 Years | 2 (0.1%) | $0 |
| 25 to 44 Years | 420 (28.1%) | $80,556 |
| 45 to 64 Years | 529 (35.5%) | $139,139 |
| 65+ Years | 541 (36.3%) | $55,729 |
| Total | 1,492 (100.0%) | $93,750 |
Poverty in Clearlake Riviera
Income Below Poverty by Sex and Age in Clearlake Riviera
With 2.9% poverty level for males and 3.4% for females among the residents of Clearlake Riviera, 35 to 44 year old males and 65 to 74 year old females are the most vulnerable to poverty, with 31 males (14.6%) and 49 females (20.8%) in their respective age groups living below the poverty level.
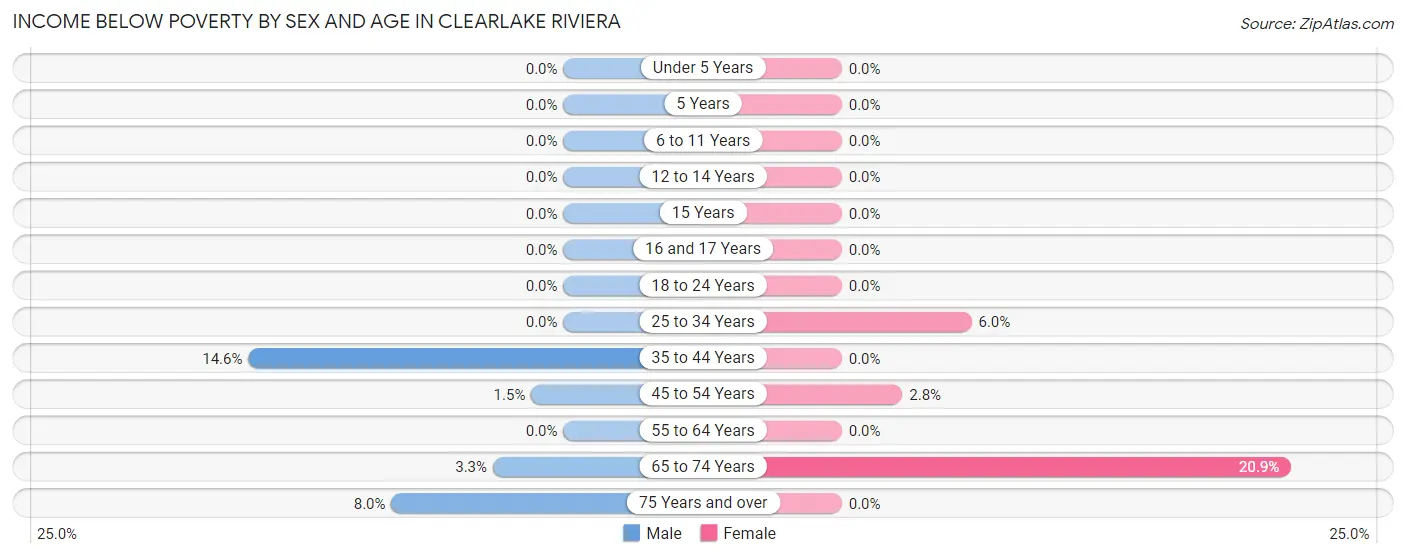
| Age Bracket | Male | Female |
| Under 5 Years | 0 (0.0%) | 0 (0.0%) |
| 5 Years | 0 (0.0%) | 0 (0.0%) |
| 6 to 11 Years | 0 (0.0%) | 0 (0.0%) |
| 12 to 14 Years | 0 (0.0%) | 0 (0.0%) |
| 15 Years | 0 (0.0%) | 0 (0.0%) |
| 16 and 17 Years | 0 (0.0%) | 0 (0.0%) |
| 18 to 24 Years | 0 (0.0%) | 0 (0.0%) |
| 25 to 34 Years | 0 (0.0%) | 16 (6.0%) |
| 35 to 44 Years | 31 (14.6%) | 0 (0.0%) |
| 45 to 54 Years | 4 (1.5%) | 11 (2.8%) |
| 55 to 64 Years | 0 (0.0%) | 0 (0.0%) |
| 65 to 74 Years | 8 (3.3%) | 49 (20.8%) |
| 75 Years and over | 19 (8.0%) | 0 (0.0%) |
| Total | 62 (2.9%) | 76 (3.4%) |
Income Above Poverty by Sex and Age in Clearlake Riviera
According to the poverty statistics in Clearlake Riviera, males aged under 5 years and females aged under 5 years are the age groups that are most secure financially, with 100.0% of males and 100.0% of females in these age groups living above the poverty line.
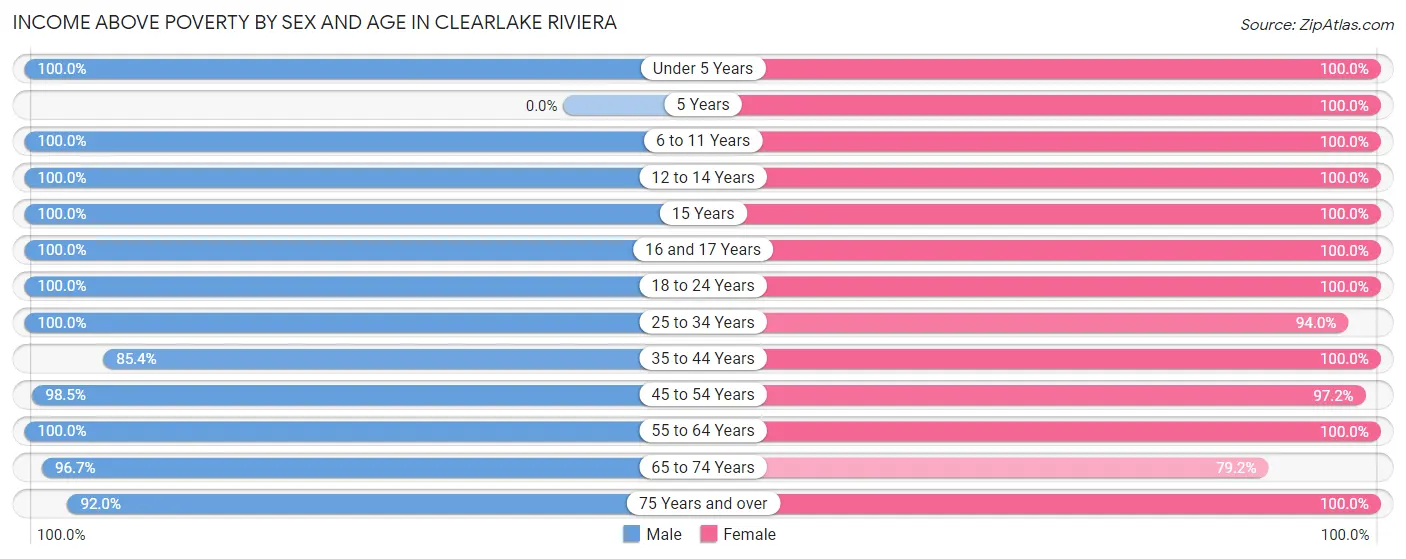
| Age Bracket | Male | Female |
| Under 5 Years | 135 (100.0%) | 32 (100.0%) |
| 5 Years | 0 (0.0%) | 33 (100.0%) |
| 6 to 11 Years | 37 (100.0%) | 192 (100.0%) |
| 12 to 14 Years | 210 (100.0%) | 43 (100.0%) |
| 15 Years | 61 (100.0%) | 48 (100.0%) |
| 16 and 17 Years | 84 (100.0%) | 49 (100.0%) |
| 18 to 24 Years | 106 (100.0%) | 330 (100.0%) |
| 25 to 34 Years | 276 (100.0%) | 250 (94.0%) |
| 35 to 44 Years | 181 (85.4%) | 249 (100.0%) |
| 45 to 54 Years | 264 (98.5%) | 381 (97.2%) |
| 55 to 64 Years | 288 (100.0%) | 306 (100.0%) |
| 65 to 74 Years | 237 (96.7%) | 186 (79.1%) |
| 75 Years and over | 219 (92.0%) | 80 (100.0%) |
| Total | 2,098 (97.1%) | 2,179 (96.6%) |
Income Below Poverty Among Married-Couple Families in Clearlake Riviera
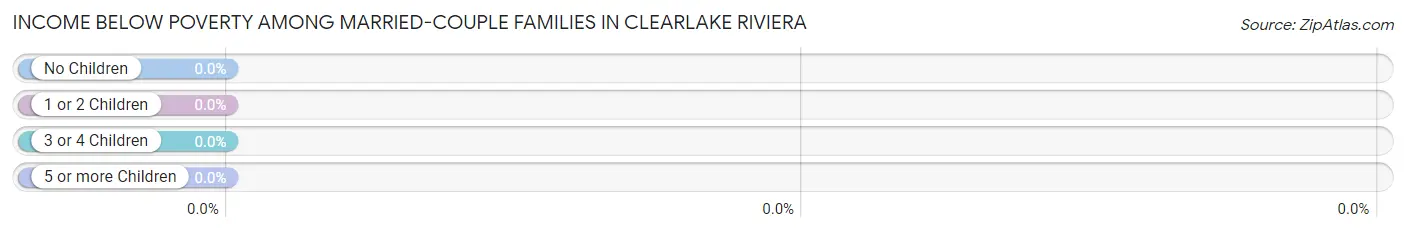
| Children | Above Poverty | Below Poverty |
| No Children | 518 (100.0%) | 0 (0.0%) |
| 1 or 2 Children | 214 (100.0%) | 0 (0.0%) |
| 3 or 4 Children | 80 (100.0%) | 0 (0.0%) |
| 5 or more Children | 0 (0.0%) | 0 (0.0%) |
| Total | 812 (100.0%) | 0 (0.0%) |
Income Below Poverty Among Single-Parent Households in Clearlake Riviera
| Children | Single Father | Single Mother |
| No Children | 0 (0.0%) | 0 (0.0%) |
| 1 or 2 Children | 0 (0.0%) | 0 (0.0%) |
| 3 or 4 Children | 0 (0.0%) | 0 (0.0%) |
| 5 or more Children | 0 (0.0%) | 0 (0.0%) |
| Total | 0 (0.0%) | 0 (0.0%) |
Income Below Poverty Among Married-Couple vs Single-Parent Households in Clearlake Riviera
| Children | Married-Couple Families | Single-Parent Households |
| No Children | 0 (0.0%) | 0 (0.0%) |
| 1 or 2 Children | 0 (0.0%) | 0 (0.0%) |
| 3 or 4 Children | 0 (0.0%) | 0 (0.0%) |
| 5 or more Children | 0 (0.0%) | 0 (0.0%) |
| Total | 0 (0.0%) | 0 (0.0%) |
Race in Clearlake Riviera
The most populous races in Clearlake Riviera are White / Caucasian (2,686 | 60.2%), Hispanic or Latino (1,488 | 33.4%), and Some other Race (865 | 19.4%).
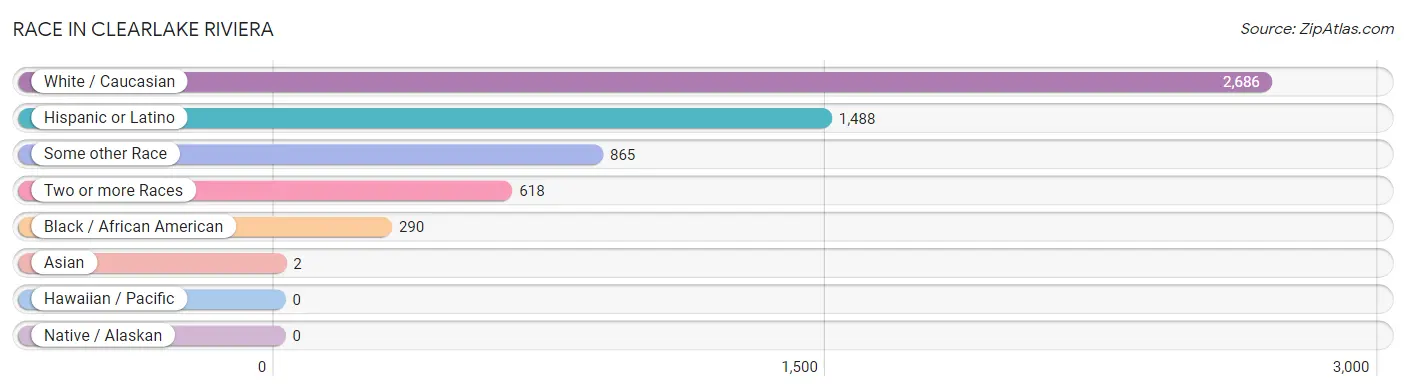
| Race | # Population | % Population |
| Asian | 2 | 0.0% |
| Black / African American | 290 | 6.5% |
| Hawaiian / Pacific | 0 | 0.0% |
| Hispanic or Latino | 1,488 | 33.4% |
| Native / Alaskan | 0 | 0.0% |
| White / Caucasian | 2,686 | 60.2% |
| Two or more Races | 618 | 13.9% |
| Some other Race | 865 | 19.4% |
| Total | 4,461 | 100.0% |
Ancestry in Clearlake Riviera
The most populous ancestries reported in Clearlake Riviera are Mexican (1,445 | 32.4%), German (939 | 21.0%), English (584 | 13.1%), Irish (556 | 12.5%), and Scottish (154 | 3.5%), together accounting for 82.4% of all Clearlake Riviera residents.
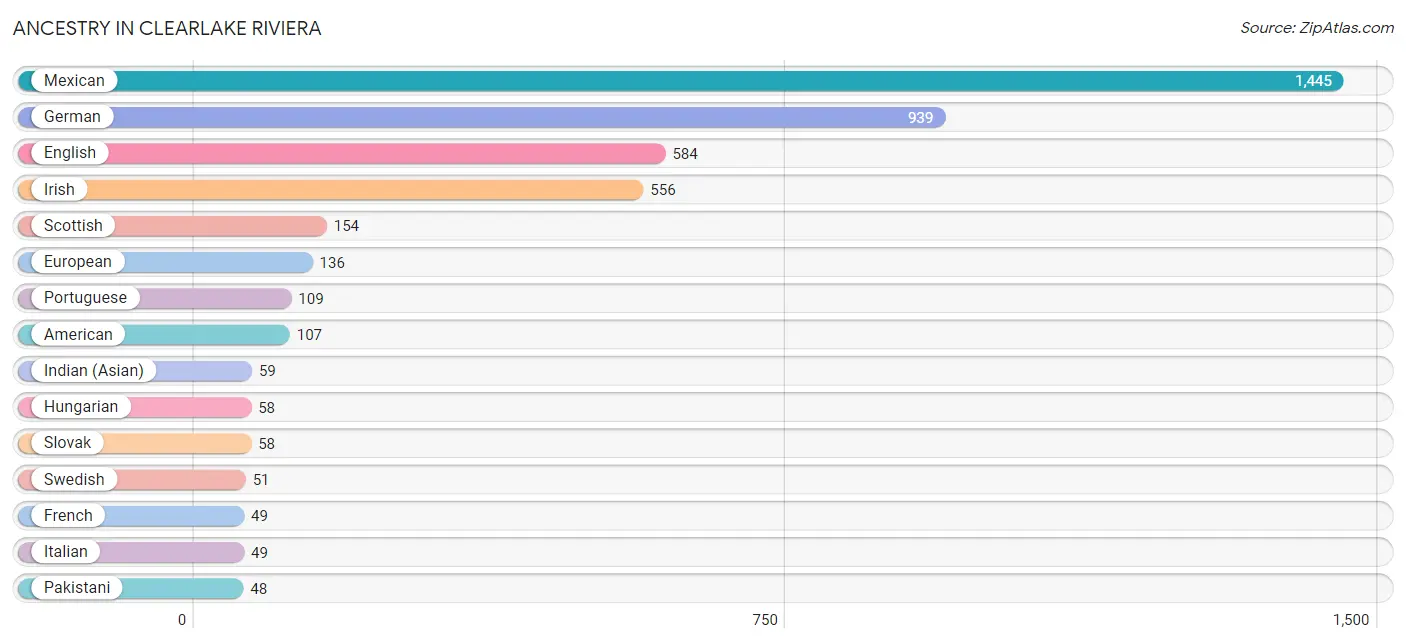
| Ancestry | # Population | % Population |
| American | 107 | 2.4% |
| Blackfeet | 11 | 0.3% |
| Central American | 19 | 0.4% |
| Central American Indian | 14 | 0.3% |
| Cherokee | 9 | 0.2% |
| Chilean | 1 | 0.0% |
| Danish | 44 | 1.0% |
| Dutch | 18 | 0.4% |
| English | 584 | 13.1% |
| European | 136 | 3.0% |
| French | 49 | 1.1% |
| French American Indian | 34 | 0.8% |
| French Canadian | 12 | 0.3% |
| German | 939 | 21.0% |
| Honduran | 19 | 0.4% |
| Hungarian | 58 | 1.3% |
| Indian (Asian) | 59 | 1.3% |
| Irish | 556 | 12.5% |
| Italian | 49 | 1.1% |
| Korean | 4 | 0.1% |
| Mexican | 1,445 | 32.4% |
| Norwegian | 45 | 1.0% |
| Pakistani | 48 | 1.1% |
| Pennsylvania German | 9 | 0.2% |
| Polish | 23 | 0.5% |
| Portuguese | 109 | 2.4% |
| Puerto Rican | 14 | 0.3% |
| Russian | 3 | 0.1% |
| Scandinavian | 4 | 0.1% |
| Scotch-Irish | 45 | 1.0% |
| Scottish | 154 | 3.5% |
| Slovak | 58 | 1.3% |
| South American | 1 | 0.0% |
| Spaniard | 2 | 0.0% |
| Spanish | 7 | 0.2% |
| Swedish | 51 | 1.1% |
| Swiss | 36 | 0.8% |
| Welsh | 7 | 0.2% | View All 38 Rows |
Immigrants in Clearlake Riviera
The most numerous immigrant groups reported in Clearlake Riviera came from Central America (282 | 6.3%), Latin America (282 | 6.3%), Mexico (282 | 6.3%), Europe (87 | 1.9%), and England (48 | 1.1%), together accounting for 22.0% of all Clearlake Riviera residents.
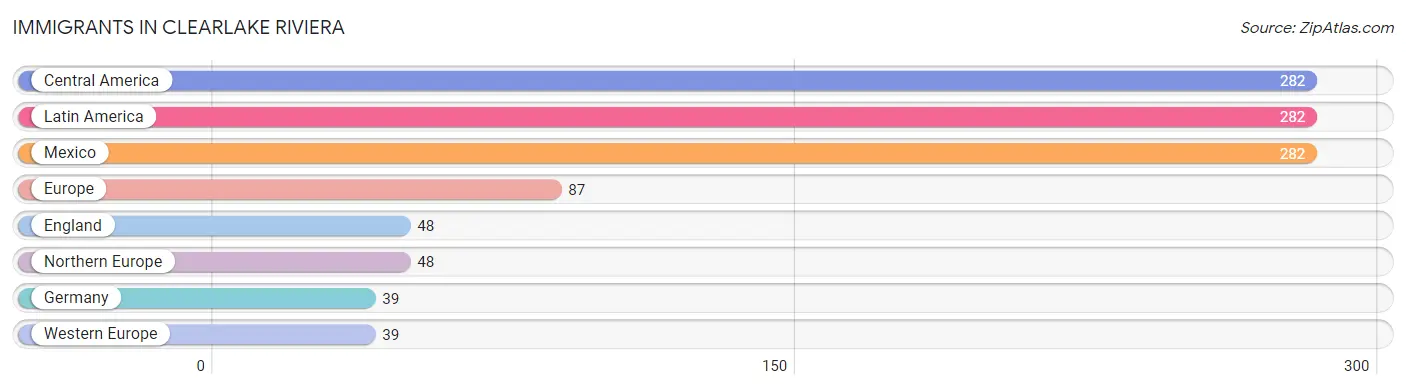
| Immigration Origin | # Population | % Population |
| Central America | 282 | 6.3% |
| England | 48 | 1.1% |
| Europe | 87 | 1.9% |
| Germany | 39 | 0.9% |
| Latin America | 282 | 6.3% |
| Mexico | 282 | 6.3% |
| Northern Europe | 48 | 1.1% |
| Western Europe | 39 | 0.9% | View All 8 Rows |
Sex and Age in Clearlake Riviera
Sex and Age in Clearlake Riviera
The most populous age groups in Clearlake Riviera are 10 to 14 Years (247 | 11.3%) for men and 20 to 24 Years (330 | 14.5%) for women.
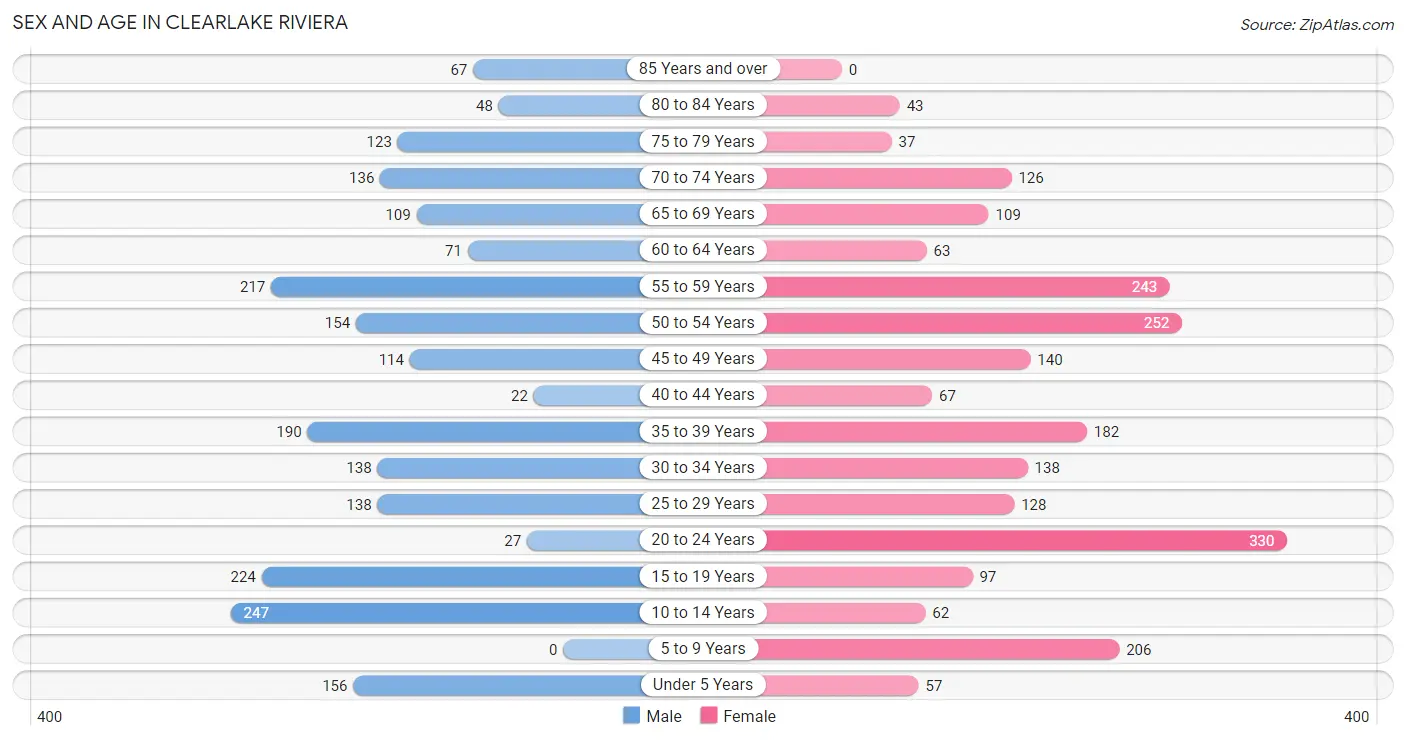
| Age Bracket | Male | Female |
| Under 5 Years | 156 (7.1%) | 57 (2.5%) |
| 5 to 9 Years | 0 (0.0%) | 206 (9.0%) |
| 10 to 14 Years | 247 (11.3%) | 62 (2.7%) |
| 15 to 19 Years | 224 (10.3%) | 97 (4.3%) |
| 20 to 24 Years | 27 (1.2%) | 330 (14.5%) |
| 25 to 29 Years | 138 (6.3%) | 128 (5.6%) |
| 30 to 34 Years | 138 (6.3%) | 138 (6.0%) |
| 35 to 39 Years | 190 (8.7%) | 182 (8.0%) |
| 40 to 44 Years | 22 (1.0%) | 67 (2.9%) |
| 45 to 49 Years | 114 (5.2%) | 140 (6.1%) |
| 50 to 54 Years | 154 (7.1%) | 252 (11.1%) |
| 55 to 59 Years | 217 (10.0%) | 243 (10.7%) |
| 60 to 64 Years | 71 (3.3%) | 63 (2.8%) |
| 65 to 69 Years | 109 (5.0%) | 109 (4.8%) |
| 70 to 74 Years | 136 (6.2%) | 126 (5.5%) |
| 75 to 79 Years | 123 (5.6%) | 37 (1.6%) |
| 80 to 84 Years | 48 (2.2%) | 43 (1.9%) |
| 85 Years and over | 67 (3.1%) | 0 (0.0%) |
| Total | 2,181 (100.0%) | 2,280 (100.0%) |
Families and Households in Clearlake Riviera
Median Family Size in Clearlake Riviera
The median family size in Clearlake Riviera is 3.65 persons per family, with married-couple families (812 | 78.2%) accounting for the largest median family size of 3.9 persons per family. On the other hand, single male/father families (99 | 9.5%) represent the smallest median family size with 2.11 persons per family.
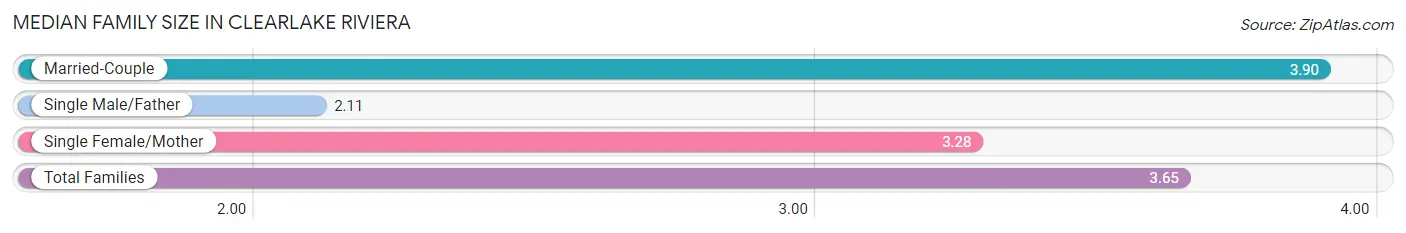
| Family Type | # Families | Family Size |
| Married-Couple | 812 (78.2%) | 3.90 |
| Single Male/Father | 99 (9.5%) | 2.11 |
| Single Female/Mother | 127 (12.2%) | 3.28 |
| Total Families | 1,038 (100.0%) | 3.65 |
Median Household Size in Clearlake Riviera
The median household size in Clearlake Riviera is 2.99 persons per household, with married-couple households (812 | 54.4%) accounting for the largest median household size of 3.95 persons per household. non-family households (454 | 30.4%) represent the smallest median household size with 1.27 persons per household.
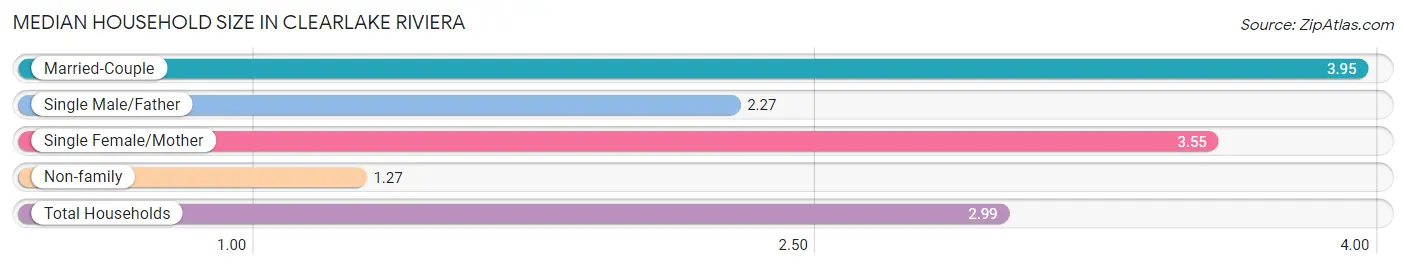
| Household Type | # Households | Household Size |
| Married-Couple | 812 (54.4%) | 3.95 |
| Single Male/Father | 99 (6.6%) | 2.27 |
| Single Female/Mother | 127 (8.5%) | 3.55 |
| Non-family | 454 (30.4%) | 1.27 |
| Total Households | 1,492 (100.0%) | 2.99 |
Household Size by Marriage Status in Clearlake Riviera
Out of a total of 1,492 households in Clearlake Riviera, 1,038 (69.6%) are family households, while 454 (30.4%) are nonfamily households. The most numerous type of family households are 2-person households, comprising 525, and the most common type of nonfamily households are 1-person households, comprising 333.
| Household Size | Family Households | Nonfamily Households |
| 1-Person Households | - | 333 (22.3%) |
| 2-Person Households | 525 (35.2%) | 121 (8.1%) |
| 3-Person Households | 63 (4.2%) | 0 (0.0%) |
| 4-Person Households | 188 (12.6%) | 0 (0.0%) |
| 5-Person Households | 162 (10.9%) | 0 (0.0%) |
| 6-Person Households | 51 (3.4%) | 0 (0.0%) |
| 7+ Person Households | 49 (3.3%) | 0 (0.0%) |
| Total | 1,038 (69.6%) | 454 (30.4%) |
Female Fertility in Clearlake Riviera
Fertility by Age in Clearlake Riviera
Average fertility rate in Clearlake Riviera is 71.0 births per 1,000 women. Women in the age bracket of 35 to 50 years have the highest fertility rate with 95.0 births per 1,000 women. Women in the age bracket of 20 to 34 years acount for 51.9% of all women with births.
| Age Bracket | Women with Births | Births / 1,000 Women |
| 15 to 19 years | 0 (0.0%) | 0.0 |
| 20 to 34 years | 40 (51.9%) | 67.0 |
| 35 to 50 years | 37 (48.0%) | 95.0 |
| Total | 77 (100.0%) | 71.0 |
Fertility by Age by Marriage Status in Clearlake Riviera
51.9% of women with births (77) in Clearlake Riviera are married. The highest percentage of unmarried women with births falls into 35 to 50 years age bracket with 100.0% of them unmarried at the time of birth, while the lowest percentage of unmarried women with births belong to 20 to 34 years age bracket with 0.0% of them unmarried.
| Age Bracket | Married | Unmarried |
| 15 to 19 years | 0 (0.0%) | 0 (0.0%) |
| 20 to 34 years | 40 (100.0%) | 0 (0.0%) |
| 35 to 50 years | 0 (0.0%) | 37 (100.0%) |
| Total | 40 (51.9%) | 37 (48.0%) |
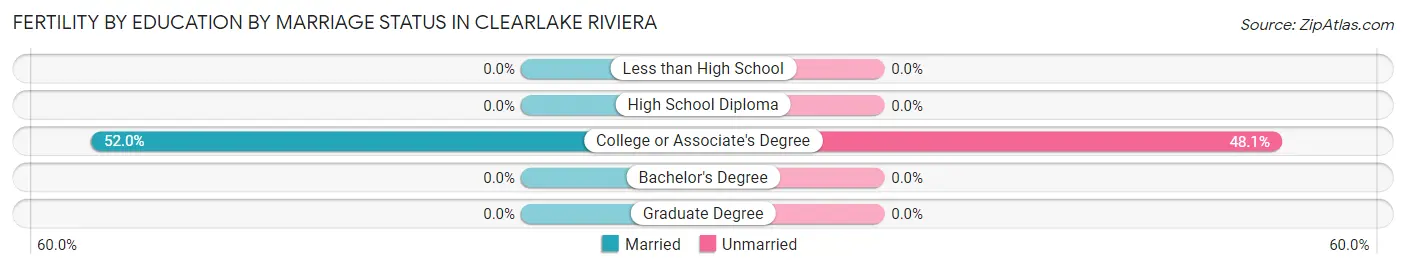
Fertility by Education in Clearlake Riviera
| Educational Attainment | Women with Births | Births / 1,000 Women |
| Less than High School | 0 (0.0%) | 0.0 |
| High School Diploma | 0 (0.0%) | 0.0 |
| College or Associate's Degree | 77 (100.0%) | 106.0 |
| Bachelor's Degree | 0 (0.0%) | 0.0 |
| Graduate Degree | 0 (0.0%) | 0.0 |
| Total | 77 (100.0%) | 71.0 |
Fertility by Education by Marriage Status in Clearlake Riviera
48.0% of women with births in Clearlake Riviera are unmarried. Women with the educational attainment of college or associate's degree are most likely to be married with 51.9% of them married at childbirth, while women with the educational attainment of college or associate's degree are least likely to be married with 48.0% of them unmarried at childbirth.
| Educational Attainment | Married | Unmarried |
| Less than High School | 0 (0.0%) | 0 (0.0%) |
| High School Diploma | 0 (0.0%) | 0 (0.0%) |
| College or Associate's Degree | 40 (51.9%) | 37 (48.0%) |
| Bachelor's Degree | 0 (0.0%) | 0 (0.0%) |
| Graduate Degree | 0 (0.0%) | 0 (0.0%) |
| Total | 40 (51.9%) | 37 (48.0%) |
Employment Characteristics in Clearlake Riviera
Employment by Class of Employer in Clearlake Riviera
Among the 1,947 employed individuals in Clearlake Riviera, private company employees (1,409 | 72.4%), local government employees (213 | 10.9%), and state government employees (138 | 7.1%) make up the most common classes of employment.
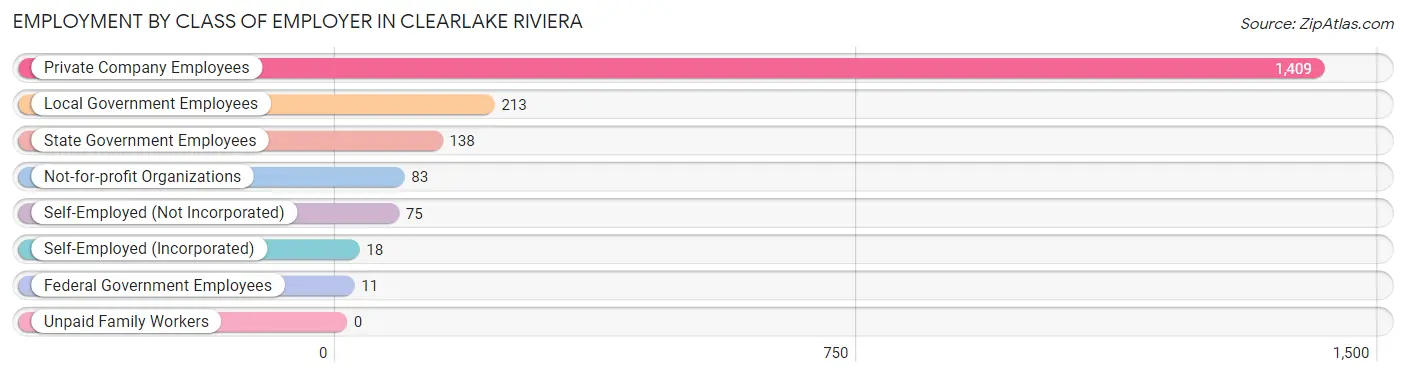
| Employer Class | # Employees | % Employees |
| Private Company Employees | 1,409 | 72.4% |
| Self-Employed (Incorporated) | 18 | 0.9% |
| Self-Employed (Not Incorporated) | 75 | 3.8% |
| Not-for-profit Organizations | 83 | 4.3% |
| Local Government Employees | 213 | 10.9% |
| State Government Employees | 138 | 7.1% |
| Federal Government Employees | 11 | 0.6% |
| Unpaid Family Workers | 0 | 0.0% |
| Total | 1,947 | 100.0% |
Employment Status by Age in Clearlake Riviera
According to the labor force statistics for Clearlake Riviera, out of the total population over 16 years of age (3,624), 63.3% or 2,294 individuals are in the labor force, with 11.5% or 264 of them unemployed. The age group with the highest labor force participation rate is 20 to 24 years, with 100.0% or 357 individuals in the labor force. Within the labor force, the 16 to 19 years age range has the highest percentage of unemployed individuals, with 57.0% or 45 of them being unemployed.
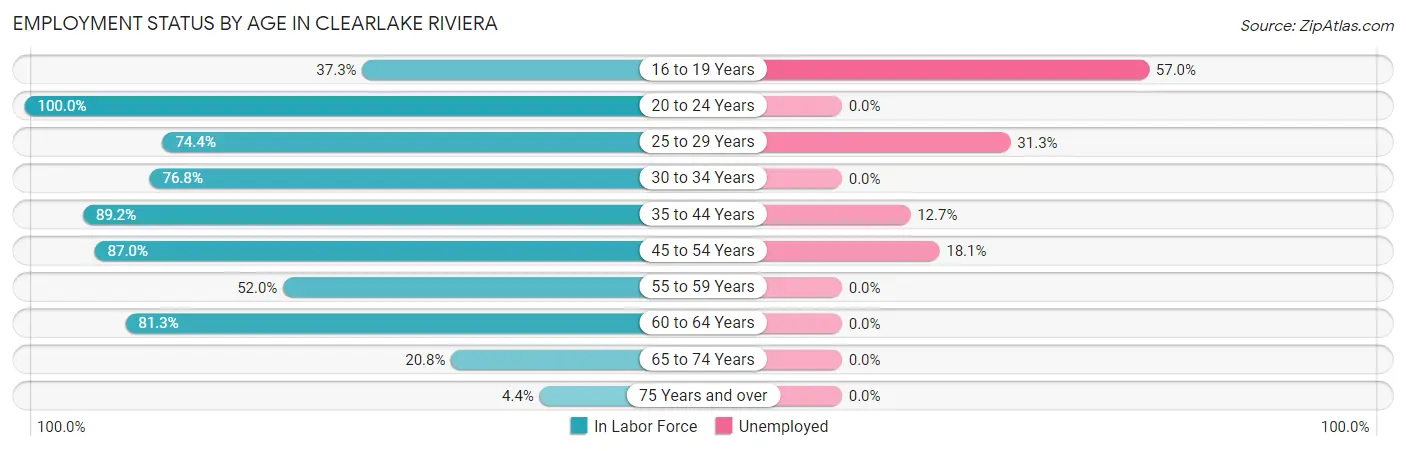
| Age Bracket | In Labor Force | Unemployed |
| 16 to 19 Years | 79 (37.3%) | 45 (57.0%) |
| 20 to 24 Years | 357 (100.0%) | 0 (0.0%) |
| 25 to 29 Years | 198 (74.4%) | 62 (31.3%) |
| 30 to 34 Years | 212 (76.8%) | 0 (0.0%) |
| 35 to 44 Years | 411 (89.2%) | 52 (12.7%) |
| 45 to 54 Years | 574 (87.0%) | 104 (18.1%) |
| 55 to 59 Years | 239 (52.0%) | 0 (0.0%) |
| 60 to 64 Years | 109 (81.3%) | 0 (0.0%) |
| 65 to 74 Years | 100 (20.8%) | 0 (0.0%) |
| 75 Years and over | 14 (4.4%) | 0 (0.0%) |
| Total | 2,294 (63.3%) | 264 (11.5%) |
Employment Status by Educational Attainment in Clearlake Riviera
According to labor force statistics for Clearlake Riviera, 77.2% of individuals (1,742) out of the total population between 25 and 64 years of age (2,257) are in the labor force, with 12.5% or 218 of them being unemployed. The group with the highest labor force participation rate are those with the educational attainment of bachelor's degree or higher, with 98.3% or 352 individuals in the labor force. Within the labor force, individuals with high school diploma education have the highest percentage of unemployment, with 36.0% or 104 of them being unemployed.
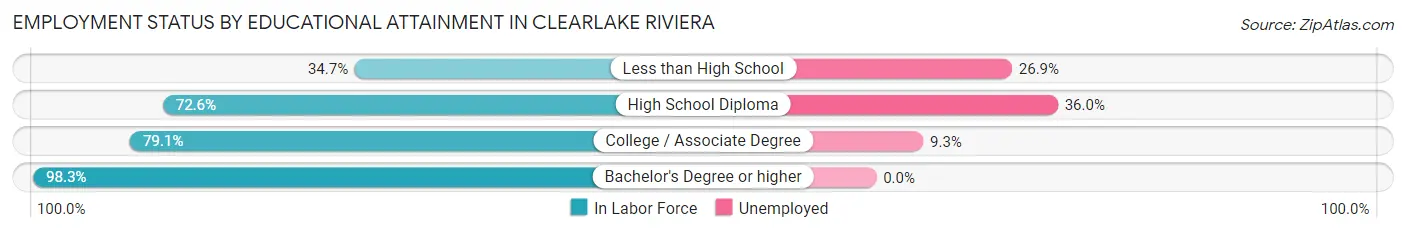
| Educational Attainment | In Labor Force | Unemployed |
| Less than High School | 67 (34.7%) | 52 (26.9%) |
| High School Diploma | 289 (72.6%) | 143 (36.0%) |
| College / Associate Degree | 1,035 (79.1%) | 122 (9.3%) |
| Bachelor's Degree or higher | 352 (98.3%) | 0 (0.0%) |
| Total | 1,742 (77.2%) | 282 (12.5%) |
Employment Occupations by Sex in Clearlake Riviera
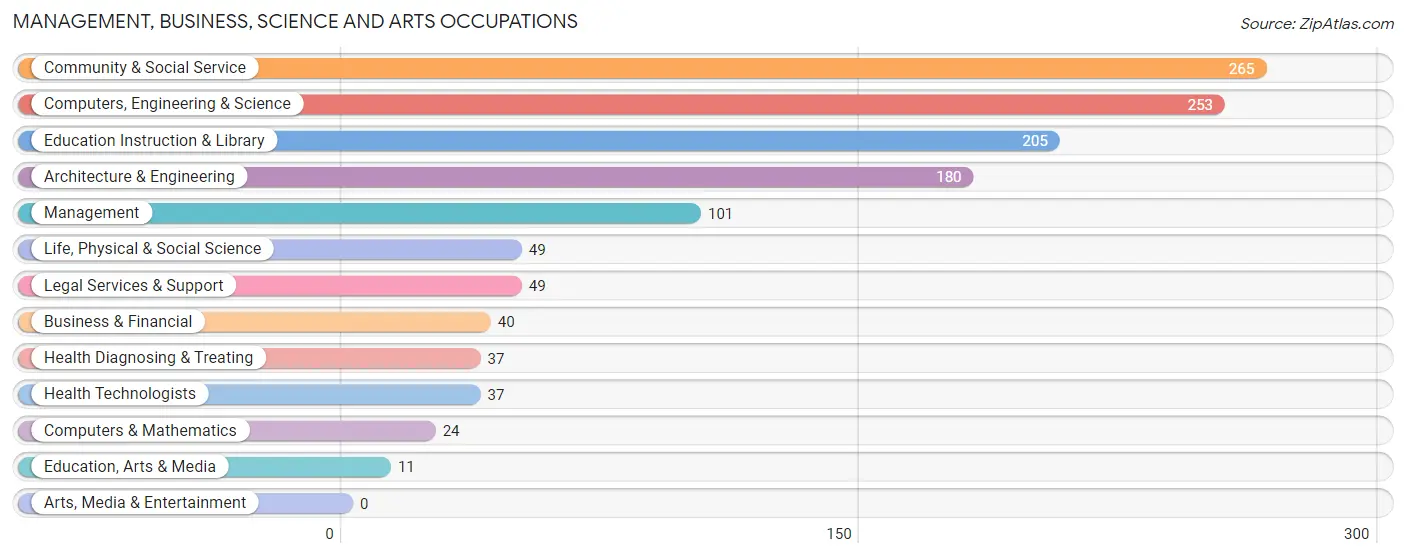
Management, Business, Science and Arts Occupations
The most common Management, Business, Science and Arts occupations in Clearlake Riviera are Community & Social Service (265 | 13.1%), Computers, Engineering & Science (253 | 12.5%), Education Instruction & Library (205 | 10.1%), Architecture & Engineering (180 | 8.9%), and Management (101 | 5.0%).
Management, Business, Science and Arts Occupations by Sex
Within the Management, Business, Science and Arts occupations in Clearlake Riviera, the most male-oriented occupations are Education, Arts & Media (100.0%), Life, Physical & Social Science (95.9%), and Architecture & Engineering (72.2%), while the most female-oriented occupations are Computers & Mathematics (100.0%), Legal Services & Support (100.0%), and Health Diagnosing & Treating (94.6%).
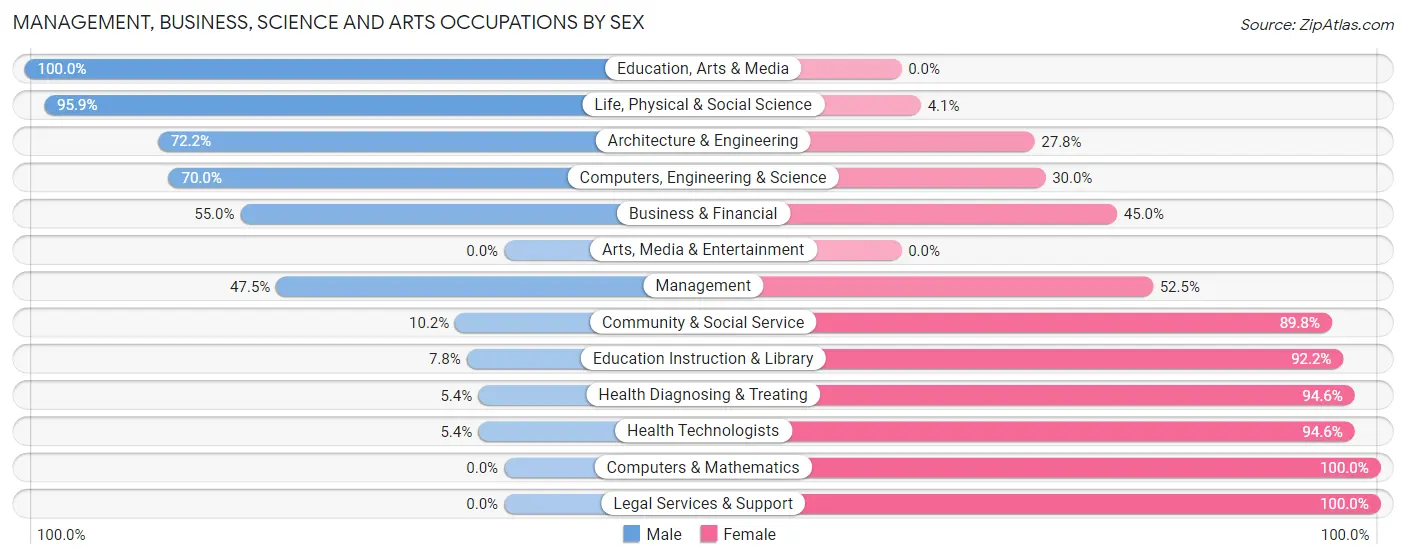
| Occupation | Male | Female |
| Management | 48 (47.5%) | 53 (52.5%) |
| Business & Financial | 22 (55.0%) | 18 (45.0%) |
| Computers, Engineering & Science | 177 (70.0%) | 76 (30.0%) |
| Computers & Mathematics | 0 (0.0%) | 24 (100.0%) |
| Architecture & Engineering | 130 (72.2%) | 50 (27.8%) |
| Life, Physical & Social Science | 47 (95.9%) | 2 (4.1%) |
| Community & Social Service | 27 (10.2%) | 238 (89.8%) |
| Education, Arts & Media | 11 (100.0%) | 0 (0.0%) |
| Legal Services & Support | 0 (0.0%) | 49 (100.0%) |
| Education Instruction & Library | 16 (7.8%) | 189 (92.2%) |
| Arts, Media & Entertainment | 0 (0.0%) | 0 (0.0%) |
| Health Diagnosing & Treating | 2 (5.4%) | 35 (94.6%) |
| Health Technologists | 2 (5.4%) | 35 (94.6%) |
| Total (Category) | 276 (39.7%) | 420 (60.3%) |
| Total (Overall) | 933 (46.0%) | 1,097 (54.0%) |
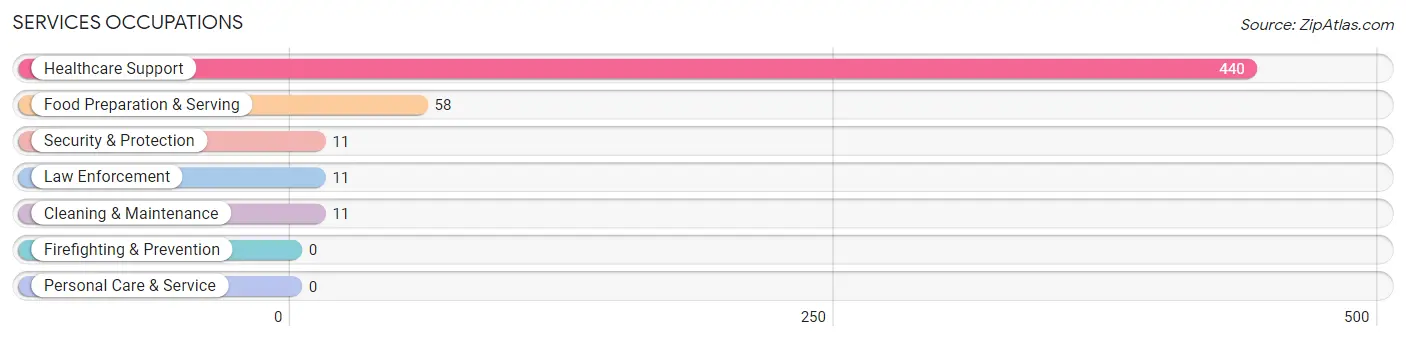
Services Occupations
The most common Services occupations in Clearlake Riviera are Healthcare Support (440 | 21.7%), Food Preparation & Serving (58 | 2.9%), Security & Protection (11 | 0.5%), Law Enforcement (11 | 0.5%), and Cleaning & Maintenance (11 | 0.5%).
Services Occupations by Sex
Within the Services occupations in Clearlake Riviera, the most male-oriented occupations are Food Preparation & Serving (100.0%), Cleaning & Maintenance (100.0%), and Healthcare Support (6.6%), while the most female-oriented occupations are Security & Protection (100.0%), Law Enforcement (100.0%), and Healthcare Support (93.4%).
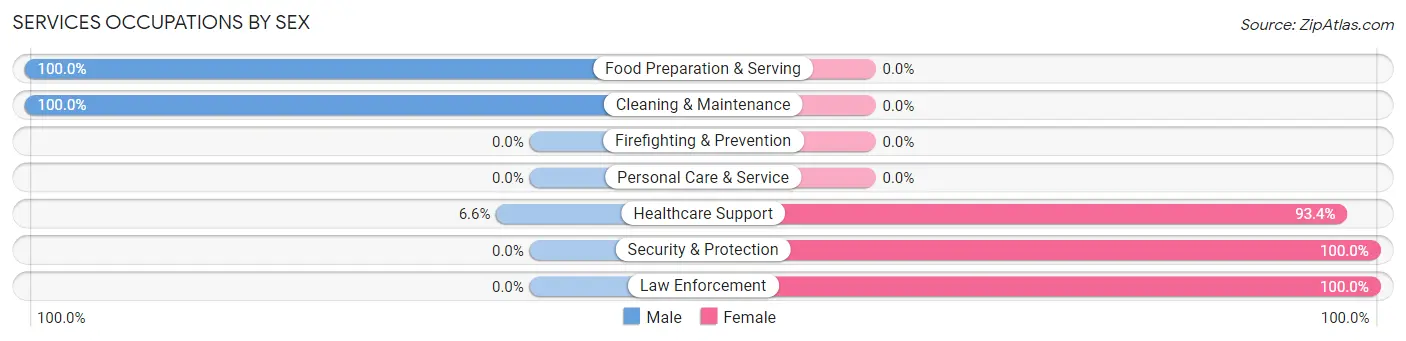
| Occupation | Male | Female |
| Healthcare Support | 29 (6.6%) | 411 (93.4%) |
| Security & Protection | 0 (0.0%) | 11 (100.0%) |
| Firefighting & Prevention | 0 (0.0%) | 0 (0.0%) |
| Law Enforcement | 0 (0.0%) | 11 (100.0%) |
| Food Preparation & Serving | 58 (100.0%) | 0 (0.0%) |
| Cleaning & Maintenance | 11 (100.0%) | 0 (0.0%) |
| Personal Care & Service | 0 (0.0%) | 0 (0.0%) |
| Total (Category) | 98 (18.9%) | 422 (81.1%) |
| Total (Overall) | 933 (46.0%) | 1,097 (54.0%) |
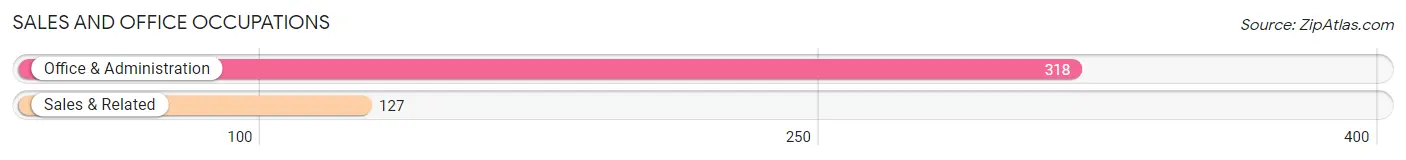
Sales and Office Occupations
The most common Sales and Office occupations in Clearlake Riviera are Office & Administration (318 | 15.7%), and Sales & Related (127 | 6.3%).
Sales and Office Occupations by Sex
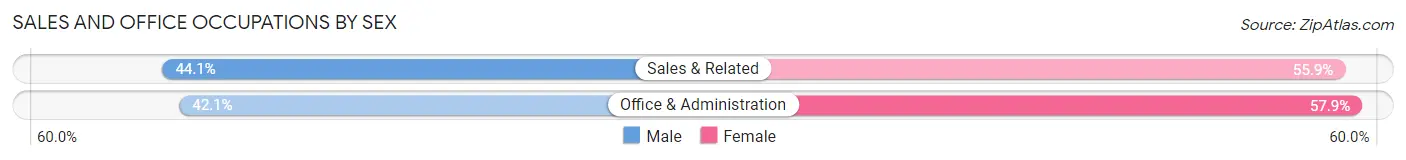
| Occupation | Male | Female |
| Sales & Related | 56 (44.1%) | 71 (55.9%) |
| Office & Administration | 134 (42.1%) | 184 (57.9%) |
| Total (Category) | 190 (42.7%) | 255 (57.3%) |
| Total (Overall) | 933 (46.0%) | 1,097 (54.0%) |
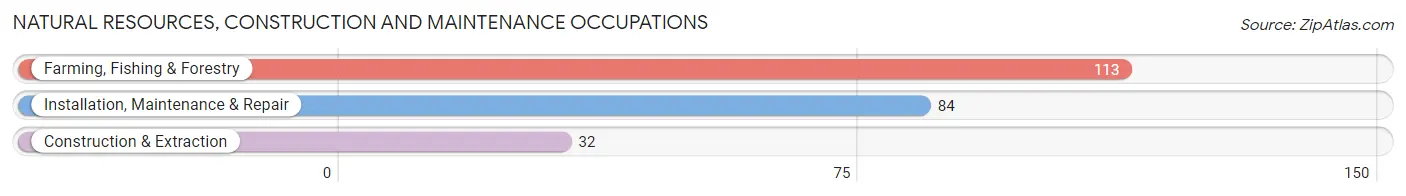
Natural Resources, Construction and Maintenance Occupations
The most common Natural Resources, Construction and Maintenance occupations in Clearlake Riviera are Farming, Fishing & Forestry (113 | 5.6%), Installation, Maintenance & Repair (84 | 4.1%), and Construction & Extraction (32 | 1.6%).
Natural Resources, Construction and Maintenance Occupations by Sex
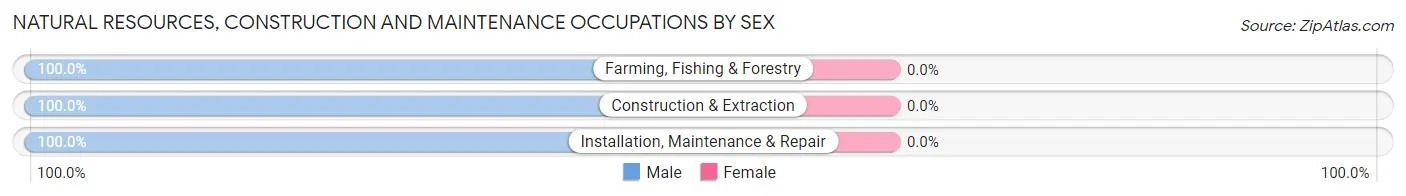
| Occupation | Male | Female |
| Farming, Fishing & Forestry | 113 (100.0%) | 0 (0.0%) |
| Construction & Extraction | 32 (100.0%) | 0 (0.0%) |
| Installation, Maintenance & Repair | 84 (100.0%) | 0 (0.0%) |
| Total (Category) | 229 (100.0%) | 0 (0.0%) |
| Total (Overall) | 933 (46.0%) | 1,097 (54.0%) |
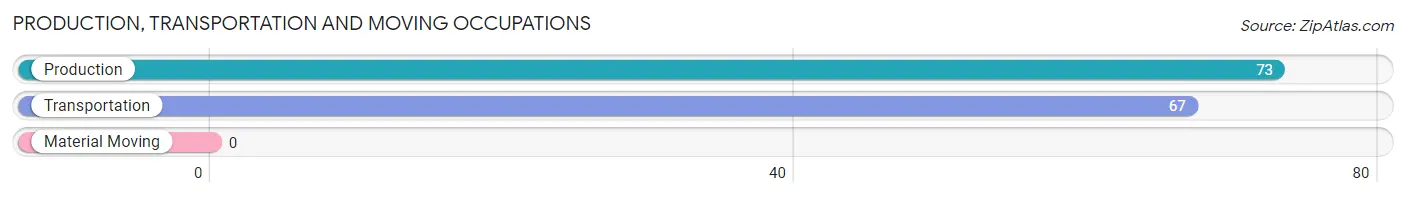
Production, Transportation and Moving Occupations
The most common Production, Transportation and Moving occupations in Clearlake Riviera are Production (73 | 3.6%), and Transportation (67 | 3.3%).
Production, Transportation and Moving Occupations by Sex
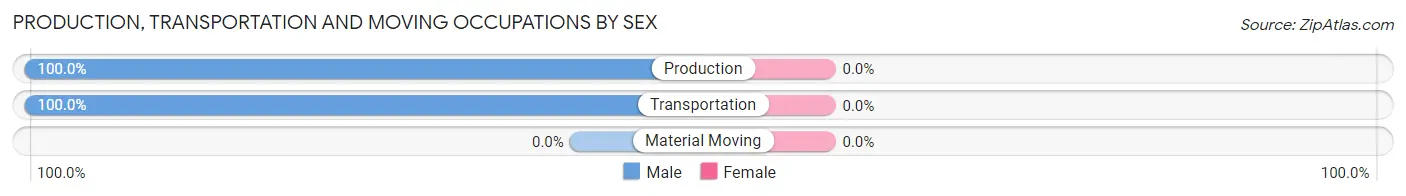
| Occupation | Male | Female |
| Production | 73 (100.0%) | 0 (0.0%) |
| Transportation | 67 (100.0%) | 0 (0.0%) |
| Material Moving | 0 (0.0%) | 0 (0.0%) |
| Total (Category) | 140 (100.0%) | 0 (0.0%) |
| Total (Overall) | 933 (46.0%) | 1,097 (54.0%) |
Employment Industries by Sex in Clearlake Riviera
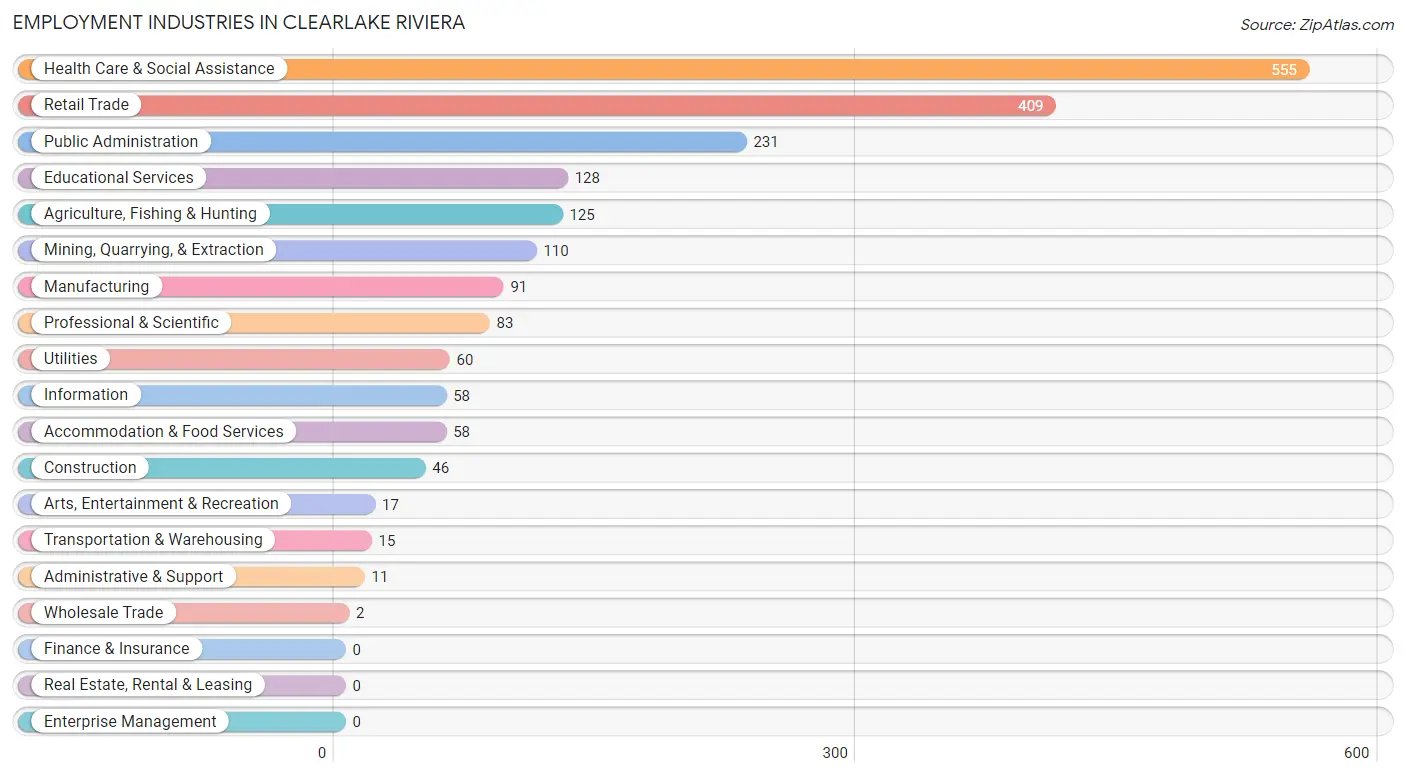
Employment Industries in Clearlake Riviera
The major employment industries in Clearlake Riviera include Health Care & Social Assistance (555 | 27.3%), Retail Trade (409 | 20.2%), Public Administration (231 | 11.4%), Educational Services (128 | 6.3%), and Agriculture, Fishing & Hunting (125 | 6.2%).
Employment Industries by Sex in Clearlake Riviera
The Clearlake Riviera industries that see more men than women are Agriculture, Fishing & Hunting (100.0%), Mining, Quarrying, & Extraction (100.0%), and Manufacturing (100.0%), whereas the industries that tend to have a higher number of women are Wholesale Trade (100.0%), Professional & Scientific (100.0%), and Arts, Entertainment & Recreation (100.0%).
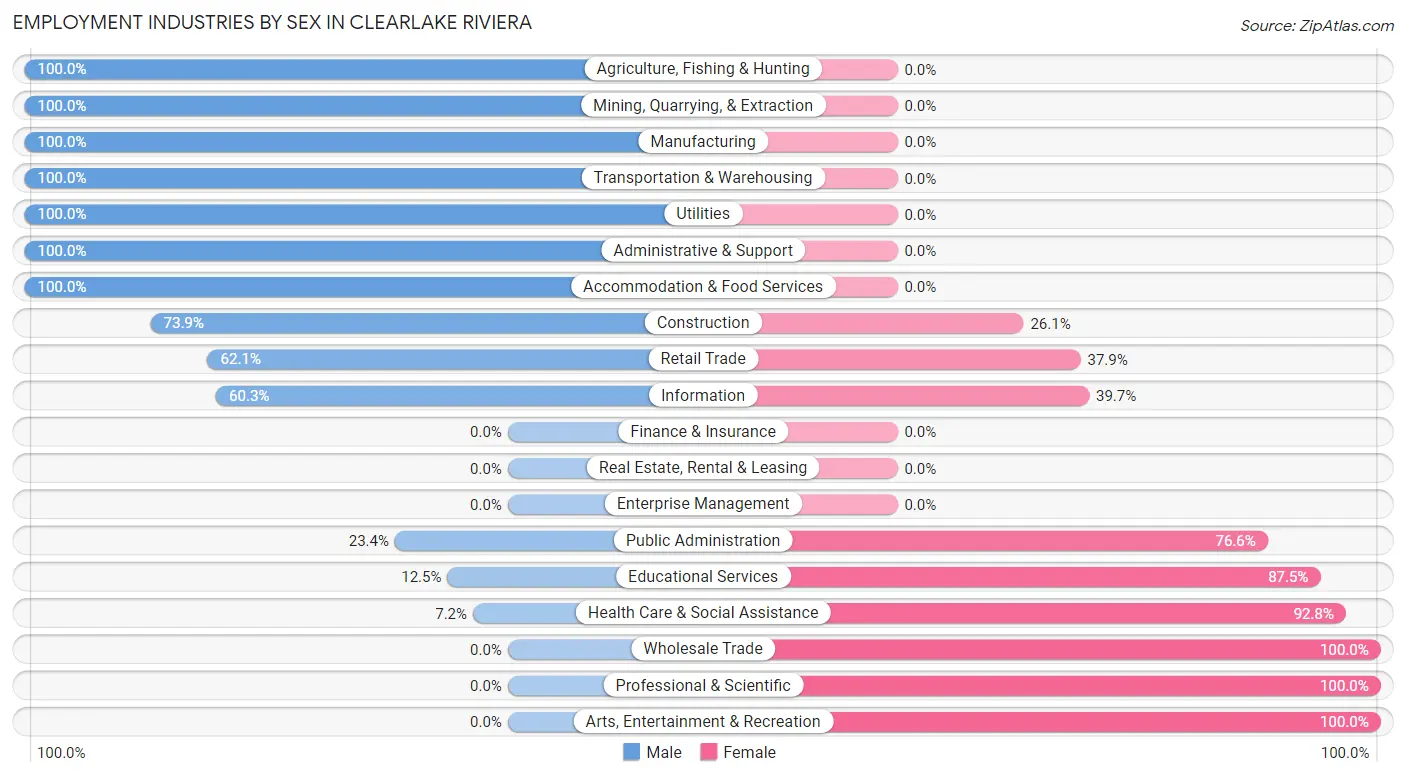
| Industry | Male | Female |
| Agriculture, Fishing & Hunting | 125 (100.0%) | 0 (0.0%) |
| Mining, Quarrying, & Extraction | 110 (100.0%) | 0 (0.0%) |
| Construction | 34 (73.9%) | 12 (26.1%) |
| Manufacturing | 91 (100.0%) | 0 (0.0%) |
| Wholesale Trade | 0 (0.0%) | 2 (100.0%) |
| Retail Trade | 254 (62.1%) | 155 (37.9%) |
| Transportation & Warehousing | 15 (100.0%) | 0 (0.0%) |
| Utilities | 60 (100.0%) | 0 (0.0%) |
| Information | 35 (60.3%) | 23 (39.7%) |
| Finance & Insurance | 0 (0.0%) | 0 (0.0%) |
| Real Estate, Rental & Leasing | 0 (0.0%) | 0 (0.0%) |
| Professional & Scientific | 0 (0.0%) | 83 (100.0%) |
| Enterprise Management | 0 (0.0%) | 0 (0.0%) |
| Administrative & Support | 11 (100.0%) | 0 (0.0%) |
| Educational Services | 16 (12.5%) | 112 (87.5%) |
| Health Care & Social Assistance | 40 (7.2%) | 515 (92.8%) |
| Arts, Entertainment & Recreation | 0 (0.0%) | 17 (100.0%) |
| Accommodation & Food Services | 58 (100.0%) | 0 (0.0%) |
| Public Administration | 54 (23.4%) | 177 (76.6%) |
| Total | 933 (46.0%) | 1,097 (54.0%) |
Education in Clearlake Riviera
School Enrollment in Clearlake Riviera
The most common levels of schooling among the 1,270 students in Clearlake Riviera are high school (455 | 35.8%), college / undergraduate (400 | 31.5%), and elementary school (188 | 14.8%).
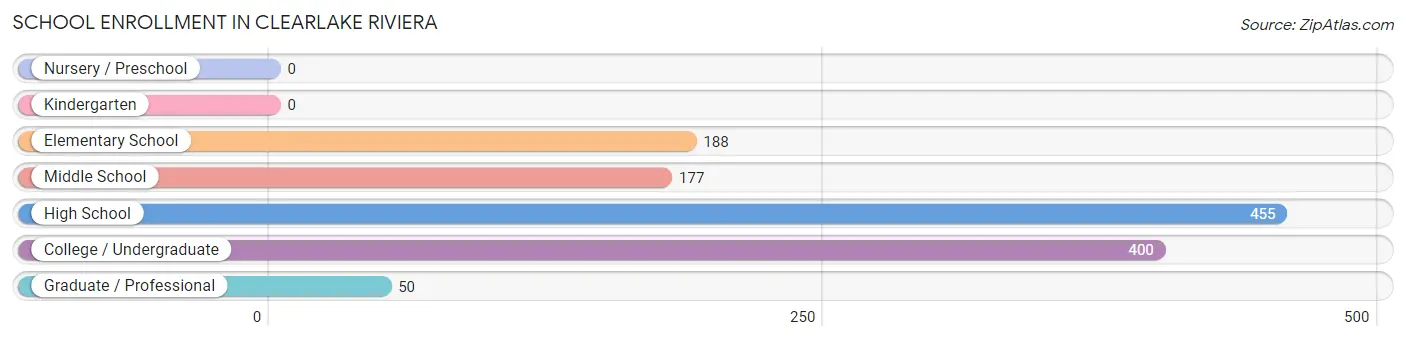
| School Level | # Students | % Students |
| Nursery / Preschool | 0 | 0.0% |
| Kindergarten | 0 | 0.0% |
| Elementary School | 188 | 14.8% |
| Middle School | 177 | 13.9% |
| High School | 455 | 35.8% |
| College / Undergraduate | 400 | 31.5% |
| Graduate / Professional | 50 | 3.9% |
| Total | 1,270 | 100.0% |
School Enrollment by Age by Funding Source in Clearlake Riviera
Out of a total of 1,270 students who are enrolled in schools in Clearlake Riviera, 3 (0.2%) attend a private institution, while the remaining 1,267 (99.8%) are enrolled in public schools. The age group of 35 years and over has the highest likelihood of being enrolled in private schools, with 2 (0.9% in the age bracket) enrolled. Conversely, the age group of 5 to 9 year old has the lowest likelihood of being enrolled in a private school, with 173 (100.0% in the age bracket) attending a public institution.
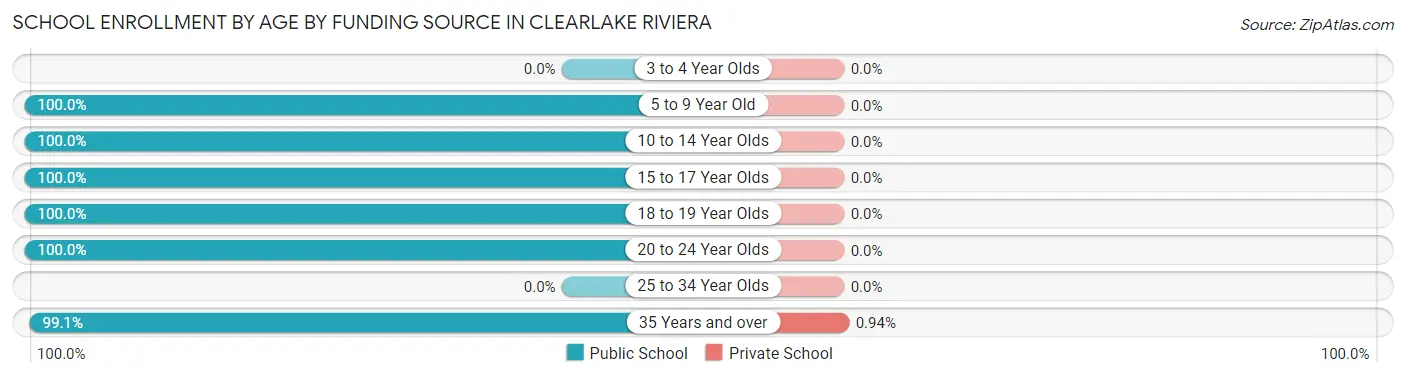
| Age Bracket | Public School | Private School |
| 3 to 4 Year Olds | 0 (0.0%) | 0 (0.0%) |
| 5 to 9 Year Old | 173 (100.0%) | 0 (0.0%) |
| 10 to 14 Year Olds | 309 (100.0%) | 0 (0.0%) |
| 15 to 17 Year Olds | 242 (100.0%) | 0 (0.0%) |
| 18 to 19 Year Olds | 45 (100.0%) | 0 (0.0%) |
| 20 to 24 Year Olds | 288 (100.0%) | 0 (0.0%) |
| 25 to 34 Year Olds | 0 (0.0%) | 0 (0.0%) |
| 35 Years and over | 211 (99.1%) | 2 (0.9%) |
| Total | 1,267 (99.8%) | 3 (0.2%) |
Educational Attainment by Field of Study in Clearlake Riviera
Engineering (107 | 20.6%), science & technology (100 | 19.3%), education (74 | 14.3%), physical & health sciences (70 | 13.5%), and business (68 | 13.1%) are the most common fields of study among 519 individuals in Clearlake Riviera who have obtained a bachelor's degree or higher.
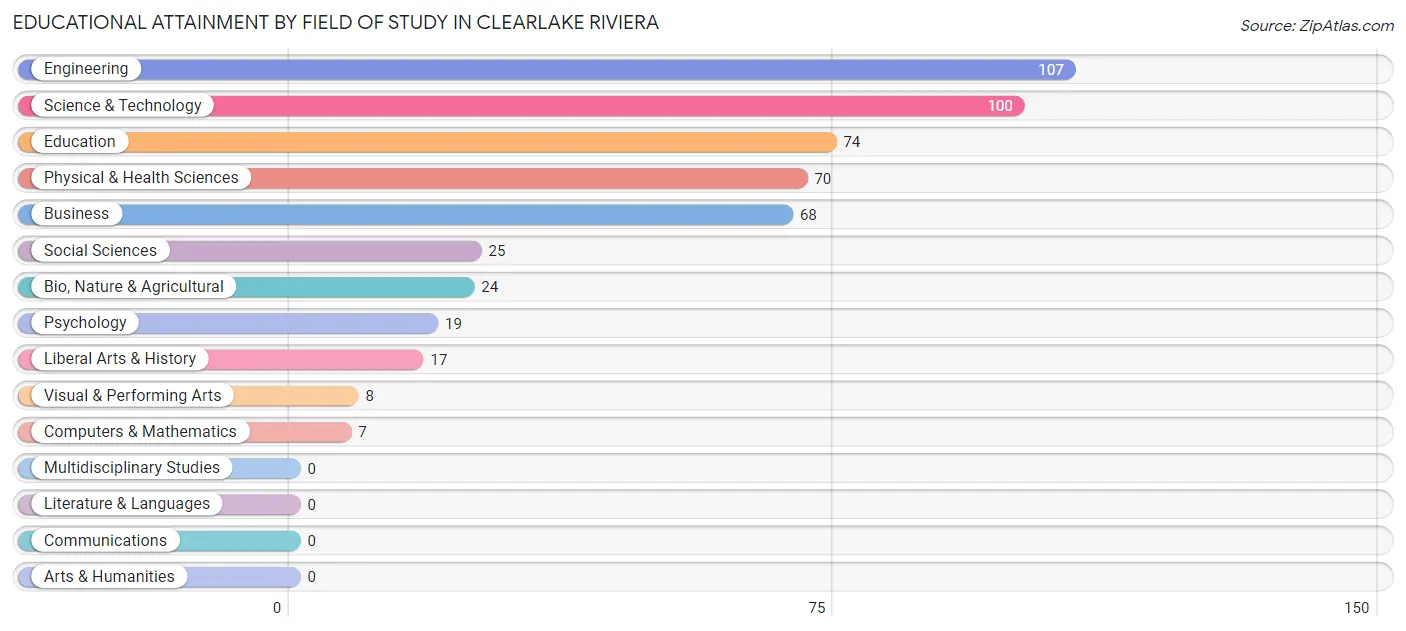
| Field of Study | # Graduates | % Graduates |
| Computers & Mathematics | 7 | 1.3% |
| Bio, Nature & Agricultural | 24 | 4.6% |
| Physical & Health Sciences | 70 | 13.5% |
| Psychology | 19 | 3.7% |
| Social Sciences | 25 | 4.8% |
| Engineering | 107 | 20.6% |
| Multidisciplinary Studies | 0 | 0.0% |
| Science & Technology | 100 | 19.3% |
| Business | 68 | 13.1% |
| Education | 74 | 14.3% |
| Literature & Languages | 0 | 0.0% |
| Liberal Arts & History | 17 | 3.3% |
| Visual & Performing Arts | 8 | 1.5% |
| Communications | 0 | 0.0% |
| Arts & Humanities | 0 | 0.0% |
| Total | 519 | 100.0% |
Transportation & Commute in Clearlake Riviera
Vehicle Availability by Sex in Clearlake Riviera
The most prevalent vehicle ownership categories in Clearlake Riviera are males with 2 vehicles (451, accounting for 50.7%) and females with 2 vehicles (345, making up 42.7%).
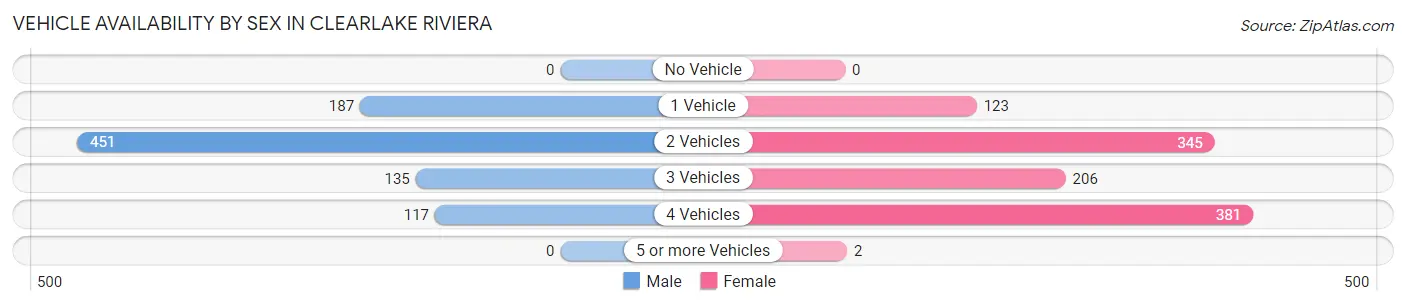
| Vehicles Available | Male | Female |
| No Vehicle | 0 (0.0%) | 0 (0.0%) |
| 1 Vehicle | 187 (21.0%) | 123 (11.6%) |
| 2 Vehicles | 451 (50.7%) | 345 (32.6%) |
| 3 Vehicles | 135 (15.2%) | 206 (19.5%) |
| 4 Vehicles | 117 (13.2%) | 381 (36.0%) |
| 5 or more Vehicles | 0 (0.0%) | 2 (0.2%) |
| Total | 890 (100.0%) | 1,057 (100.0%) |
Commute Time in Clearlake Riviera
The most frequently occuring commute durations in Clearlake Riviera are 30 to 34 minutes (430 commuters, 28.3%), 20 to 24 minutes (196 commuters, 12.9%), and 25 to 29 minutes (173 commuters, 11.4%).
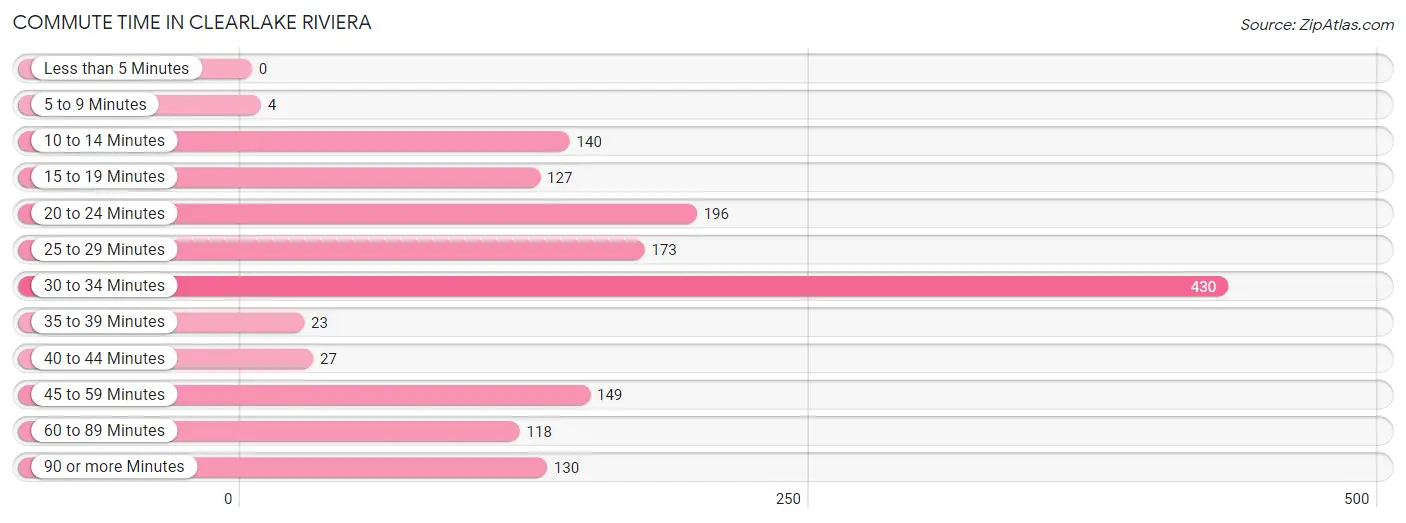
| Commute Time | # Commuters | % Commuters |
| Less than 5 Minutes | 0 | 0.0% |
| 5 to 9 Minutes | 4 | 0.3% |
| 10 to 14 Minutes | 140 | 9.2% |
| 15 to 19 Minutes | 127 | 8.4% |
| 20 to 24 Minutes | 196 | 12.9% |
| 25 to 29 Minutes | 173 | 11.4% |
| 30 to 34 Minutes | 430 | 28.3% |
| 35 to 39 Minutes | 23 | 1.5% |
| 40 to 44 Minutes | 27 | 1.8% |
| 45 to 59 Minutes | 149 | 9.8% |
| 60 to 89 Minutes | 118 | 7.8% |
| 90 or more Minutes | 130 | 8.6% |
Commute Time by Sex in Clearlake Riviera
The most common commute times in Clearlake Riviera are 45 to 59 minutes (149 commuters, 21.0%) for males and 30 to 34 minutes (383 commuters, 47.5%) for females.
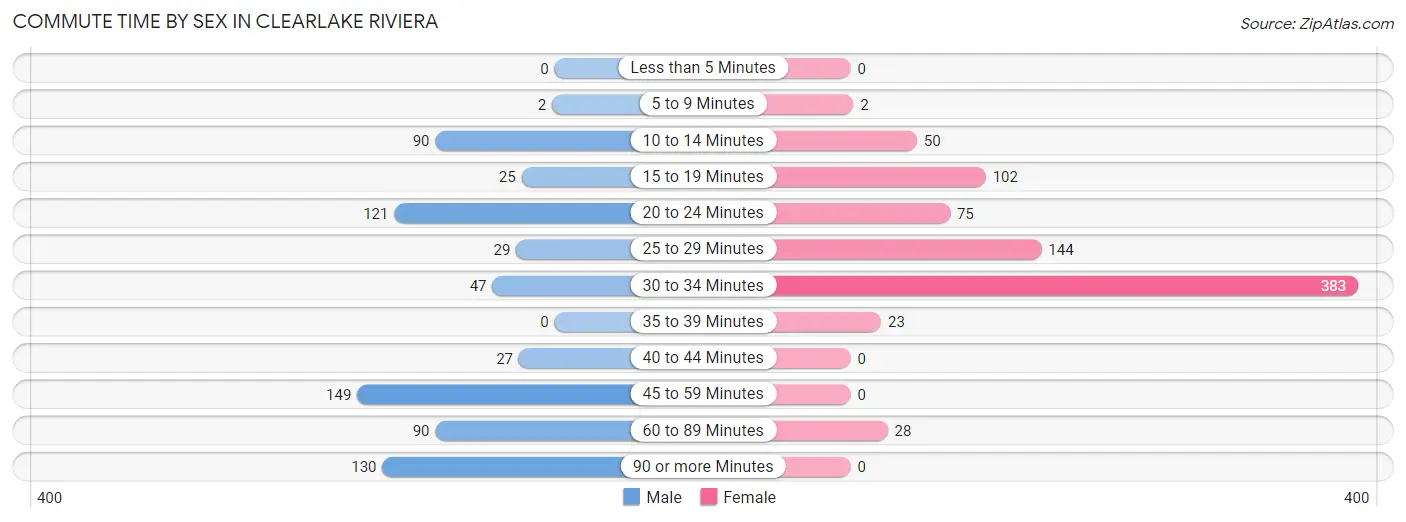
| Commute Time | Male | Female |
| Less than 5 Minutes | 0 (0.0%) | 0 (0.0%) |
| 5 to 9 Minutes | 2 (0.3%) | 2 (0.3%) |
| 10 to 14 Minutes | 90 (12.7%) | 50 (6.2%) |
| 15 to 19 Minutes | 25 (3.5%) | 102 (12.6%) |
| 20 to 24 Minutes | 121 (17.0%) | 75 (9.3%) |
| 25 to 29 Minutes | 29 (4.1%) | 144 (17.8%) |
| 30 to 34 Minutes | 47 (6.6%) | 383 (47.5%) |
| 35 to 39 Minutes | 0 (0.0%) | 23 (2.9%) |
| 40 to 44 Minutes | 27 (3.8%) | 0 (0.0%) |
| 45 to 59 Minutes | 149 (21.0%) | 0 (0.0%) |
| 60 to 89 Minutes | 90 (12.7%) | 28 (3.5%) |
| 90 or more Minutes | 130 (18.3%) | 0 (0.0%) |
Time of Departure to Work by Sex in Clearlake Riviera
The most frequent times of departure to work in Clearlake Riviera are 6:00 AM to 6:29 AM (170, 23.9%) for males and 7:30 AM to 7:59 AM (377, 46.7%) for females.
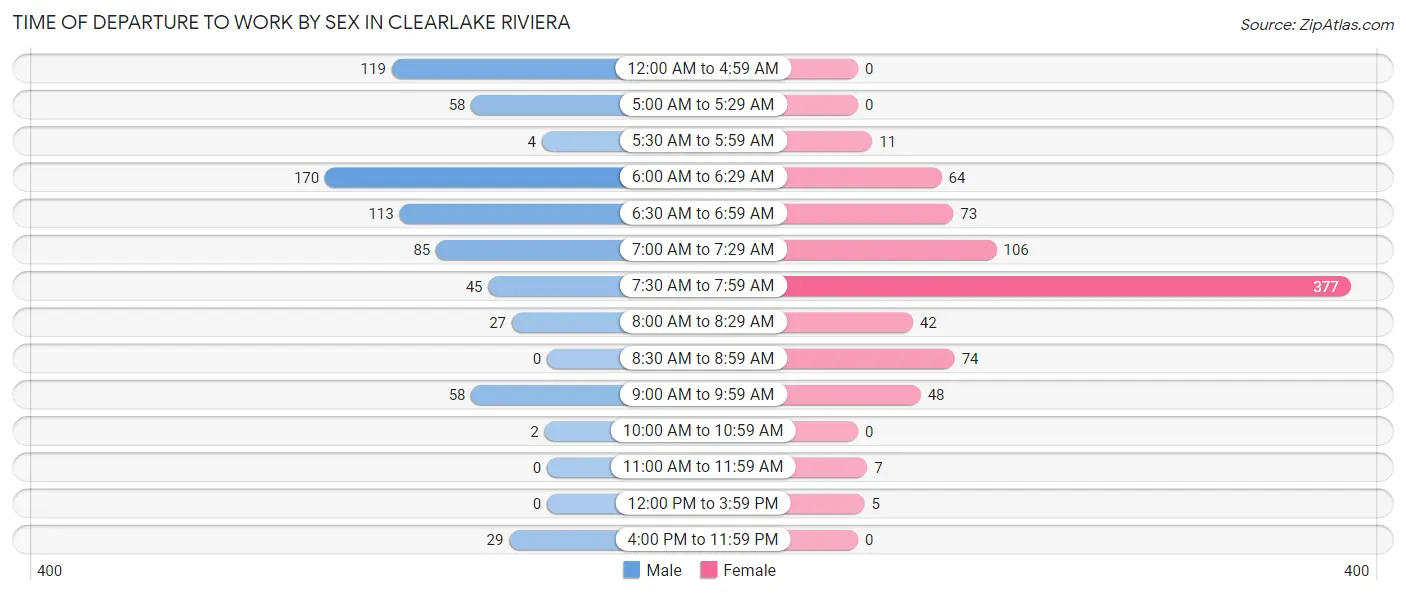
| Time of Departure | Male | Female |
| 12:00 AM to 4:59 AM | 119 (16.8%) | 0 (0.0%) |
| 5:00 AM to 5:29 AM | 58 (8.2%) | 0 (0.0%) |
| 5:30 AM to 5:59 AM | 4 (0.6%) | 11 (1.4%) |
| 6:00 AM to 6:29 AM | 170 (23.9%) | 64 (7.9%) |
| 6:30 AM to 6:59 AM | 113 (15.9%) | 73 (9.0%) |
| 7:00 AM to 7:29 AM | 85 (12.0%) | 106 (13.1%) |
| 7:30 AM to 7:59 AM | 45 (6.3%) | 377 (46.7%) |
| 8:00 AM to 8:29 AM | 27 (3.8%) | 42 (5.2%) |
| 8:30 AM to 8:59 AM | 0 (0.0%) | 74 (9.2%) |
| 9:00 AM to 9:59 AM | 58 (8.2%) | 48 (5.9%) |
| 10:00 AM to 10:59 AM | 2 (0.3%) | 0 (0.0%) |
| 11:00 AM to 11:59 AM | 0 (0.0%) | 7 (0.9%) |
| 12:00 PM to 3:59 PM | 0 (0.0%) | 5 (0.6%) |
| 4:00 PM to 11:59 PM | 29 (4.1%) | 0 (0.0%) |
| Total | 710 (100.0%) | 807 (100.0%) |
Housing Occupancy in Clearlake Riviera
Occupancy by Ownership in Clearlake Riviera
Of the total 1,492 dwellings in Clearlake Riviera, owner-occupied units account for 1,212 (81.2%), while renter-occupied units make up 280 (18.8%).
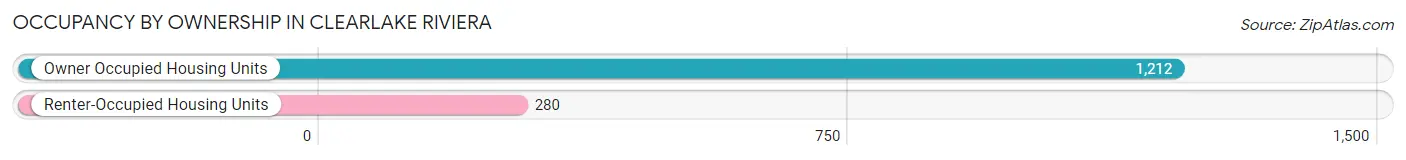
| Occupancy | # Housing Units | % Housing Units |
| Owner Occupied Housing Units | 1,212 | 81.2% |
| Renter-Occupied Housing Units | 280 | 18.8% |
| Total Occupied Housing Units | 1,492 | 100.0% |
Occupancy by Household Size in Clearlake Riviera
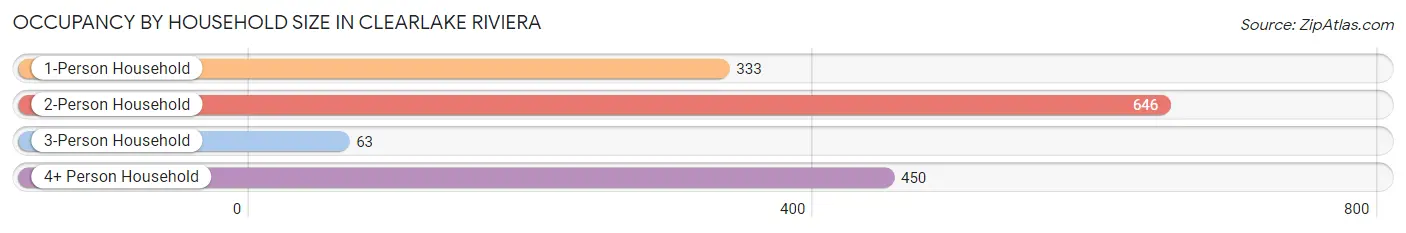
| Household Size | # Housing Units | % Housing Units |
| 1-Person Household | 333 | 22.3% |
| 2-Person Household | 646 | 43.3% |
| 3-Person Household | 63 | 4.2% |
| 4+ Person Household | 450 | 30.2% |
| Total Housing Units | 1,492 | 100.0% |
Occupancy by Ownership by Household Size in Clearlake Riviera
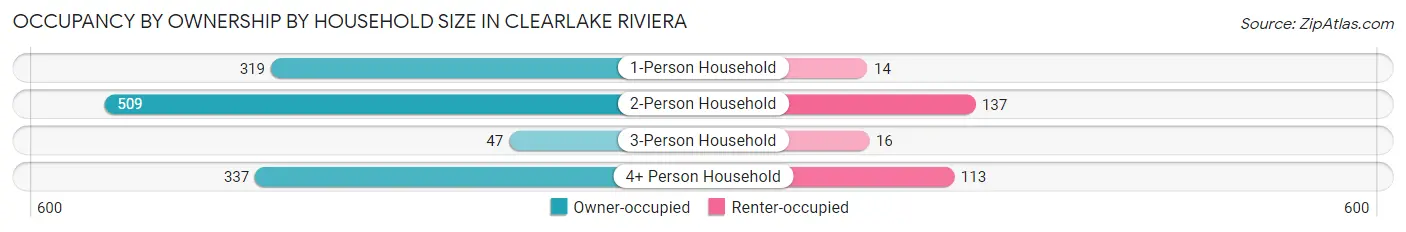
| Household Size | Owner-occupied | Renter-occupied |
| 1-Person Household | 319 (95.8%) | 14 (4.2%) |
| 2-Person Household | 509 (78.8%) | 137 (21.2%) |
| 3-Person Household | 47 (74.6%) | 16 (25.4%) |
| 4+ Person Household | 337 (74.9%) | 113 (25.1%) |
| Total Housing Units | 1,212 (81.2%) | 280 (18.8%) |
Occupancy by Educational Attainment in Clearlake Riviera
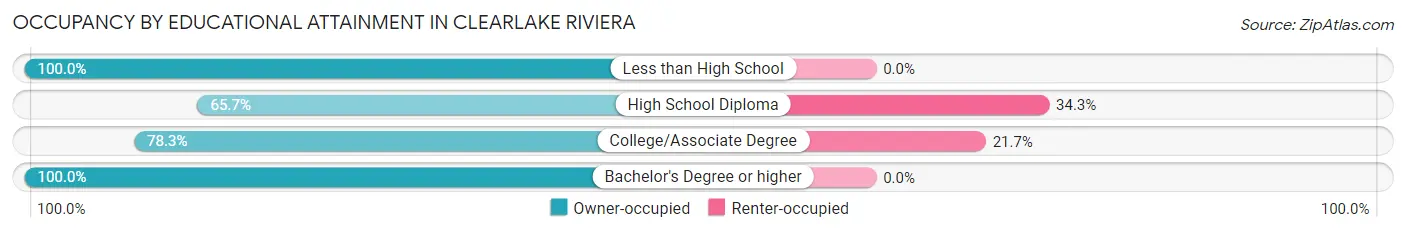
| Household Size | Owner-occupied | Renter-occupied |
| Less than High School | 91 (100.0%) | 0 (0.0%) |
| High School Diploma | 184 (65.7%) | 96 (34.3%) |
| College/Associate Degree | 663 (78.3%) | 184 (21.7%) |
| Bachelor's Degree or higher | 274 (100.0%) | 0 (0.0%) |
Occupancy by Age of Householder in Clearlake Riviera
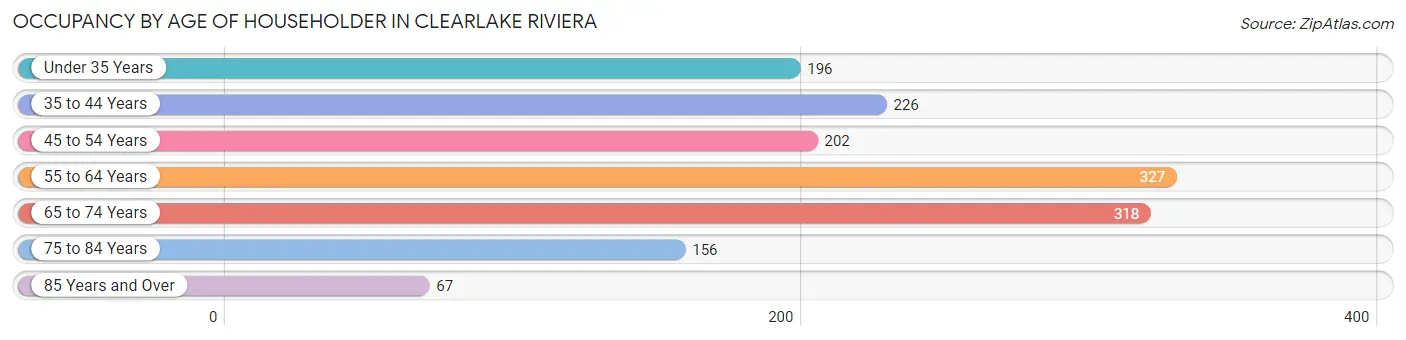
| Age Bracket | # Households | % Households |
| Under 35 Years | 196 | 13.1% |
| 35 to 44 Years | 226 | 15.1% |
| 45 to 54 Years | 202 | 13.5% |
| 55 to 64 Years | 327 | 21.9% |
| 65 to 74 Years | 318 | 21.3% |
| 75 to 84 Years | 156 | 10.5% |
| 85 Years and Over | 67 | 4.5% |
| Total | 1,492 | 100.0% |
Housing Finances in Clearlake Riviera
Median Income by Occupancy in Clearlake Riviera
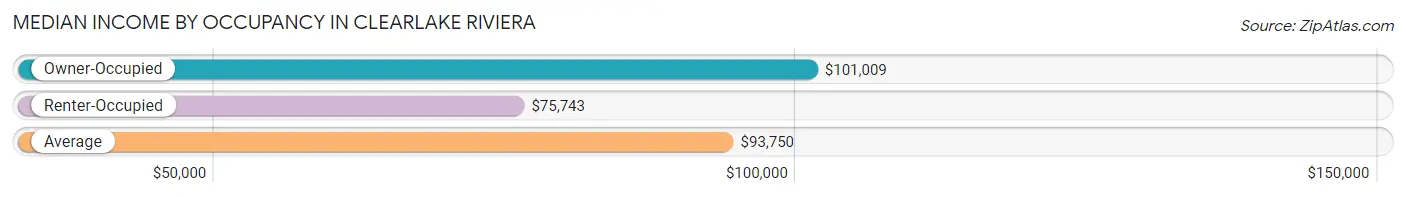
| Occupancy Type | # Households | Median Income |
| Owner-Occupied | 1,212 (81.2%) | $101,009 |
| Renter-Occupied | 280 (18.8%) | $75,743 |
| Average | 1,492 (100.0%) | $93,750 |
Occupancy by Householder Income Bracket in Clearlake Riviera
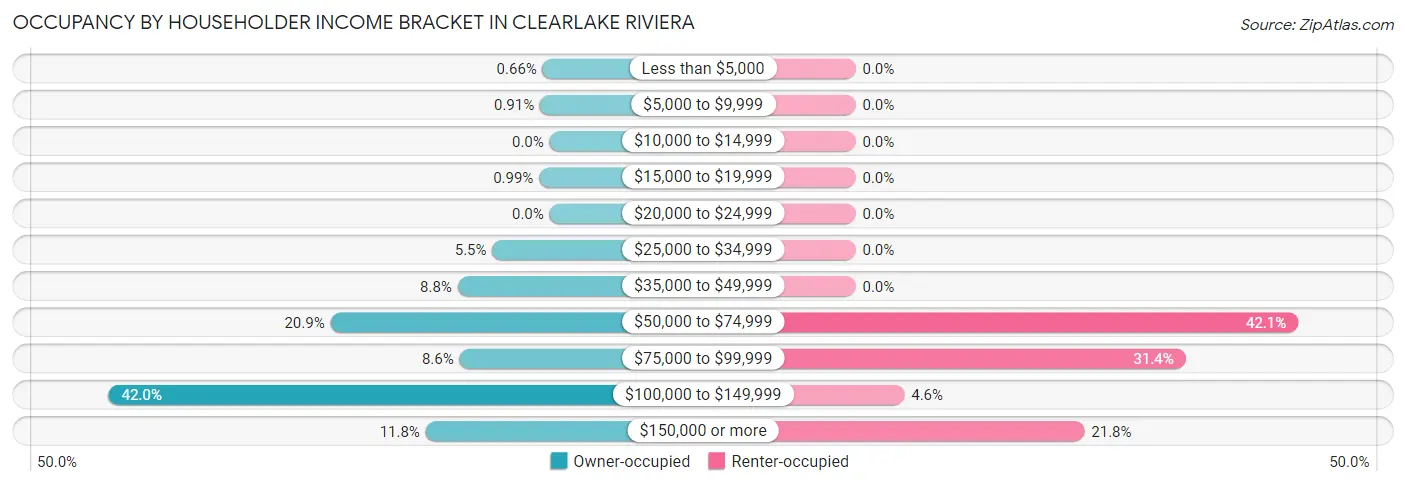
| Income Bracket | Owner-occupied | Renter-occupied |
| Less than $5,000 | 8 (0.7%) | 0 (0.0%) |
| $5,000 to $9,999 | 11 (0.9%) | 0 (0.0%) |
| $10,000 to $14,999 | 0 (0.0%) | 0 (0.0%) |
| $15,000 to $19,999 | 12 (1.0%) | 0 (0.0%) |
| $20,000 to $24,999 | 0 (0.0%) | 0 (0.0%) |
| $25,000 to $34,999 | 66 (5.4%) | 0 (0.0%) |
| $35,000 to $49,999 | 106 (8.7%) | 0 (0.0%) |
| $50,000 to $74,999 | 253 (20.9%) | 118 (42.1%) |
| $75,000 to $99,999 | 104 (8.6%) | 88 (31.4%) |
| $100,000 to $149,999 | 509 (42.0%) | 13 (4.6%) |
| $150,000 or more | 143 (11.8%) | 61 (21.8%) |
| Total | 1,212 (100.0%) | 280 (100.0%) |
Monthly Housing Cost Tiers in Clearlake Riviera
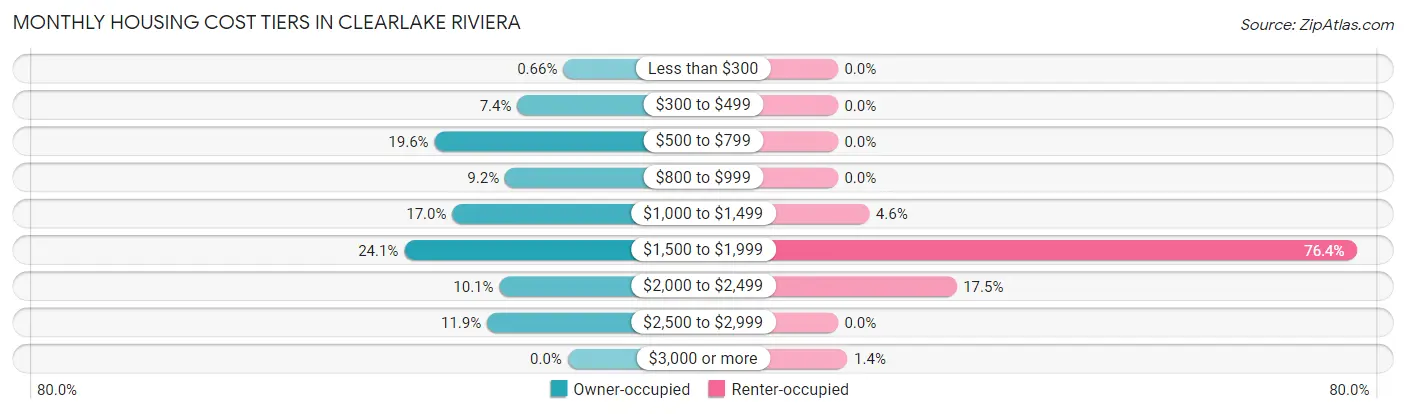
| Monthly Cost | Owner-occupied | Renter-occupied |
| Less than $300 | 8 (0.7%) | 0 (0.0%) |
| $300 to $499 | 90 (7.4%) | 0 (0.0%) |
| $500 to $799 | 238 (19.6%) | 0 (0.0%) |
| $800 to $999 | 112 (9.2%) | 0 (0.0%) |
| $1,000 to $1,499 | 206 (17.0%) | 13 (4.6%) |
| $1,500 to $1,999 | 292 (24.1%) | 214 (76.4%) |
| $2,000 to $2,499 | 122 (10.1%) | 49 (17.5%) |
| $2,500 to $2,999 | 144 (11.9%) | 0 (0.0%) |
| $3,000 or more | 0 (0.0%) | 4 (1.4%) |
| Total | 1,212 (100.0%) | 280 (100.0%) |
Physical Housing Characteristics in Clearlake Riviera
Housing Structures in Clearlake Riviera
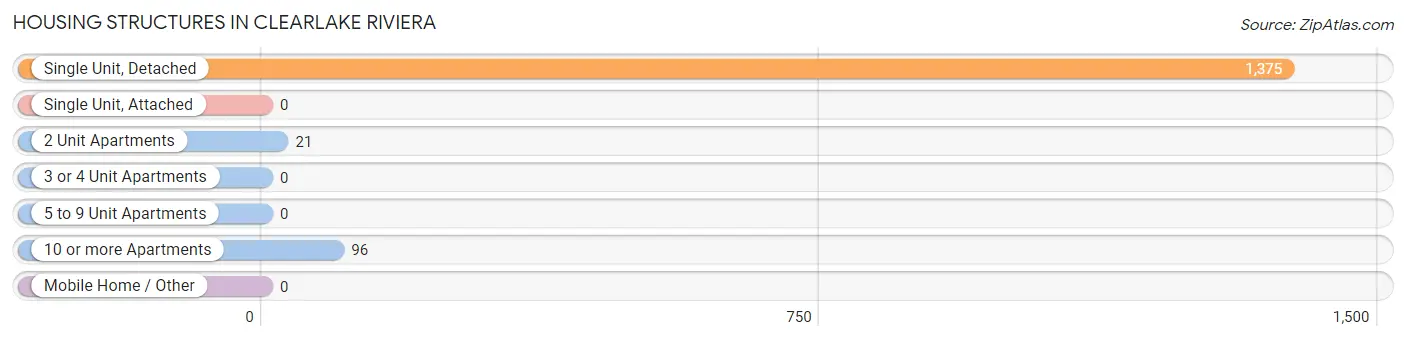
| Structure Type | # Housing Units | % Housing Units |
| Single Unit, Detached | 1,375 | 92.2% |
| Single Unit, Attached | 0 | 0.0% |
| 2 Unit Apartments | 21 | 1.4% |
| 3 or 4 Unit Apartments | 0 | 0.0% |
| 5 to 9 Unit Apartments | 0 | 0.0% |
| 10 or more Apartments | 96 | 6.4% |
| Mobile Home / Other | 0 | 0.0% |
| Total | 1,492 | 100.0% |
Housing Structures by Occupancy in Clearlake Riviera
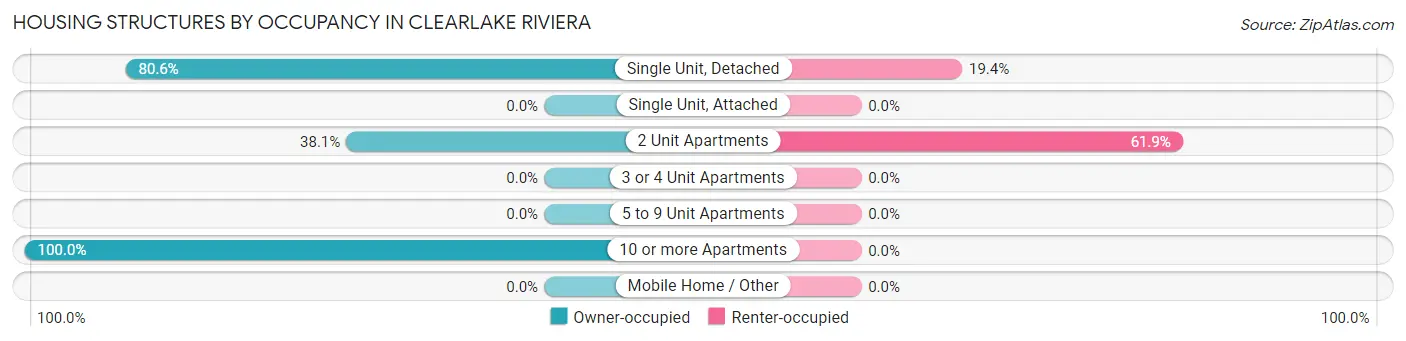
| Structure Type | Owner-occupied | Renter-occupied |
| Single Unit, Detached | 1,108 (80.6%) | 267 (19.4%) |
| Single Unit, Attached | 0 (0.0%) | 0 (0.0%) |
| 2 Unit Apartments | 8 (38.1%) | 13 (61.9%) |
| 3 or 4 Unit Apartments | 0 (0.0%) | 0 (0.0%) |
| 5 to 9 Unit Apartments | 0 (0.0%) | 0 (0.0%) |
| 10 or more Apartments | 96 (100.0%) | 0 (0.0%) |
| Mobile Home / Other | 0 (0.0%) | 0 (0.0%) |
| Total | 1,212 (81.2%) | 280 (18.8%) |
Housing Structures by Number of Rooms in Clearlake Riviera
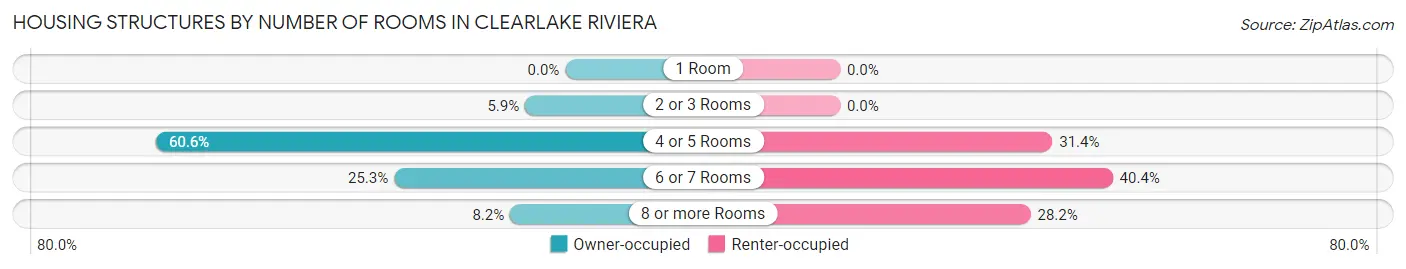
| Number of Rooms | Owner-occupied | Renter-occupied |
| 1 Room | 0 (0.0%) | 0 (0.0%) |
| 2 or 3 Rooms | 72 (5.9%) | 0 (0.0%) |
| 4 or 5 Rooms | 734 (60.6%) | 88 (31.4%) |
| 6 or 7 Rooms | 307 (25.3%) | 113 (40.4%) |
| 8 or more Rooms | 99 (8.2%) | 79 (28.2%) |
| Total | 1,212 (100.0%) | 280 (100.0%) |
Housing Structure by Heating Type in Clearlake Riviera
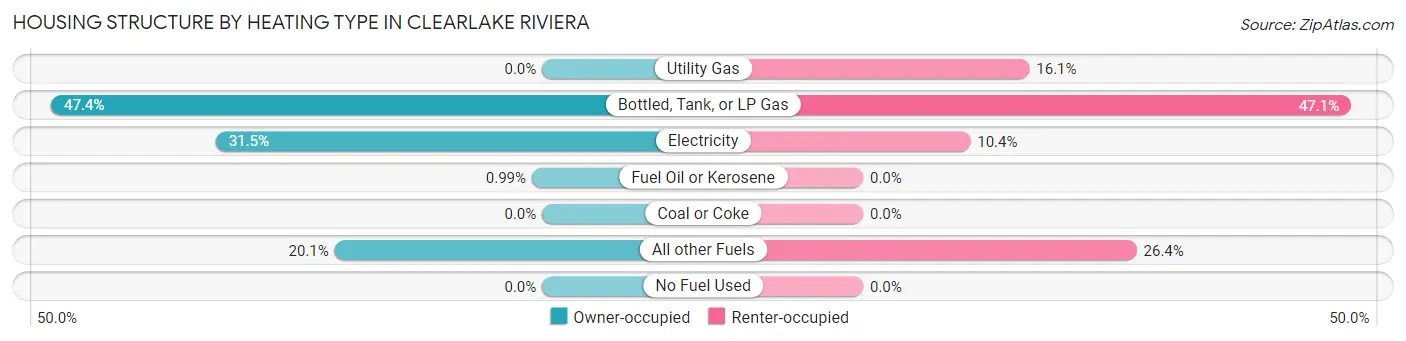
| Heating Type | Owner-occupied | Renter-occupied |
| Utility Gas | 0 (0.0%) | 45 (16.1%) |
| Bottled, Tank, or LP Gas | 575 (47.4%) | 132 (47.1%) |
| Electricity | 382 (31.5%) | 29 (10.4%) |
| Fuel Oil or Kerosene | 12 (1.0%) | 0 (0.0%) |
| Coal or Coke | 0 (0.0%) | 0 (0.0%) |
| All other Fuels | 243 (20.1%) | 74 (26.4%) |
| No Fuel Used | 0 (0.0%) | 0 (0.0%) |
| Total | 1,212 (100.0%) | 280 (100.0%) |
Household Vehicle Usage in Clearlake Riviera
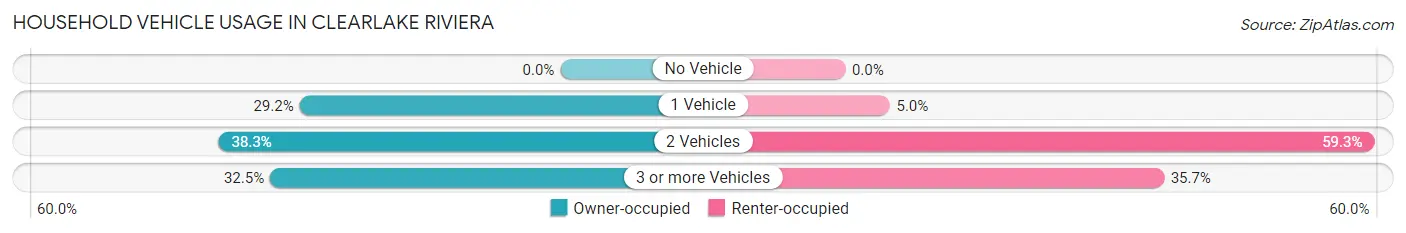
| Vehicles per Household | Owner-occupied | Renter-occupied |
| No Vehicle | 0 (0.0%) | 0 (0.0%) |
| 1 Vehicle | 354 (29.2%) | 14 (5.0%) |
| 2 Vehicles | 464 (38.3%) | 166 (59.3%) |
| 3 or more Vehicles | 394 (32.5%) | 100 (35.7%) |
| Total | 1,212 (100.0%) | 280 (100.0%) |
Real Estate & Mortgages in Clearlake Riviera
Real Estate and Mortgage Overview in Clearlake Riviera
| Characteristic | Without Mortgage | With Mortgage |
| Housing Units | 468 | 744 |
| Median Property Value | $263,500 | $293,400 |
| Median Household Income | $59,886 | $50 |
| Monthly Housing Costs | $579 | $0 |
| Real Estate Taxes | $2,000 | $20 |
Property Value by Mortgage Status in Clearlake Riviera
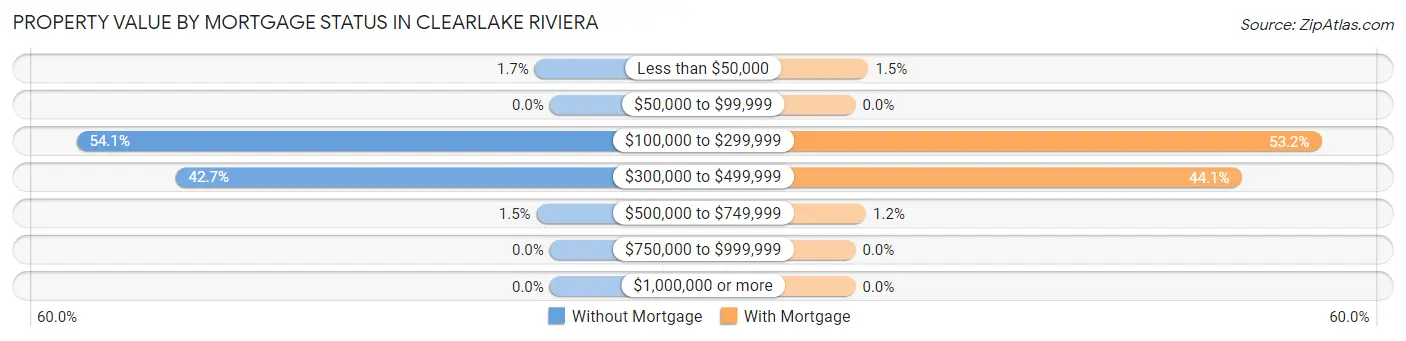
| Property Value | Without Mortgage | With Mortgage |
| Less than $50,000 | 8 (1.7%) | 11 (1.5%) |
| $50,000 to $99,999 | 0 (0.0%) | 0 (0.0%) |
| $100,000 to $299,999 | 253 (54.1%) | 396 (53.2%) |
| $300,000 to $499,999 | 200 (42.7%) | 328 (44.1%) |
| $500,000 to $749,999 | 7 (1.5%) | 9 (1.2%) |
| $750,000 to $999,999 | 0 (0.0%) | 0 (0.0%) |
| $1,000,000 or more | 0 (0.0%) | 0 (0.0%) |
| Total | 468 (100.0%) | 744 (100.0%) |
Household Income by Mortgage Status in Clearlake Riviera
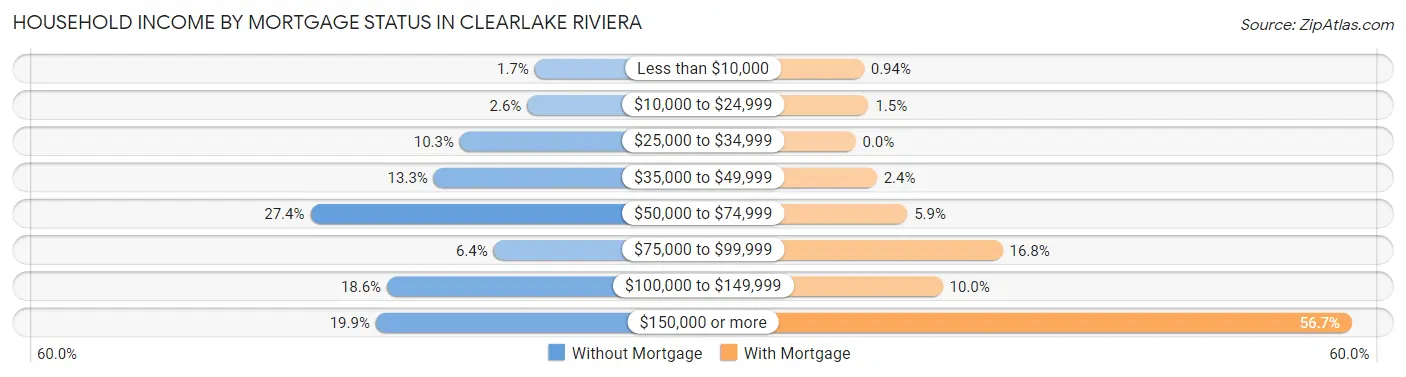
| Household Income | Without Mortgage | With Mortgage |
| Less than $10,000 | 8 (1.7%) | 7 (0.9%) |
| $10,000 to $24,999 | 12 (2.6%) | 11 (1.5%) |
| $25,000 to $34,999 | 48 (10.3%) | 0 (0.0%) |
| $35,000 to $49,999 | 62 (13.3%) | 18 (2.4%) |
| $50,000 to $74,999 | 128 (27.4%) | 44 (5.9%) |
| $75,000 to $99,999 | 30 (6.4%) | 125 (16.8%) |
| $100,000 to $149,999 | 87 (18.6%) | 74 (10.0%) |
| $150,000 or more | 93 (19.9%) | 422 (56.7%) |
| Total | 468 (100.0%) | 744 (100.0%) |
Property Value to Household Income Ratio in Clearlake Riviera
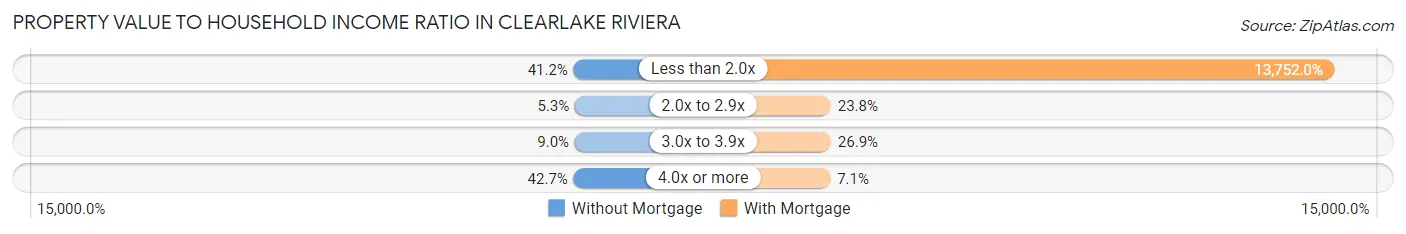
| Value-to-Income Ratio | Without Mortgage | With Mortgage |
| Less than 2.0x | 193 (41.2%) | 102,315 (13,752.0%) |
| 2.0x to 2.9x | 25 (5.3%) | 177 (23.8%) |
| 3.0x to 3.9x | 42 (9.0%) | 200 (26.9%) |
| 4.0x or more | 200 (42.7%) | 53 (7.1%) |
| Total | 468 (100.0%) | 744 (100.0%) |
Real Estate Taxes by Mortgage Status in Clearlake Riviera
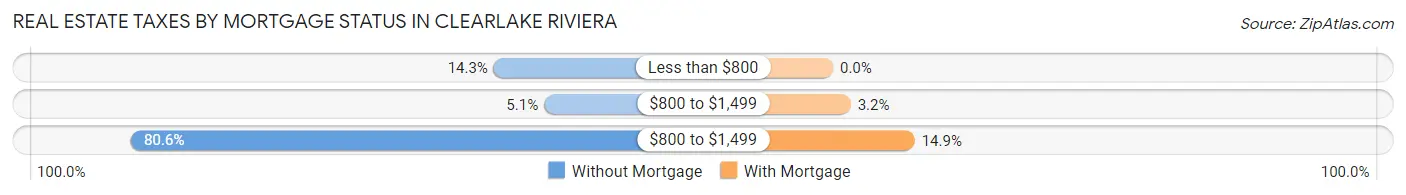
| Property Taxes | Without Mortgage | With Mortgage |
| Less than $800 | 67 (14.3%) | 0 (0.0%) |
| $800 to $1,499 | 24 (5.1%) | 24 (3.2%) |
| $800 to $1,499 | 377 (80.6%) | 111 (14.9%) |
| Total | 468 (100.0%) | 744 (100.0%) |
Health & Disability in Clearlake Riviera
Health Insurance Coverage by Age in Clearlake Riviera
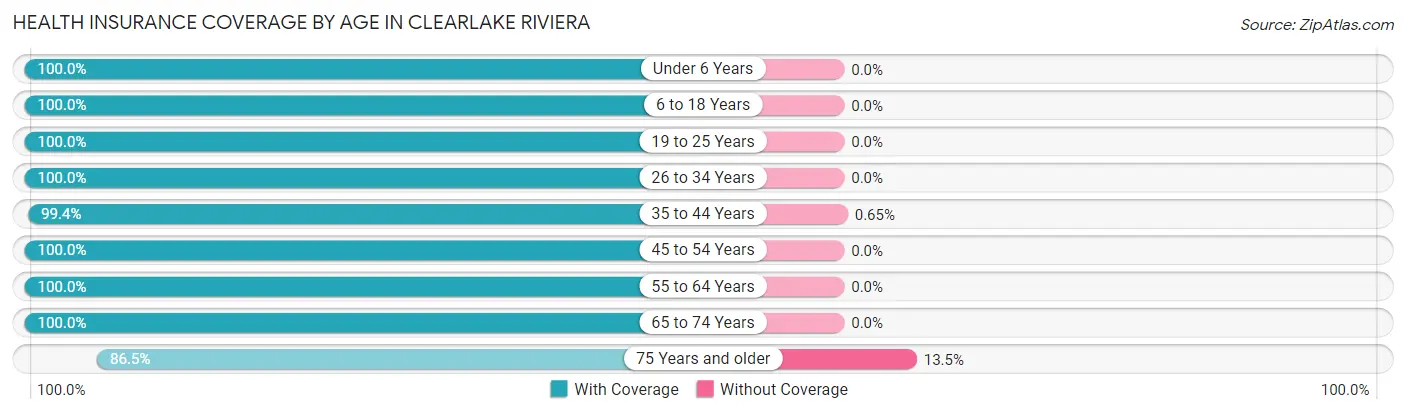
| Age Bracket | With Coverage | Without Coverage |
| Under 6 Years | 246 (100.0%) | 0 (0.0%) |
| 6 to 18 Years | 769 (100.0%) | 0 (0.0%) |
| 19 to 25 Years | 391 (100.0%) | 0 (0.0%) |
| 26 to 34 Years | 542 (100.0%) | 0 (0.0%) |
| 35 to 44 Years | 458 (99.4%) | 3 (0.6%) |
| 45 to 54 Years | 660 (100.0%) | 0 (0.0%) |
| 55 to 64 Years | 594 (100.0%) | 0 (0.0%) |
| 65 to 74 Years | 480 (100.0%) | 0 (0.0%) |
| 75 Years and older | 275 (86.5%) | 43 (13.5%) |
| Total | 4,415 (99.0%) | 46 (1.0%) |
Health Insurance Coverage by Citizenship Status in Clearlake Riviera
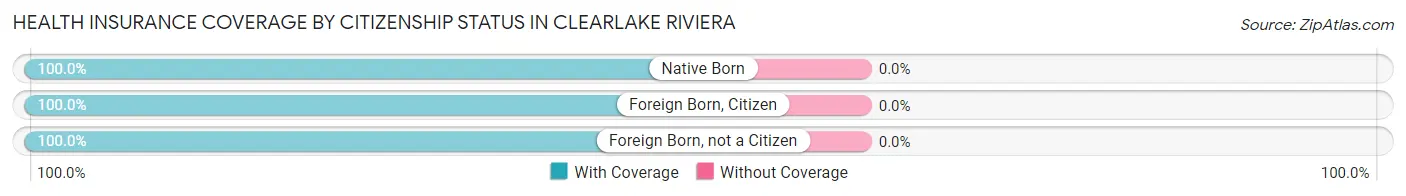
| Citizenship Status | With Coverage | Without Coverage |
| Native Born | 246 (100.0%) | 0 (0.0%) |
| Foreign Born, Citizen | 769 (100.0%) | 0 (0.0%) |
| Foreign Born, not a Citizen | 391 (100.0%) | 0 (0.0%) |
Health Insurance Coverage by Household Income in Clearlake Riviera
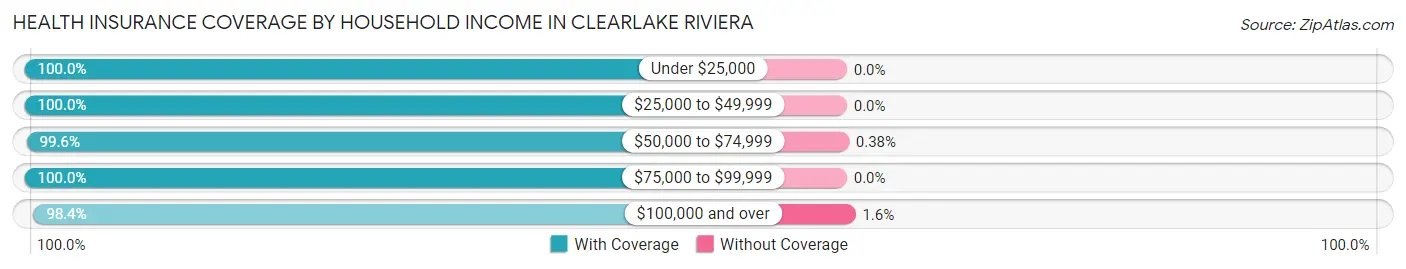
| Household Income | With Coverage | Without Coverage |
| Under $25,000 | 31 (100.0%) | 0 (0.0%) |
| $25,000 to $49,999 | 403 (100.0%) | 0 (0.0%) |
| $50,000 to $74,999 | 781 (99.6%) | 3 (0.4%) |
| $75,000 to $99,999 | 597 (100.0%) | 0 (0.0%) |
| $100,000 and over | 2,603 (98.4%) | 43 (1.6%) |
Public vs Private Health Insurance Coverage by Age in Clearlake Riviera
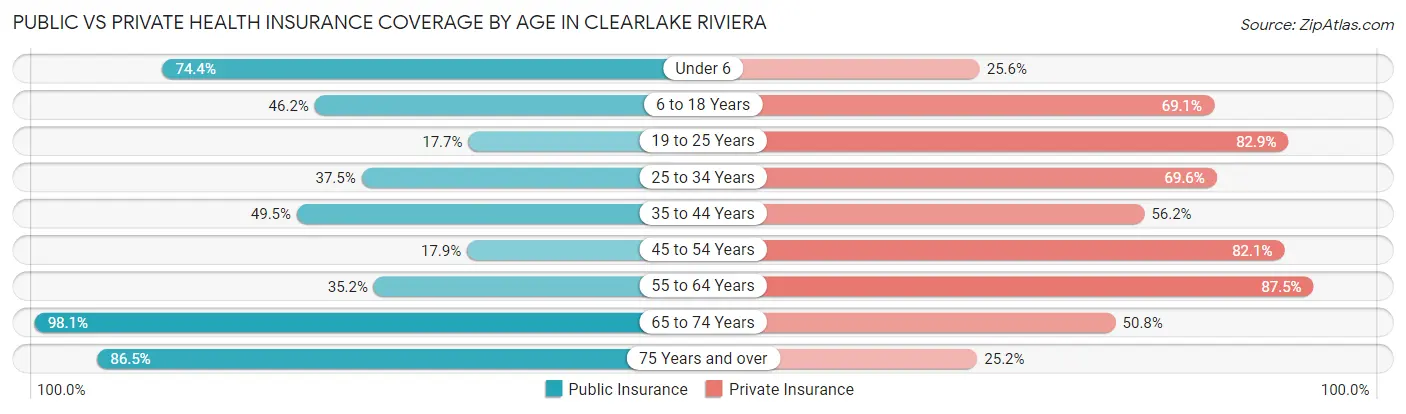
| Age Bracket | Public Insurance | Private Insurance |
| Under 6 | 183 (74.4%) | 63 (25.6%) |
| 6 to 18 Years | 355 (46.2%) | 531 (69.1%) |
| 19 to 25 Years | 69 (17.6%) | 324 (82.9%) |
| 25 to 34 Years | 203 (37.4%) | 377 (69.6%) |
| 35 to 44 Years | 228 (49.5%) | 259 (56.2%) |
| 45 to 54 Years | 118 (17.9%) | 542 (82.1%) |
| 55 to 64 Years | 209 (35.2%) | 520 (87.5%) |
| 65 to 74 Years | 471 (98.1%) | 244 (50.8%) |
| 75 Years and over | 275 (86.5%) | 80 (25.2%) |
| Total | 2,111 (47.3%) | 2,940 (65.9%) |
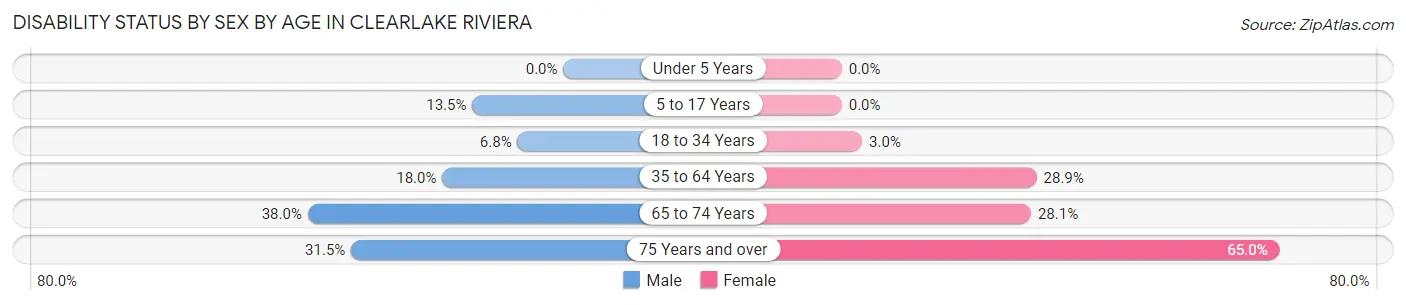
Disability Status by Sex by Age in Clearlake Riviera
| Age Bracket | Male | Female |
| Under 5 Years | 0 (0.0%) | 0 (0.0%) |
| 5 to 17 Years | 53 (13.5%) | 0 (0.0%) |
| 18 to 34 Years | 26 (6.8%) | 18 (3.0%) |
| 35 to 64 Years | 138 (18.0%) | 274 (28.9%) |
| 65 to 74 Years | 93 (38.0%) | 66 (28.1%) |
| 75 Years and over | 75 (31.5%) | 52 (65.0%) |
Disability Class by Sex by Age in Clearlake Riviera
Disability Class: Hearing Difficulty
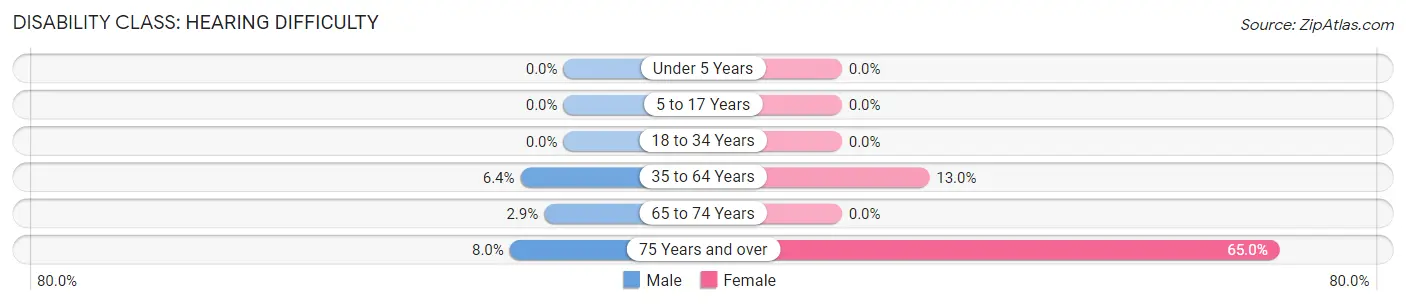
| Age Bracket | Male | Female |
| Under 5 Years | 0 (0.0%) | 0 (0.0%) |
| 5 to 17 Years | 0 (0.0%) | 0 (0.0%) |
| 18 to 34 Years | 0 (0.0%) | 0 (0.0%) |
| 35 to 64 Years | 49 (6.4%) | 123 (13.0%) |
| 65 to 74 Years | 7 (2.9%) | 0 (0.0%) |
| 75 Years and over | 19 (8.0%) | 52 (65.0%) |
Disability Class: Vision Difficulty
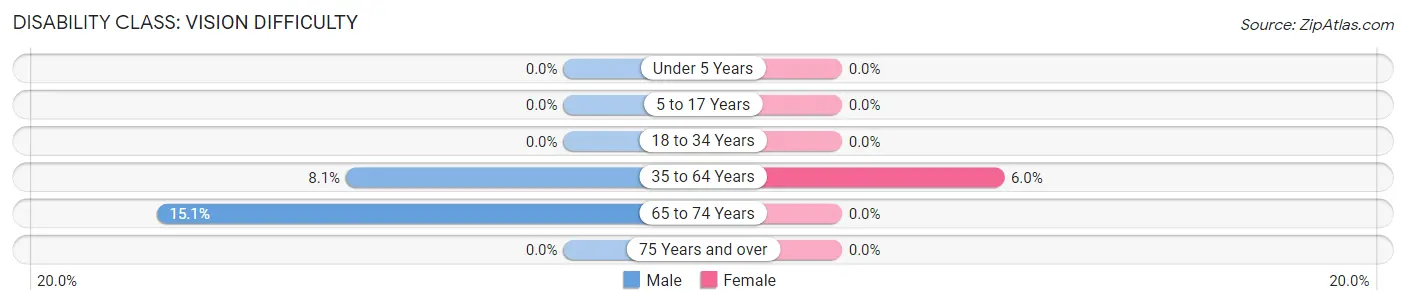
| Age Bracket | Male | Female |
| Under 5 Years | 0 (0.0%) | 0 (0.0%) |
| 5 to 17 Years | 0 (0.0%) | 0 (0.0%) |
| 18 to 34 Years | 0 (0.0%) | 0 (0.0%) |
| 35 to 64 Years | 62 (8.1%) | 57 (6.0%) |
| 65 to 74 Years | 37 (15.1%) | 0 (0.0%) |
| 75 Years and over | 0 (0.0%) | 0 (0.0%) |
Disability Class: Cognitive Difficulty
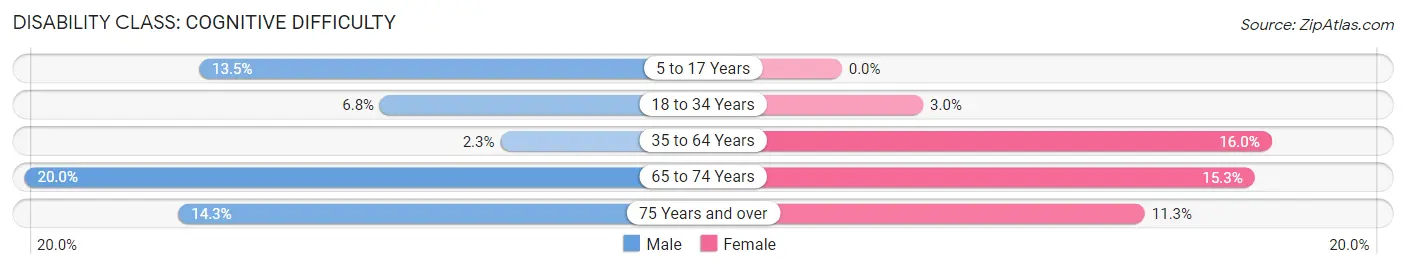
| Age Bracket | Male | Female |
| 5 to 17 Years | 53 (13.5%) | 0 (0.0%) |
| 18 to 34 Years | 26 (6.8%) | 18 (3.0%) |
| 35 to 64 Years | 18 (2.3%) | 151 (16.0%) |
| 65 to 74 Years | 49 (20.0%) | 36 (15.3%) |
| 75 Years and over | 34 (14.3%) | 9 (11.3%) |
Disability Class: Ambulatory Difficulty
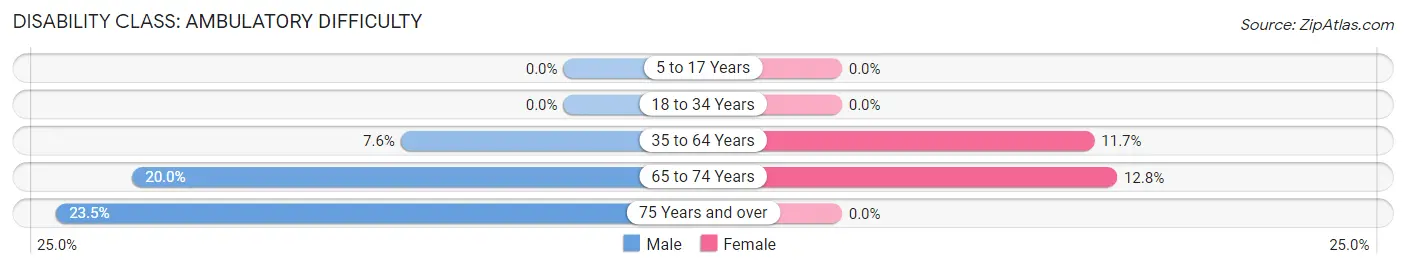
| Age Bracket | Male | Female |
| 5 to 17 Years | 0 (0.0%) | 0 (0.0%) |
| 18 to 34 Years | 0 (0.0%) | 0 (0.0%) |
| 35 to 64 Years | 58 (7.5%) | 111 (11.7%) |
| 65 to 74 Years | 49 (20.0%) | 30 (12.8%) |
| 75 Years and over | 56 (23.5%) | 0 (0.0%) |
Disability Class: Self-Care Difficulty
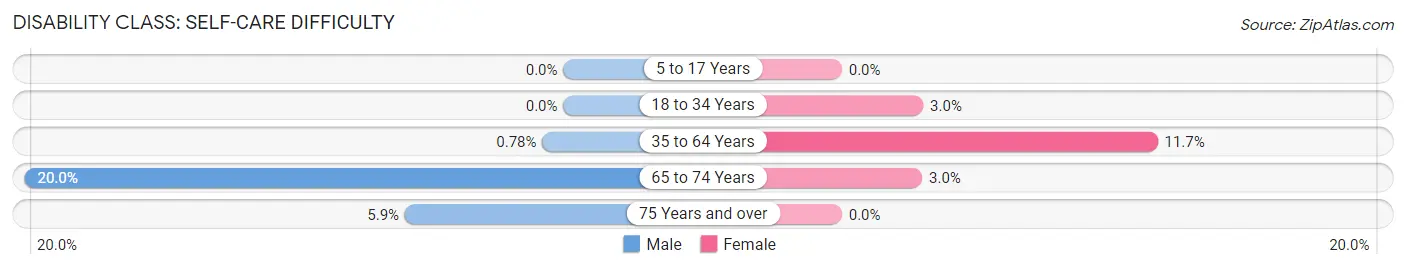
| Age Bracket | Male | Female |
| 5 to 17 Years | 0 (0.0%) | 0 (0.0%) |
| 18 to 34 Years | 0 (0.0%) | 18 (3.0%) |
| 35 to 64 Years | 6 (0.8%) | 111 (11.7%) |
| 65 to 74 Years | 49 (20.0%) | 7 (3.0%) |
| 75 Years and over | 14 (5.9%) | 0 (0.0%) |
Technology Access in Clearlake Riviera
Computing Device Access in Clearlake Riviera
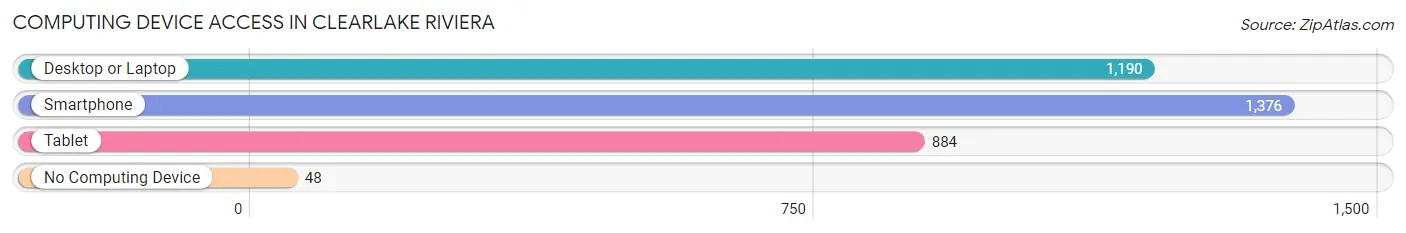
| Device Type | # Households | % Households |
| Desktop or Laptop | 1,190 | 79.8% |
| Smartphone | 1,376 | 92.2% |
| Tablet | 884 | 59.3% |
| No Computing Device | 48 | 3.2% |
| Total | 1,492 | 100.0% |
Internet Access in Clearlake Riviera
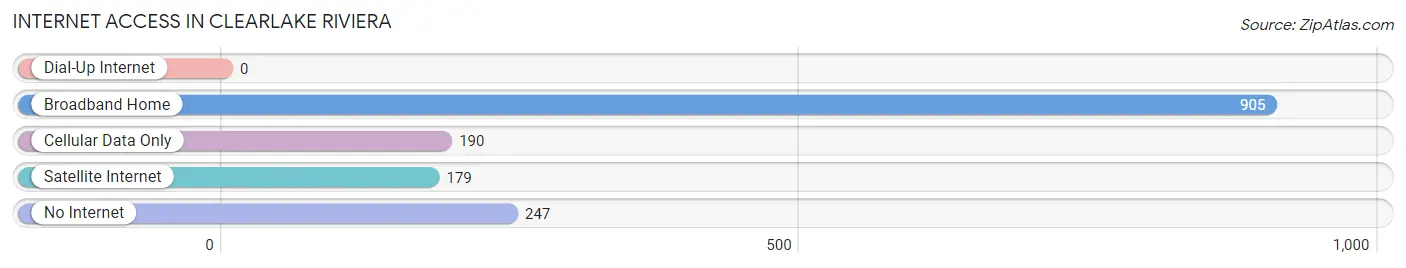
| Internet Type | # Households | % Households |
| Dial-Up Internet | 0 | 0.0% |
| Broadband Home | 905 | 60.7% |
| Cellular Data Only | 190 | 12.7% |
| Satellite Internet | 179 | 12.0% |
| No Internet | 247 | 16.6% |
| Total | 1,492 | 100.0% |
Clearlake Riviera Summary
Lake County, California is located in the northern part of the state, and is home to the city of Clearlake Riviera. Clearlake Riviera is a small city located on the shores of Clear Lake, the largest natural freshwater lake in California. The city is situated in the Clear Lake Valley, which is surrounded by the Mayacamas Mountains to the east and the Coastal Range to the west. The city is located approximately 90 miles north of San Francisco and is part of the greater San Francisco Bay Area.
History
The area that is now Clearlake Riviera has been inhabited for thousands of years by the Pomo people. The Pomo people were hunter-gatherers who lived off the land and the resources of Clear Lake. The first Europeans to settle in the area were Russian fur traders in the early 1800s. In 1845, the Mexican government granted the land to the settlers, and the area became known as Rancho de la Riviera.
In the late 1800s, the area began to attract settlers from the Midwest and East Coast. The settlers were drawn to the area by the abundance of natural resources, including timber, fish, and game. The settlers established small farms and ranches, and the area began to grow.
In the early 1900s, the area began to attract tourists who were drawn to the area by its natural beauty and recreational opportunities. The area was also known for its hot springs, which were believed to have healing properties. In the 1920s, the area was developed as a resort destination, and the city of Clearlake Riviera was established.
Geography
Clearlake Riviera is located in the Clear Lake Valley, which is surrounded by the Mayacamas Mountains to the east and the Coastal Range to the west. The city is situated on the shores of Clear Lake, the largest natural freshwater lake in California. The lake is approximately 20 miles long and 8 miles wide, and is fed by several small streams and creeks. The lake is a popular destination for fishing, boating, and other recreational activities.
The city of Clearlake Riviera is located approximately 90 miles north of San Francisco and is part of the greater San Francisco Bay Area. The city is located in the heart of wine country, and is surrounded by vineyards and wineries. The city is also home to several parks and recreational areas, including Clear Lake State Park, which offers camping, hiking, and other outdoor activities.
Economy
The economy of Clearlake Riviera is largely based on tourism and recreation. The city is a popular destination for visitors who are drawn to the area by its natural beauty and recreational opportunities. The city is also home to several wineries and vineyards, which attract visitors from around the world.
The city is also home to several manufacturing and technology companies, including a large solar panel manufacturing plant. The city is also home to several retail stores and restaurants, which provide employment opportunities for local residents.
Demographics
As of the 2010 census, the population of Clearlake Riviera was 8,935. The population is predominantly white (83.3%), with smaller percentages of Hispanic (7.2%), African American (2.3%), and Asian (2.2%) residents. The median household income in the city is $50,945, and the median home value is $220,000. The city has a high rate of homeownership, with 73.3% of residents owning their own homes. The city also has a high rate of educational attainment, with 87.3% of residents having at least a high school diploma.
Common Questions
What is Per Capita Income in Clearlake Riviera?
Per Capita income in Clearlake Riviera is $47,790.
What is the Median Family Income in Clearlake Riviera?
Median Family Income in Clearlake Riviera is $102,237.
What is the Median Household income in Clearlake Riviera?
Median Household Income in Clearlake Riviera is $93,750.
What is Income or Wage Gap in Clearlake Riviera?
Income or Wage Gap in Clearlake Riviera is 41.8%.
Women in Clearlake Riviera earn 58.2 cents for every dollar earned by a man.
What is Inequality or Gini Index in Clearlake Riviera?
Inequality or Gini Index in Clearlake Riviera is 0.46.
What is the Total Population of Clearlake Riviera?
Total Population of Clearlake Riviera is 4,461.
What is the Total Male Population of Clearlake Riviera?
Total Male Population of Clearlake Riviera is 2,181.
What is the Total Female Population of Clearlake Riviera?
Total Female Population of Clearlake Riviera is 2,280.
What is the Ratio of Males per 100 Females in Clearlake Riviera?
There are 95.66 Males per 100 Females in Clearlake Riviera.
What is the Ratio of Females per 100 Males in Clearlake Riviera?
There are 104.54 Females per 100 Males in Clearlake Riviera.
What is the Median Population Age in Clearlake Riviera?
Median Population Age in Clearlake Riviera is 37.9 Years.
What is the Average Family Size in Clearlake Riviera
Average Family Size in Clearlake Riviera is 3.6 People.
What is the Average Household Size in Clearlake Riviera
Average Household Size in Clearlake Riviera is 3.0 People.
How Large is the Labor Force in Clearlake Riviera?
There are 2,294 People in the Labor Forcein in Clearlake Riviera.
What is the Percentage of People in the Labor Force in Clearlake Riviera?
63.3% of People are in the Labor Force in Clearlake Riviera.
What is the Unemployment Rate in Clearlake Riviera?
Unemployment Rate in Clearlake Riviera is 11.5%.