Mokelumne Hill, CA Map & Demographics
Mokelumne Hill Map
Mokelumne Hill Overview
$42,415
PER CAPITA INCOME
$82,182
AVG FAMILY INCOME
$81,483
AVG HOUSEHOLD INCOME
0.29
INEQUALITY / GINI INDEX
808
TOTAL POPULATION
374
MALE POPULATION
434
FEMALE POPULATION
86.18
MALES / 100 FEMALES
116.04
FEMALES / 100 MALES
61.8
MEDIAN AGE
2.4
AVG FAMILY SIZE
2.2
AVG HOUSEHOLD SIZE
354
LABOR FORCE [ PEOPLE ]
45.3%
PERCENT IN LABOR FORCE
Mokelumne Hill Zip Codes
Mokelumne Hill Area Codes
Income in Mokelumne Hill
Income Overview in Mokelumne Hill
Per Capita Income in Mokelumne Hill is $42,415, while median incomes of families and households are $82,182 and $81,483 respectively.
| Characteristic | Number | Measure |
| Per Capita Income | 808 | $42,415 |
| Median Family Income | 304 | $82,182 |
| Mean Family Income | 304 | $104,428 |
| Median Household Income | 370 | $81,483 |
| Mean Household Income | 370 | $95,780 |
| Income Deficit | 304 | $0 |
| Wage / Income Gap (%) | 808 | 0.00% |
| Wage / Income Gap ($) | 808 | 100.00¢ per $1 |
| Gini / Inequality Index | 808 | 0.29 |
Earnings by Sex in Mokelumne Hill
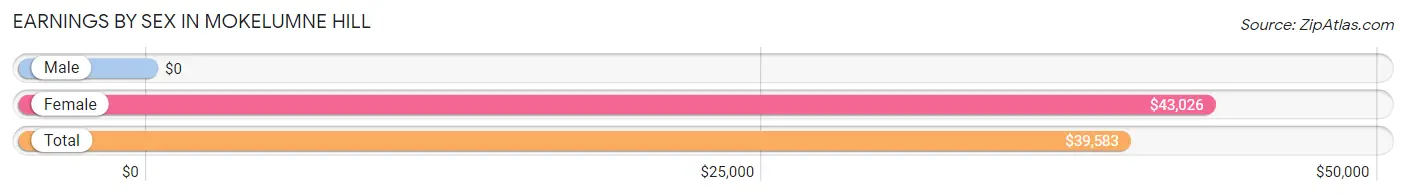
| Sex | Number | Average Earnings |
| Male | 177 (48.2%) | $0 |
| Female | 190 (51.8%) | $43,026 |
| Total | 367 (100.0%) | $39,583 |
Earnings by Sex by Income Bracket in Mokelumne Hill
The most common earnings brackets in Mokelumne Hill are $35,000 to $39,999 for men (81 | 45.8%) and $55,000 to $64,999 for women (63 | 33.2%).
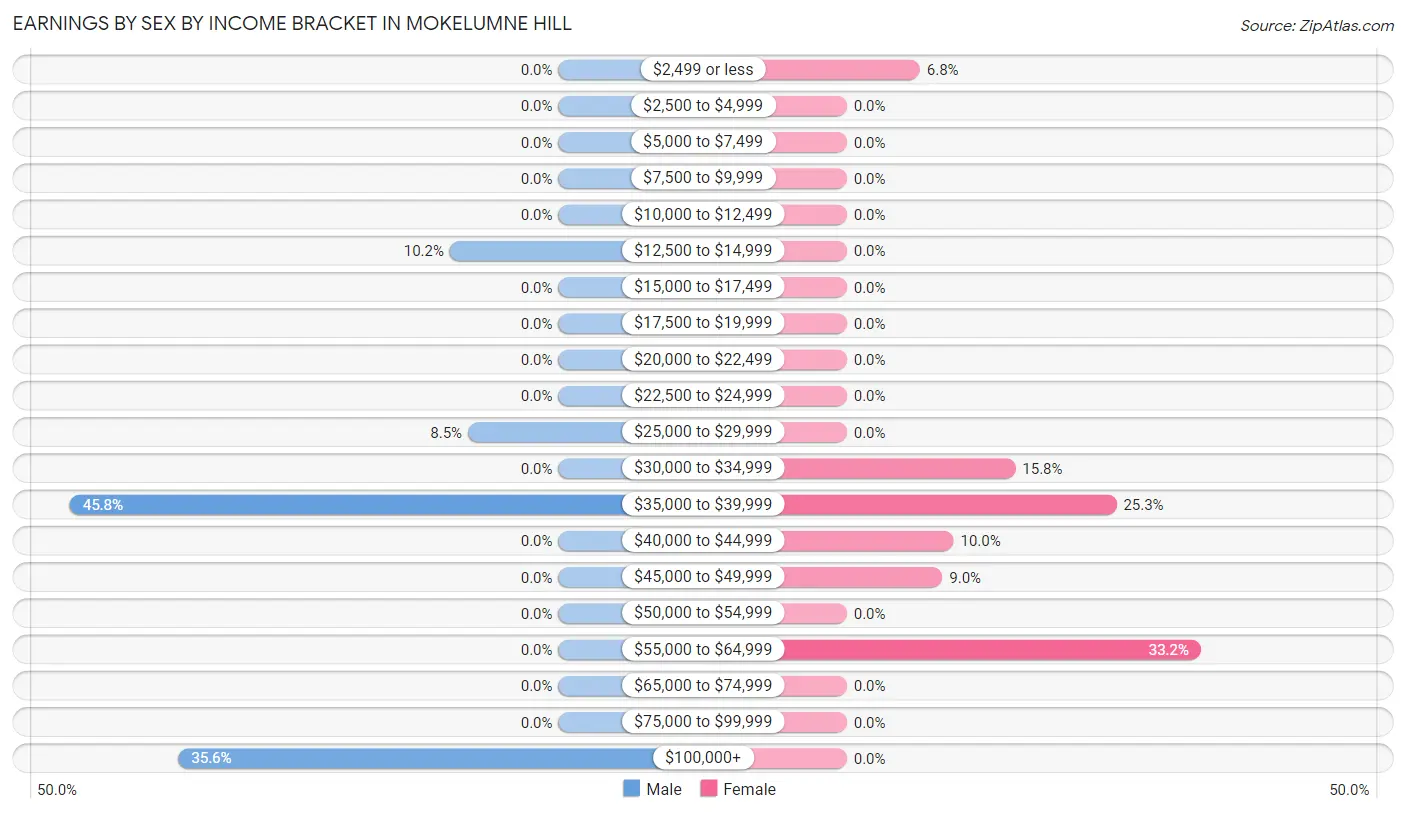
| Income | Male | Female |
| $2,499 or less | 0 (0.0%) | 13 (6.8%) |
| $2,500 to $4,999 | 0 (0.0%) | 0 (0.0%) |
| $5,000 to $7,499 | 0 (0.0%) | 0 (0.0%) |
| $7,500 to $9,999 | 0 (0.0%) | 0 (0.0%) |
| $10,000 to $12,499 | 0 (0.0%) | 0 (0.0%) |
| $12,500 to $14,999 | 18 (10.2%) | 0 (0.0%) |
| $15,000 to $17,499 | 0 (0.0%) | 0 (0.0%) |
| $17,500 to $19,999 | 0 (0.0%) | 0 (0.0%) |
| $20,000 to $22,499 | 0 (0.0%) | 0 (0.0%) |
| $22,500 to $24,999 | 0 (0.0%) | 0 (0.0%) |
| $25,000 to $29,999 | 15 (8.5%) | 0 (0.0%) |
| $30,000 to $34,999 | 0 (0.0%) | 30 (15.8%) |
| $35,000 to $39,999 | 81 (45.8%) | 48 (25.3%) |
| $40,000 to $44,999 | 0 (0.0%) | 19 (10.0%) |
| $45,000 to $49,999 | 0 (0.0%) | 17 (8.9%) |
| $50,000 to $54,999 | 0 (0.0%) | 0 (0.0%) |
| $55,000 to $64,999 | 0 (0.0%) | 63 (33.2%) |
| $65,000 to $74,999 | 0 (0.0%) | 0 (0.0%) |
| $75,000 to $99,999 | 0 (0.0%) | 0 (0.0%) |
| $100,000+ | 63 (35.6%) | 0 (0.0%) |
| Total | 177 (100.0%) | 190 (100.0%) |
Earnings by Sex by Educational Attainment in Mokelumne Hill
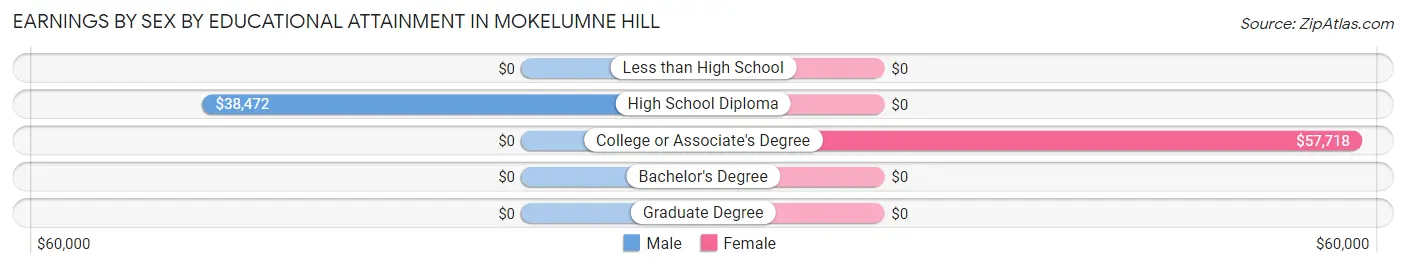
| Educational Attainment | Male Income | Female Income |
| Less than High School | - | - |
| High School Diploma | $38,472 | $0 |
| College or Associate's Degree | - | - |
| Bachelor's Degree | - | - |
| Graduate Degree | - | - |
| Total | - | - |
Family Income in Mokelumne Hill
Family Income Brackets in Mokelumne Hill
According to the Mokelumne Hill family income data, there are 137 families falling into the $75,000 to $99,999 income range, which is the most common income bracket and makes up 45.1% of all families.
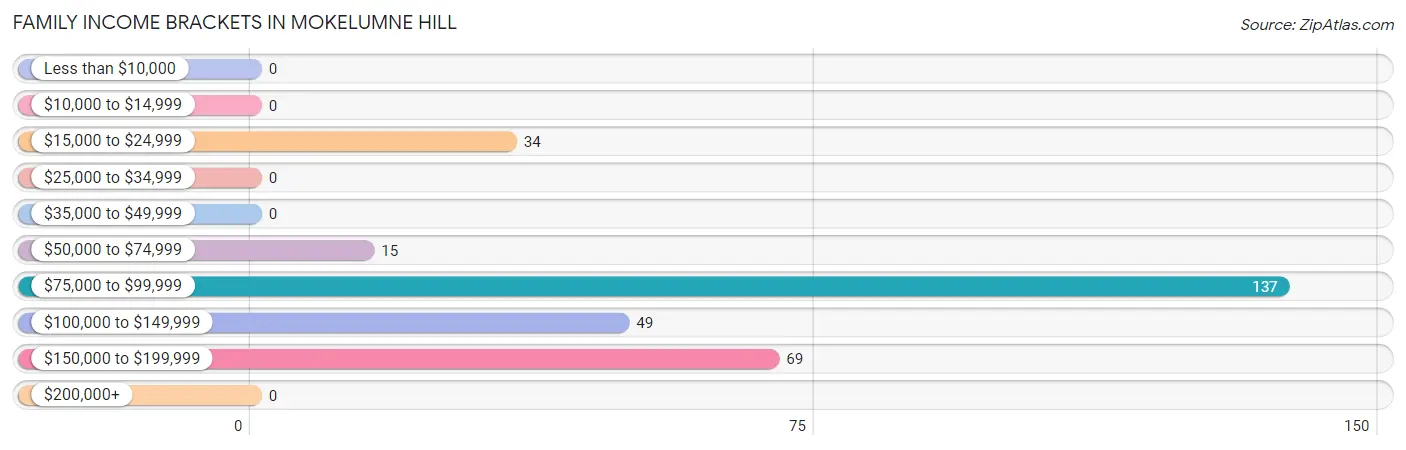
| Income Bracket | # Families | % Families |
| Less than $10,000 | 0 | 0.0% |
| $10,000 to $14,999 | 0 | 0.0% |
| $15,000 to $24,999 | 34 | 11.2% |
| $25,000 to $34,999 | 0 | 0.0% |
| $35,000 to $49,999 | 0 | 0.0% |
| $50,000 to $74,999 | 15 | 4.9% |
| $75,000 to $99,999 | 137 | 45.1% |
| $100,000 to $149,999 | 49 | 16.1% |
| $150,000 to $199,999 | 69 | 22.7% |
| $200,000+ | 0 | 0.0% |
Family Income by Famaliy Size in Mokelumne Hill
2-person families (230 | 75.7%) account for the highest median family income in Mokelumne Hill with $81,398 per family, while 2-person families (230 | 75.7%) have the highest median income of $40,699 per family member.
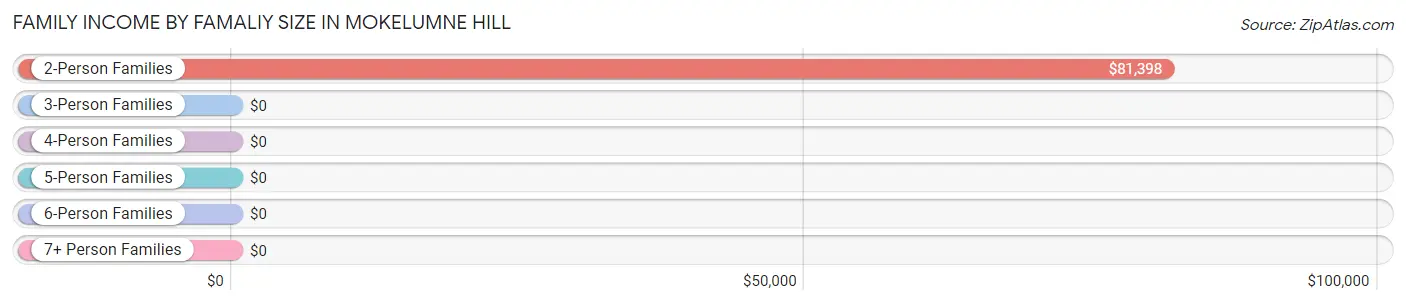
| Income Bracket | # Families | Median Income |
| 2-Person Families | 230 (75.7%) | $81,398 |
| 3-Person Families | 25 (8.2%) | $0 |
| 4-Person Families | 19 (6.2%) | $0 |
| 5-Person Families | 30 (9.9%) | $0 |
| 6-Person Families | 0 (0.0%) | $0 |
| 7+ Person Families | 0 (0.0%) | $0 |
| Total | 304 (100.0%) | $82,182 |
Family Income by Number of Earners in Mokelumne Hill
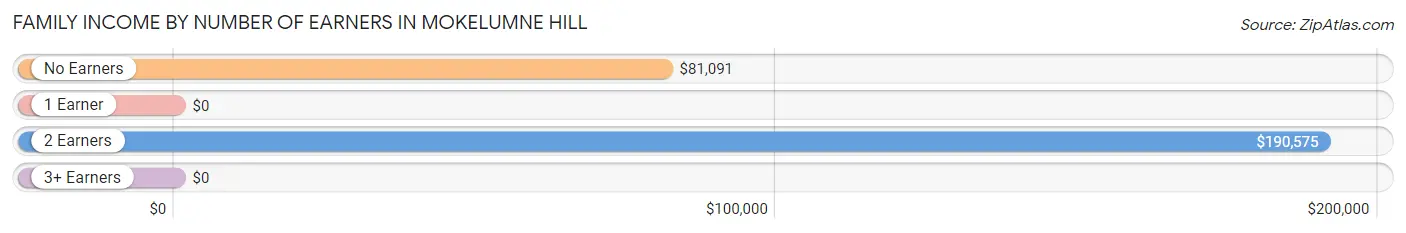
| Number of Earners | # Families | Median Income |
| No Earners | 171 (56.2%) | $81,091 |
| 1 Earner | 6 (2.0%) | $0 |
| 2 Earners | 97 (31.9%) | $190,575 |
| 3+ Earners | 30 (9.9%) | $0 |
| Total | 304 (100.0%) | $82,182 |
Household Income in Mokelumne Hill
Household Income Brackets in Mokelumne Hill
With 161 households falling in the category, the $75,000 to $99,999 income range is the most frequent in Mokelumne Hill, accounting for 43.5% of all households.
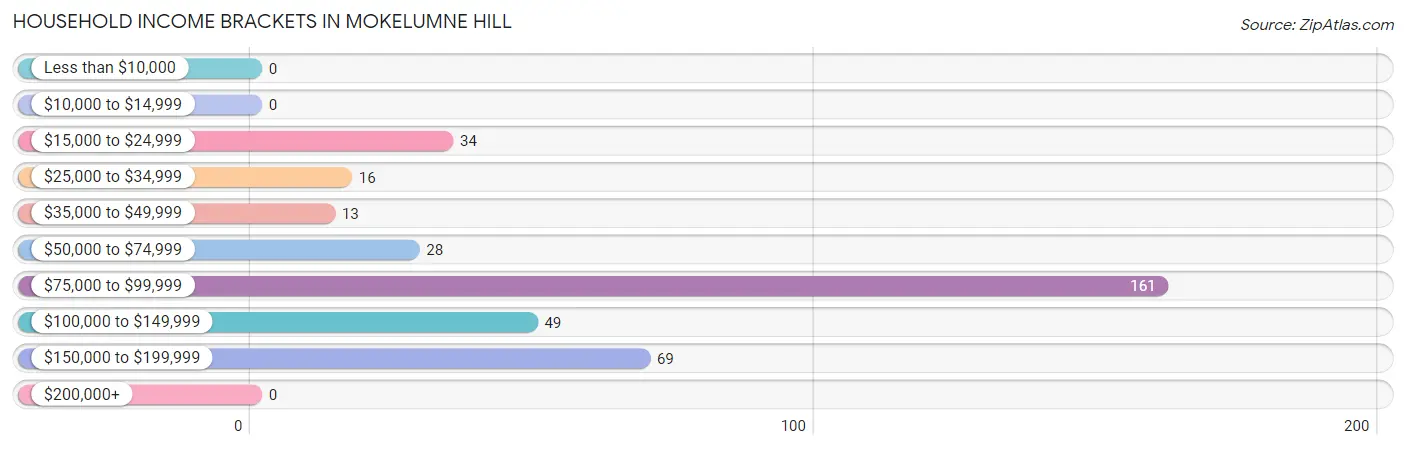
| Income Bracket | # Households | % Households |
| Less than $10,000 | 0 | 0.0% |
| $10,000 to $14,999 | 0 | 0.0% |
| $15,000 to $24,999 | 34 | 9.2% |
| $25,000 to $34,999 | 16 | 4.3% |
| $35,000 to $49,999 | 13 | 3.5% |
| $50,000 to $74,999 | 28 | 7.6% |
| $75,000 to $99,999 | 161 | 43.5% |
| $100,000 to $149,999 | 49 | 13.2% |
| $150,000 to $199,999 | 69 | 18.6% |
| $200,000+ | 0 | 0.0% |
Household Income by Householder Age in Mokelumne Hill
The median household income in Mokelumne Hill is $81,483, with the highest median household income of $56,731 found in the 65+ years age bracket for the primary householder. A total of 144 households (38.9%) fall into this category.
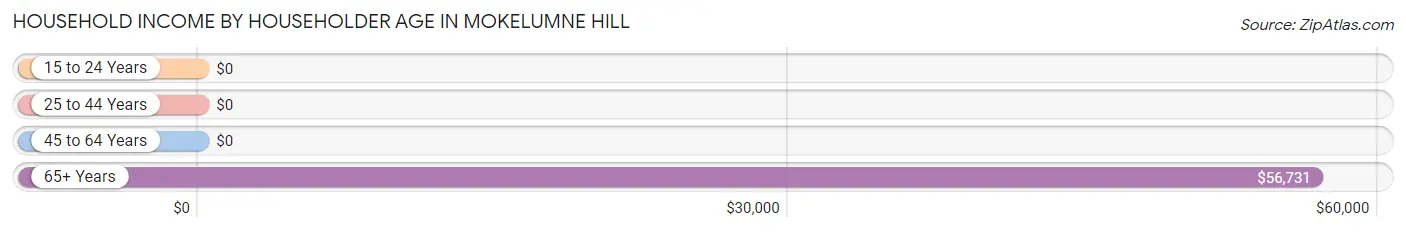
| Income Bracket | # Households | Median Income |
| 15 to 24 Years | 0 (0.0%) | $0 |
| 25 to 44 Years | 30 (8.1%) | $0 |
| 45 to 64 Years | 196 (53.0%) | $0 |
| 65+ Years | 144 (38.9%) | $56,731 |
| Total | 370 (100.0%) | $81,483 |
Poverty in Mokelumne Hill
Income Below Poverty by Sex and Age in Mokelumne Hill
| Age Bracket | Male | Female |
| Under 5 Years | 0 (0.0%) | 0 (0.0%) |
| 5 Years | 0 (0.0%) | 0 (0.0%) |
| 6 to 11 Years | 0 (0.0%) | 0 (0.0%) |
| 12 to 14 Years | 0 (0.0%) | 0 (0.0%) |
| 15 Years | 0 (0.0%) | 0 (0.0%) |
| 16 and 17 Years | 0 (0.0%) | 0 (0.0%) |
| 18 to 24 Years | 0 (0.0%) | 0 (0.0%) |
| 25 to 34 Years | 0 (0.0%) | 0 (0.0%) |
| 35 to 44 Years | 0 (0.0%) | 0 (0.0%) |
| 45 to 54 Years | 0 (0.0%) | 0 (0.0%) |
| 55 to 64 Years | 0 (0.0%) | 0 (0.0%) |
| 65 to 74 Years | 0 (0.0%) | 0 (0.0%) |
| 75 Years and over | 0 (0.0%) | 0 (0.0%) |
| Total | 0 (0.0%) | 0 (0.0%) |
Income Above Poverty by Sex and Age in Mokelumne Hill
According to the poverty statistics in Mokelumne Hill, males aged under 5 years and females aged 35 to 44 years are the age groups that are most secure financially, with 100.0% of males and 100.0% of females in these age groups living above the poverty line.
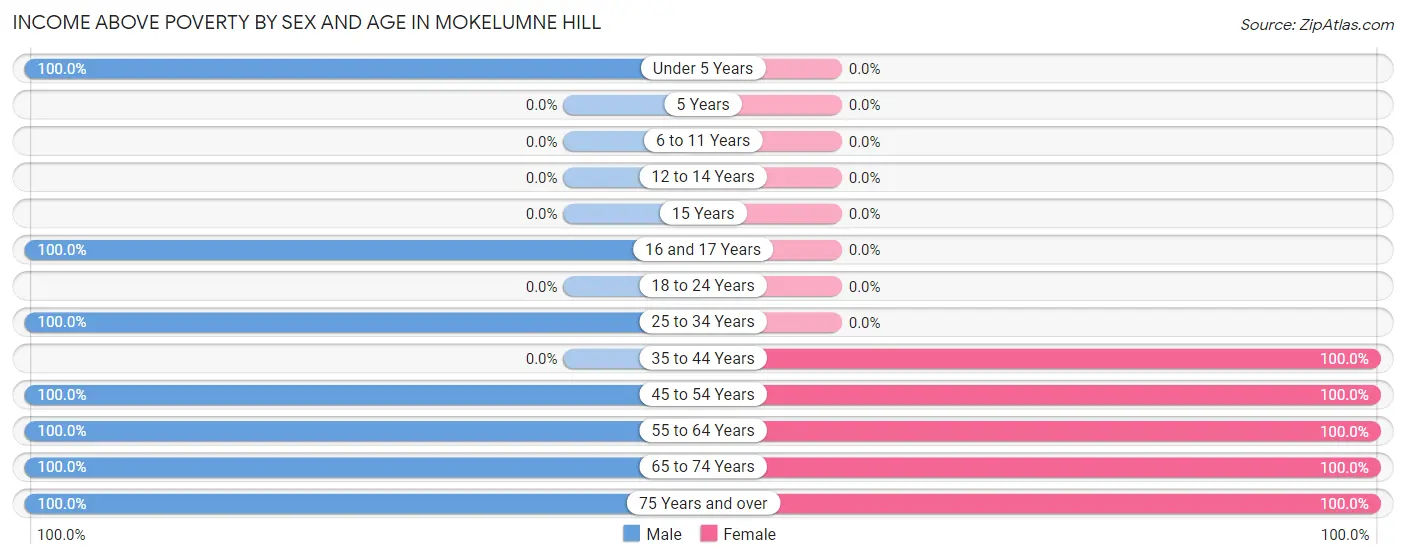
| Age Bracket | Male | Female |
| Under 5 Years | 26 (100.0%) | 0 (0.0%) |
| 5 Years | 0 (0.0%) | 0 (0.0%) |
| 6 to 11 Years | 0 (0.0%) | 0 (0.0%) |
| 12 to 14 Years | 0 (0.0%) | 0 (0.0%) |
| 15 Years | 0 (0.0%) | 0 (0.0%) |
| 16 and 17 Years | 40 (100.0%) | 0 (0.0%) |
| 18 to 24 Years | 0 (0.0%) | 0 (0.0%) |
| 25 to 34 Years | 60 (100.0%) | 0 (0.0%) |
| 35 to 44 Years | 0 (0.0%) | 65 (100.0%) |
| 45 to 54 Years | 54 (100.0%) | 36 (100.0%) |
| 55 to 64 Years | 80 (100.0%) | 181 (100.0%) |
| 65 to 74 Years | 108 (100.0%) | 104 (100.0%) |
| 75 Years and over | 6 (100.0%) | 48 (100.0%) |
| Total | 374 (100.0%) | 434 (100.0%) |
Income Below Poverty Among Married-Couple Families in Mokelumne Hill
| Children | Above Poverty | Below Poverty |
| No Children | 274 (100.0%) | 0 (0.0%) |
| 1 or 2 Children | 30 (100.0%) | 0 (0.0%) |
| 3 or 4 Children | 0 (0.0%) | 0 (0.0%) |
| 5 or more Children | 0 (0.0%) | 0 (0.0%) |
| Total | 304 (100.0%) | 0 (0.0%) |
Income Below Poverty Among Single-Parent Households in Mokelumne Hill
| Children | Single Father | Single Mother |
| No Children | 0 (0.0%) | 0 (0.0%) |
| 1 or 2 Children | 0 (0.0%) | 0 (0.0%) |
| 3 or 4 Children | 0 (0.0%) | 0 (0.0%) |
| 5 or more Children | 0 (0.0%) | 0 (0.0%) |
| Total | 0 (0.0%) | 0 (0.0%) |
Income Below Poverty Among Married-Couple vs Single-Parent Households in Mokelumne Hill
| Children | Married-Couple Families | Single-Parent Households |
| No Children | 0 (0.0%) | 0 (0.0%) |
| 1 or 2 Children | 0 (0.0%) | 0 (0.0%) |
| 3 or 4 Children | 0 (0.0%) | 0 (0.0%) |
| 5 or more Children | 0 (0.0%) | 0 (0.0%) |
| Total | 0 (0.0%) | 0 (0.0%) |
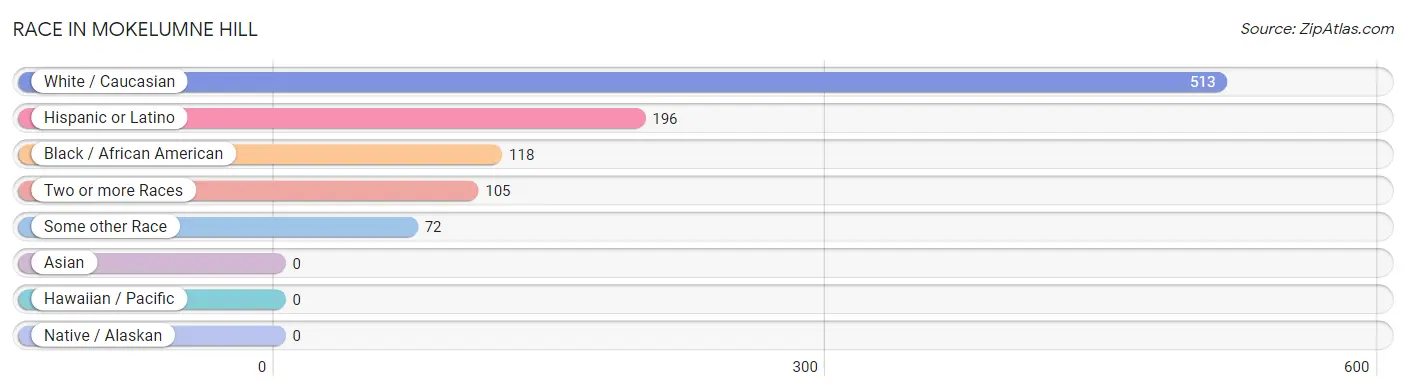
Race in Mokelumne Hill
The most populous races in Mokelumne Hill are White / Caucasian (513 | 63.5%), Hispanic or Latino (196 | 24.3%), and Black / African American (118 | 14.6%).
| Race | # Population | % Population |
| Asian | 0 | 0.0% |
| Black / African American | 118 | 14.6% |
| Hawaiian / Pacific | 0 | 0.0% |
| Hispanic or Latino | 196 | 24.3% |
| Native / Alaskan | 0 | 0.0% |
| White / Caucasian | 513 | 63.5% |
| Two or more Races | 105 | 13.0% |
| Some other Race | 72 | 8.9% |
| Total | 808 | 100.0% |
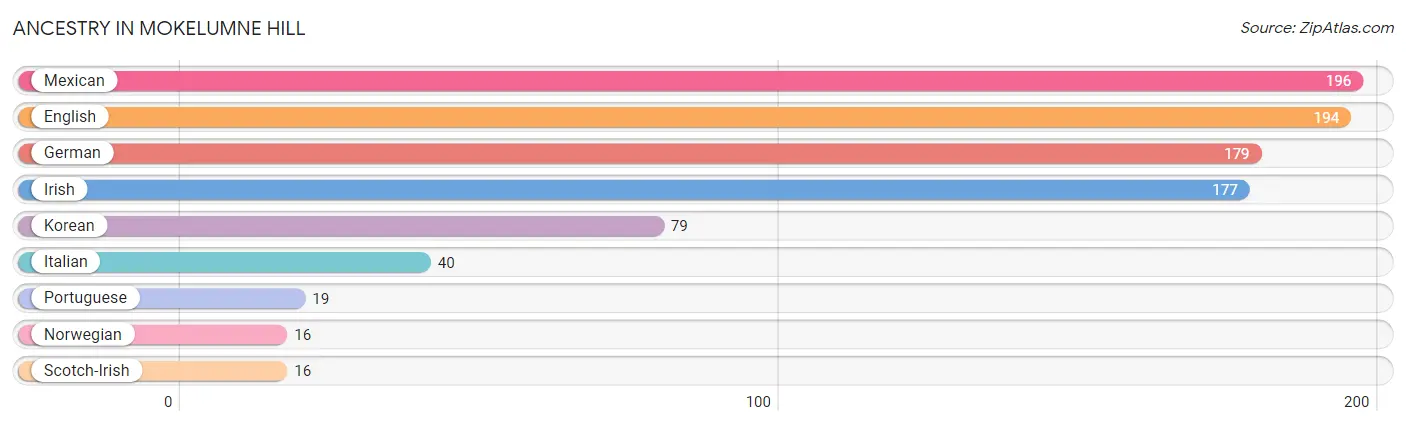
Ancestry in Mokelumne Hill
The most populous ancestries reported in Mokelumne Hill are Mexican (196 | 24.3%), English (194 | 24.0%), German (179 | 22.2%), Irish (177 | 21.9%), and Korean (79 | 9.8%), together accounting for 102.1% of all Mokelumne Hill residents.
| Ancestry | # Population | % Population |
| English | 194 | 24.0% |
| German | 179 | 22.2% |
| Irish | 177 | 21.9% |
| Italian | 40 | 5.0% |
| Korean | 79 | 9.8% |
| Mexican | 196 | 24.3% |
| Norwegian | 16 | 2.0% |
| Portuguese | 19 | 2.4% |
| Scotch-Irish | 16 | 2.0% | View All 9 Rows |
Immigrants in Mokelumne Hill

| Immigration Origin | # Population | % Population | View All 0 Rows |
Sex and Age in Mokelumne Hill
Sex and Age in Mokelumne Hill
The most populous age groups in Mokelumne Hill are 70 to 74 Years (96 | 25.7%) for men and 60 to 64 Years (118 | 27.2%) for women.
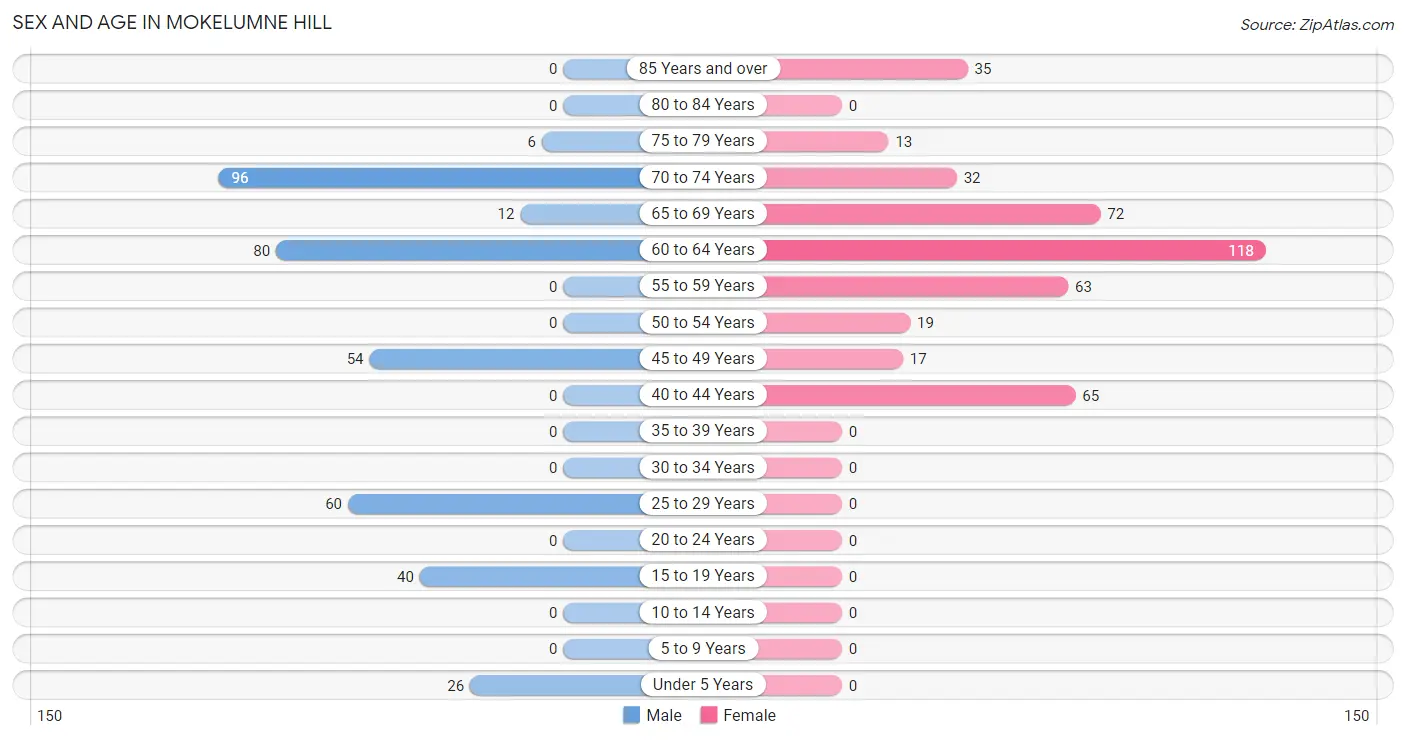
| Age Bracket | Male | Female |
| Under 5 Years | 26 (7.0%) | 0 (0.0%) |
| 5 to 9 Years | 0 (0.0%) | 0 (0.0%) |
| 10 to 14 Years | 0 (0.0%) | 0 (0.0%) |
| 15 to 19 Years | 40 (10.7%) | 0 (0.0%) |
| 20 to 24 Years | 0 (0.0%) | 0 (0.0%) |
| 25 to 29 Years | 60 (16.0%) | 0 (0.0%) |
| 30 to 34 Years | 0 (0.0%) | 0 (0.0%) |
| 35 to 39 Years | 0 (0.0%) | 0 (0.0%) |
| 40 to 44 Years | 0 (0.0%) | 65 (15.0%) |
| 45 to 49 Years | 54 (14.4%) | 17 (3.9%) |
| 50 to 54 Years | 0 (0.0%) | 19 (4.4%) |
| 55 to 59 Years | 0 (0.0%) | 63 (14.5%) |
| 60 to 64 Years | 80 (21.4%) | 118 (27.2%) |
| 65 to 69 Years | 12 (3.2%) | 72 (16.6%) |
| 70 to 74 Years | 96 (25.7%) | 32 (7.4%) |
| 75 to 79 Years | 6 (1.6%) | 13 (3.0%) |
| 80 to 84 Years | 0 (0.0%) | 0 (0.0%) |
| 85 Years and over | 0 (0.0%) | 35 (8.1%) |
| Total | 374 (100.0%) | 434 (100.0%) |
Families and Households in Mokelumne Hill
Median Family Size in Mokelumne Hill
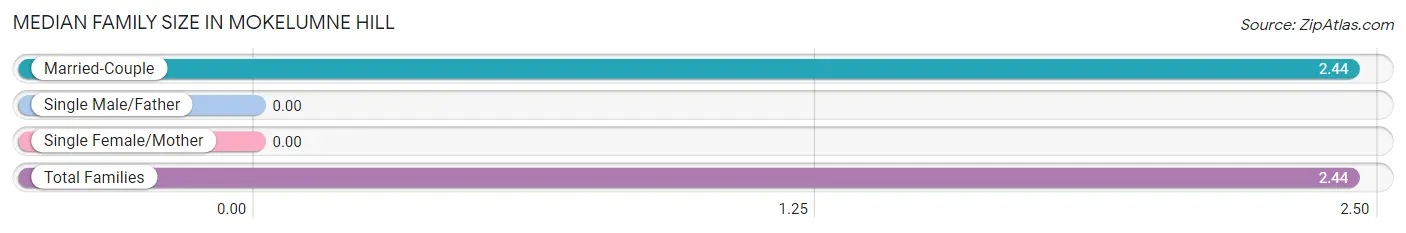
| Family Type | # Families | Family Size |
| Married-Couple | 304 (100.0%) | 2.44 |
| Single Male/Father | 0 (0.0%) | - |
| Single Female/Mother | 0 (0.0%) | - |
| Total Families | 304 (100.0%) | 2.44 |
Median Household Size in Mokelumne Hill
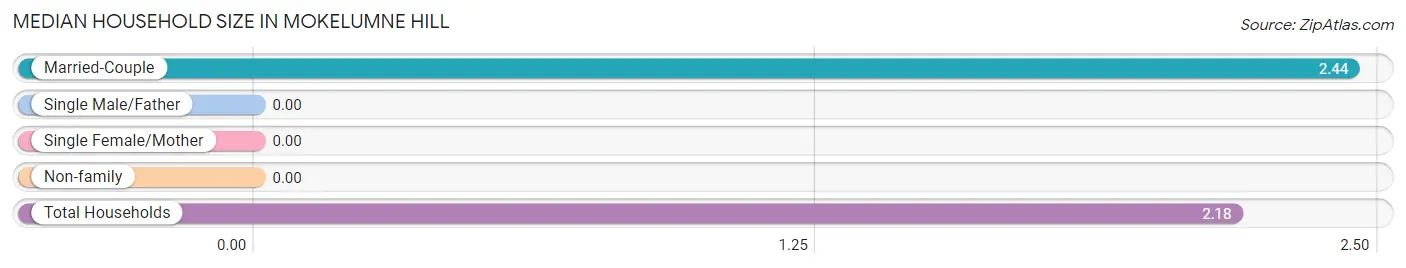
| Household Type | # Households | Household Size |
| Married-Couple | 304 (82.2%) | 2.44 |
| Single Male/Father | 0 (0.0%) | - |
| Single Female/Mother | 0 (0.0%) | - |
| Non-family | 66 (17.8%) | - |
| Total Households | 370 (100.0%) | 2.18 |
Household Size by Marriage Status in Mokelumne Hill
Out of a total of 370 households in Mokelumne Hill, 304 (82.2%) are family households, while 66 (17.8%) are nonfamily households. The most numerous type of family households are 2-person households, comprising 230, and the most common type of nonfamily households are 1-person households, comprising 66.
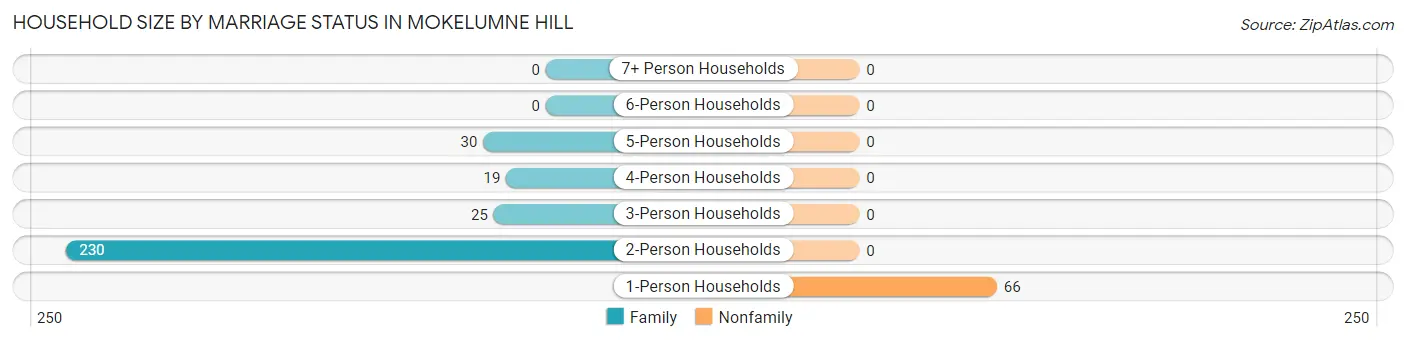
| Household Size | Family Households | Nonfamily Households |
| 1-Person Households | - | 66 (17.8%) |
| 2-Person Households | 230 (62.2%) | 0 (0.0%) |
| 3-Person Households | 25 (6.8%) | 0 (0.0%) |
| 4-Person Households | 19 (5.1%) | 0 (0.0%) |
| 5-Person Households | 30 (8.1%) | 0 (0.0%) |
| 6-Person Households | 0 (0.0%) | 0 (0.0%) |
| 7+ Person Households | 0 (0.0%) | 0 (0.0%) |
| Total | 304 (82.2%) | 66 (17.8%) |
Female Fertility in Mokelumne Hill
Fertility by Age in Mokelumne Hill
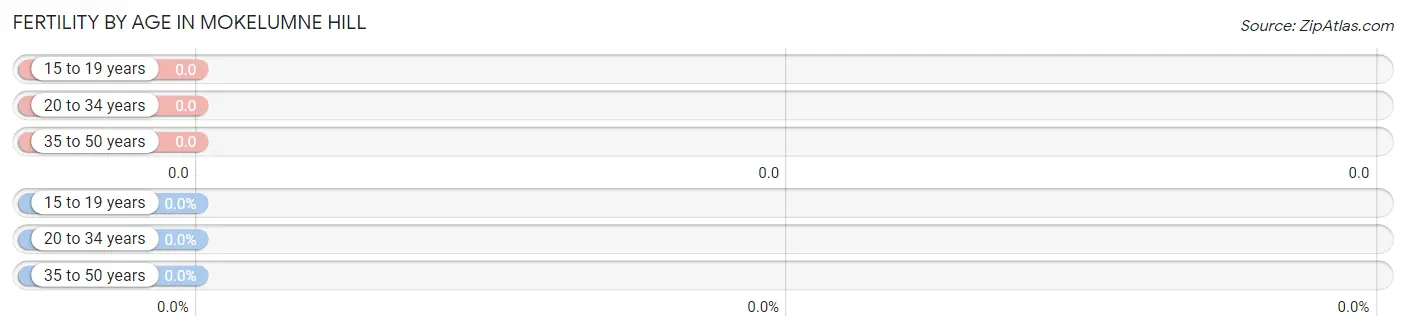
| Age Bracket | Women with Births | Births / 1,000 Women |
| 15 to 19 years | 0 (0.0%) | 0.0 |
| 20 to 34 years | 0 (0.0%) | 0.0 |
| 35 to 50 years | 0 (0.0%) | 0.0 |
| Total | 0 (0.0%) | 0.0 |
Fertility by Age by Marriage Status in Mokelumne Hill
| Age Bracket | Married | Unmarried |
| 15 to 19 years | 0 (0.0%) | 0 (0.0%) |
| 20 to 34 years | 0 (0.0%) | 0 (0.0%) |
| 35 to 50 years | 0 (0.0%) | 0 (0.0%) |
| Total | 0 (0.0%) | 0 (0.0%) |
Fertility by Education in Mokelumne Hill
| Educational Attainment | Women with Births | Births / 1,000 Women |
| Less than High School | 0 (0.0%) | 0.0 |
| High School Diploma | 0 (0.0%) | 0.0 |
| College or Associate's Degree | 0 (0.0%) | 0.0 |
| Bachelor's Degree | 0 (0.0%) | 0.0 |
| Graduate Degree | 0 (0.0%) | 0.0 |
| Total | 0 (0.0%) | 0.0 |
Fertility by Education by Marriage Status in Mokelumne Hill
| Educational Attainment | Married | Unmarried |
| Less than High School | 0 (0.0%) | 0 (0.0%) |
| High School Diploma | 0 (0.0%) | 0 (0.0%) |
| College or Associate's Degree | 0 (0.0%) | 0 (0.0%) |
| Bachelor's Degree | 0 (0.0%) | 0 (0.0%) |
| Graduate Degree | 0 (0.0%) | 0 (0.0%) |
| Total | 0 (0.0%) | 0 (0.0%) |
Employment Characteristics in Mokelumne Hill
Employment by Class of Employer in Mokelumne Hill
Among the 354 employed individuals in Mokelumne Hill, private company employees (203 | 57.3%), self-employed (not incorporated) (102 | 28.8%), and local government employees (32 | 9.0%) make up the most common classes of employment.
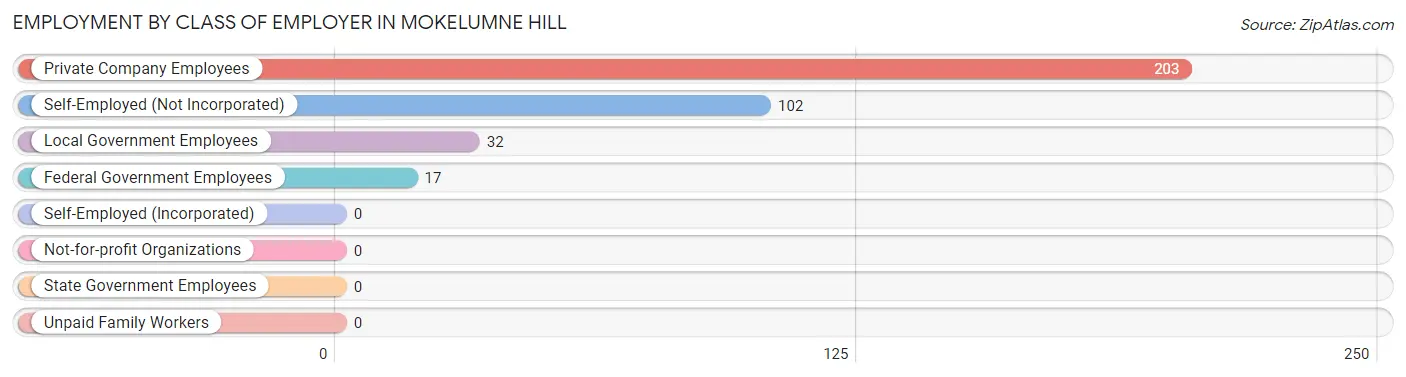
| Employer Class | # Employees | % Employees |
| Private Company Employees | 203 | 57.3% |
| Self-Employed (Incorporated) | 0 | 0.0% |
| Self-Employed (Not Incorporated) | 102 | 28.8% |
| Not-for-profit Organizations | 0 | 0.0% |
| Local Government Employees | 32 | 9.0% |
| State Government Employees | 0 | 0.0% |
| Federal Government Employees | 17 | 4.8% |
| Unpaid Family Workers | 0 | 0.0% |
| Total | 354 | 100.0% |
Employment Status by Age in Mokelumne Hill
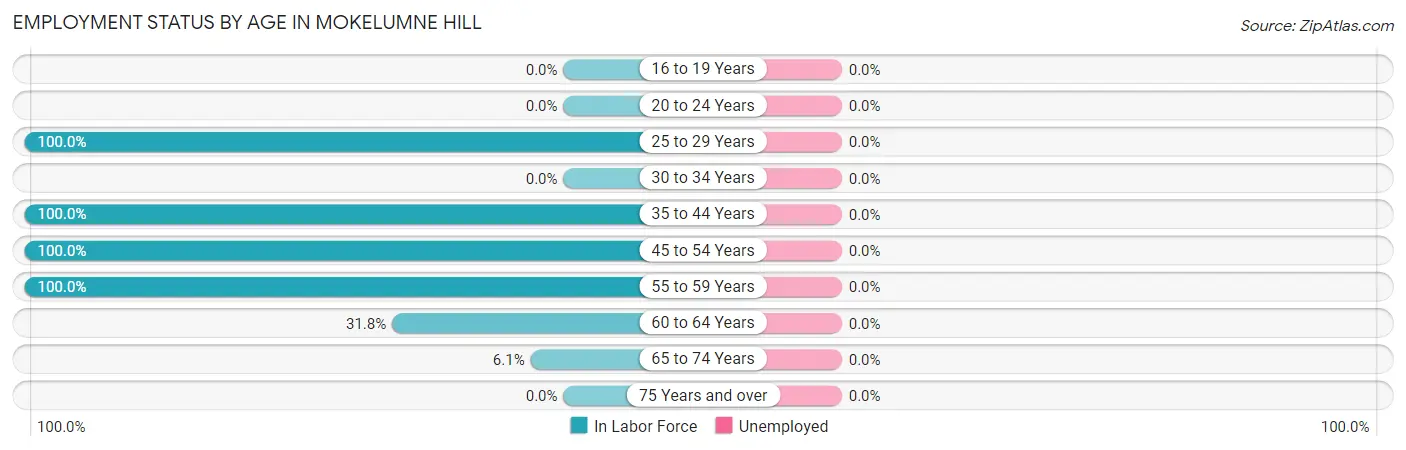
| Age Bracket | In Labor Force | Unemployed |
| 16 to 19 Years | 0 (0.0%) | 0 (0.0%) |
| 20 to 24 Years | 0 (0.0%) | 0 (0.0%) |
| 25 to 29 Years | 60 (100.0%) | 0 (0.0%) |
| 30 to 34 Years | 0 (0.0%) | 0 (0.0%) |
| 35 to 44 Years | 65 (100.0%) | 0 (0.0%) |
| 45 to 54 Years | 90 (100.0%) | 0 (0.0%) |
| 55 to 59 Years | 63 (100.0%) | 0 (0.0%) |
| 60 to 64 Years | 63 (31.8%) | 0 (0.0%) |
| 65 to 74 Years | 13 (6.1%) | 0 (0.0%) |
| 75 Years and over | 0 (0.0%) | 0 (0.0%) |
| Total | 354 (45.3%) | 0 (0.0%) |
Employment Status by Educational Attainment in Mokelumne Hill
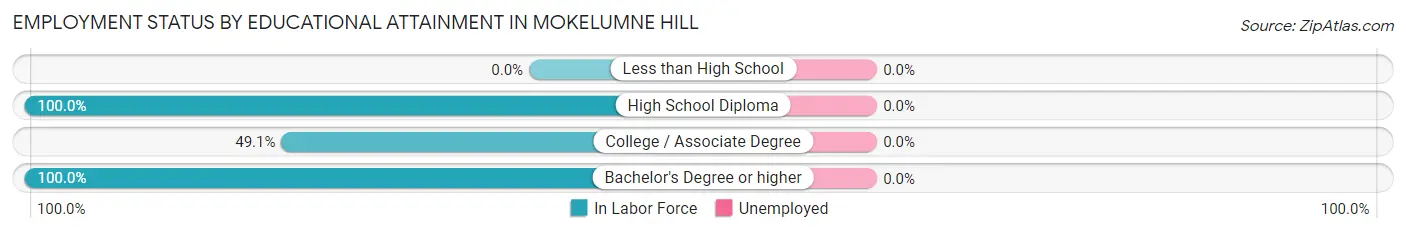
| Educational Attainment | In Labor Force | Unemployed |
| Less than High School | 0 (0.0%) | 0 (0.0%) |
| High School Diploma | 129 (100.0%) | 0 (0.0%) |
| College / Associate Degree | 130 (49.1%) | 0 (0.0%) |
| Bachelor's Degree or higher | 82 (100.0%) | 0 (0.0%) |
| Total | 341 (71.6%) | 0 (0.0%) |
Employment Occupations by Sex in Mokelumne Hill
Management, Business, Science and Arts Occupations
The most common Management, Business, Science and Arts occupations in Mokelumne Hill are Computers, Engineering & Science (63 | 17.8%), Architecture & Engineering (63 | 17.8%), Business & Financial (19 | 5.4%), Community & Social Service (13 | 3.7%), and Education Instruction & Library (13 | 3.7%).
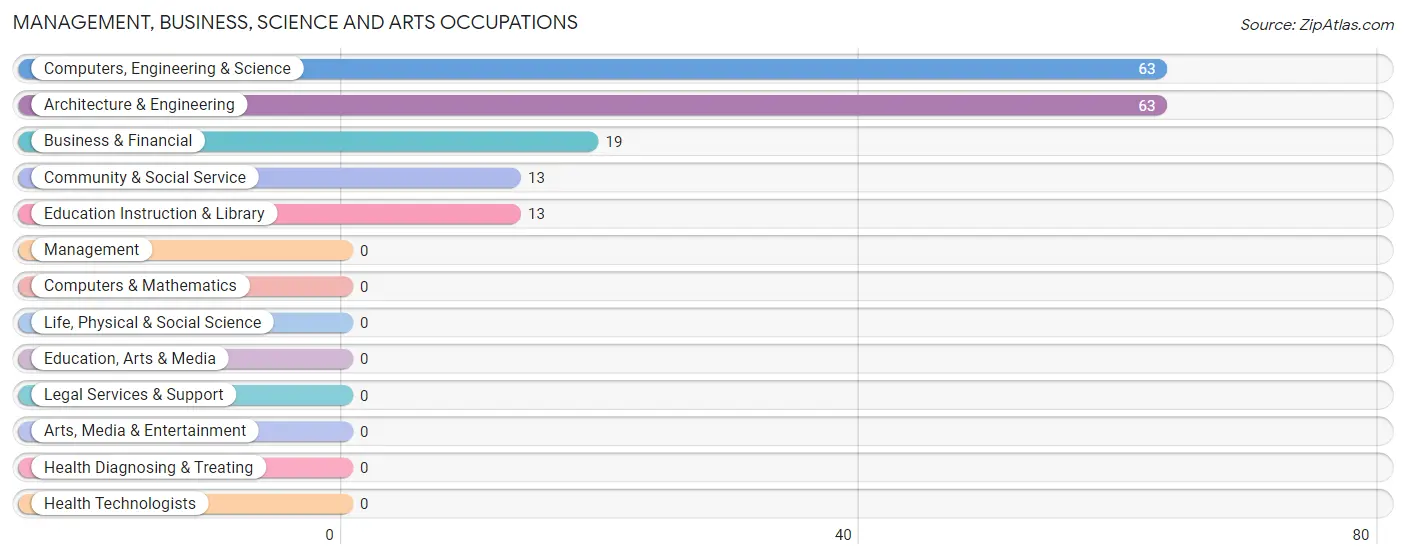
Management, Business, Science and Arts Occupations by Sex
Within the Management, Business, Science and Arts occupations in Mokelumne Hill, the most male-oriented occupations are Computers, Engineering & Science (100.0%), and Architecture & Engineering (100.0%), while the most female-oriented occupations are Business & Financial (100.0%), Community & Social Service (100.0%), and Education Instruction & Library (100.0%).
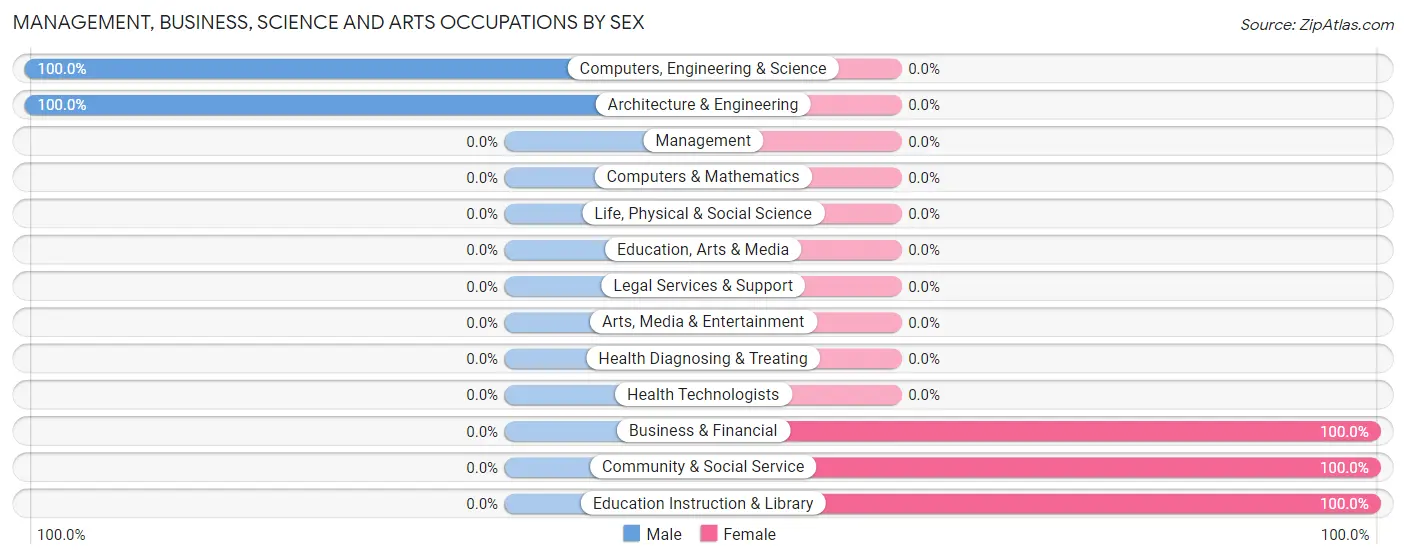
| Occupation | Male | Female |
| Management | 0 (0.0%) | 0 (0.0%) |
| Business & Financial | 0 (0.0%) | 19 (100.0%) |
| Computers, Engineering & Science | 63 (100.0%) | 0 (0.0%) |
| Computers & Mathematics | 0 (0.0%) | 0 (0.0%) |
| Architecture & Engineering | 63 (100.0%) | 0 (0.0%) |
| Life, Physical & Social Science | 0 (0.0%) | 0 (0.0%) |
| Community & Social Service | 0 (0.0%) | 13 (100.0%) |
| Education, Arts & Media | 0 (0.0%) | 0 (0.0%) |
| Legal Services & Support | 0 (0.0%) | 0 (0.0%) |
| Education Instruction & Library | 0 (0.0%) | 13 (100.0%) |
| Arts, Media & Entertainment | 0 (0.0%) | 0 (0.0%) |
| Health Diagnosing & Treating | 0 (0.0%) | 0 (0.0%) |
| Health Technologists | 0 (0.0%) | 0 (0.0%) |
| Total (Category) | 63 (66.3%) | 32 (33.7%) |
| Total (Overall) | 177 (50.0%) | 177 (50.0%) |
Services Occupations
The most common Services occupations in Mokelumne Hill are Security & Protection (42 | 11.9%), Firefighting & Prevention (42 | 11.9%), Healthcare Support (30 | 8.5%), and Cleaning & Maintenance (15 | 4.2%).
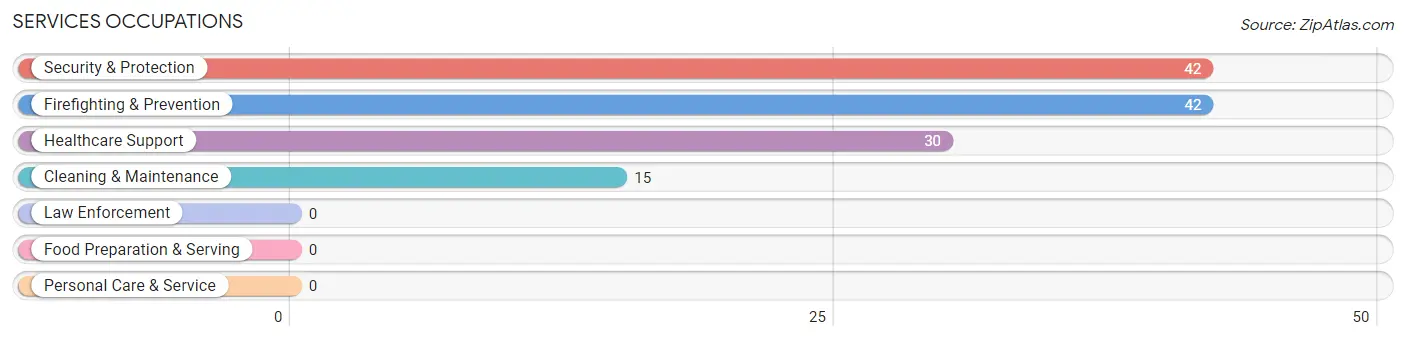
Services Occupations by Sex
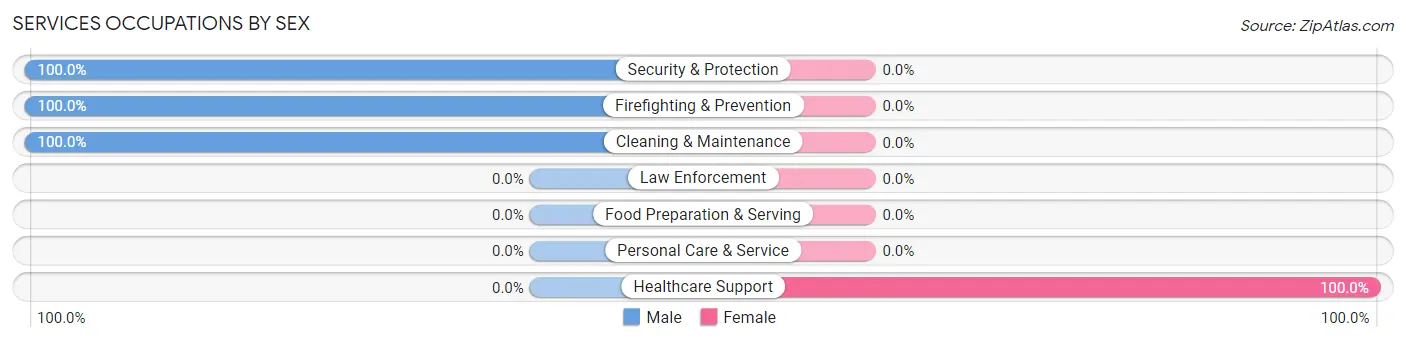
| Occupation | Male | Female |
| Healthcare Support | 0 (0.0%) | 30 (100.0%) |
| Security & Protection | 42 (100.0%) | 0 (0.0%) |
| Firefighting & Prevention | 42 (100.0%) | 0 (0.0%) |
| Law Enforcement | 0 (0.0%) | 0 (0.0%) |
| Food Preparation & Serving | 0 (0.0%) | 0 (0.0%) |
| Cleaning & Maintenance | 15 (100.0%) | 0 (0.0%) |
| Personal Care & Service | 0 (0.0%) | 0 (0.0%) |
| Total (Category) | 57 (65.5%) | 30 (34.5%) |
| Total (Overall) | 177 (50.0%) | 177 (50.0%) |
Sales and Office Occupations
The most common Sales and Office occupations in Mokelumne Hill are Sales & Related (81 | 22.9%), and Office & Administration (17 | 4.8%).
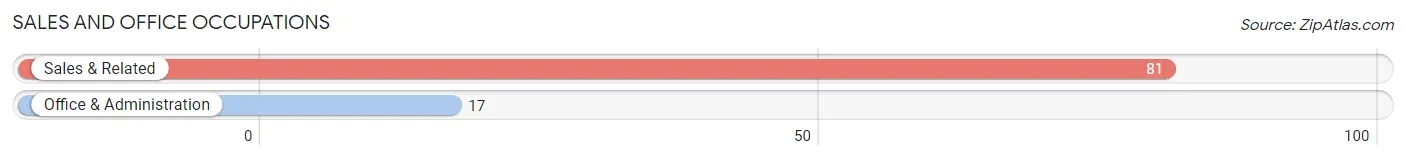
Sales and Office Occupations by Sex
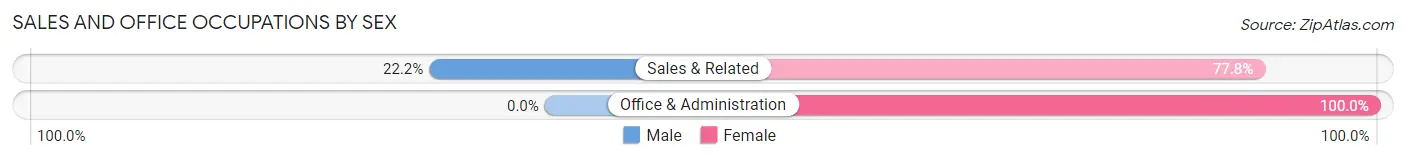
| Occupation | Male | Female |
| Sales & Related | 18 (22.2%) | 63 (77.8%) |
| Office & Administration | 0 (0.0%) | 17 (100.0%) |
| Total (Category) | 18 (18.4%) | 80 (81.6%) |
| Total (Overall) | 177 (50.0%) | 177 (50.0%) |
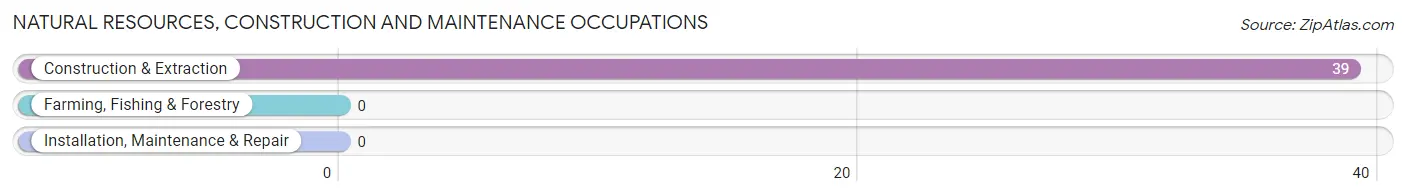
Natural Resources, Construction and Maintenance Occupations
The most common Natural Resources, Construction and Maintenance occupations in Mokelumne Hill are , and Construction & Extraction (39 | 11.0%).
Natural Resources, Construction and Maintenance Occupations by Sex
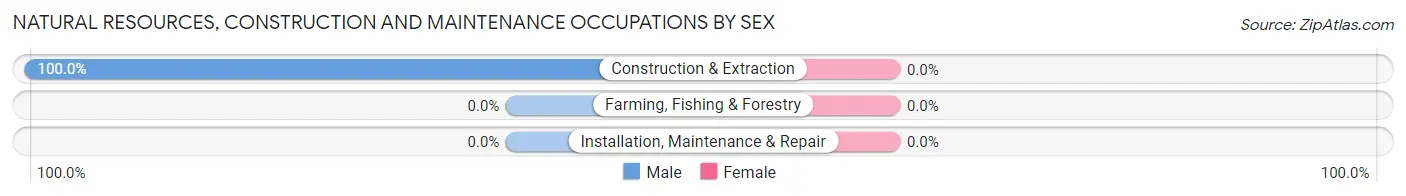
| Occupation | Male | Female |
| Farming, Fishing & Forestry | 0 (0.0%) | 0 (0.0%) |
| Construction & Extraction | 39 (100.0%) | 0 (0.0%) |
| Installation, Maintenance & Repair | 0 (0.0%) | 0 (0.0%) |
| Total (Category) | 39 (100.0%) | 0 (0.0%) |
| Total (Overall) | 177 (50.0%) | 177 (50.0%) |
Production, Transportation and Moving Occupations
The most common Production, Transportation and Moving occupations in Mokelumne Hill are , and Transportation (35 | 9.9%).
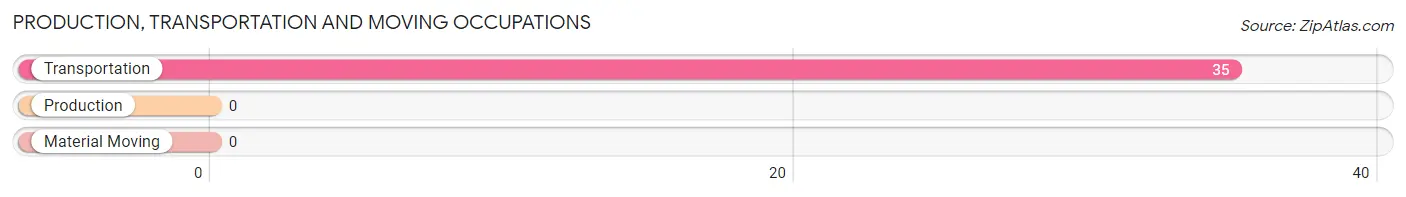
Production, Transportation and Moving Occupations by Sex
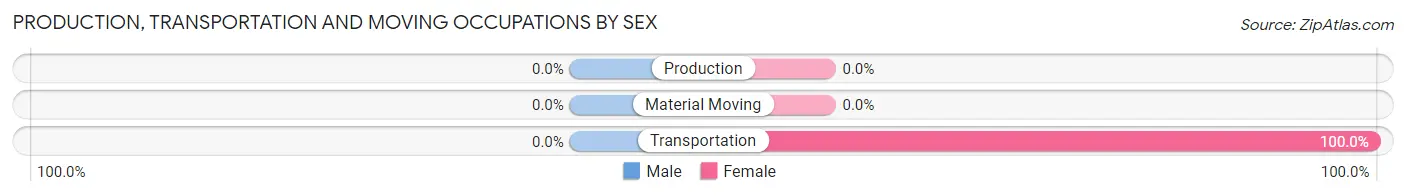
| Occupation | Male | Female |
| Production | 0 (0.0%) | 0 (0.0%) |
| Transportation | 0 (0.0%) | 35 (100.0%) |
| Material Moving | 0 (0.0%) | 0 (0.0%) |
| Total (Category) | 0 (0.0%) | 35 (100.0%) |
| Total (Overall) | 177 (50.0%) | 177 (50.0%) |
Employment Industries by Sex in Mokelumne Hill
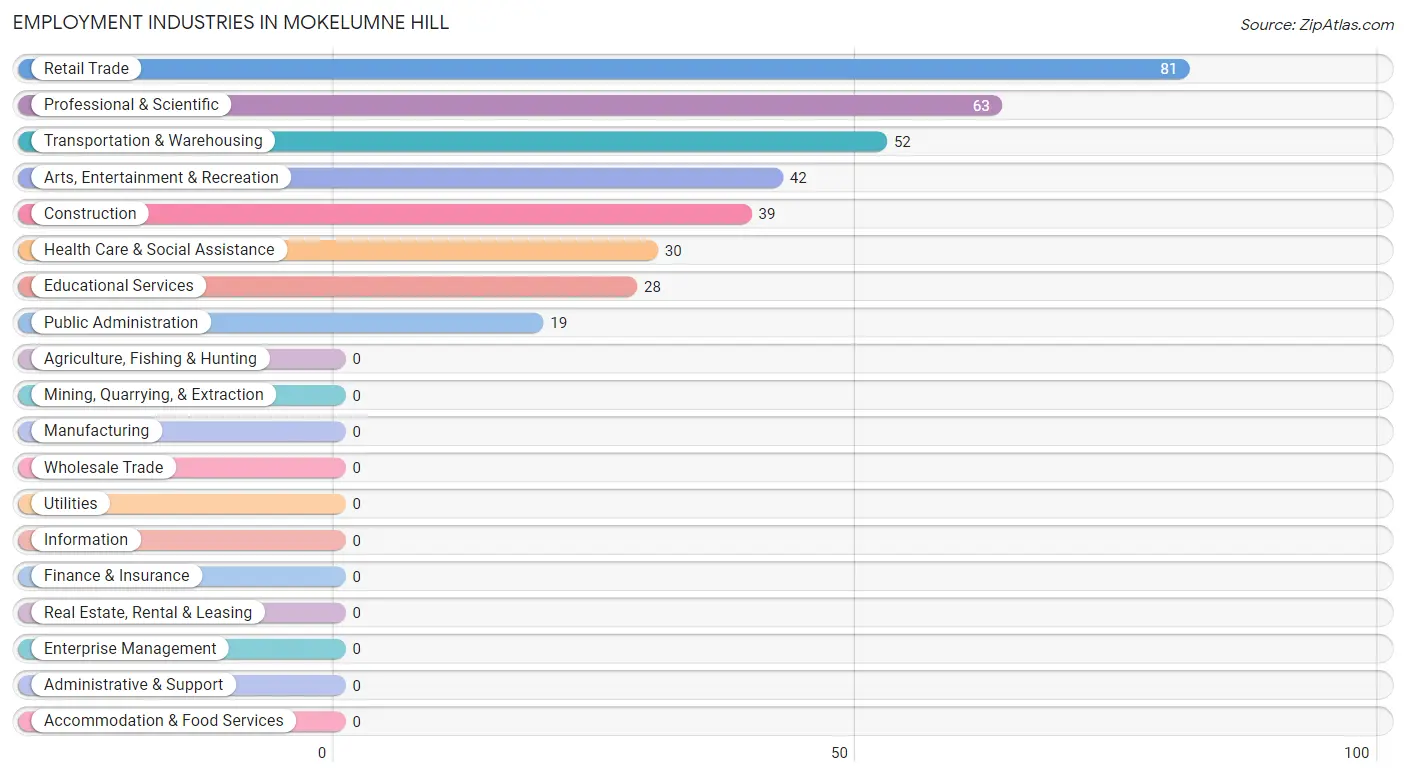
Employment Industries in Mokelumne Hill
The major employment industries in Mokelumne Hill include Retail Trade (81 | 22.9%), Professional & Scientific (63 | 17.8%), Transportation & Warehousing (52 | 14.7%), Arts, Entertainment & Recreation (42 | 11.9%), and Construction (39 | 11.0%).
Employment Industries by Sex in Mokelumne Hill
The Mokelumne Hill industries that see more men than women are Construction (100.0%), Professional & Scientific (100.0%), and Arts, Entertainment & Recreation (100.0%), whereas the industries that tend to have a higher number of women are Transportation & Warehousing (100.0%), Health Care & Social Assistance (100.0%), and Public Administration (100.0%).
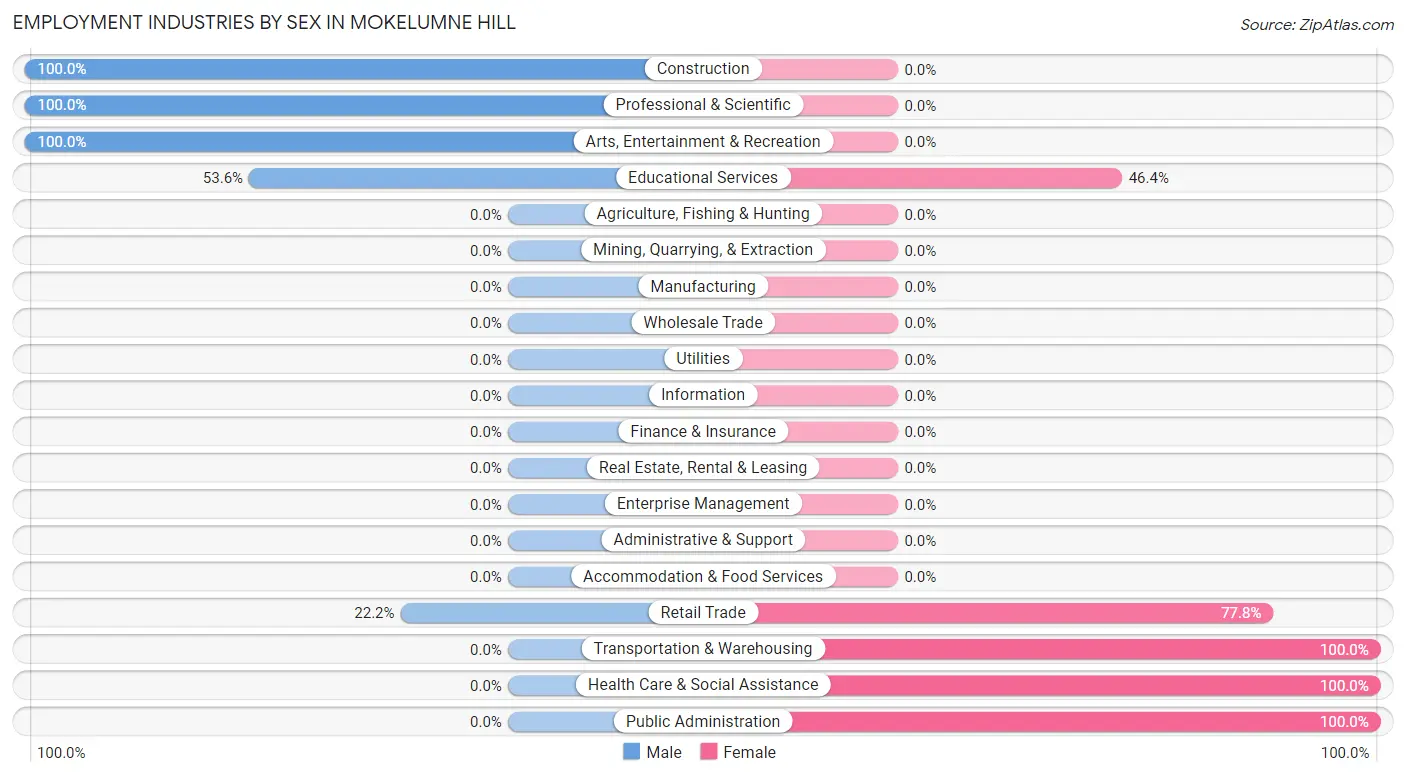
| Industry | Male | Female |
| Agriculture, Fishing & Hunting | 0 (0.0%) | 0 (0.0%) |
| Mining, Quarrying, & Extraction | 0 (0.0%) | 0 (0.0%) |
| Construction | 39 (100.0%) | 0 (0.0%) |
| Manufacturing | 0 (0.0%) | 0 (0.0%) |
| Wholesale Trade | 0 (0.0%) | 0 (0.0%) |
| Retail Trade | 18 (22.2%) | 63 (77.8%) |
| Transportation & Warehousing | 0 (0.0%) | 52 (100.0%) |
| Utilities | 0 (0.0%) | 0 (0.0%) |
| Information | 0 (0.0%) | 0 (0.0%) |
| Finance & Insurance | 0 (0.0%) | 0 (0.0%) |
| Real Estate, Rental & Leasing | 0 (0.0%) | 0 (0.0%) |
| Professional & Scientific | 63 (100.0%) | 0 (0.0%) |
| Enterprise Management | 0 (0.0%) | 0 (0.0%) |
| Administrative & Support | 0 (0.0%) | 0 (0.0%) |
| Educational Services | 15 (53.6%) | 13 (46.4%) |
| Health Care & Social Assistance | 0 (0.0%) | 30 (100.0%) |
| Arts, Entertainment & Recreation | 42 (100.0%) | 0 (0.0%) |
| Accommodation & Food Services | 0 (0.0%) | 0 (0.0%) |
| Public Administration | 0 (0.0%) | 19 (100.0%) |
| Total | 177 (50.0%) | 177 (50.0%) |
Education in Mokelumne Hill
School Enrollment in Mokelumne Hill
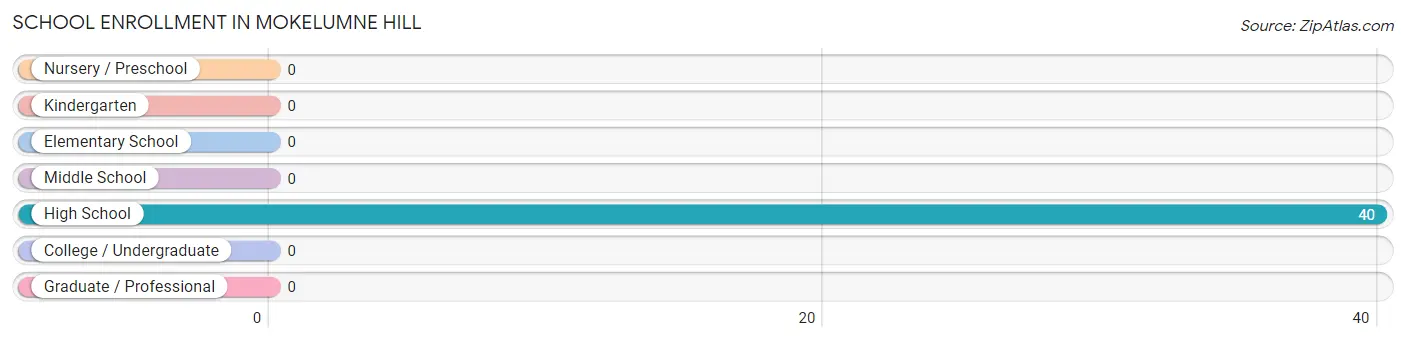
| School Level | # Students | % Students |
| Nursery / Preschool | 0 | 0.0% |
| Kindergarten | 0 | 0.0% |
| Elementary School | 0 | 0.0% |
| Middle School | 0 | 0.0% |
| High School | 40 | 100.0% |
| College / Undergraduate | 0 | 0.0% |
| Graduate / Professional | 0 | 0.0% |
| Total | 40 | 100.0% |
School Enrollment by Age by Funding Source in Mokelumne Hill
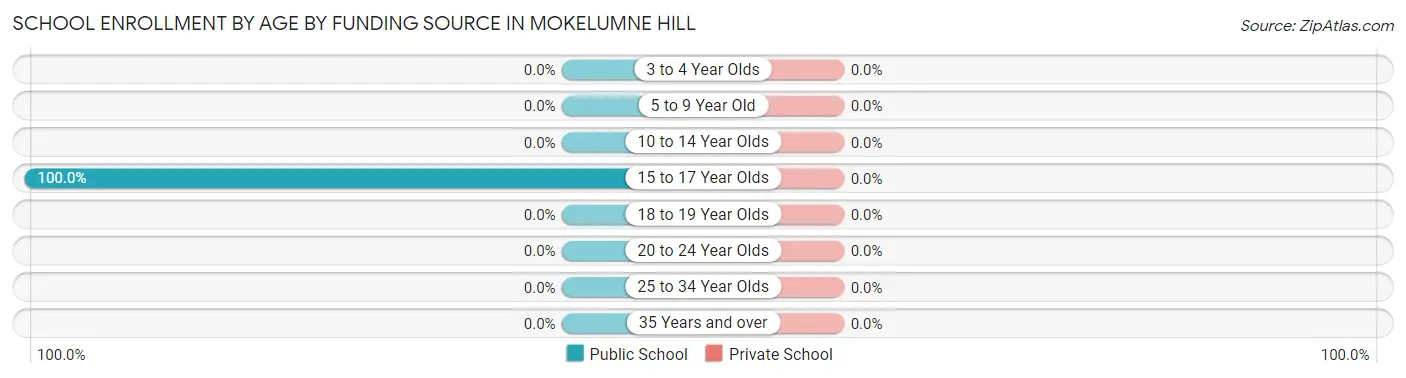
| Age Bracket | Public School | Private School |
| 3 to 4 Year Olds | 0 (0.0%) | 0 (0.0%) |
| 5 to 9 Year Old | 0 (0.0%) | 0 (0.0%) |
| 10 to 14 Year Olds | 0 (0.0%) | 0 (0.0%) |
| 15 to 17 Year Olds | 40 (100.0%) | 0 (0.0%) |
| 18 to 19 Year Olds | 0 (0.0%) | 0 (0.0%) |
| 20 to 24 Year Olds | 0 (0.0%) | 0 (0.0%) |
| 25 to 34 Year Olds | 0 (0.0%) | 0 (0.0%) |
| 35 Years and over | 0 (0.0%) | 0 (0.0%) |
| Total | 40 (100.0%) | 0 (0.0%) |
Educational Attainment by Field of Study in Mokelumne Hill
Engineering (63 | 38.7%), psychology (43 | 26.4%), business (31 | 19.0%), social sciences (13 | 8.0%), and liberal arts & history (13 | 8.0%) are the most common fields of study among 163 individuals in Mokelumne Hill who have obtained a bachelor's degree or higher.
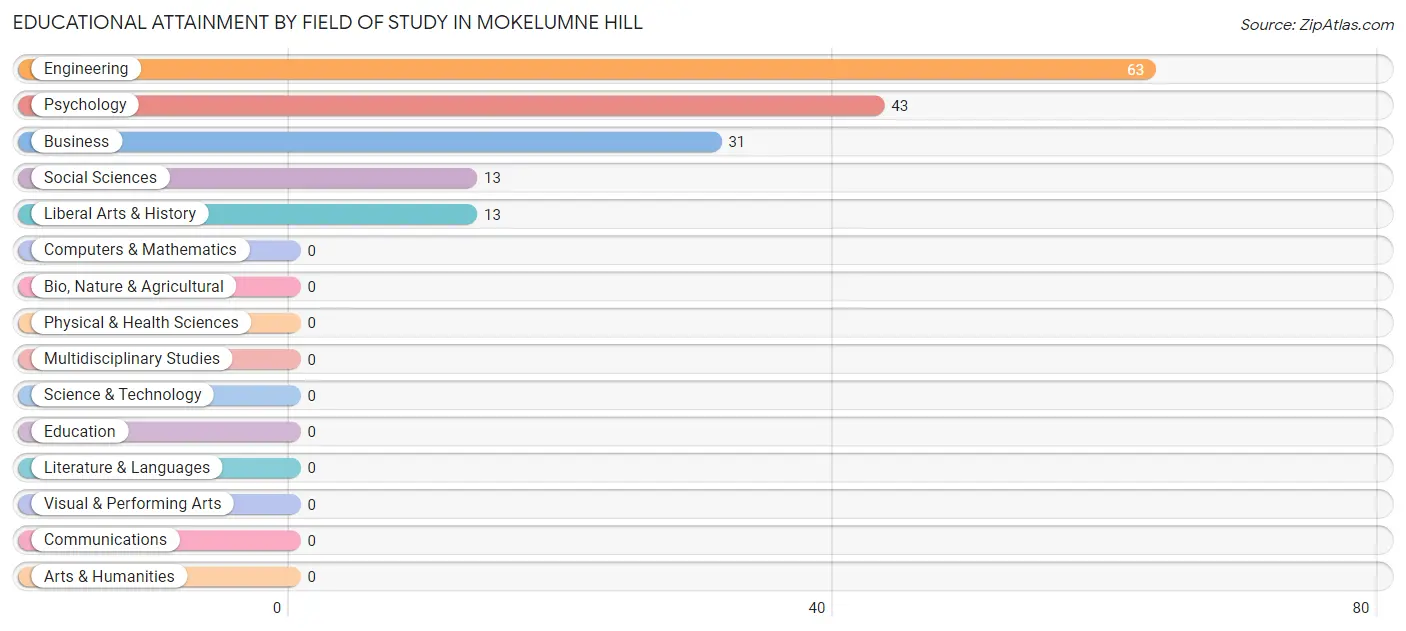
| Field of Study | # Graduates | % Graduates |
| Computers & Mathematics | 0 | 0.0% |
| Bio, Nature & Agricultural | 0 | 0.0% |
| Physical & Health Sciences | 0 | 0.0% |
| Psychology | 43 | 26.4% |
| Social Sciences | 13 | 8.0% |
| Engineering | 63 | 38.7% |
| Multidisciplinary Studies | 0 | 0.0% |
| Science & Technology | 0 | 0.0% |
| Business | 31 | 19.0% |
| Education | 0 | 0.0% |
| Literature & Languages | 0 | 0.0% |
| Liberal Arts & History | 13 | 8.0% |
| Visual & Performing Arts | 0 | 0.0% |
| Communications | 0 | 0.0% |
| Arts & Humanities | 0 | 0.0% |
| Total | 163 | 100.0% |
Transportation & Commute in Mokelumne Hill
Vehicle Availability by Sex in Mokelumne Hill
The most prevalent vehicle ownership categories in Mokelumne Hill are males with 3 vehicles (99, accounting for 55.9%) and females with 3 vehicles (65, making up 55.9%).
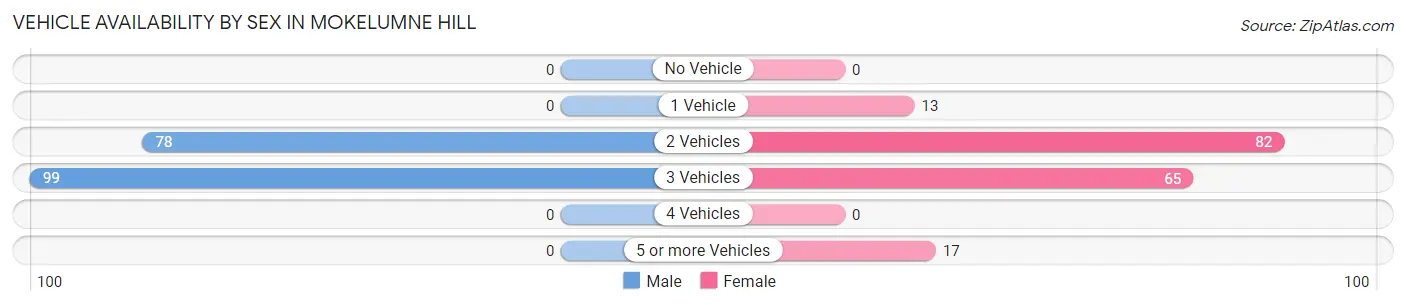
| Vehicles Available | Male | Female |
| No Vehicle | 0 (0.0%) | 0 (0.0%) |
| 1 Vehicle | 0 (0.0%) | 13 (7.3%) |
| 2 Vehicles | 78 (44.1%) | 82 (46.3%) |
| 3 Vehicles | 99 (55.9%) | 65 (36.7%) |
| 4 Vehicles | 0 (0.0%) | 0 (0.0%) |
| 5 or more Vehicles | 0 (0.0%) | 17 (9.6%) |
| Total | 177 (100.0%) | 177 (100.0%) |
Commute Time in Mokelumne Hill
The most frequently occuring commute durations in Mokelumne Hill are 5 to 9 minutes (120 commuters, 33.9%), less than 5 minutes (63 commuters, 17.8%), and 90 or more minutes (48 commuters, 13.6%).
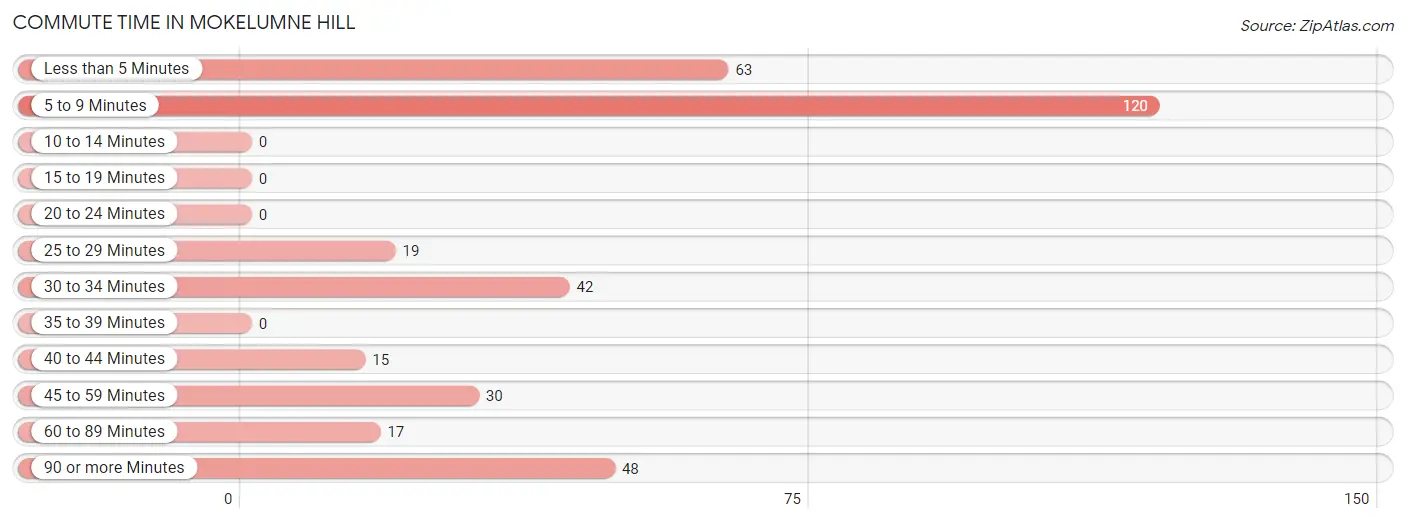
| Commute Time | # Commuters | % Commuters |
| Less than 5 Minutes | 63 | 17.8% |
| 5 to 9 Minutes | 120 | 33.9% |
| 10 to 14 Minutes | 0 | 0.0% |
| 15 to 19 Minutes | 0 | 0.0% |
| 20 to 24 Minutes | 0 | 0.0% |
| 25 to 29 Minutes | 19 | 5.4% |
| 30 to 34 Minutes | 42 | 11.9% |
| 35 to 39 Minutes | 0 | 0.0% |
| 40 to 44 Minutes | 15 | 4.2% |
| 45 to 59 Minutes | 30 | 8.5% |
| 60 to 89 Minutes | 17 | 4.8% |
| 90 or more Minutes | 48 | 13.6% |
Commute Time by Sex in Mokelumne Hill
The most common commute times in Mokelumne Hill are 5 to 9 minutes (120 commuters, 67.8%) for males and less than 5 minutes (63 commuters, 35.6%) for females.
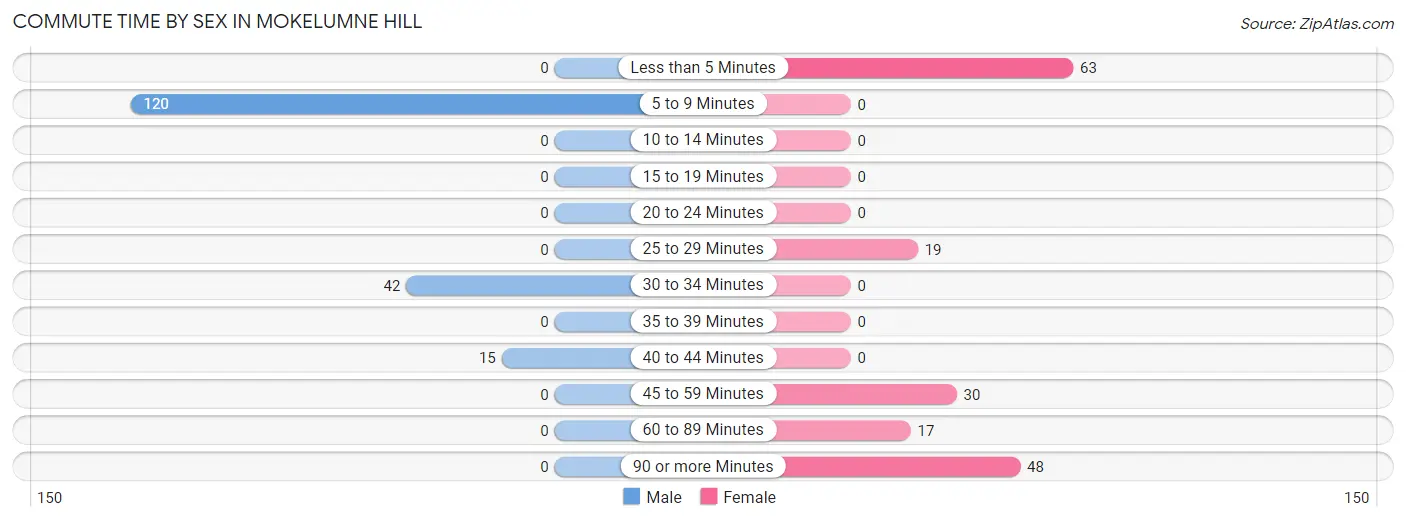
| Commute Time | Male | Female |
| Less than 5 Minutes | 0 (0.0%) | 63 (35.6%) |
| 5 to 9 Minutes | 120 (67.8%) | 0 (0.0%) |
| 10 to 14 Minutes | 0 (0.0%) | 0 (0.0%) |
| 15 to 19 Minutes | 0 (0.0%) | 0 (0.0%) |
| 20 to 24 Minutes | 0 (0.0%) | 0 (0.0%) |
| 25 to 29 Minutes | 0 (0.0%) | 19 (10.7%) |
| 30 to 34 Minutes | 42 (23.7%) | 0 (0.0%) |
| 35 to 39 Minutes | 0 (0.0%) | 0 (0.0%) |
| 40 to 44 Minutes | 15 (8.5%) | 0 (0.0%) |
| 45 to 59 Minutes | 0 (0.0%) | 30 (17.0%) |
| 60 to 89 Minutes | 0 (0.0%) | 17 (9.6%) |
| 90 or more Minutes | 0 (0.0%) | 48 (27.1%) |
Time of Departure to Work by Sex in Mokelumne Hill
The most frequent times of departure to work in Mokelumne Hill are 8:00 AM to 8:29 AM (102, 57.6%) for males and 6:00 AM to 6:29 AM (65, 36.7%) for females.
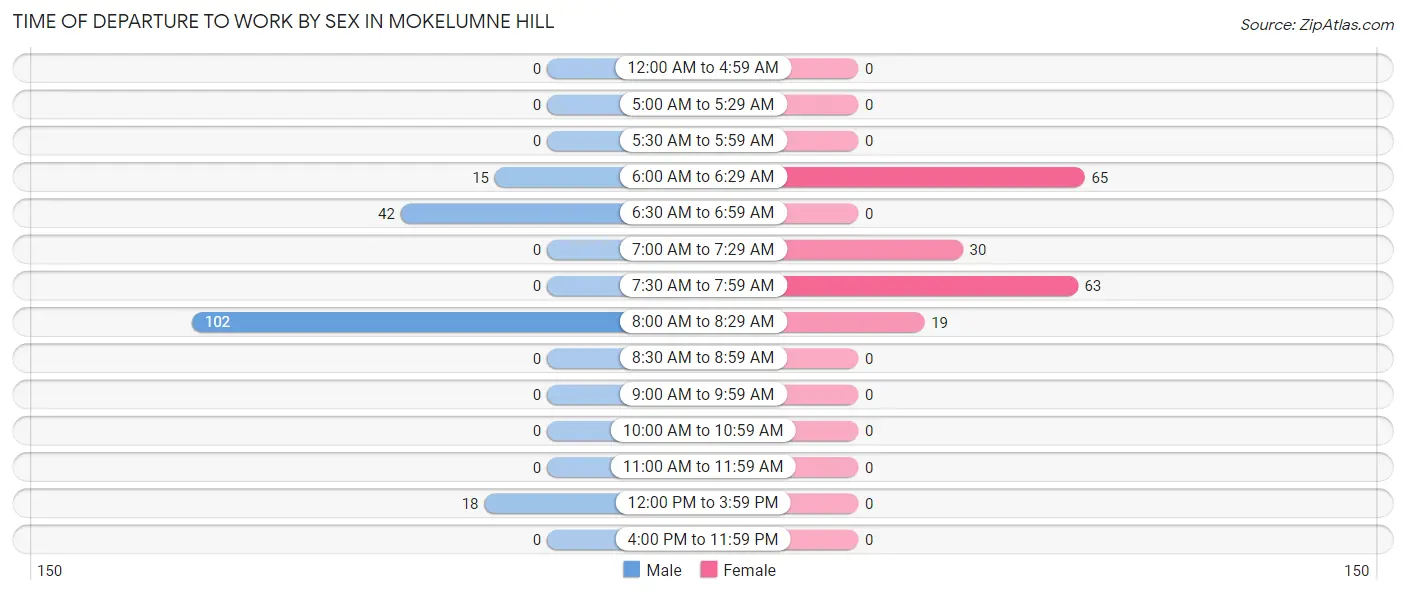
| Time of Departure | Male | Female |
| 12:00 AM to 4:59 AM | 0 (0.0%) | 0 (0.0%) |
| 5:00 AM to 5:29 AM | 0 (0.0%) | 0 (0.0%) |
| 5:30 AM to 5:59 AM | 0 (0.0%) | 0 (0.0%) |
| 6:00 AM to 6:29 AM | 15 (8.5%) | 65 (36.7%) |
| 6:30 AM to 6:59 AM | 42 (23.7%) | 0 (0.0%) |
| 7:00 AM to 7:29 AM | 0 (0.0%) | 30 (17.0%) |
| 7:30 AM to 7:59 AM | 0 (0.0%) | 63 (35.6%) |
| 8:00 AM to 8:29 AM | 102 (57.6%) | 19 (10.7%) |
| 8:30 AM to 8:59 AM | 0 (0.0%) | 0 (0.0%) |
| 9:00 AM to 9:59 AM | 0 (0.0%) | 0 (0.0%) |
| 10:00 AM to 10:59 AM | 0 (0.0%) | 0 (0.0%) |
| 11:00 AM to 11:59 AM | 0 (0.0%) | 0 (0.0%) |
| 12:00 PM to 3:59 PM | 18 (10.2%) | 0 (0.0%) |
| 4:00 PM to 11:59 PM | 0 (0.0%) | 0 (0.0%) |
| Total | 177 (100.0%) | 177 (100.0%) |
Housing Occupancy in Mokelumne Hill
Occupancy by Ownership in Mokelumne Hill
Of the total 370 dwellings in Mokelumne Hill, owner-occupied units account for 279 (75.4%), while renter-occupied units make up 91 (24.6%).
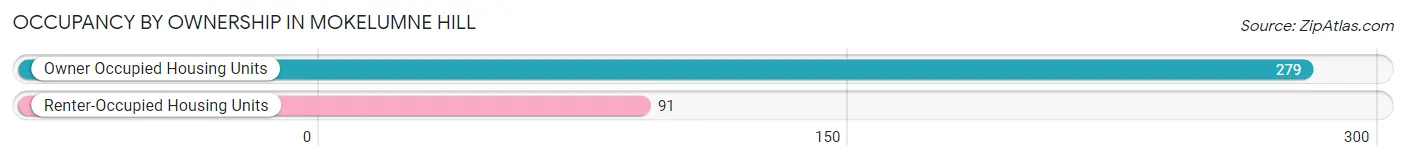
| Occupancy | # Housing Units | % Housing Units |
| Owner Occupied Housing Units | 279 | 75.4% |
| Renter-Occupied Housing Units | 91 | 24.6% |
| Total Occupied Housing Units | 370 | 100.0% |
Occupancy by Household Size in Mokelumne Hill
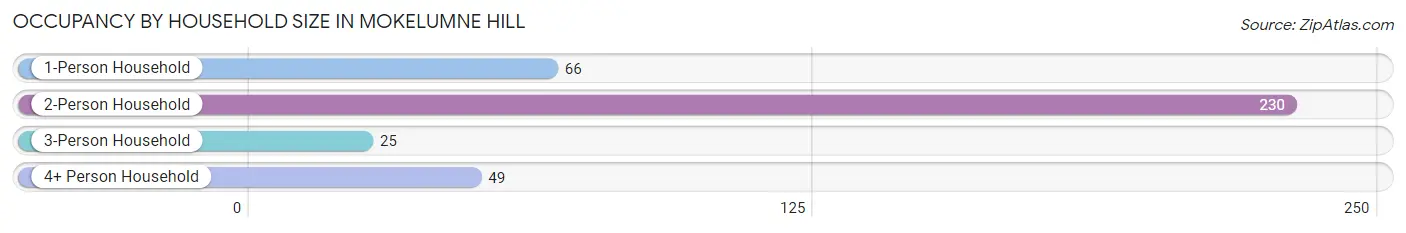
| Household Size | # Housing Units | % Housing Units |
| 1-Person Household | 66 | 17.8% |
| 2-Person Household | 230 | 62.2% |
| 3-Person Household | 25 | 6.8% |
| 4+ Person Household | 49 | 13.2% |
| Total Housing Units | 370 | 100.0% |
Occupancy by Ownership by Household Size in Mokelumne Hill
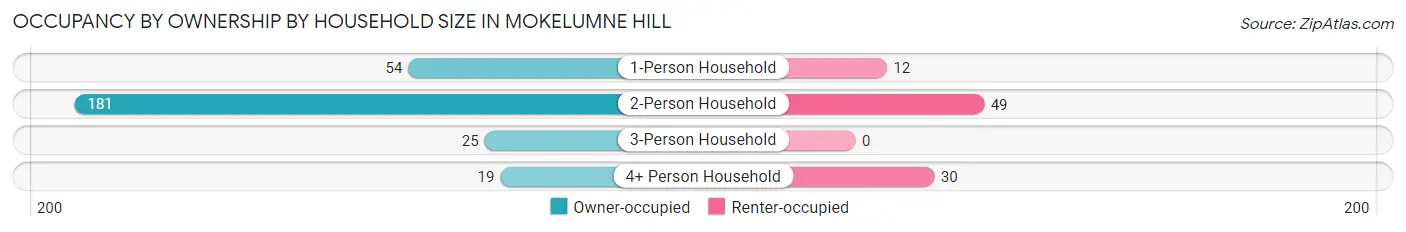
| Household Size | Owner-occupied | Renter-occupied |
| 1-Person Household | 54 (81.8%) | 12 (18.2%) |
| 2-Person Household | 181 (78.7%) | 49 (21.3%) |
| 3-Person Household | 25 (100.0%) | 0 (0.0%) |
| 4+ Person Household | 19 (38.8%) | 30 (61.2%) |
| Total Housing Units | 279 (75.4%) | 91 (24.6%) |
Occupancy by Educational Attainment in Mokelumne Hill
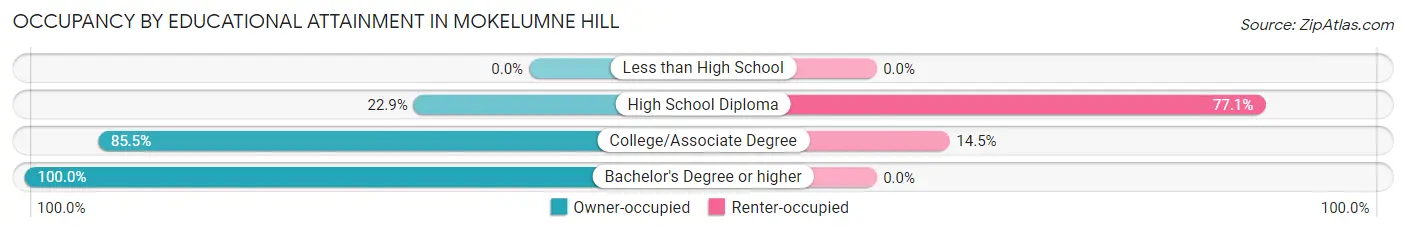
| Household Size | Owner-occupied | Renter-occupied |
| Less than High School | 0 (0.0%) | 0 (0.0%) |
| High School Diploma | 19 (22.9%) | 64 (77.1%) |
| College/Associate Degree | 159 (85.5%) | 27 (14.5%) |
| Bachelor's Degree or higher | 101 (100.0%) | 0 (0.0%) |
Occupancy by Age of Householder in Mokelumne Hill
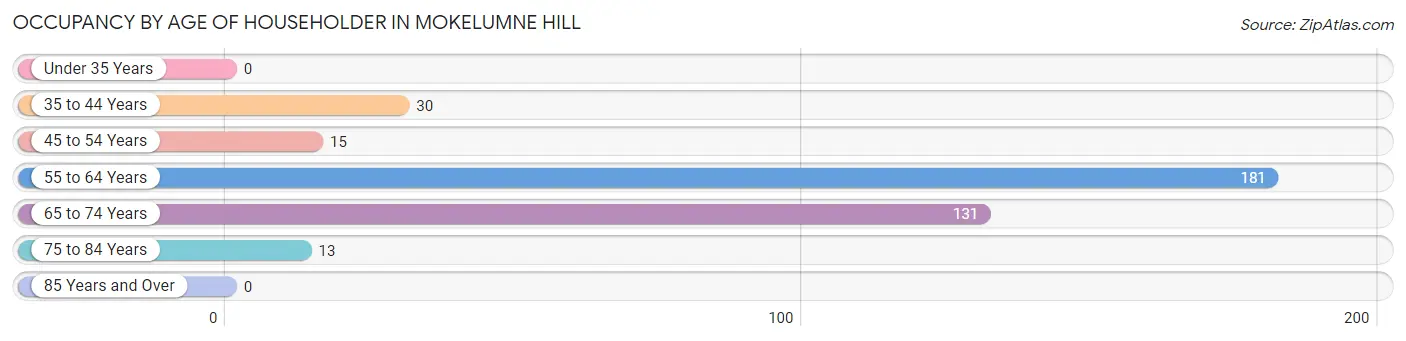
| Age Bracket | # Households | % Households |
| Under 35 Years | 0 | 0.0% |
| 35 to 44 Years | 30 | 8.1% |
| 45 to 54 Years | 15 | 4.1% |
| 55 to 64 Years | 181 | 48.9% |
| 65 to 74 Years | 131 | 35.4% |
| 75 to 84 Years | 13 | 3.5% |
| 85 Years and Over | 0 | 0.0% |
| Total | 370 | 100.0% |
Housing Finances in Mokelumne Hill
Median Income by Occupancy in Mokelumne Hill
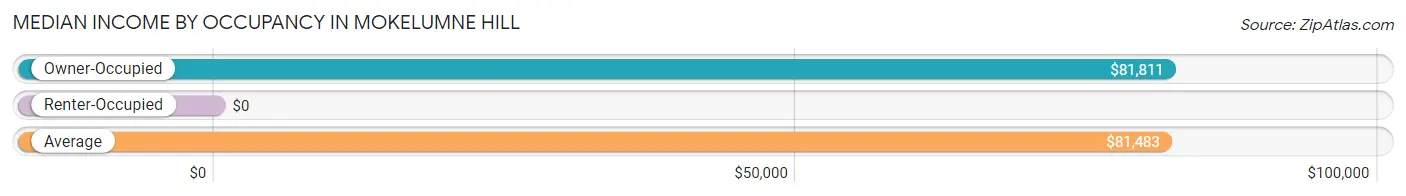
| Occupancy Type | # Households | Median Income |
| Owner-Occupied | 279 (75.4%) | $81,811 |
| Renter-Occupied | 91 (24.6%) | $0 |
| Average | 370 (100.0%) | $81,483 |
Occupancy by Householder Income Bracket in Mokelumne Hill
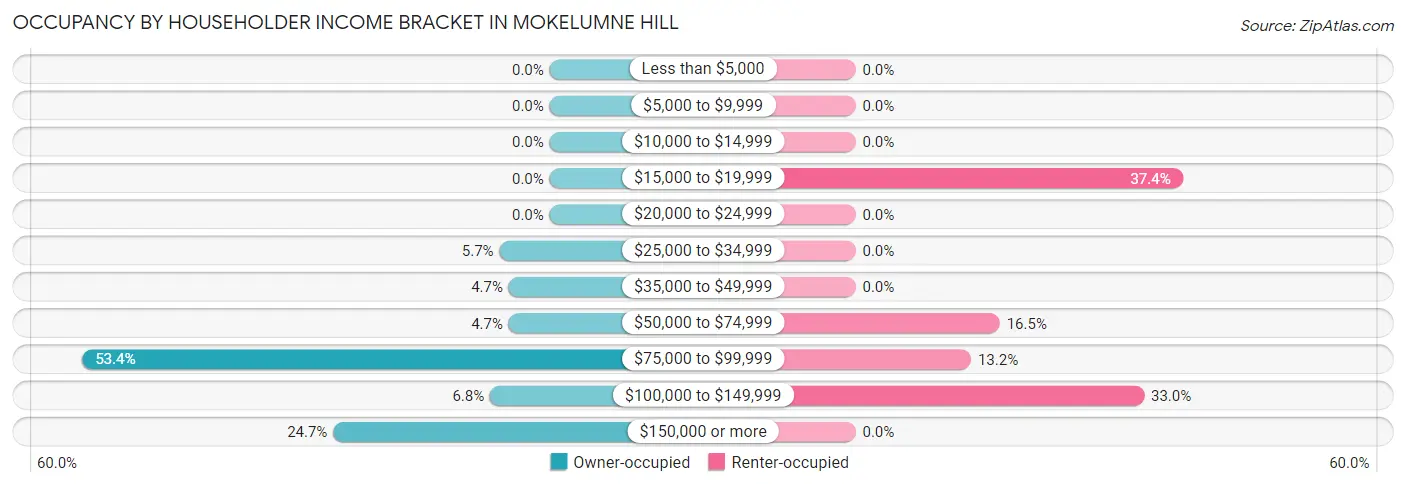
| Income Bracket | Owner-occupied | Renter-occupied |
| Less than $5,000 | 0 (0.0%) | 0 (0.0%) |
| $5,000 to $9,999 | 0 (0.0%) | 0 (0.0%) |
| $10,000 to $14,999 | 0 (0.0%) | 0 (0.0%) |
| $15,000 to $19,999 | 0 (0.0%) | 34 (37.4%) |
| $20,000 to $24,999 | 0 (0.0%) | 0 (0.0%) |
| $25,000 to $34,999 | 16 (5.7%) | 0 (0.0%) |
| $35,000 to $49,999 | 13 (4.7%) | 0 (0.0%) |
| $50,000 to $74,999 | 13 (4.7%) | 15 (16.5%) |
| $75,000 to $99,999 | 149 (53.4%) | 12 (13.2%) |
| $100,000 to $149,999 | 19 (6.8%) | 30 (33.0%) |
| $150,000 or more | 69 (24.7%) | 0 (0.0%) |
| Total | 279 (100.0%) | 91 (100.0%) |
Monthly Housing Cost Tiers in Mokelumne Hill
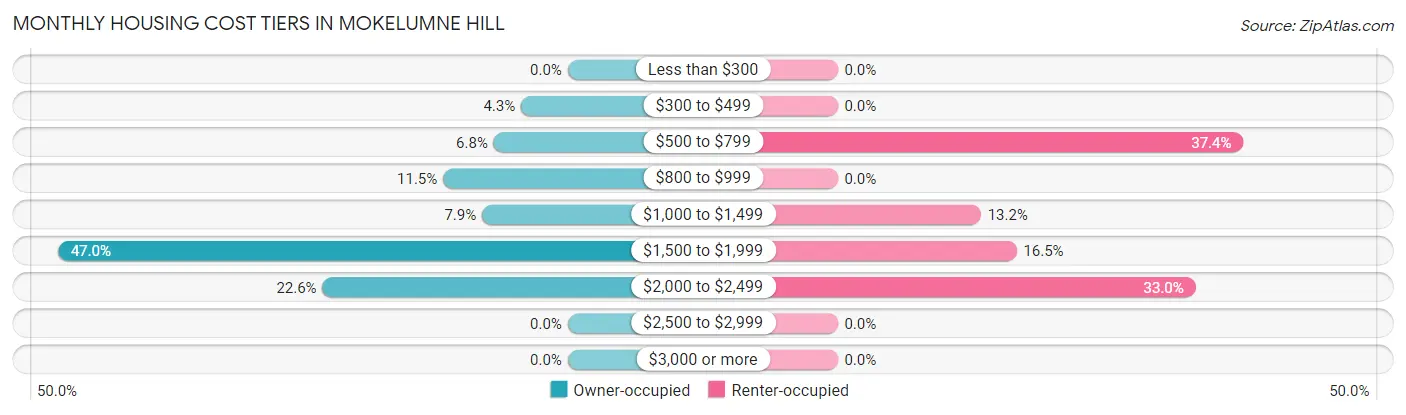
| Monthly Cost | Owner-occupied | Renter-occupied |
| Less than $300 | 0 (0.0%) | 0 (0.0%) |
| $300 to $499 | 12 (4.3%) | 0 (0.0%) |
| $500 to $799 | 19 (6.8%) | 34 (37.4%) |
| $800 to $999 | 32 (11.5%) | 0 (0.0%) |
| $1,000 to $1,499 | 22 (7.9%) | 12 (13.2%) |
| $1,500 to $1,999 | 131 (46.9%) | 15 (16.5%) |
| $2,000 to $2,499 | 63 (22.6%) | 30 (33.0%) |
| $2,500 to $2,999 | 0 (0.0%) | 0 (0.0%) |
| $3,000 or more | 0 (0.0%) | 0 (0.0%) |
| Total | 279 (100.0%) | 91 (100.0%) |
Physical Housing Characteristics in Mokelumne Hill
Housing Structures in Mokelumne Hill
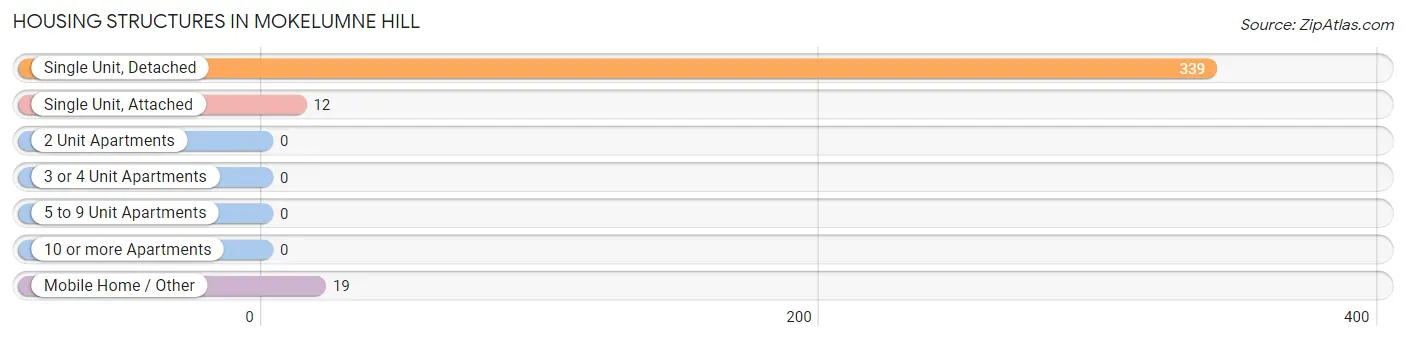
| Structure Type | # Housing Units | % Housing Units |
| Single Unit, Detached | 339 | 91.6% |
| Single Unit, Attached | 12 | 3.2% |
| 2 Unit Apartments | 0 | 0.0% |
| 3 or 4 Unit Apartments | 0 | 0.0% |
| 5 to 9 Unit Apartments | 0 | 0.0% |
| 10 or more Apartments | 0 | 0.0% |
| Mobile Home / Other | 19 | 5.1% |
| Total | 370 | 100.0% |
Housing Structures by Occupancy in Mokelumne Hill
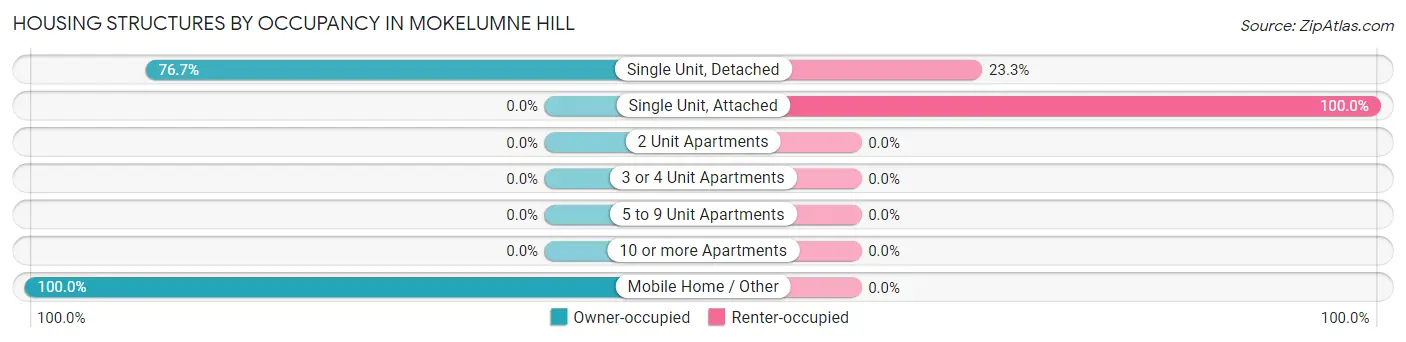
| Structure Type | Owner-occupied | Renter-occupied |
| Single Unit, Detached | 260 (76.7%) | 79 (23.3%) |
| Single Unit, Attached | 0 (0.0%) | 12 (100.0%) |
| 2 Unit Apartments | 0 (0.0%) | 0 (0.0%) |
| 3 or 4 Unit Apartments | 0 (0.0%) | 0 (0.0%) |
| 5 to 9 Unit Apartments | 0 (0.0%) | 0 (0.0%) |
| 10 or more Apartments | 0 (0.0%) | 0 (0.0%) |
| Mobile Home / Other | 19 (100.0%) | 0 (0.0%) |
| Total | 279 (75.4%) | 91 (24.6%) |
Housing Structures by Number of Rooms in Mokelumne Hill
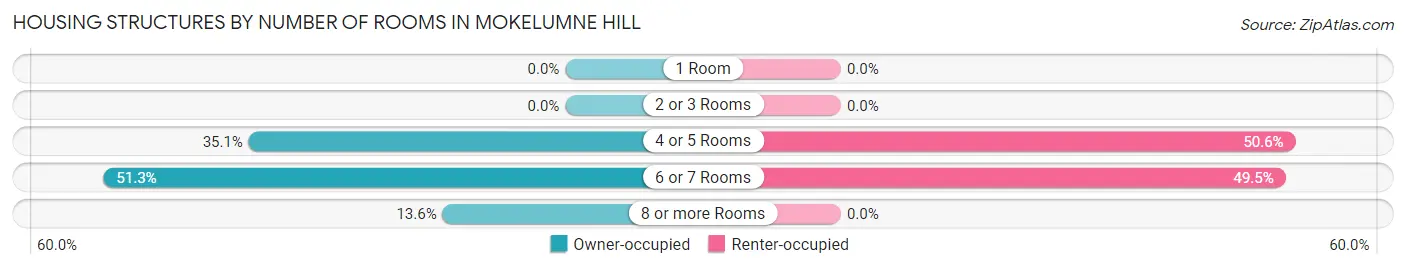
| Number of Rooms | Owner-occupied | Renter-occupied |
| 1 Room | 0 (0.0%) | 0 (0.0%) |
| 2 or 3 Rooms | 0 (0.0%) | 0 (0.0%) |
| 4 or 5 Rooms | 98 (35.1%) | 46 (50.5%) |
| 6 or 7 Rooms | 143 (51.2%) | 45 (49.4%) |
| 8 or more Rooms | 38 (13.6%) | 0 (0.0%) |
| Total | 279 (100.0%) | 91 (100.0%) |
Housing Structure by Heating Type in Mokelumne Hill
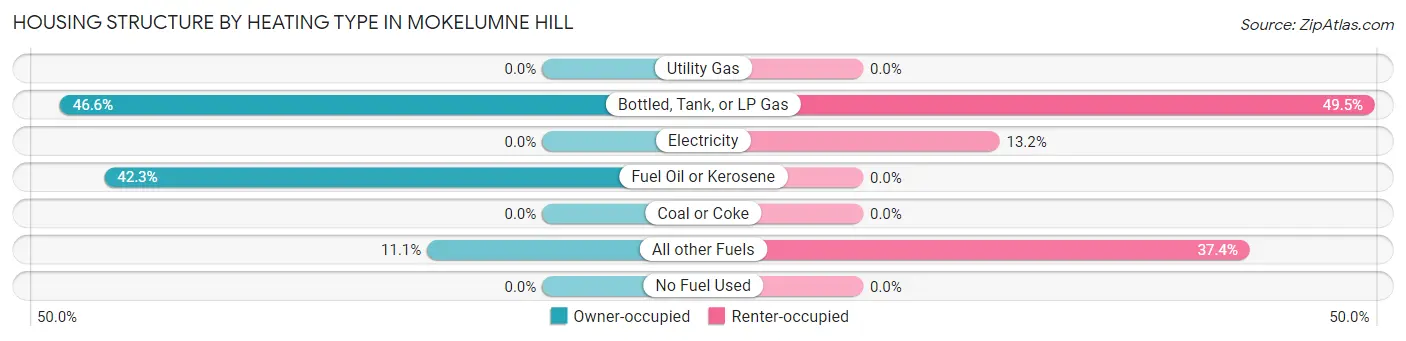
| Heating Type | Owner-occupied | Renter-occupied |
| Utility Gas | 0 (0.0%) | 0 (0.0%) |
| Bottled, Tank, or LP Gas | 130 (46.6%) | 45 (49.4%) |
| Electricity | 0 (0.0%) | 12 (13.2%) |
| Fuel Oil or Kerosene | 118 (42.3%) | 0 (0.0%) |
| Coal or Coke | 0 (0.0%) | 0 (0.0%) |
| All other Fuels | 31 (11.1%) | 34 (37.4%) |
| No Fuel Used | 0 (0.0%) | 0 (0.0%) |
| Total | 279 (100.0%) | 91 (100.0%) |
Household Vehicle Usage in Mokelumne Hill
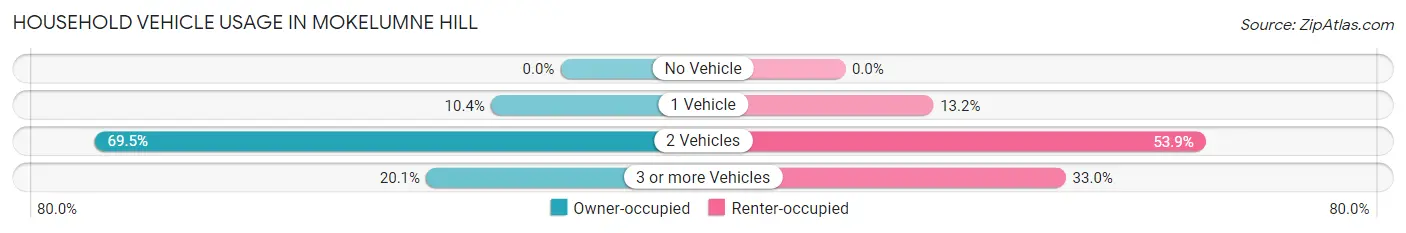
| Vehicles per Household | Owner-occupied | Renter-occupied |
| No Vehicle | 0 (0.0%) | 0 (0.0%) |
| 1 Vehicle | 29 (10.4%) | 12 (13.2%) |
| 2 Vehicles | 194 (69.5%) | 49 (53.8%) |
| 3 or more Vehicles | 56 (20.1%) | 30 (33.0%) |
| Total | 279 (100.0%) | 91 (100.0%) |
Real Estate & Mortgages in Mokelumne Hill
Real Estate and Mortgage Overview in Mokelumne Hill
| Characteristic | Without Mortgage | With Mortgage |
| Housing Units | 69 | 210 |
| Median Property Value | $381,600 | $364,400 |
| Median Household Income | $88,750 | $63 |
| Monthly Housing Costs | $811 | $0 |
| Real Estate Taxes | $2,352 | $0 |
Property Value by Mortgage Status in Mokelumne Hill
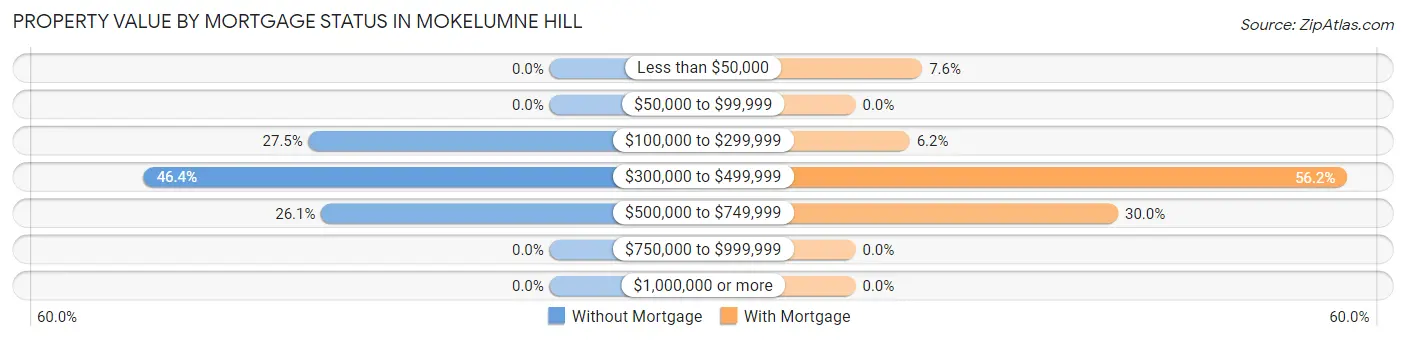
| Property Value | Without Mortgage | With Mortgage |
| Less than $50,000 | 0 (0.0%) | 16 (7.6%) |
| $50,000 to $99,999 | 0 (0.0%) | 0 (0.0%) |
| $100,000 to $299,999 | 19 (27.5%) | 13 (6.2%) |
| $300,000 to $499,999 | 32 (46.4%) | 118 (56.2%) |
| $500,000 to $749,999 | 18 (26.1%) | 63 (30.0%) |
| $750,000 to $999,999 | 0 (0.0%) | 0 (0.0%) |
| $1,000,000 or more | 0 (0.0%) | 0 (0.0%) |
| Total | 69 (100.0%) | 210 (100.0%) |
Household Income by Mortgage Status in Mokelumne Hill
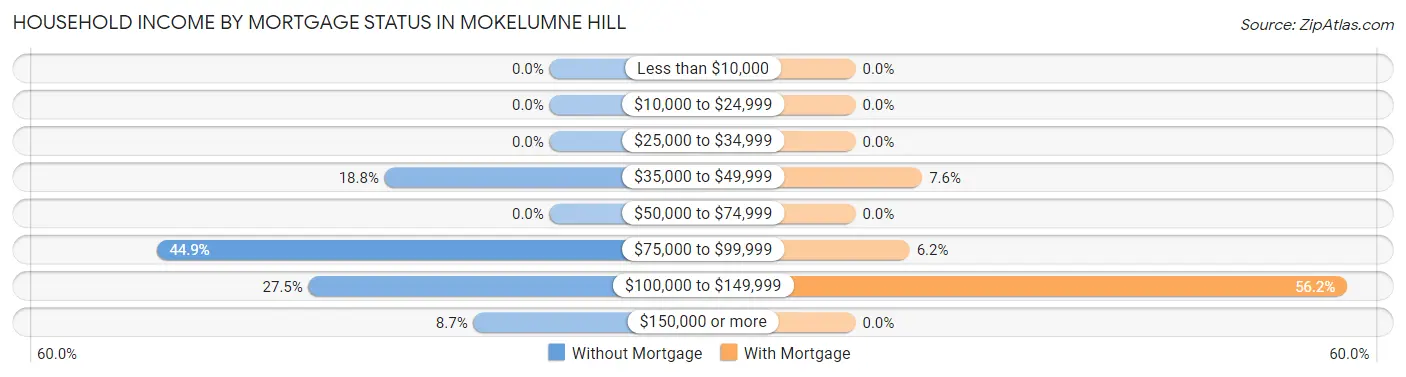
| Household Income | Without Mortgage | With Mortgage |
| Less than $10,000 | 0 (0.0%) | 0 (0.0%) |
| $10,000 to $24,999 | 0 (0.0%) | 0 (0.0%) |
| $25,000 to $34,999 | 0 (0.0%) | 0 (0.0%) |
| $35,000 to $49,999 | 13 (18.8%) | 16 (7.6%) |
| $50,000 to $74,999 | 0 (0.0%) | 0 (0.0%) |
| $75,000 to $99,999 | 31 (44.9%) | 13 (6.2%) |
| $100,000 to $149,999 | 19 (27.5%) | 118 (56.2%) |
| $150,000 or more | 6 (8.7%) | 0 (0.0%) |
| Total | 69 (100.0%) | 210 (100.0%) |
Property Value to Household Income Ratio in Mokelumne Hill
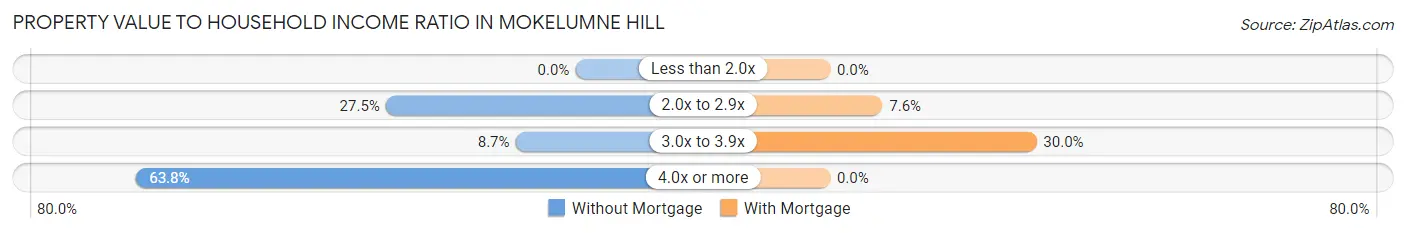
| Value-to-Income Ratio | Without Mortgage | With Mortgage |
| Less than 2.0x | 0 (0.0%) | 0 (0.0%) |
| 2.0x to 2.9x | 19 (27.5%) | 16 (7.6%) |
| 3.0x to 3.9x | 6 (8.7%) | 63 (30.0%) |
| 4.0x or more | 44 (63.8%) | 0 (0.0%) |
| Total | 69 (100.0%) | 210 (100.0%) |
Real Estate Taxes by Mortgage Status in Mokelumne Hill
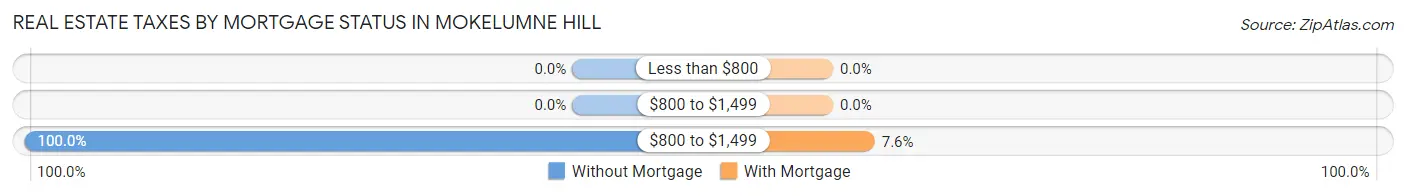
| Property Taxes | Without Mortgage | With Mortgage |
| Less than $800 | 0 (0.0%) | 0 (0.0%) |
| $800 to $1,499 | 0 (0.0%) | 0 (0.0%) |
| $800 to $1,499 | 69 (100.0%) | 16 (7.6%) |
| Total | 69 (100.0%) | 210 (100.0%) |
Health & Disability in Mokelumne Hill
Health Insurance Coverage by Age in Mokelumne Hill
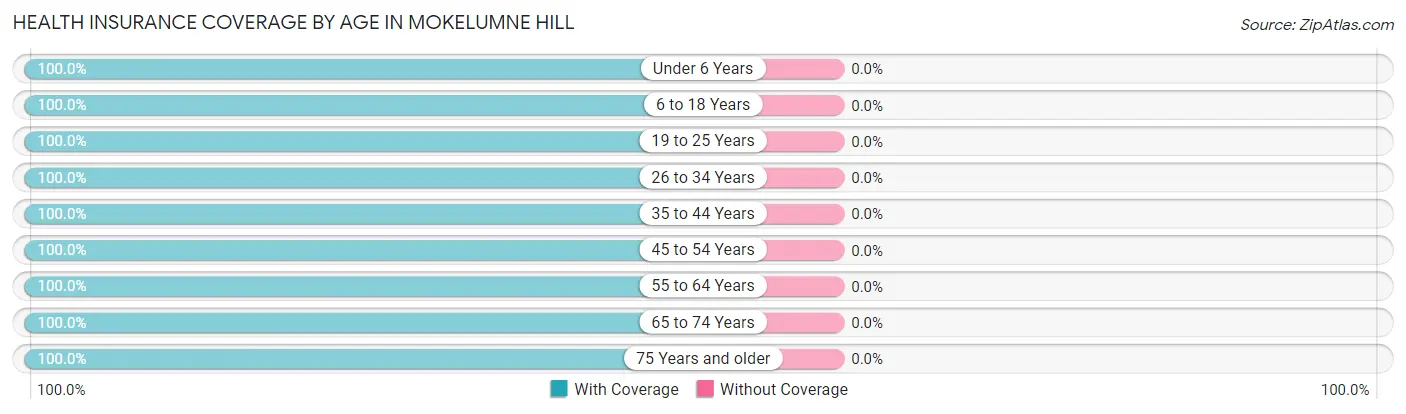
| Age Bracket | With Coverage | Without Coverage |
| Under 6 Years | 26 (100.0%) | 0 (0.0%) |
| 6 to 18 Years | 40 (100.0%) | 0 (0.0%) |
| 19 to 25 Years | 18 (100.0%) | 0 (0.0%) |
| 26 to 34 Years | 42 (100.0%) | 0 (0.0%) |
| 35 to 44 Years | 65 (100.0%) | 0 (0.0%) |
| 45 to 54 Years | 90 (100.0%) | 0 (0.0%) |
| 55 to 64 Years | 261 (100.0%) | 0 (0.0%) |
| 65 to 74 Years | 212 (100.0%) | 0 (0.0%) |
| 75 Years and older | 54 (100.0%) | 0 (0.0%) |
| Total | 808 (100.0%) | 0 (0.0%) |
Health Insurance Coverage by Citizenship Status in Mokelumne Hill
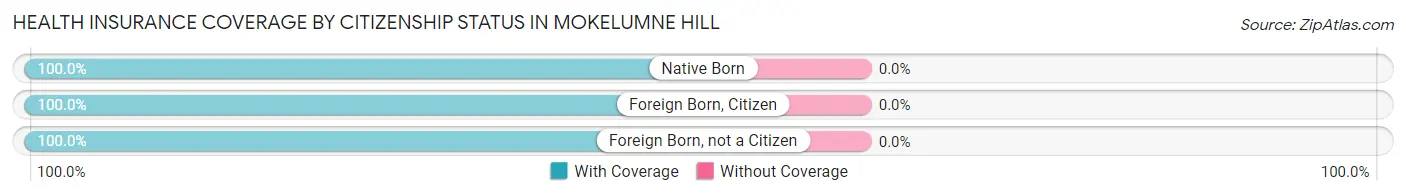
| Citizenship Status | With Coverage | Without Coverage |
| Native Born | 26 (100.0%) | 0 (0.0%) |
| Foreign Born, Citizen | 40 (100.0%) | 0 (0.0%) |
| Foreign Born, not a Citizen | 18 (100.0%) | 0 (0.0%) |
Health Insurance Coverage by Household Income in Mokelumne Hill
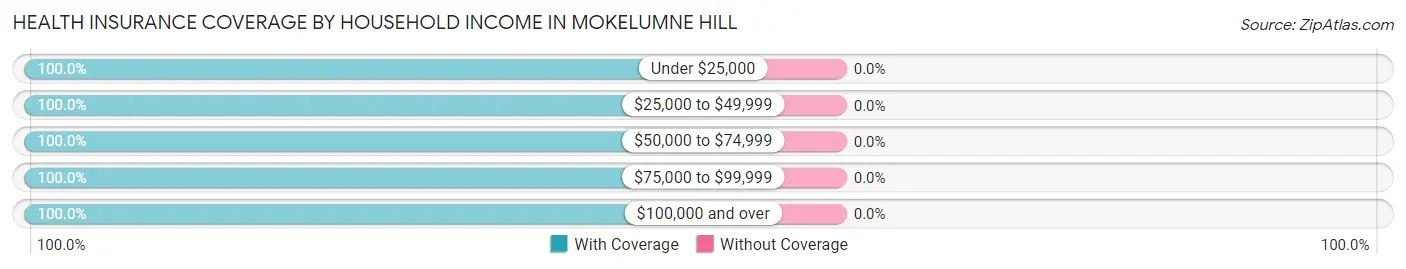
| Household Income | With Coverage | Without Coverage |
| Under $25,000 | 77 (100.0%) | 0 (0.0%) |
| $25,000 to $49,999 | 29 (100.0%) | 0 (0.0%) |
| $50,000 to $74,999 | 47 (100.0%) | 0 (0.0%) |
| $75,000 to $99,999 | 235 (100.0%) | 0 (0.0%) |
| $100,000 and over | 420 (100.0%) | 0 (0.0%) |
Public vs Private Health Insurance Coverage by Age in Mokelumne Hill
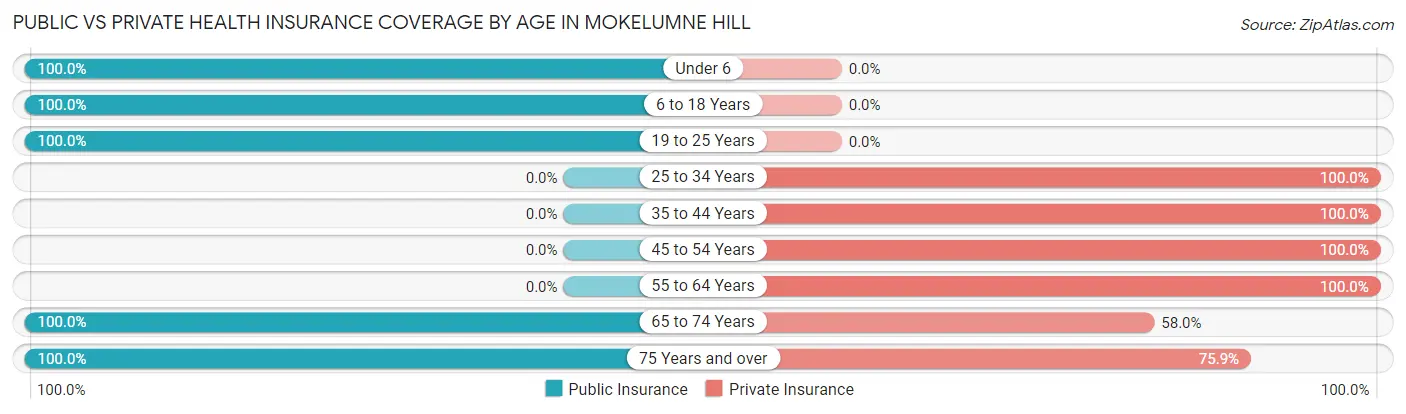
| Age Bracket | Public Insurance | Private Insurance |
| Under 6 | 26 (100.0%) | 0 (0.0%) |
| 6 to 18 Years | 40 (100.0%) | 0 (0.0%) |
| 19 to 25 Years | 18 (100.0%) | 0 (0.0%) |
| 25 to 34 Years | 0 (0.0%) | 42 (100.0%) |
| 35 to 44 Years | 0 (0.0%) | 65 (100.0%) |
| 45 to 54 Years | 0 (0.0%) | 90 (100.0%) |
| 55 to 64 Years | 0 (0.0%) | 261 (100.0%) |
| 65 to 74 Years | 212 (100.0%) | 123 (58.0%) |
| 75 Years and over | 54 (100.0%) | 41 (75.9%) |
| Total | 350 (43.3%) | 622 (77.0%) |
Disability Status by Sex by Age in Mokelumne Hill
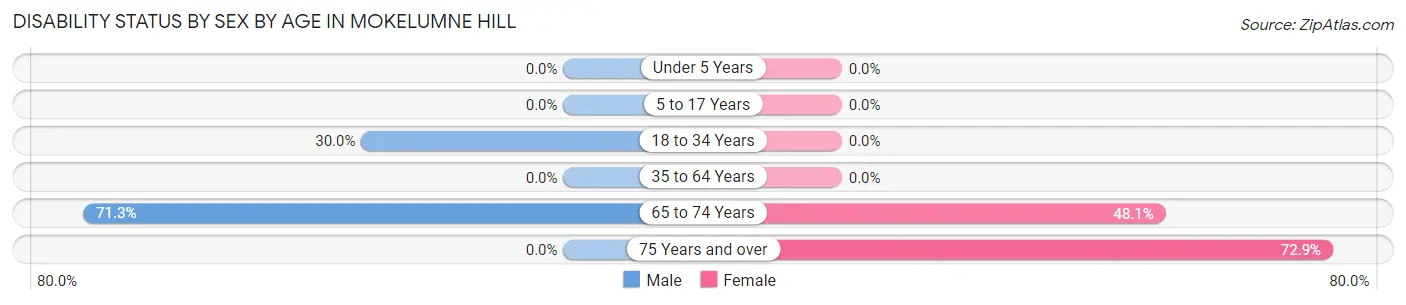
| Age Bracket | Male | Female |
| Under 5 Years | 0 (0.0%) | 0 (0.0%) |
| 5 to 17 Years | 0 (0.0%) | 0 (0.0%) |
| 18 to 34 Years | 18 (30.0%) | 0 (0.0%) |
| 35 to 64 Years | 0 (0.0%) | 0 (0.0%) |
| 65 to 74 Years | 77 (71.3%) | 50 (48.1%) |
| 75 Years and over | 0 (0.0%) | 35 (72.9%) |
Disability Class by Sex by Age in Mokelumne Hill
Disability Class: Hearing Difficulty
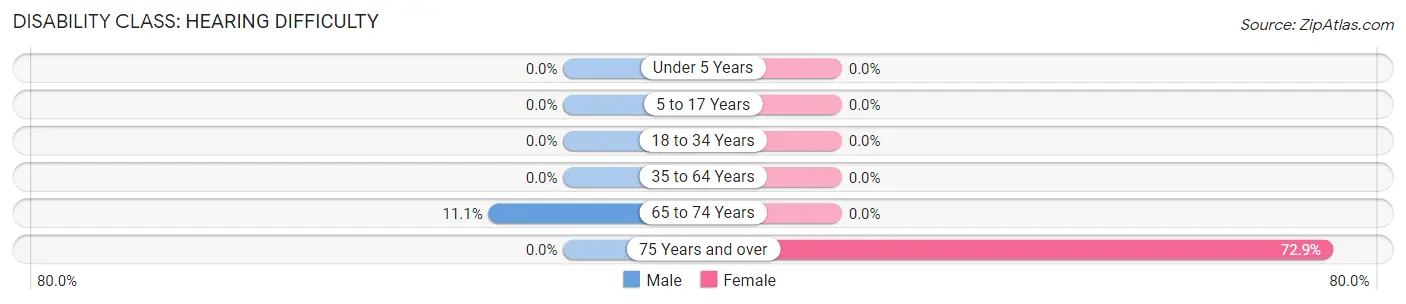
| Age Bracket | Male | Female |
| Under 5 Years | 0 (0.0%) | 0 (0.0%) |
| 5 to 17 Years | 0 (0.0%) | 0 (0.0%) |
| 18 to 34 Years | 0 (0.0%) | 0 (0.0%) |
| 35 to 64 Years | 0 (0.0%) | 0 (0.0%) |
| 65 to 74 Years | 12 (11.1%) | 0 (0.0%) |
| 75 Years and over | 0 (0.0%) | 35 (72.9%) |
Disability Class: Vision Difficulty
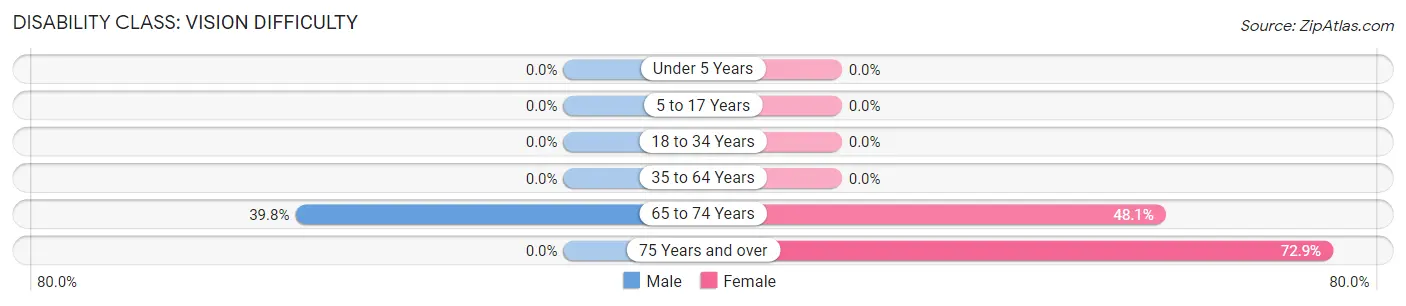
| Age Bracket | Male | Female |
| Under 5 Years | 0 (0.0%) | 0 (0.0%) |
| 5 to 17 Years | 0 (0.0%) | 0 (0.0%) |
| 18 to 34 Years | 0 (0.0%) | 0 (0.0%) |
| 35 to 64 Years | 0 (0.0%) | 0 (0.0%) |
| 65 to 74 Years | 43 (39.8%) | 50 (48.1%) |
| 75 Years and over | 0 (0.0%) | 35 (72.9%) |
Disability Class: Cognitive Difficulty
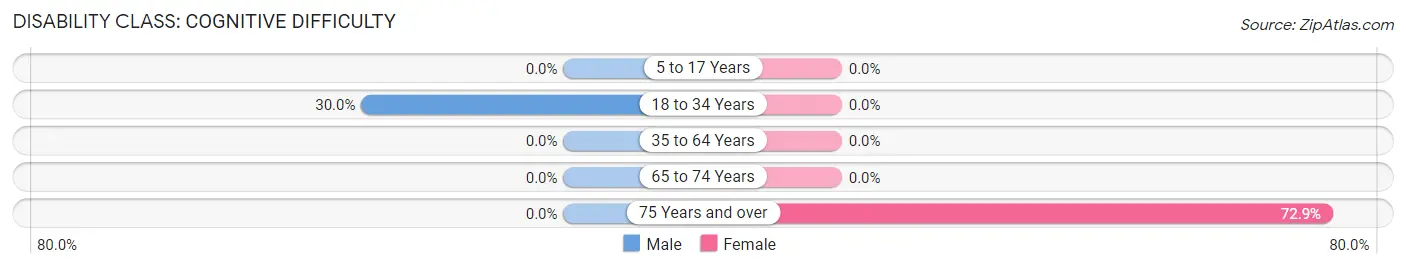
| Age Bracket | Male | Female |
| 5 to 17 Years | 0 (0.0%) | 0 (0.0%) |
| 18 to 34 Years | 18 (30.0%) | 0 (0.0%) |
| 35 to 64 Years | 0 (0.0%) | 0 (0.0%) |
| 65 to 74 Years | 0 (0.0%) | 0 (0.0%) |
| 75 Years and over | 0 (0.0%) | 35 (72.9%) |
Disability Class: Ambulatory Difficulty
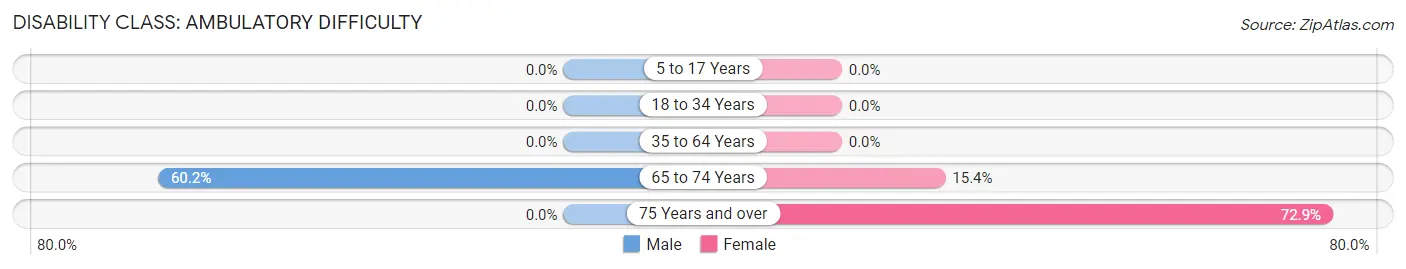
| Age Bracket | Male | Female |
| 5 to 17 Years | 0 (0.0%) | 0 (0.0%) |
| 18 to 34 Years | 0 (0.0%) | 0 (0.0%) |
| 35 to 64 Years | 0 (0.0%) | 0 (0.0%) |
| 65 to 74 Years | 65 (60.2%) | 16 (15.4%) |
| 75 Years and over | 0 (0.0%) | 35 (72.9%) |
Disability Class: Self-Care Difficulty
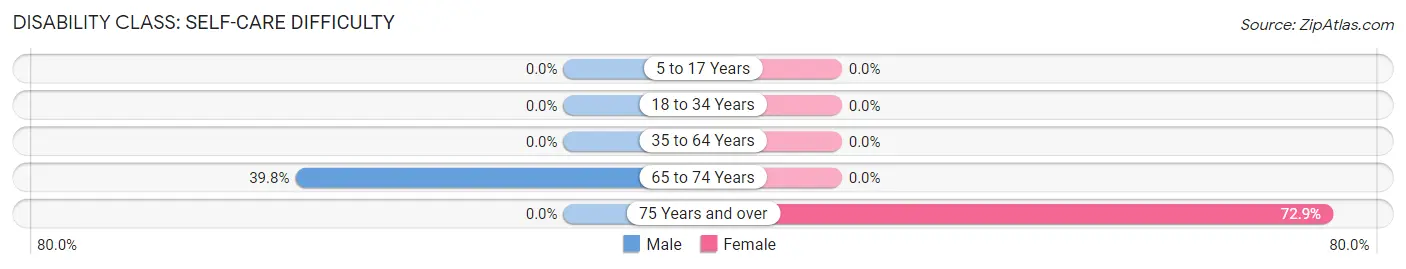
| Age Bracket | Male | Female |
| 5 to 17 Years | 0 (0.0%) | 0 (0.0%) |
| 18 to 34 Years | 0 (0.0%) | 0 (0.0%) |
| 35 to 64 Years | 0 (0.0%) | 0 (0.0%) |
| 65 to 74 Years | 43 (39.8%) | 0 (0.0%) |
| 75 Years and over | 0 (0.0%) | 35 (72.9%) |
Technology Access in Mokelumne Hill
Computing Device Access in Mokelumne Hill
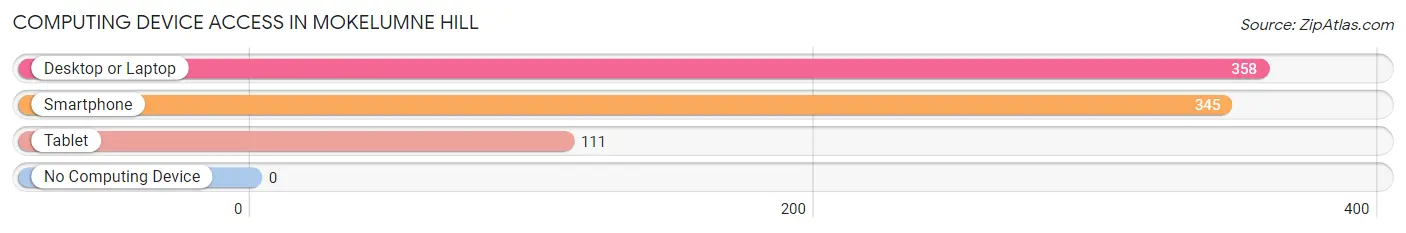
| Device Type | # Households | % Households |
| Desktop or Laptop | 358 | 96.8% |
| Smartphone | 345 | 93.2% |
| Tablet | 111 | 30.0% |
| No Computing Device | 0 | 0.0% |
| Total | 370 | 100.0% |
Internet Access in Mokelumne Hill
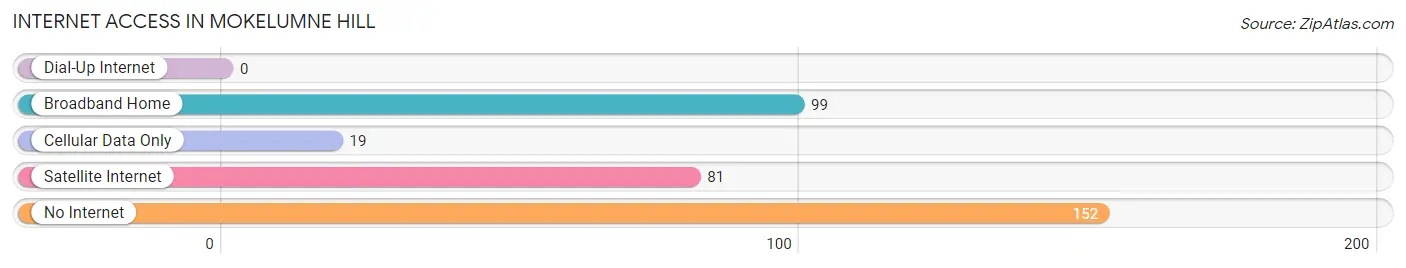
| Internet Type | # Households | % Households |
| Dial-Up Internet | 0 | 0.0% |
| Broadband Home | 99 | 26.8% |
| Cellular Data Only | 19 | 5.1% |
| Satellite Internet | 81 | 21.9% |
| No Internet | 152 | 41.1% |
| Total | 370 | 100.0% |
Mokelumne Hill Summary
Mokelumne Hill is a small town located in Calaveras County, California, United States. It is situated in the Sierra Nevada foothills, about 40 miles east of Stockton and 80 miles southeast of Sacramento. The town is located at an elevation of 2,000 feet and has a population of approximately 500 people.
History
Mokelumne Hill was founded in 1848 by a group of miners who were searching for gold in the area. The town was named after the Mokelumne River, which runs through the area. The town quickly grew and by 1851, it had a population of over 1,000 people. During the Gold Rush, Mokelumne Hill was a bustling center of commerce and was home to many businesses, including saloons, hotels, and stores.
In the late 19th century, the town began to decline as the gold rush ended and the population decreased. However, the town was revitalized in the early 20th century when the railroad arrived and the town became a popular tourist destination. The town was also home to a number of famous people, including Mark Twain, who wrote about his experiences in Mokelumne Hill in his book Roughing It.
Geography
Mokelumne Hill is located in the Sierra Nevada foothills, about 40 miles east of Stockton and 80 miles southeast of Sacramento. The town is situated at an elevation of 2,000 feet and is surrounded by rolling hills and oak trees. The town is located near the Mokelumne River, which runs through the area. The climate in Mokelumne Hill is mild, with hot summers and cool winters.
Economy
Mokelumne Hill is a small town with a limited economy. The town is home to a few small businesses, including restaurants, stores, and a post office. The town is also home to a number of tourist attractions, including the Mokelumne Hill Museum and the Mokelumne Hill Cemetery. The town is also home to a number of wineries, which produce a variety of wines.
Demographics
As of the 2010 census, Mokelumne Hill had a population of 500 people. The racial makeup of the town was 94.2% White, 0.6% African American, 0.2% Native American, 0.4% Asian, 0.2% Pacific Islander, and 4.4% from other races. The median household income in Mokelumne Hill was $41,250, and the median family income was $50,000. The town has a high rate of homeownership, with over 80% of the population owning their own homes.
Mokelumne Hill is a small town with a rich history and a unique culture. The town is home to a number of tourist attractions, including the Mokelumne Hill Museum and the Mokelumne Hill Cemetery. The town is also home to a number of wineries, which produce a variety of wines. The town has a diverse population and a strong economy, making it an ideal place to live and visit.
Common Questions
What is Per Capita Income in Mokelumne Hill?
Per Capita income in Mokelumne Hill is $42,415.
What is the Median Family Income in Mokelumne Hill?
Median Family Income in Mokelumne Hill is $82,182.
What is the Median Household income in Mokelumne Hill?
Median Household Income in Mokelumne Hill is $81,483.
What is Inequality or Gini Index in Mokelumne Hill?
Inequality or Gini Index in Mokelumne Hill is 0.29.
What is the Total Population of Mokelumne Hill?
Total Population of Mokelumne Hill is 808.
What is the Total Male Population of Mokelumne Hill?
Total Male Population of Mokelumne Hill is 374.
What is the Total Female Population of Mokelumne Hill?
Total Female Population of Mokelumne Hill is 434.
What is the Ratio of Males per 100 Females in Mokelumne Hill?
There are 86.18 Males per 100 Females in Mokelumne Hill.
What is the Ratio of Females per 100 Males in Mokelumne Hill?
There are 116.04 Females per 100 Males in Mokelumne Hill.
What is the Median Population Age in Mokelumne Hill?
Median Population Age in Mokelumne Hill is 61.8 Years.
What is the Average Family Size in Mokelumne Hill
Average Family Size in Mokelumne Hill is 2.4 People.
What is the Average Household Size in Mokelumne Hill
Average Household Size in Mokelumne Hill is 2.2 People.
How Large is the Labor Force in Mokelumne Hill?
There are 354 People in the Labor Forcein in Mokelumne Hill.
What is the Percentage of People in the Labor Force in Mokelumne Hill?
45.3% of People are in the Labor Force in Mokelumne Hill.