Zip Codes with the Highest Percentage of Population Employed in Architecture & Engineering in Rialto, CA
RELATED REPORTS & OPTIONS
Architecture & Engineering
Rialto
Compare Zip Codes
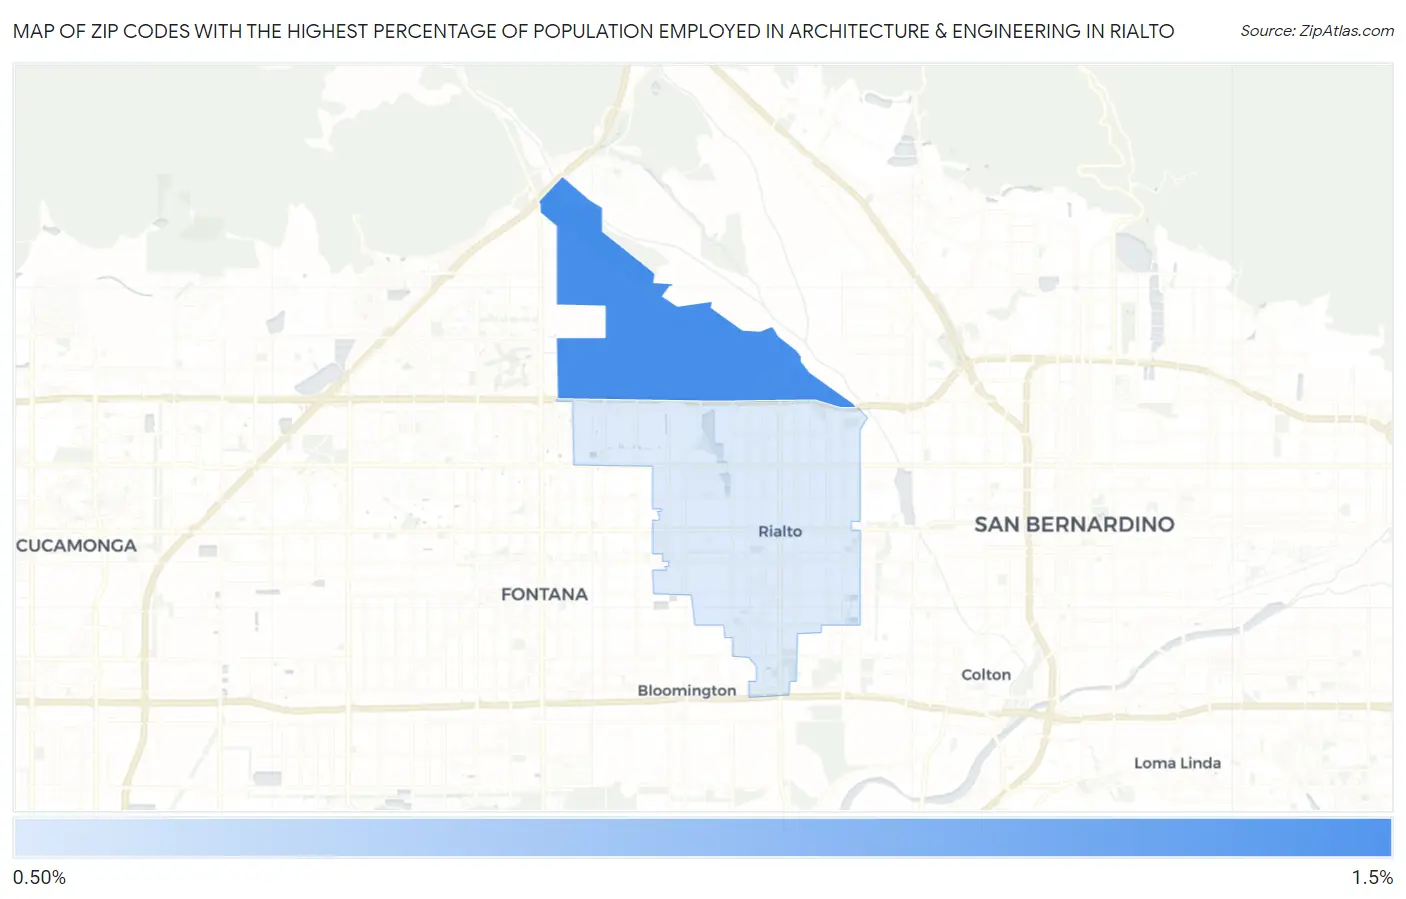
Map of Zip Codes with the Highest Percentage of Population Employed in Architecture & Engineering in Rialto
0.55%
1.0%
Zip Codes with the Highest Percentage of Population Employed in Architecture & Engineering in Rialto, CA
| Zip Code | % Employed | vs State | vs National | |
| 1. | 92377 | 1.0% | 2.6%(-1.54)#1,036 | 2.1%(-1.14)#16,498 |
| 2. | 92376 | 0.55% | 2.6%(-2.01)#1,206 | 2.1%(-1.60)#19,984 |
1
Common Questions
What are the Top Zip Codes with the Highest Percentage of Population Employed in Architecture & Engineering in Rialto, CA?
Top Zip Codes with the Highest Percentage of Population Employed in Architecture & Engineering in Rialto, CA are:
What zip code has the Highest Percentage of Population Employed in Architecture & Engineering in Rialto, CA?
92377 has the Highest Percentage of Population Employed in Architecture & Engineering in Rialto, CA with 1.0%.
What is the Percentage of Population Employed in Architecture & Engineering in Rialto, CA?
Percentage of Population Employed in Architecture & Engineering in Rialto is 0.61%.
What is the Percentage of Population Employed in Architecture & Engineering in California?
Percentage of Population Employed in Architecture & Engineering in California is 2.6%.
What is the Percentage of Population Employed in Architecture & Engineering in the United States?
Percentage of Population Employed in Architecture & Engineering in the United States is 2.1%.