Cities with the Highest Percentage of Population Employed in Architecture & Engineering in Tennessee
RELATED REPORTS & OPTIONS
Architecture & Engineering
Tennessee
Compare Cities
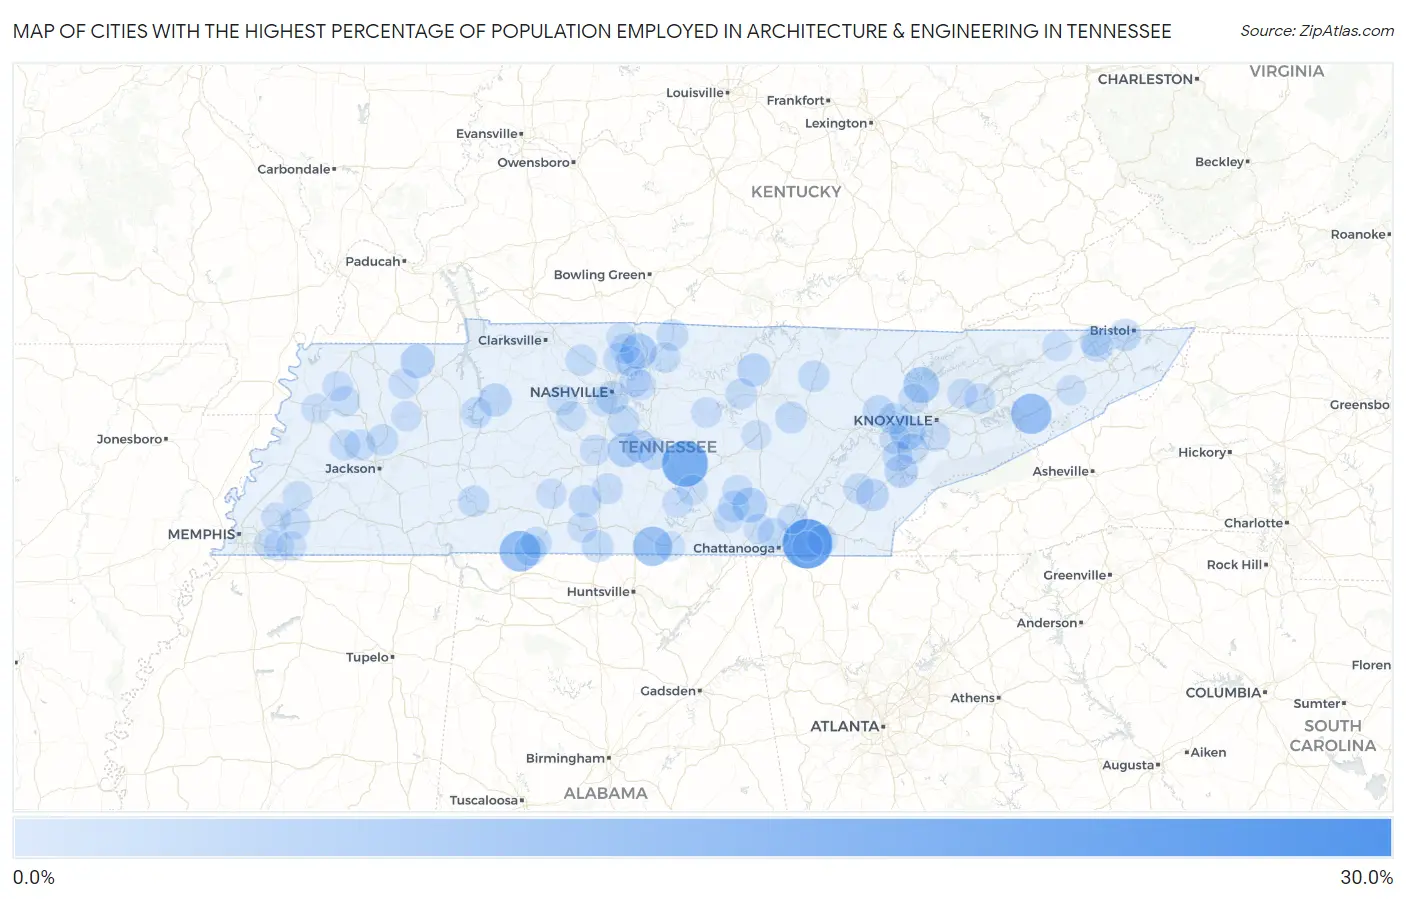
Map of Cities with the Highest Percentage of Population Employed in Architecture & Engineering in Tennessee
0.0%
30.0%
Cities with the Highest Percentage of Population Employed in Architecture & Engineering in Tennessee
| City | % Employed | vs State | vs National | |
| 1. | Taft | 29.3% | 1.7%(+27.7)#1 | 2.1%(+27.2)#60 |
| 2. | Norene | 26.5% | 1.7%(+24.9)#2 | 2.1%(+24.4)#75 |
| 3. | Sequatchie | 24.2% | 1.7%(+22.6)#3 | 2.1%(+22.1)#91 |
| 4. | Ooltewah | 23.3% | 1.7%(+21.6)#4 | 2.1%(+21.1)#99 |
| 5. | Lakewood Park | 19.3% | 1.7%(+17.6)#5 | 2.1%(+17.1)#141 |
| 6. | Huron | 18.9% | 1.7%(+17.3)#6 | 2.1%(+16.8)#148 |
| 7. | Iron City | 13.6% | 1.7%(+12.0)#7 | 2.1%(+11.5)#281 |
| 8. | Parrottsville | 13.0% | 1.7%(+11.3)#8 | 2.1%(+10.9)#304 |
| 9. | Holladay | 12.9% | 1.7%(+11.2)#9 | 2.1%(+10.8)#309 |
| 10. | Flintville | 11.9% | 1.7%(+10.3)#10 | 2.1%(+9.78)#357 |
| 11. | John Sevier | 11.8% | 1.7%(+10.1)#11 | 2.1%(+9.63)#368 |
| 12. | Wildersville | 11.6% | 1.7%(+9.93)#12 | 2.1%(+9.44)#384 |
| 13. | Norris | 8.5% | 1.7%(+6.87)#13 | 2.1%(+6.39)#635 |
| 14. | Shiloh | 8.5% | 1.7%(+6.82)#14 | 2.1%(+6.34)#641 |
| 15. | Cottontown | 8.2% | 1.7%(+6.56)#15 | 2.1%(+6.08)#679 |
| 16. | Orebank | 8.2% | 1.7%(+6.52)#16 | 2.1%(+6.03)#688 |
| 17. | Farragut | 7.3% | 1.7%(+5.64)#17 | 2.1%(+5.16)#843 |
| 18. | Palmer | 7.1% | 1.7%(+5.43)#18 | 2.1%(+4.95)#906 |
| 19. | Big Rock | 7.1% | 1.7%(+5.40)#19 | 2.1%(+4.92)#914 |
| 20. | Eagleville | 6.9% | 1.7%(+5.27)#20 | 2.1%(+4.79)#947 |
| 21. | Cottage Grove | 6.2% | 1.7%(+4.58)#21 | 2.1%(+4.10)#1,144 |
| 22. | Vonore | 5.8% | 1.7%(+4.16)#22 | 2.1%(+3.68)#1,327 |
| 23. | Dodson Branch | 5.7% | 1.7%(+4.02)#23 | 2.1%(+3.54)#1,401 |
| 24. | Waverly | 5.7% | 1.7%(+4.01)#24 | 2.1%(+3.53)#1,406 |
| 25. | Rockvale | 5.7% | 1.7%(+3.98)#25 | 2.1%(+3.50)#1,416 |
| 26. | Gladeville | 5.5% | 1.7%(+3.81)#26 | 2.1%(+3.33)#1,518 |
| 27. | Berry Hill | 5.2% | 1.7%(+3.49)#27 | 2.1%(+3.01)#1,732 |
| 28. | Englewood | 5.0% | 1.7%(+3.30)#28 | 2.1%(+2.82)#1,860 |
| 29. | Walnut Hill | 4.8% | 1.7%(+3.14)#29 | 2.1%(+2.66)#1,977 |
| 30. | Lynnville | 4.7% | 1.7%(+3.00)#30 | 2.1%(+2.52)#2,085 |
| 31. | Coalfield | 4.6% | 1.7%(+2.98)#31 | 2.1%(+2.49)#2,107 |
| 32. | Karns | 4.6% | 1.7%(+2.96)#32 | 2.1%(+2.48)#2,119 |
| 33. | Christiana | 4.6% | 1.7%(+2.93)#33 | 2.1%(+2.45)#2,148 |
| 34. | Oak Ridge | 4.4% | 1.7%(+2.69)#34 | 2.1%(+2.21)#2,353 |
| 35. | Pleasant Hill | 4.2% | 1.7%(+2.54)#35 | 2.1%(+2.06)#2,511 |
| 36. | Elkton | 4.2% | 1.7%(+2.50)#36 | 2.1%(+2.02)#2,563 |
| 37. | Signal Mountain | 4.1% | 1.7%(+2.38)#37 | 2.1%(+1.90)#2,710 |
| 38. | Nolensville | 4.0% | 1.7%(+2.37)#38 | 2.1%(+1.89)#2,724 |
| 39. | St Joseph | 4.0% | 1.7%(+2.32)#39 | 2.1%(+1.84)#2,790 |
| 40. | Westmoreland | 3.9% | 1.7%(+2.28)#40 | 2.1%(+1.79)#2,840 |
| 41. | Grimsley | 3.9% | 1.7%(+2.27)#41 | 2.1%(+1.79)#2,847 |
| 42. | Medina | 3.9% | 1.7%(+2.24)#42 | 2.1%(+1.76)#2,888 |
| 43. | Clifton | 3.8% | 1.7%(+2.17)#43 | 2.1%(+1.69)#2,970 |
| 44. | New Johnsonville | 3.8% | 1.7%(+2.16)#44 | 2.1%(+1.68)#2,974 |
| 45. | Coalmont | 3.7% | 1.7%(+2.08)#45 | 2.1%(+1.60)#3,092 |
| 46. | Pleasant View | 3.7% | 1.7%(+2.05)#46 | 2.1%(+1.56)#3,141 |
| 47. | Colonial Heights | 3.7% | 1.7%(+2.03)#47 | 2.1%(+1.55)#3,171 |
| 48. | Millersville | 3.6% | 1.7%(+1.89)#48 | 2.1%(+1.41)#3,415 |
| 49. | Loretto | 3.5% | 1.7%(+1.86)#49 | 2.1%(+1.38)#3,483 |
| 50. | Gadsden | 3.4% | 1.7%(+1.78)#50 | 2.1%(+1.30)#3,615 |
| 51. | Baxter | 3.4% | 1.7%(+1.77)#51 | 2.1%(+1.29)#3,648 |
| 52. | Oakland | 3.4% | 1.7%(+1.76)#52 | 2.1%(+1.28)#3,664 |
| 53. | Athens | 3.3% | 1.7%(+1.67)#53 | 2.1%(+1.19)#3,833 |
| 54. | Lenoir City | 3.3% | 1.7%(+1.63)#54 | 2.1%(+1.15)#3,907 |
| 55. | Lewisburg | 3.3% | 1.7%(+1.61)#55 | 2.1%(+1.13)#3,943 |
| 56. | Friendsville | 3.3% | 1.7%(+1.59)#56 | 2.1%(+1.11)#3,977 |
| 57. | Alamo | 3.2% | 1.7%(+1.57)#57 | 2.1%(+1.09)#4,025 |
| 58. | Castalian Springs | 3.2% | 1.7%(+1.51)#58 | 2.1%(+1.03)#4,150 |
| 59. | New Market | 3.1% | 1.7%(+1.44)#59 | 2.1%(+0.956)#4,325 |
| 60. | Yorkville | 3.0% | 1.7%(+1.38)#60 | 2.1%(+0.900)#4,462 |
| 61. | Kingsport | 3.0% | 1.7%(+1.36)#61 | 2.1%(+0.882)#4,490 |
| 62. | Tracy City | 3.0% | 1.7%(+1.33)#62 | 2.1%(+0.848)#4,591 |
| 63. | Manchester | 3.0% | 1.7%(+1.29)#63 | 2.1%(+0.804)#4,697 |
| 64. | Tullahoma | 2.9% | 1.7%(+1.27)#64 | 2.1%(+0.790)#4,739 |
| 65. | Rockford | 2.9% | 1.7%(+1.26)#65 | 2.1%(+0.778)#4,774 |
| 66. | Green Hill | 2.9% | 1.7%(+1.20)#66 | 2.1%(+0.714)#4,939 |
| 67. | Tellico Village | 2.9% | 1.7%(+1.19)#67 | 2.1%(+0.711)#4,952 |
| 68. | White Bluff | 2.9% | 1.7%(+1.18)#68 | 2.1%(+0.703)#4,981 |
| 69. | Blaine | 2.8% | 1.7%(+1.17)#69 | 2.1%(+0.692)#5,009 |
| 70. | Walnut Grove Cdp Sumner County | 2.8% | 1.7%(+1.14)#70 | 2.1%(+0.663)#5,082 |
| 71. | Trimble | 2.8% | 1.7%(+1.11)#71 | 2.1%(+0.629)#5,177 |
| 72. | Dowelltown | 2.8% | 1.7%(+1.11)#72 | 2.1%(+0.629)#5,184 |
| 73. | Spring Hill | 2.8% | 1.7%(+1.11)#73 | 2.1%(+0.628)#5,191 |
| 74. | Mclemoresville | 2.8% | 1.7%(+1.09)#74 | 2.1%(+0.609)#5,244 |
| 75. | South Cleveland | 2.8% | 1.7%(+1.09)#75 | 2.1%(+0.607)#5,252 |
| 76. | Summertown | 2.7% | 1.7%(+1.08)#76 | 2.1%(+0.598)#5,272 |
| 77. | Shackle Island | 2.7% | 1.7%(+1.07)#77 | 2.1%(+0.586)#5,306 |
| 78. | Clinton | 2.7% | 1.7%(+1.04)#78 | 2.1%(+0.559)#5,405 |
| 79. | Gleason | 2.7% | 1.7%(+1.03)#79 | 2.1%(+0.545)#5,448 |
| 80. | Beersheba Springs | 2.7% | 1.7%(+1.00)#80 | 2.1%(+0.523)#5,523 |
| 81. | Soddy Daisy | 2.6% | 1.7%(+0.956)#81 | 2.1%(+0.475)#5,661 |
| 82. | Pulaski | 2.6% | 1.7%(+0.948)#82 | 2.1%(+0.467)#5,683 |
| 83. | Fairview | 2.6% | 1.7%(+0.931)#83 | 2.1%(+0.449)#5,723 |
| 84. | Collierville | 2.6% | 1.7%(+0.929)#84 | 2.1%(+0.448)#5,731 |
| 85. | Powells Crossroads | 2.6% | 1.7%(+0.923)#85 | 2.1%(+0.441)#5,758 |
| 86. | White House | 2.6% | 1.7%(+0.917)#86 | 2.1%(+0.435)#5,777 |
| 87. | Collegedale | 2.5% | 1.7%(+0.873)#87 | 2.1%(+0.392)#5,917 |
| 88. | Beech Bluff | 2.5% | 1.7%(+0.870)#88 | 2.1%(+0.389)#5,924 |
| 89. | Mason | 2.5% | 1.7%(+0.867)#89 | 2.1%(+0.386)#5,936 |
| 90. | Doyle | 2.5% | 1.7%(+0.845)#90 | 2.1%(+0.363)#6,006 |
| 91. | Tusculum | 2.5% | 1.7%(+0.817)#91 | 2.1%(+0.335)#6,079 |
| 92. | Surgoinsville | 2.5% | 1.7%(+0.810)#92 | 2.1%(+0.328)#6,098 |
| 93. | Huntland | 2.5% | 1.7%(+0.806)#93 | 2.1%(+0.325)#6,113 |
| 94. | Belle Meade | 2.5% | 1.7%(+0.797)#94 | 2.1%(+0.315)#6,143 |
| 95. | Germantown | 2.4% | 1.7%(+0.776)#95 | 2.1%(+0.294)#6,213 |
| 96. | Piperton | 2.4% | 1.7%(+0.753)#96 | 2.1%(+0.272)#6,294 |
| 97. | Dyersburg | 2.4% | 1.7%(+0.742)#97 | 2.1%(+0.261)#6,339 |
| 98. | Mount Juliet | 2.4% | 1.7%(+0.741)#98 | 2.1%(+0.260)#6,350 |
| 99. | Lakeland | 2.4% | 1.7%(+0.730)#99 | 2.1%(+0.249)#6,390 |
| 100. | Cross Plains | 2.4% | 1.7%(+0.686)#100 | 2.1%(+0.205)#6,537 |
Common Questions
What are the Top 10 Cities with the Highest Percentage of Population Employed in Architecture & Engineering in Tennessee?
Top 10 Cities with the Highest Percentage of Population Employed in Architecture & Engineering in Tennessee are:
#1
23.3%
#2
19.3%
#3
13.6%
#4
13.0%
#5
11.9%
#6
8.5%
#7
8.2%
#8
7.3%
#9
7.1%
#10
6.9%
What city has the Highest Percentage of Population Employed in Architecture & Engineering in Tennessee?
Ooltewah has the Highest Percentage of Population Employed in Architecture & Engineering in Tennessee with 23.3%.
What is the Percentage of Population Employed in Architecture & Engineering in the State of Tennessee?
Percentage of Population Employed in Architecture & Engineering in Tennessee is 1.7%.
What is the Percentage of Population Employed in Architecture & Engineering in the United States?
Percentage of Population Employed in Architecture & Engineering in the United States is 2.1%.