Cities with the Highest Percentage of Population Employed in Architecture & Engineering in Colorado
RELATED REPORTS & OPTIONS
Architecture & Engineering
Colorado
Compare Cities
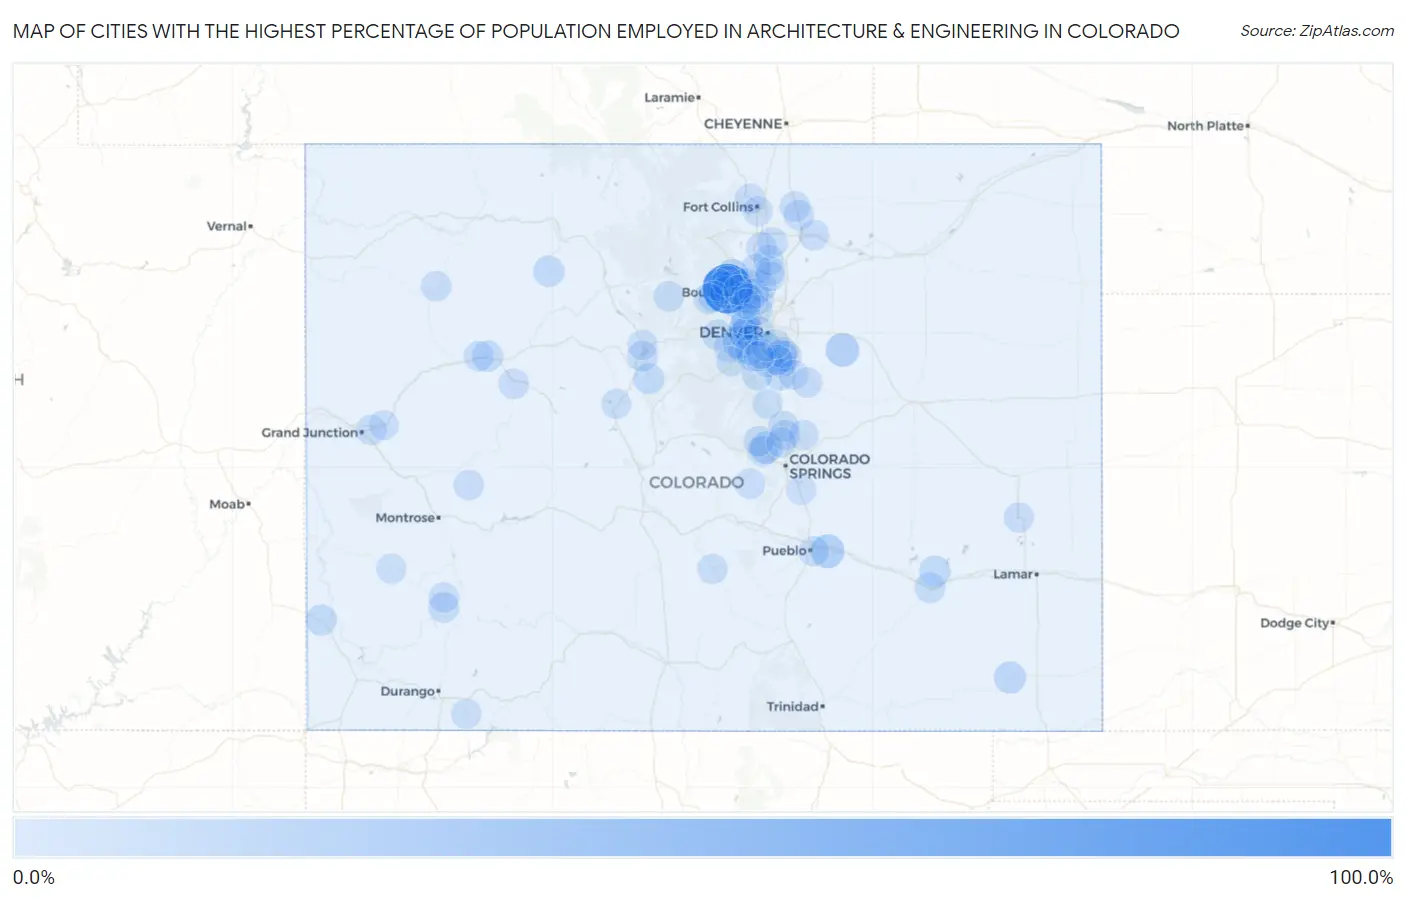
Map of Cities with the Highest Percentage of Population Employed in Architecture & Engineering in Colorado
0.0%
100.0%
Cities with the Highest Percentage of Population Employed in Architecture & Engineering in Colorado
| City | % Employed | vs State | vs National | |
| 1. | Seven Hills | 100.0% | 2.9%(+97.1)#1 | 2.1%(+97.9)#2 |
| 2. | Marvel | 25.0% | 2.9%(+22.1)#2 | 2.1%(+22.9)#87 |
| 3. | Vineland | 20.7% | 2.9%(+17.8)#3 | 2.1%(+18.6)#128 |
| 4. | Crisman | 19.5% | 2.9%(+16.5)#4 | 2.1%(+17.3)#139 |
| 5. | Comanche Creek | 18.9% | 2.9%(+16.0)#5 | 2.1%(+16.8)#149 |
| 6. | Pine Brook Hill | 16.2% | 2.9%(+13.3)#6 | 2.1%(+14.1)#196 |
| 7. | Tall Timber | 15.4% | 2.9%(+12.5)#7 | 2.1%(+13.2)#216 |
| 8. | Cascade Chipita Park | 14.6% | 2.9%(+11.6)#8 | 2.1%(+12.4)#245 |
| 9. | Altona | 12.1% | 2.9%(+9.19)#9 | 2.1%(+9.96)#347 |
| 10. | Gold Hill | 12.0% | 2.9%(+9.10)#10 | 2.1%(+9.87)#349 |
| 11. | Pritchett | 11.9% | 2.9%(+9.02)#11 | 2.1%(+9.79)#356 |
| 12. | Idledale | 11.2% | 2.9%(+8.28)#12 | 2.1%(+9.05)#405 |
| 13. | Inverness | 11.1% | 2.9%(+8.15)#13 | 2.1%(+8.92)#416 |
| 14. | Morrison | 10.4% | 2.9%(+7.50)#14 | 2.1%(+8.27)#458 |
| 15. | Sterling Ranch | 10.2% | 2.9%(+7.32)#15 | 2.1%(+8.10)#475 |
| 16. | Eldorado Springs | 8.9% | 2.9%(+6.02)#16 | 2.1%(+6.79)#587 |
| 17. | Cheraw | 8.9% | 2.9%(+5.97)#17 | 2.1%(+6.74)#593 |
| 18. | Chacra | 8.7% | 2.9%(+5.74)#18 | 2.1%(+6.51)#621 |
| 19. | Yampa | 8.5% | 2.9%(+5.54)#19 | 2.1%(+6.32)#644 |
| 20. | Castle Pines | 8.2% | 2.9%(+5.31)#20 | 2.1%(+6.08)#677 |
| 21. | Dove Creek | 7.6% | 2.9%(+4.72)#21 | 2.1%(+5.49)#783 |
| 22. | Blue River | 7.6% | 2.9%(+4.67)#22 | 2.1%(+5.44)#795 |
| 23. | Golden | 7.3% | 2.9%(+4.36)#23 | 2.1%(+5.13)#853 |
| 24. | La Junta Gardens | 7.1% | 2.9%(+4.22)#24 | 2.1%(+4.99)#895 |
| 25. | St Ann Highlands | 6.9% | 2.9%(+4.01)#25 | 2.1%(+4.78)#949 |
| 26. | Gunbarrel | 6.9% | 2.9%(+3.94)#26 | 2.1%(+4.72)#969 |
| 27. | Floyd Hill | 6.7% | 2.9%(+3.83)#27 | 2.1%(+4.60)#991 |
| 28. | Applewood | 6.7% | 2.9%(+3.81)#28 | 2.1%(+4.58)#994 |
| 29. | West Pleasant View | 6.6% | 2.9%(+3.69)#29 | 2.1%(+4.46)#1,017 |
| 30. | Paragon Estates | 6.6% | 2.9%(+3.64)#30 | 2.1%(+4.42)#1,032 |
| 31. | Ophir | 6.3% | 2.9%(+3.43)#31 | 2.1%(+4.20)#1,101 |
| 32. | Dove Valley | 6.3% | 2.9%(+3.42)#32 | 2.1%(+4.19)#1,104 |
| 33. | Lazy Acres | 6.3% | 2.9%(+3.39)#33 | 2.1%(+4.17)#1,110 |
| 34. | Woodmoor | 6.3% | 2.9%(+3.39)#34 | 2.1%(+4.16)#1,114 |
| 35. | Roxborough Park | 6.1% | 2.9%(+3.14)#35 | 2.1%(+3.91)#1,203 |
| 36. | Broomfield | 5.9% | 2.9%(+3.00)#36 | 2.1%(+3.77)#1,277 |
| 37. | Nederland | 5.9% | 2.9%(+2.98)#37 | 2.1%(+3.75)#1,287 |
| 38. | Frisco | 5.8% | 2.9%(+2.87)#38 | 2.1%(+3.64)#1,344 |
| 39. | Erie | 5.7% | 2.9%(+2.83)#39 | 2.1%(+3.60)#1,363 |
| 40. | Green Mountain Falls | 5.7% | 2.9%(+2.73)#40 | 2.1%(+3.51)#1,415 |
| 41. | Ken Caryl | 5.6% | 2.9%(+2.71)#41 | 2.1%(+3.48)#1,426 |
| 42. | Tabernash | 5.5% | 2.9%(+2.61)#42 | 2.1%(+3.38)#1,492 |
| 43. | Ault | 5.4% | 2.9%(+2.44)#43 | 2.1%(+3.21)#1,587 |
| 44. | Eaton | 5.2% | 2.9%(+2.32)#44 | 2.1%(+3.10)#1,670 |
| 45. | Woodland Park | 5.2% | 2.9%(+2.25)#45 | 2.1%(+3.02)#1,720 |
| 46. | Kersey | 5.2% | 2.9%(+2.24)#46 | 2.1%(+3.02)#1,723 |
| 47. | Gleneagle | 5.1% | 2.9%(+2.20)#47 | 2.1%(+2.97)#1,752 |
| 48. | Meeker | 4.9% | 2.9%(+2.01)#48 | 2.1%(+2.78)#1,882 |
| 49. | Louisville | 4.9% | 2.9%(+1.94)#49 | 2.1%(+2.71)#1,933 |
| 50. | Telluride | 4.8% | 2.9%(+1.90)#50 | 2.1%(+2.67)#1,968 |
| 51. | Berthoud | 4.8% | 2.9%(+1.86)#51 | 2.1%(+2.64)#1,989 |
| 52. | Crawford | 4.8% | 2.9%(+1.86)#52 | 2.1%(+2.63)#1,993 |
| 53. | Carbondale | 4.7% | 2.9%(+1.82)#53 | 2.1%(+2.60)#2,021 |
| 54. | Longmont | 4.7% | 2.9%(+1.79)#54 | 2.1%(+2.56)#2,046 |
| 55. | Highlands Ranch | 4.7% | 2.9%(+1.76)#55 | 2.1%(+2.54)#2,069 |
| 56. | Lafayette | 4.6% | 2.9%(+1.64)#56 | 2.1%(+2.42)#2,165 |
| 57. | Mead | 4.5% | 2.9%(+1.61)#57 | 2.1%(+2.38)#2,209 |
| 58. | Blende | 4.5% | 2.9%(+1.54)#58 | 2.1%(+2.31)#2,257 |
| 59. | Ponderosa Park | 4.4% | 2.9%(+1.47)#59 | 2.1%(+2.25)#2,318 |
| 60. | Lone Tree | 4.4% | 2.9%(+1.44)#60 | 2.1%(+2.21)#2,349 |
| 61. | Eads | 4.4% | 2.9%(+1.44)#61 | 2.1%(+2.21)#2,352 |
| 62. | New Castle | 4.4% | 2.9%(+1.44)#62 | 2.1%(+2.21)#2,355 |
| 63. | Victor | 4.3% | 2.9%(+1.35)#63 | 2.1%(+2.12)#2,435 |
| 64. | Clifton | 4.3% | 2.9%(+1.34)#64 | 2.1%(+2.11)#2,442 |
| 65. | Laporte | 4.2% | 2.9%(+1.23)#65 | 2.1%(+2.00)#2,588 |
| 66. | Centennial | 4.1% | 2.9%(+1.22)#66 | 2.1%(+2.00)#2,597 |
| 67. | Fairmount | 4.1% | 2.9%(+1.22)#67 | 2.1%(+1.99)#2,601 |
| 68. | Stepping Stone | 4.1% | 2.9%(+1.21)#68 | 2.1%(+1.98)#2,613 |
| 69. | Acres Green | 4.1% | 2.9%(+1.21)#69 | 2.1%(+1.98)#2,614 |
| 70. | Johnstown | 4.1% | 2.9%(+1.15)#70 | 2.1%(+1.93)#2,678 |
| 71. | Westcliffe | 4.1% | 2.9%(+1.15)#71 | 2.1%(+1.92)#2,680 |
| 72. | Boulder | 4.1% | 2.9%(+1.14)#72 | 2.1%(+1.91)#2,696 |
| 73. | Lakewood | 4.0% | 2.9%(+1.09)#73 | 2.1%(+1.86)#2,759 |
| 74. | Arvada | 4.0% | 2.9%(+1.07)#74 | 2.1%(+1.85)#2,780 |
| 75. | Evergreen | 4.0% | 2.9%(+1.06)#75 | 2.1%(+1.83)#2,797 |
| 76. | Fort Collins | 3.9% | 2.9%(+0.996)#76 | 2.1%(+1.77)#2,875 |
| 77. | Frederick | 3.9% | 2.9%(+0.977)#77 | 2.1%(+1.75)#2,903 |
| 78. | Dakota Ridge | 3.9% | 2.9%(+0.934)#78 | 2.1%(+1.71)#2,950 |
| 79. | Edgewater | 3.8% | 2.9%(+0.873)#79 | 2.1%(+1.65)#3,029 |
| 80. | Ignacio | 3.7% | 2.9%(+0.818)#80 | 2.1%(+1.59)#3,105 |
| 81. | Leadville North | 3.7% | 2.9%(+0.789)#81 | 2.1%(+1.56)#3,149 |
| 82. | Black Forest | 3.7% | 2.9%(+0.786)#82 | 2.1%(+1.56)#3,153 |
| 83. | Air Force Academy | 3.7% | 2.9%(+0.767)#83 | 2.1%(+1.54)#3,194 |
| 84. | Silverthorne | 3.6% | 2.9%(+0.682)#84 | 2.1%(+1.45)#3,338 |
| 85. | Columbine Valley | 3.6% | 2.9%(+0.650)#85 | 2.1%(+1.42)#3,386 |
| 86. | Norwood | 3.6% | 2.9%(+0.650)#86 | 2.1%(+1.42)#3,390 |
| 87. | Westminster | 3.6% | 2.9%(+0.638)#87 | 2.1%(+1.41)#3,421 |
| 88. | Placerville | 3.6% | 2.9%(+0.634)#88 | 2.1%(+1.41)#3,427 |
| 89. | Fountain | 3.5% | 2.9%(+0.594)#89 | 2.1%(+1.37)#3,500 |
| 90. | Firestone | 3.5% | 2.9%(+0.584)#90 | 2.1%(+1.36)#3,525 |
| 91. | Englewood | 3.5% | 2.9%(+0.559)#91 | 2.1%(+1.33)#3,563 |
| 92. | Palisade | 3.5% | 2.9%(+0.557)#92 | 2.1%(+1.33)#3,565 |
| 93. | The Pinery | 3.4% | 2.9%(+0.495)#93 | 2.1%(+1.27)#3,691 |
| 94. | Four Square Mile | 3.4% | 2.9%(+0.482)#94 | 2.1%(+1.25)#3,710 |
| 95. | Superior | 3.4% | 2.9%(+0.458)#95 | 2.1%(+1.23)#3,757 |
| 96. | Holly Hills | 3.4% | 2.9%(+0.438)#96 | 2.1%(+1.21)#3,804 |
| 97. | Aspen Park | 3.3% | 2.9%(+0.418)#97 | 2.1%(+1.19)#3,834 |
| 98. | Sierra Ridge | 3.3% | 2.9%(+0.345)#98 | 2.1%(+1.12)#3,954 |
| 99. | Columbine | 3.2% | 2.9%(+0.317)#99 | 2.1%(+1.09)#4,024 |
| 100. | Perry Park | 3.2% | 2.9%(+0.297)#100 | 2.1%(+1.07)#4,063 |
Common Questions
What are the Top 10 Cities with the Highest Percentage of Population Employed in Architecture & Engineering in Colorado?
Top 10 Cities with the Highest Percentage of Population Employed in Architecture & Engineering in Colorado are:
#1
100.0%
#2
20.7%
#3
19.5%
#4
18.9%
#5
16.2%
#6
15.4%
#7
14.6%
#8
12.1%
#9
12.0%
#10
11.9%
What city has the Highest Percentage of Population Employed in Architecture & Engineering in Colorado?
Seven Hills has the Highest Percentage of Population Employed in Architecture & Engineering in Colorado with 100.0%.
What is the Percentage of Population Employed in Architecture & Engineering in the State of Colorado?
Percentage of Population Employed in Architecture & Engineering in Colorado is 2.9%.
What is the Percentage of Population Employed in Architecture & Engineering in the United States?
Percentage of Population Employed in Architecture & Engineering in the United States is 2.1%.