Cities with the Highest Percentage of Population Employed in Architecture & Engineering in Arkansas
RELATED REPORTS & OPTIONS
Architecture & Engineering
Arkansas
Compare Cities
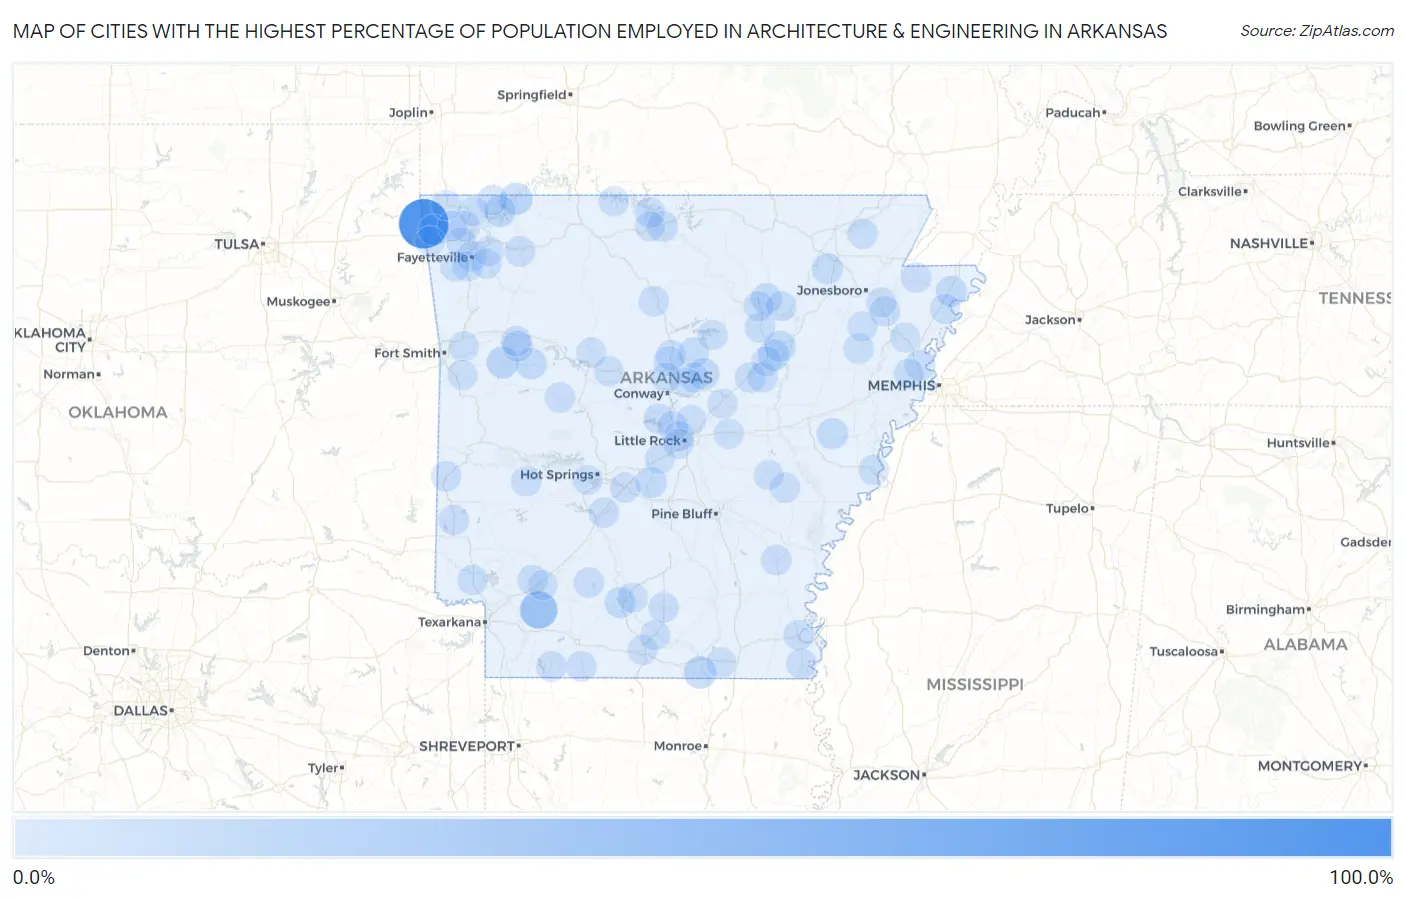
Map of Cities with the Highest Percentage of Population Employed in Architecture & Engineering in Arkansas
0.0%
100.0%
Cities with the Highest Percentage of Population Employed in Architecture & Engineering in Arkansas
| City | % Employed | vs State | vs National | |
| 1. | Cherokee City | 100.0% | 1.3%(+98.7)#1 | 2.1%(+97.9)#7 |
| 2. | Patmos | 36.4% | 1.3%(+35.1)#2 | 2.1%(+34.2)#45 |
| 3. | Bismarck | 15.2% | 1.3%(+13.9)#3 | 2.1%(+13.0)#226 |
| 4. | Felsenthal | 12.5% | 1.3%(+11.2)#4 | 2.1%(+10.4)#333 |
| 5. | Beaver | 11.1% | 1.3%(+9.84)#5 | 2.1%(+8.96)#412 |
| 6. | Ratcliff | 10.6% | 1.3%(+9.34)#6 | 2.1%(+8.46)#444 |
| 7. | Lost Bridge Village | 8.4% | 1.3%(+7.13)#7 | 2.1%(+6.25)#650 |
| 8. | Mount Vernon | 8.0% | 1.3%(+6.78)#8 | 2.1%(+5.90)#717 |
| 9. | Russell | 7.1% | 1.3%(+5.87)#9 | 2.1%(+4.99)#893 |
| 10. | Moro | 6.7% | 1.3%(+5.40)#10 | 2.1%(+4.52)#1,001 |
| 11. | Camden | 6.4% | 1.3%(+5.11)#11 | 2.1%(+4.23)#1,092 |
| 12. | Gentry | 6.3% | 1.3%(+5.01)#12 | 2.1%(+4.13)#1,125 |
| 13. | Tull | 6.1% | 1.3%(+4.79)#13 | 2.1%(+3.91)#1,205 |
| 14. | Subiaco | 6.0% | 1.3%(+4.77)#14 | 2.1%(+3.89)#1,218 |
| 15. | Burdette | 6.0% | 1.3%(+4.70)#15 | 2.1%(+3.82)#1,251 |
| 16. | Minturn | 5.9% | 1.3%(+4.61)#16 | 2.1%(+3.73)#1,301 |
| 17. | Moorefield | 5.7% | 1.3%(+4.39)#17 | 2.1%(+3.51)#1,413 |
| 18. | Bradford | 5.5% | 1.3%(+4.22)#18 | 2.1%(+3.35)#1,511 |
| 19. | Denning | 5.3% | 1.3%(+3.99)#19 | 2.1%(+3.11)#1,651 |
| 20. | Gassville | 5.0% | 1.3%(+3.77)#20 | 2.1%(+2.90)#1,803 |
| 21. | Floyd | 4.6% | 1.3%(+3.34)#21 | 2.1%(+2.46)#2,134 |
| 22. | Genoa | 4.4% | 1.3%(+3.09)#22 | 2.1%(+2.21)#2,348 |
| 23. | Newhope | 4.1% | 1.3%(+2.81)#23 | 2.1%(+1.93)#2,663 |
| 24. | Pleasant Plains | 3.9% | 1.3%(+2.63)#24 | 2.1%(+1.75)#2,906 |
| 25. | Huntsville | 3.8% | 1.3%(+2.53)#25 | 2.1%(+1.65)#3,020 |
| 26. | Quitman | 3.8% | 1.3%(+2.52)#26 | 2.1%(+1.64)#3,030 |
| 27. | Clarkedale | 3.7% | 1.3%(+2.42)#27 | 2.1%(+1.54)#3,196 |
| 28. | Dumas | 3.7% | 1.3%(+2.40)#28 | 2.1%(+1.52)#3,224 |
| 29. | Bluff City | 3.6% | 1.3%(+2.30)#29 | 2.1%(+1.42)#3,394 |
| 30. | Gillham | 3.4% | 1.3%(+2.18)#30 | 2.1%(+1.30)#3,619 |
| 31. | Altus | 3.4% | 1.3%(+2.11)#31 | 2.1%(+1.23)#3,754 |
| 32. | Leachville | 3.4% | 1.3%(+2.11)#32 | 2.1%(+1.23)#3,765 |
| 33. | Higginson | 3.3% | 1.3%(+2.06)#33 | 2.1%(+1.18)#3,843 |
| 34. | Oakhaven | 3.2% | 1.3%(+1.96)#34 | 2.1%(+1.08)#4,058 |
| 35. | Taylor | 3.2% | 1.3%(+1.94)#35 | 2.1%(+1.06)#4,076 |
| 36. | Dennard | 3.2% | 1.3%(+1.94)#36 | 2.1%(+1.06)#4,086 |
| 37. | Norman | 3.2% | 1.3%(+1.92)#37 | 2.1%(+1.04)#4,119 |
| 38. | Roland | 3.2% | 1.3%(+1.90)#38 | 2.1%(+1.02)#4,169 |
| 39. | Emerson | 3.1% | 1.3%(+1.85)#39 | 2.1%(+0.976)#4,278 |
| 40. | Maumelle | 3.1% | 1.3%(+1.83)#40 | 2.1%(+0.953)#4,330 |
| 41. | Lake Village | 3.0% | 1.3%(+1.75)#41 | 2.1%(+0.870)#4,538 |
| 42. | Danville | 3.0% | 1.3%(+1.70)#42 | 2.1%(+0.818)#4,662 |
| 43. | Hampton | 2.9% | 1.3%(+1.63)#43 | 2.1%(+0.749)#4,847 |
| 44. | Eudora | 2.8% | 1.3%(+1.57)#44 | 2.1%(+0.695)#5,001 |
| 45. | Hatfield | 2.8% | 1.3%(+1.52)#45 | 2.1%(+0.640)#5,151 |
| 46. | Cave Springs | 2.8% | 1.3%(+1.49)#46 | 2.1%(+0.611)#5,235 |
| 47. | Cammack Village | 2.7% | 1.3%(+1.45)#47 | 2.1%(+0.576)#5,341 |
| 48. | Cherry Valley | 2.7% | 1.3%(+1.42)#48 | 2.1%(+0.543)#5,453 |
| 49. | Rockport | 2.6% | 1.3%(+1.37)#49 | 2.1%(+0.496)#5,595 |
| 50. | Helena West Helena | 2.6% | 1.3%(+1.34)#50 | 2.1%(+0.460)#5,700 |
| 51. | Delaplaine | 2.6% | 1.3%(+1.29)#51 | 2.1%(+0.415)#5,848 |
| 52. | Trumann | 2.5% | 1.3%(+1.27)#52 | 2.1%(+0.387)#5,929 |
| 53. | Wilton | 2.5% | 1.3%(+1.19)#53 | 2.1%(+0.310)#6,165 |
| 54. | West Point | 2.4% | 1.3%(+1.17)#54 | 2.1%(+0.290)#6,231 |
| 55. | Bull Shoals | 2.3% | 1.3%(+1.06)#55 | 2.1%(+0.181)#6,626 |
| 56. | Damascus | 2.3% | 1.3%(+1.05)#56 | 2.1%(+0.176)#6,644 |
| 57. | Crawfordsville | 2.3% | 1.3%(+1.03)#57 | 2.1%(+0.155)#6,728 |
| 58. | Garfield | 2.3% | 1.3%(+1.02)#58 | 2.1%(+0.144)#6,767 |
| 59. | Tontitown | 2.3% | 1.3%(+1.02)#59 | 2.1%(+0.137)#6,786 |
| 60. | Fayetteville | 2.3% | 1.3%(+0.996)#60 | 2.1%(+0.118)#6,874 |
| 61. | Newark | 2.3% | 1.3%(+0.983)#61 | 2.1%(+0.105)#6,917 |
| 62. | Friendship | 2.2% | 1.3%(+0.976)#62 | 2.1%(+0.098)#6,947 |
| 63. | Almyra | 2.2% | 1.3%(+0.951)#63 | 2.1%(+0.073)#7,043 |
| 64. | Little Rock | 2.2% | 1.3%(+0.930)#64 | 2.1%(+0.052)#7,120 |
| 65. | Greenland | 2.2% | 1.3%(+0.908)#65 | 2.1%(+0.030)#7,210 |
| 66. | Twin Groves | 2.2% | 1.3%(+0.903)#66 | 2.1%(+0.025)#7,243 |
| 67. | Gibson | 2.1% | 1.3%(+0.874)#67 | 2.1%(-0.004)#7,353 |
| 68. | Elkins | 2.1% | 1.3%(+0.851)#68 | 2.1%(-0.027)#7,424 |
| 69. | Heber Springs | 2.1% | 1.3%(+0.798)#69 | 2.1%(-0.080)#7,653 |
| 70. | Highfill | 2.0% | 1.3%(+0.764)#70 | 2.1%(-0.115)#7,800 |
| 71. | El Dorado | 2.0% | 1.3%(+0.749)#71 | 2.1%(-0.130)#7,859 |
| 72. | East Camden | 2.0% | 1.3%(+0.741)#72 | 2.1%(-0.137)#7,886 |
| 73. | Bryant | 2.0% | 1.3%(+0.740)#73 | 2.1%(-0.138)#7,892 |
| 74. | Dover | 2.0% | 1.3%(+0.733)#74 | 2.1%(-0.146)#7,918 |
| 75. | Bay | 2.0% | 1.3%(+0.710)#75 | 2.1%(-0.168)#8,001 |
| 76. | Little Flock | 2.0% | 1.3%(+0.701)#76 | 2.1%(-0.178)#8,034 |
| 77. | Atkins | 1.9% | 1.3%(+0.642)#77 | 2.1%(-0.237)#8,255 |
| 78. | Lonoke | 1.9% | 1.3%(+0.630)#78 | 2.1%(-0.248)#8,312 |
| 79. | Tyronza | 1.8% | 1.3%(+0.491)#79 | 2.1%(-0.387)#8,927 |
| 80. | Prairie Grove | 1.7% | 1.3%(+0.461)#80 | 2.1%(-0.417)#9,081 |
| 81. | Calion | 1.7% | 1.3%(+0.443)#81 | 2.1%(-0.435)#9,158 |
| 82. | Holland | 1.6% | 1.3%(+0.374)#82 | 2.1%(-0.504)#9,484 |
| 83. | Osceola | 1.6% | 1.3%(+0.340)#83 | 2.1%(-0.538)#9,673 |
| 84. | Diamond City | 1.6% | 1.3%(+0.338)#84 | 2.1%(-0.541)#9,680 |
| 85. | Crossett | 1.6% | 1.3%(+0.317)#85 | 2.1%(-0.562)#9,767 |
| 86. | Kibler | 1.6% | 1.3%(+0.309)#86 | 2.1%(-0.569)#9,798 |
| 87. | Goshen | 1.6% | 1.3%(+0.296)#87 | 2.1%(-0.583)#9,862 |
| 88. | Flippin | 1.6% | 1.3%(+0.292)#88 | 2.1%(-0.587)#9,885 |
| 89. | Perrytown | 1.6% | 1.3%(+0.292)#89 | 2.1%(-0.587)#9,894 |
| 90. | Ward | 1.5% | 1.3%(+0.269)#90 | 2.1%(-0.610)#10,024 |
| 91. | Stuttgart | 1.5% | 1.3%(+0.245)#91 | 2.1%(-0.634)#10,136 |
| 92. | Rockwell | 1.5% | 1.3%(+0.227)#92 | 2.1%(-0.652)#10,206 |
| 93. | Harrisburg | 1.5% | 1.3%(+0.200)#93 | 2.1%(-0.679)#10,367 |
| 94. | Wooster | 1.4% | 1.3%(+0.170)#94 | 2.1%(-0.709)#10,532 |
| 95. | Bald Knob | 1.4% | 1.3%(+0.147)#95 | 2.1%(-0.732)#10,631 |
| 96. | Gravette | 1.4% | 1.3%(+0.130)#96 | 2.1%(-0.748)#10,719 |
| 97. | Siloam Springs | 1.4% | 1.3%(+0.120)#97 | 2.1%(-0.758)#10,775 |
| 98. | Enola | 1.4% | 1.3%(+0.118)#98 | 2.1%(-0.760)#10,787 |
| 99. | Southside | 1.4% | 1.3%(+0.116)#99 | 2.1%(-0.763)#10,796 |
| 100. | Greenwood | 1.4% | 1.3%(+0.110)#100 | 2.1%(-0.768)#10,819 |
Common Questions
What are the Top 10 Cities with the Highest Percentage of Population Employed in Architecture & Engineering in Arkansas?
Top 10 Cities with the Highest Percentage of Population Employed in Architecture & Engineering in Arkansas are:
#1
100.0%
#2
36.4%
#3
12.5%
#4
11.1%
#5
10.6%
#6
8.4%
#7
8.0%
#8
7.1%
#9
6.7%
#10
6.4%
What city has the Highest Percentage of Population Employed in Architecture & Engineering in Arkansas?
Cherokee City has the Highest Percentage of Population Employed in Architecture & Engineering in Arkansas with 100.0%.
What is the Percentage of Population Employed in Architecture & Engineering in the State of Arkansas?
Percentage of Population Employed in Architecture & Engineering in Arkansas is 1.3%.
What is the Percentage of Population Employed in Architecture & Engineering in the United States?
Percentage of Population Employed in Architecture & Engineering in the United States is 2.1%.