Cities with the Highest Percentage of Population Employed in Architecture & Engineering in Mississippi
RELATED REPORTS & OPTIONS
Architecture & Engineering
Mississippi
Compare Cities
Map of Cities with the Highest Percentage of Population Employed in Architecture & Engineering in Mississippi
0.0%
50.0%
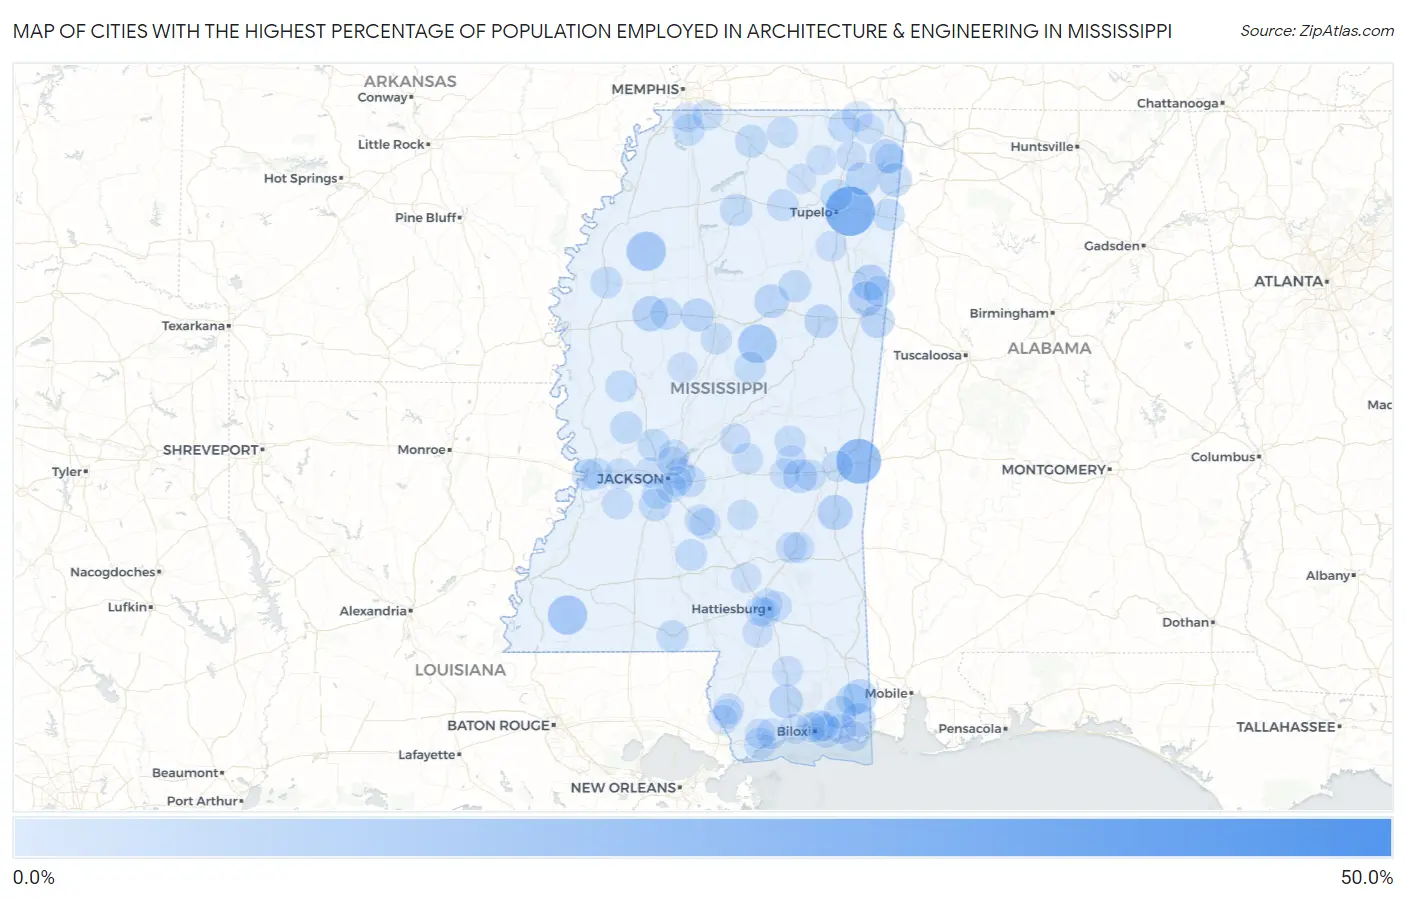
Cities with the Highest Percentage of Population Employed in Architecture & Engineering in Mississippi
| City | % Employed | vs State | vs National | |
| 1. | Bolivar | 41.7% | 1.5%(+40.2)#1 | 2.1%(+39.5)#36 |
| 2. | Mooreville | 24.3% | 1.5%(+22.8)#2 | 2.1%(+22.2)#90 |
| 3. | Toomsuba | 18.5% | 1.5%(+17.0)#3 | 2.1%(+16.4)#154 |
| 4. | Bond | 15.1% | 1.5%(+13.6)#4 | 2.1%(+12.9)#228 |
| 5. | Sumner | 12.0% | 1.5%(+10.5)#5 | 2.1%(+9.85)#351 |
| 6. | Crosby | 11.9% | 1.5%(+10.4)#6 | 2.1%(+9.72)#364 |
| 7. | Benton | 11.6% | 1.5%(+10.1)#7 | 2.1%(+9.46)#381 |
| 8. | French Camp | 11.1% | 1.5%(+9.62)#8 | 2.1%(+8.96)#408 |
| 9. | Hamilton | 7.8% | 1.5%(+6.34)#9 | 2.1%(+5.68)#750 |
| 10. | Mississippi Valley State University | 7.3% | 1.5%(+5.82)#10 | 2.1%(+5.16)#846 |
| 11. | Quitman | 7.0% | 1.5%(+5.53)#11 | 2.1%(+4.87)#924 |
| 12. | Columbus Afb | 7.0% | 1.5%(+5.47)#12 | 2.1%(+4.81)#937 |
| 13. | Hurley | 6.0% | 1.5%(+4.51)#13 | 2.1%(+3.85)#1,237 |
| 14. | Paden | 5.7% | 1.5%(+4.23)#14 | 2.1%(+3.57)#1,383 |
| 15. | Hickory | 5.6% | 1.5%(+4.10)#15 | 2.1%(+3.44)#1,455 |
| 16. | Walthall | 5.6% | 1.5%(+4.07)#16 | 2.1%(+3.41)#1,478 |
| 17. | Helena | 5.5% | 1.5%(+4.04)#17 | 2.1%(+3.38)#1,494 |
| 18. | Starkville | 5.5% | 1.5%(+4.03)#18 | 2.1%(+3.37)#1,501 |
| 19. | Golden | 5.5% | 1.5%(+4.02)#19 | 2.1%(+3.36)#1,505 |
| 20. | New Hope | 5.4% | 1.5%(+3.90)#20 | 2.1%(+3.24)#1,570 |
| 21. | Saucier | 5.3% | 1.5%(+3.78)#21 | 2.1%(+3.11)#1,646 |
| 22. | Carrollton | 5.0% | 1.5%(+3.51)#22 | 2.1%(+2.85)#1,834 |
| 23. | Marietta | 5.0% | 1.5%(+3.51)#23 | 2.1%(+2.85)#1,840 |
| 24. | Ocean Springs | 4.6% | 1.5%(+3.07)#24 | 2.1%(+2.41)#2,174 |
| 25. | Vancleave | 4.2% | 1.5%(+2.75)#25 | 2.1%(+2.08)#2,475 |
| 26. | Wade | 4.2% | 1.5%(+2.73)#26 | 2.1%(+2.07)#2,501 |
| 27. | Holly Springs | 4.2% | 1.5%(+2.70)#27 | 2.1%(+2.03)#2,546 |
| 28. | Terry | 4.1% | 1.5%(+2.65)#28 | 2.1%(+1.99)#2,602 |
| 29. | St Martin | 4.1% | 1.5%(+2.63)#29 | 2.1%(+1.97)#2,628 |
| 30. | Taylor | 4.0% | 1.5%(+2.54)#30 | 2.1%(+1.88)#2,740 |
| 31. | Flora | 4.0% | 1.5%(+2.50)#31 | 2.1%(+1.84)#2,792 |
| 32. | Mantee | 4.0% | 1.5%(+2.47)#32 | 2.1%(+1.81)#2,820 |
| 33. | Satartia | 3.7% | 1.5%(+2.22)#33 | 2.1%(+1.55)#3,167 |
| 34. | Greenwood | 3.5% | 1.5%(+2.05)#34 | 2.1%(+1.38)#3,470 |
| 35. | Tylertown | 3.5% | 1.5%(+2.01)#35 | 2.1%(+1.35)#3,533 |
| 36. | Tremont | 3.5% | 1.5%(+1.99)#36 | 2.1%(+1.33)#3,568 |
| 37. | Bay St Louis | 3.5% | 1.5%(+1.99)#37 | 2.1%(+1.33)#3,569 |
| 38. | Saltillo | 3.5% | 1.5%(+1.97)#38 | 2.1%(+1.30)#3,598 |
| 39. | Louise | 3.3% | 1.5%(+1.85)#39 | 2.1%(+1.18)#3,853 |
| 40. | New Hebron | 3.3% | 1.5%(+1.83)#40 | 2.1%(+1.17)#3,882 |
| 41. | Cleveland | 3.2% | 1.5%(+1.75)#41 | 2.1%(+1.08)#4,030 |
| 42. | Kossuth | 3.2% | 1.5%(+1.74)#42 | 2.1%(+1.08)#4,053 |
| 43. | Brandon | 3.2% | 1.5%(+1.72)#43 | 2.1%(+1.06)#4,079 |
| 44. | Hernando | 3.1% | 1.5%(+1.64)#44 | 2.1%(+0.978)#4,267 |
| 45. | Thaxton | 3.1% | 1.5%(+1.57)#45 | 2.1%(+0.909)#4,427 |
| 46. | Beechwood | 3.1% | 1.5%(+1.56)#46 | 2.1%(+0.901)#4,452 |
| 47. | Ethel | 3.0% | 1.5%(+1.54)#47 | 2.1%(+0.881)#4,499 |
| 48. | Vicksburg | 3.0% | 1.5%(+1.51)#48 | 2.1%(+0.845)#4,598 |
| 49. | Vaiden | 2.8% | 1.5%(+1.33)#49 | 2.1%(+0.668)#5,063 |
| 50. | Hillsboro | 2.7% | 1.5%(+1.24)#50 | 2.1%(+0.581)#5,320 |
| 51. | Utica | 2.7% | 1.5%(+1.22)#51 | 2.1%(+0.562)#5,393 |
| 52. | Flowood | 2.7% | 1.5%(+1.18)#52 | 2.1%(+0.521)#5,526 |
| 53. | Gluckstadt | 2.6% | 1.5%(+1.14)#53 | 2.1%(+0.481)#5,646 |
| 54. | Mendenhall | 2.6% | 1.5%(+1.08)#54 | 2.1%(+0.420)#5,825 |
| 55. | Chunky | 2.5% | 1.5%(+1.03)#55 | 2.1%(+0.372)#5,985 |
| 56. | Byram | 2.5% | 1.5%(+1.01)#56 | 2.1%(+0.351)#6,039 |
| 57. | Caledonia | 2.4% | 1.5%(+0.943)#57 | 2.1%(+0.281)#6,263 |
| 58. | D Lo | 2.4% | 1.5%(+0.894)#58 | 2.1%(+0.232)#6,444 |
| 59. | Union | 2.4% | 1.5%(+0.881)#59 | 2.1%(+0.219)#6,480 |
| 60. | Meridian | 2.4% | 1.5%(+0.864)#60 | 2.1%(+0.202)#6,547 |
| 61. | Sharon | 2.3% | 1.5%(+0.836)#61 | 2.1%(+0.174)#6,654 |
| 62. | Ashland | 2.3% | 1.5%(+0.817)#62 | 2.1%(+0.155)#6,727 |
| 63. | Madison | 2.3% | 1.5%(+0.791)#63 | 2.1%(+0.129)#6,820 |
| 64. | Sandersville | 2.2% | 1.5%(+0.719)#64 | 2.1%(+0.057)#7,104 |
| 65. | Okolona | 2.1% | 1.5%(+0.658)#65 | 2.1%(-0.004)#7,351 |
| 66. | Wiggins | 2.1% | 1.5%(+0.626)#66 | 2.1%(-0.036)#7,458 |
| 67. | Delisle | 2.1% | 1.5%(+0.571)#67 | 2.1%(-0.090)#7,703 |
| 68. | Edwards | 2.0% | 1.5%(+0.562)#68 | 2.1%(-0.100)#7,750 |
| 69. | Petal | 2.0% | 1.5%(+0.477)#69 | 2.1%(-0.184)#8,054 |
| 70. | Corinth | 2.0% | 1.5%(+0.474)#70 | 2.1%(-0.187)#8,059 |
| 71. | Hide A Way Lake | 2.0% | 1.5%(+0.465)#71 | 2.1%(-0.197)#8,102 |
| 72. | Olive Branch | 1.9% | 1.5%(+0.383)#72 | 2.1%(-0.279)#8,436 |
| 73. | Newton | 1.8% | 1.5%(+0.343)#73 | 2.1%(-0.319)#8,624 |
| 74. | Raleigh | 1.8% | 1.5%(+0.277)#74 | 2.1%(-0.385)#8,912 |
| 75. | Pascagoula | 1.8% | 1.5%(+0.276)#75 | 2.1%(-0.386)#8,921 |
| 76. | Lena | 1.8% | 1.5%(+0.267)#76 | 2.1%(-0.395)#8,970 |
| 77. | Pearl | 1.7% | 1.5%(+0.186)#77 | 2.1%(-0.476)#9,352 |
| 78. | Clinton | 1.6% | 1.5%(+0.154)#78 | 2.1%(-0.508)#9,499 |
| 79. | Purvis | 1.6% | 1.5%(+0.150)#79 | 2.1%(-0.512)#9,534 |
| 80. | Diamondhead | 1.6% | 1.5%(+0.135)#80 | 2.1%(-0.527)#9,605 |
| 81. | Gautier | 1.6% | 1.5%(+0.063)#81 | 2.1%(-0.598)#9,954 |
| 82. | Glendale | 1.5% | 1.5%(+0.061)#82 | 2.1%(-0.601)#9,973 |
| 83. | Booneville | 1.5% | 1.5%(+0.047)#83 | 2.1%(-0.615)#10,064 |
| 84. | Richland | 1.5% | 1.5%(+0.017)#84 | 2.1%(-0.645)#10,181 |
| 85. | Nicholson | 1.5% | 1.5%(+0.003)#85 | 2.1%(-0.659)#10,252 |
| 86. | Lexington | 1.5% | 1.5%(-0.025)#86 | 2.1%(-0.687)#10,406 |
| 87. | West Hattiesburg | 1.4% | 1.5%(-0.067)#87 | 2.1%(-0.729)#10,616 |
| 88. | Hattiesburg | 1.4% | 1.5%(-0.077)#88 | 2.1%(-0.739)#10,662 |
| 89. | Tishomingo | 1.4% | 1.5%(-0.136)#89 | 2.1%(-0.798)#10,975 |
| 90. | Gulf Hills | 1.3% | 1.5%(-0.170)#90 | 2.1%(-0.832)#11,182 |
| 91. | Biloxi | 1.3% | 1.5%(-0.182)#91 | 2.1%(-0.844)#11,237 |
| 92. | New Albany | 1.3% | 1.5%(-0.187)#92 | 2.1%(-0.848)#11,259 |
| 93. | Ridgeland | 1.3% | 1.5%(-0.188)#93 | 2.1%(-0.850)#11,267 |
| 94. | Dumas | 1.3% | 1.5%(-0.189)#94 | 2.1%(-0.851)#11,274 |
| 95. | Seminary | 1.3% | 1.5%(-0.229)#95 | 2.1%(-0.891)#11,473 |
| 96. | Gulfport | 1.3% | 1.5%(-0.234)#96 | 2.1%(-0.896)#11,494 |
| 97. | Glen | 1.3% | 1.5%(-0.237)#97 | 2.1%(-0.899)#11,512 |
| 98. | Decatur | 1.2% | 1.5%(-0.241)#98 | 2.1%(-0.903)#11,532 |
| 99. | Picayune | 1.2% | 1.5%(-0.299)#99 | 2.1%(-0.961)#11,838 |
| 100. | Southaven | 1.2% | 1.5%(-0.304)#100 | 2.1%(-0.966)#11,871 |
Common Questions
What are the Top 10 Cities with the Highest Percentage of Population Employed in Architecture & Engineering in Mississippi?
Top 10 Cities with the Highest Percentage of Population Employed in Architecture & Engineering in Mississippi are:
#1
24.3%
#2
18.5%
#3
12.0%
#4
11.9%
#5
11.1%
#6
7.8%
#7
7.3%
#8
7.0%
#9
7.0%
#10
6.0%
What city has the Highest Percentage of Population Employed in Architecture & Engineering in Mississippi?
Mooreville has the Highest Percentage of Population Employed in Architecture & Engineering in Mississippi with 24.3%.
What is the Percentage of Population Employed in Architecture & Engineering in the State of Mississippi?
Percentage of Population Employed in Architecture & Engineering in Mississippi is 1.5%.
What is the Percentage of Population Employed in Architecture & Engineering in the United States?
Percentage of Population Employed in Architecture & Engineering in the United States is 2.1%.