Butte Creek Canyon, CA Map & Demographics
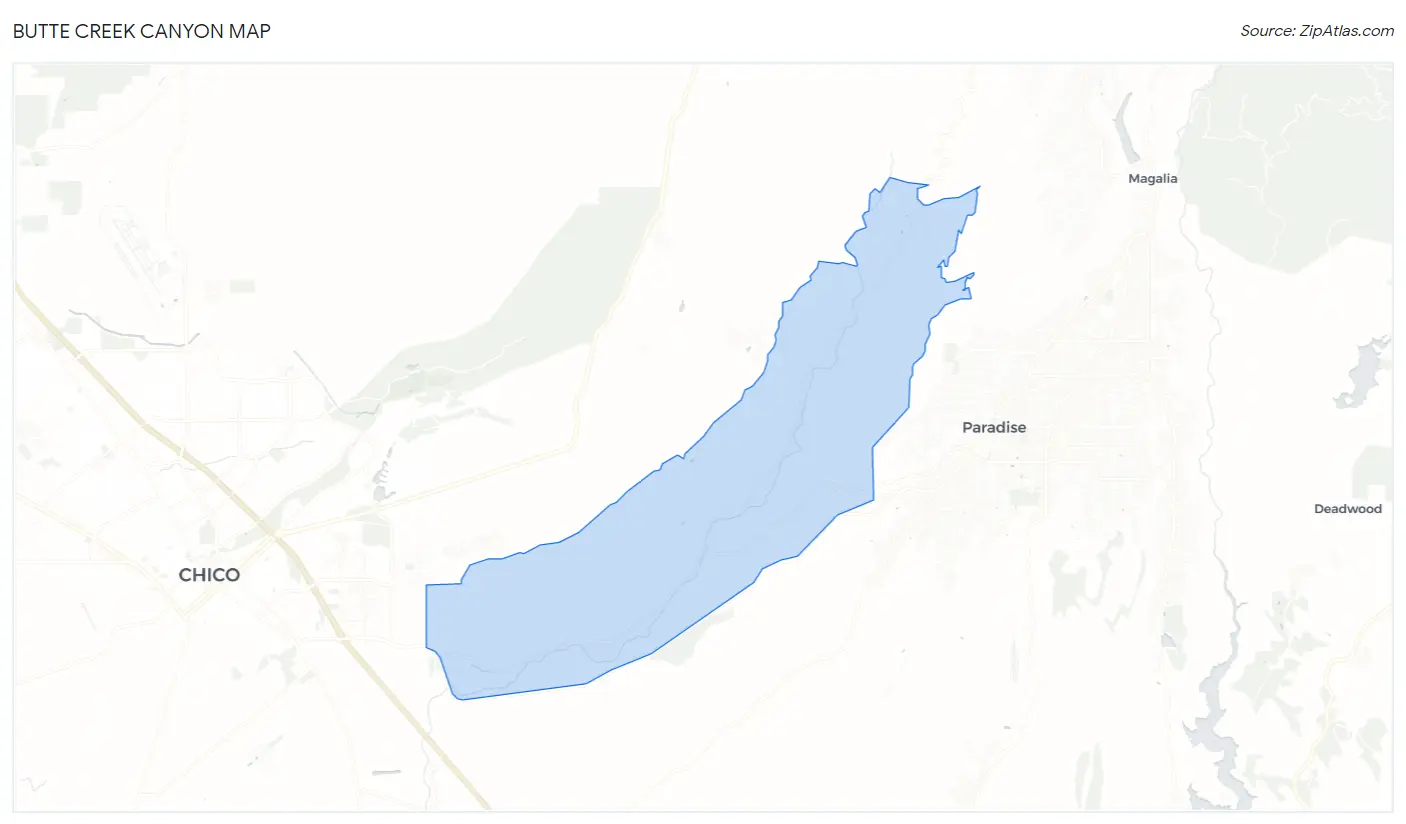
Butte Creek Canyon Map
Butte Creek Canyon Overview
$45,420
PER CAPITA INCOME
$68,553
AVG FAMILY INCOME
$77,813
AVG HOUSEHOLD INCOME
0.53
INEQUALITY / GINI INDEX
690
TOTAL POPULATION
378
MALE POPULATION
312
FEMALE POPULATION
121.15
MALES / 100 FEMALES
82.54
FEMALES / 100 MALES
61.2
MEDIAN AGE
2.6
AVG FAMILY SIZE
2.6
AVG HOUSEHOLD SIZE
275
LABOR FORCE [ PEOPLE ]
46.8%
PERCENT IN LABOR FORCE
Income in Butte Creek Canyon
Income Overview in Butte Creek Canyon
Per Capita Income in Butte Creek Canyon is $45,420, while median incomes of families and households are $68,553 and $77,813 respectively.
| Characteristic | Number | Measure |
| Per Capita Income | 690 | $45,420 |
| Median Family Income | 236 | $68,553 |
| Mean Family Income | 236 | $113,692 |
| Median Household Income | 263 | $77,813 |
| Mean Household Income | 263 | $123,298 |
| Income Deficit | 236 | $0 |
| Wage / Income Gap (%) | 690 | 0.00% |
| Wage / Income Gap ($) | 690 | 100.00¢ per $1 |
| Gini / Inequality Index | 690 | 0.53 |
Earnings by Sex in Butte Creek Canyon
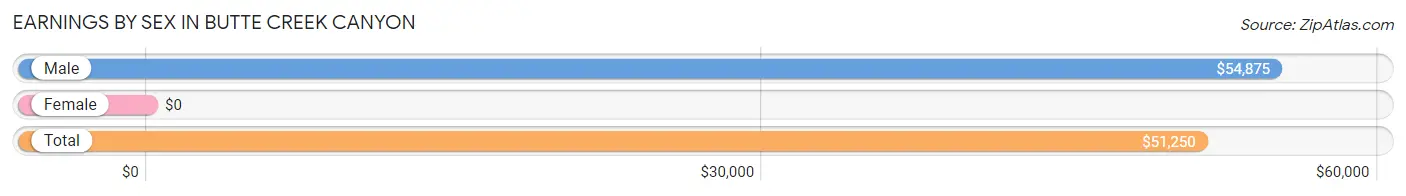
| Sex | Number | Average Earnings |
| Male | 167 (49.5%) | $54,875 |
| Female | 170 (50.4%) | $0 |
| Total | 337 (100.0%) | $51,250 |
Earnings by Sex by Income Bracket in Butte Creek Canyon
The most common earnings brackets in Butte Creek Canyon are $100,000+ for men (47 | 28.1%) and $10,000 to $12,499 for women (43 | 25.3%).
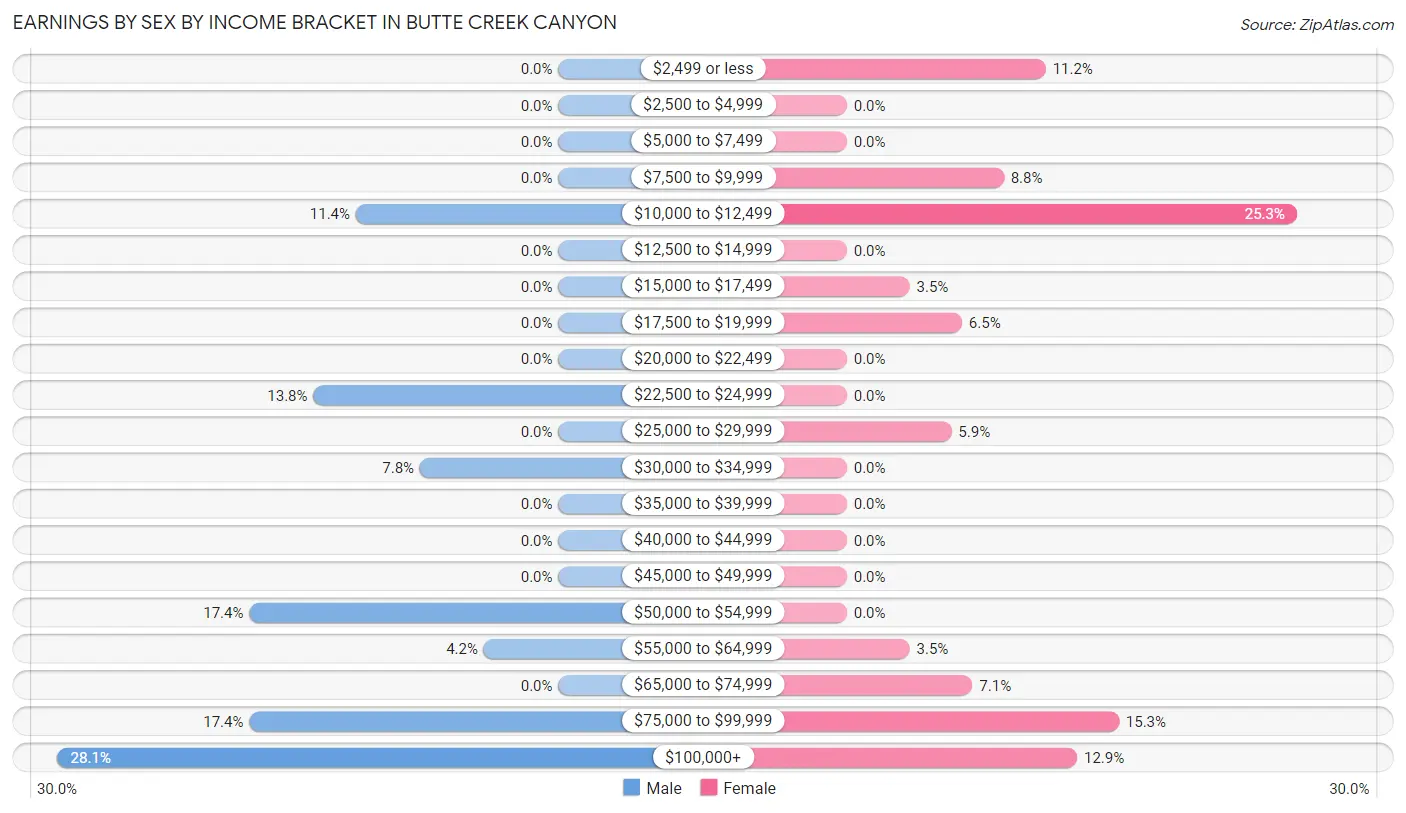
| Income | Male | Female |
| $2,499 or less | 0 (0.0%) | 19 (11.2%) |
| $2,500 to $4,999 | 0 (0.0%) | 0 (0.0%) |
| $5,000 to $7,499 | 0 (0.0%) | 0 (0.0%) |
| $7,500 to $9,999 | 0 (0.0%) | 15 (8.8%) |
| $10,000 to $12,499 | 19 (11.4%) | 43 (25.3%) |
| $12,500 to $14,999 | 0 (0.0%) | 0 (0.0%) |
| $15,000 to $17,499 | 0 (0.0%) | 6 (3.5%) |
| $17,500 to $19,999 | 0 (0.0%) | 11 (6.5%) |
| $20,000 to $22,499 | 0 (0.0%) | 0 (0.0%) |
| $22,500 to $24,999 | 23 (13.8%) | 0 (0.0%) |
| $25,000 to $29,999 | 0 (0.0%) | 10 (5.9%) |
| $30,000 to $34,999 | 13 (7.8%) | 0 (0.0%) |
| $35,000 to $39,999 | 0 (0.0%) | 0 (0.0%) |
| $40,000 to $44,999 | 0 (0.0%) | 0 (0.0%) |
| $45,000 to $49,999 | 0 (0.0%) | 0 (0.0%) |
| $50,000 to $54,999 | 29 (17.4%) | 0 (0.0%) |
| $55,000 to $64,999 | 7 (4.2%) | 6 (3.5%) |
| $65,000 to $74,999 | 0 (0.0%) | 12 (7.1%) |
| $75,000 to $99,999 | 29 (17.4%) | 26 (15.3%) |
| $100,000+ | 47 (28.1%) | 22 (12.9%) |
| Total | 167 (100.0%) | 170 (100.0%) |
Earnings by Sex by Educational Attainment in Butte Creek Canyon
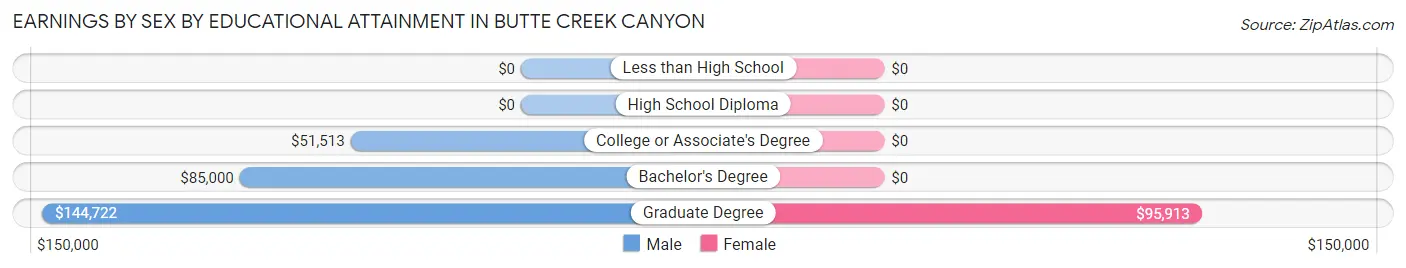
| Educational Attainment | Male Income | Female Income |
| Less than High School | - | - |
| High School Diploma | - | - |
| College or Associate's Degree | $51,513 | $0 |
| Bachelor's Degree | $85,000 | $0 |
| Graduate Degree | $144,722 | $95,913 |
| Total | $80,333 | $0 |
Family Income in Butte Creek Canyon
Family Income Brackets in Butte Creek Canyon
According to the Butte Creek Canyon family income data, there are 37 families falling into the $75,000 to $99,999 income range, which is the most common income bracket and makes up 15.7% of all families.
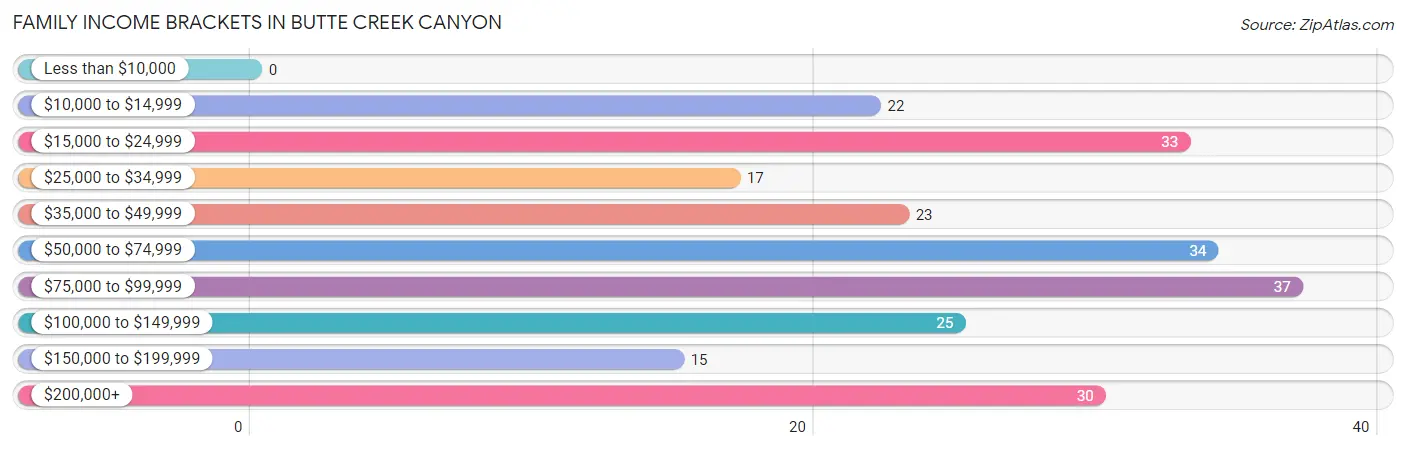
| Income Bracket | # Families | % Families |
| Less than $10,000 | 0 | 0.0% |
| $10,000 to $14,999 | 22 | 9.3% |
| $15,000 to $24,999 | 33 | 14.0% |
| $25,000 to $34,999 | 17 | 7.2% |
| $35,000 to $49,999 | 23 | 9.7% |
| $50,000 to $74,999 | 34 | 14.4% |
| $75,000 to $99,999 | 37 | 15.7% |
| $100,000 to $149,999 | 25 | 10.6% |
| $150,000 to $199,999 | 15 | 6.4% |
| $200,000+ | 30 | 12.7% |
Family Income by Famaliy Size in Butte Creek Canyon
4-person families (24 | 10.2%) account for the highest median family income in Butte Creek Canyon with $186,429 per family, while 4-person families (24 | 10.2%) have the highest median income of $46,607 per family member.
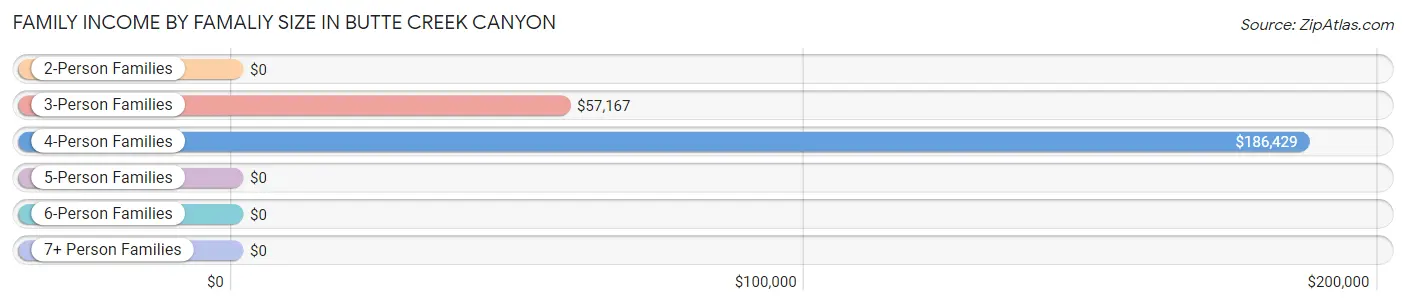
| Income Bracket | # Families | Median Income |
| 2-Person Families | 133 (56.4%) | $0 |
| 3-Person Families | 72 (30.5%) | $57,167 |
| 4-Person Families | 24 (10.2%) | $186,429 |
| 5-Person Families | 7 (3.0%) | $0 |
| 6-Person Families | 0 (0.0%) | $0 |
| 7+ Person Families | 0 (0.0%) | $0 |
| Total | 236 (100.0%) | $68,553 |
Family Income by Number of Earners in Butte Creek Canyon
| Number of Earners | # Families | Median Income |
| No Earners | 66 (28.0%) | $0 |
| 1 Earner | 69 (29.2%) | $0 |
| 2 Earners | 79 (33.5%) | $0 |
| 3+ Earners | 22 (9.3%) | $0 |
| Total | 236 (100.0%) | $68,553 |
Household Income in Butte Creek Canyon
Household Income Brackets in Butte Creek Canyon
With 57 households falling in the category, the $50,000 to $74,999 income range is the most frequent in Butte Creek Canyon, accounting for 21.7% of all households.
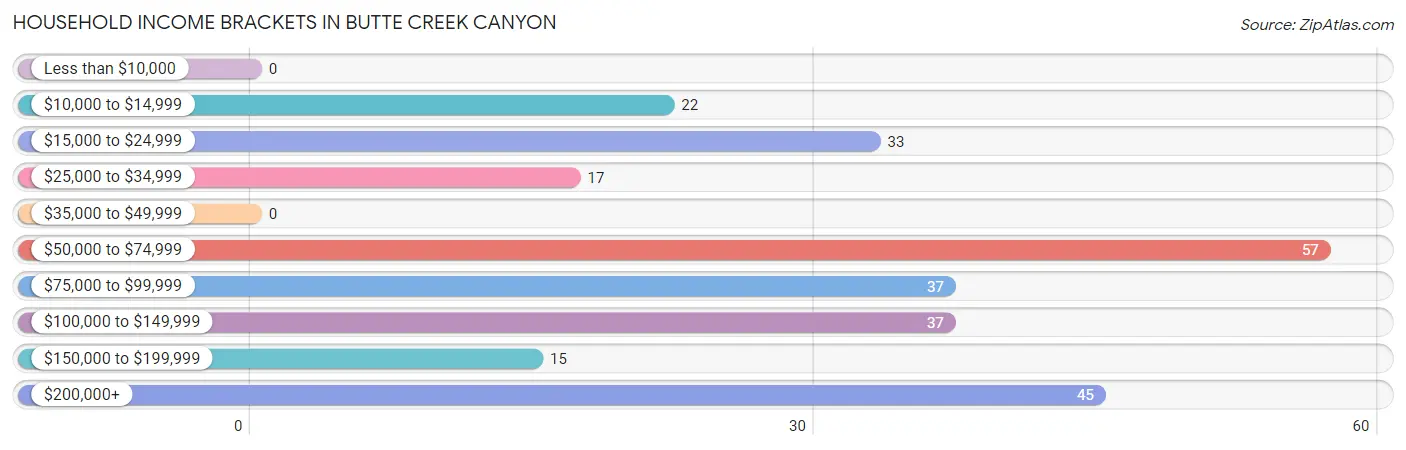
| Income Bracket | # Households | % Households |
| Less than $10,000 | 0 | 0.0% |
| $10,000 to $14,999 | 22 | 8.4% |
| $15,000 to $24,999 | 33 | 12.5% |
| $25,000 to $34,999 | 17 | 6.5% |
| $35,000 to $49,999 | 0 | 0.0% |
| $50,000 to $74,999 | 57 | 21.7% |
| $75,000 to $99,999 | 37 | 14.1% |
| $100,000 to $149,999 | 37 | 14.1% |
| $150,000 to $199,999 | 15 | 5.7% |
| $200,000+ | 45 | 17.1% |
Household Income by Householder Age in Butte Creek Canyon
The median household income in Butte Creek Canyon is $77,813, with the highest median household income of $69,342 found in the 65+ years age bracket for the primary householder. A total of 106 households (40.3%) fall into this category.
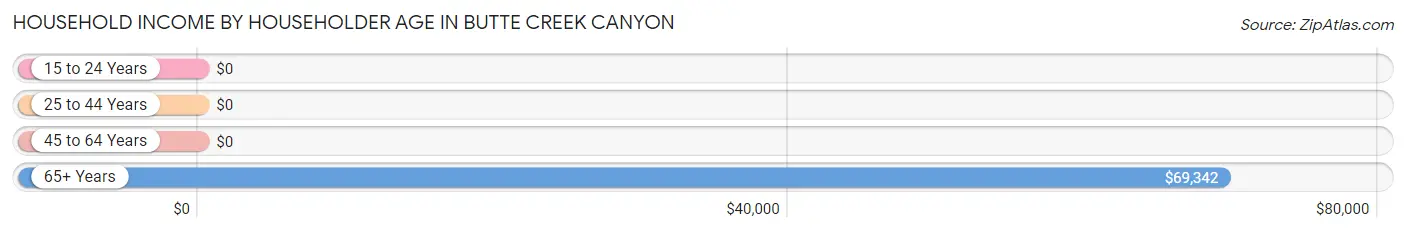
| Income Bracket | # Households | Median Income |
| 15 to 24 Years | 0 (0.0%) | $0 |
| 25 to 44 Years | 62 (23.6%) | $0 |
| 45 to 64 Years | 95 (36.1%) | $0 |
| 65+ Years | 106 (40.3%) | $69,342 |
| Total | 263 (100.0%) | $77,813 |
Poverty in Butte Creek Canyon
Income Below Poverty by Sex and Age in Butte Creek Canyon
With 13.8% poverty level for males and 24.0% for females among the residents of Butte Creek Canyon, 65 to 74 year old males and 55 to 64 year old females are the most vulnerable to poverty, with 52 males (49.1%) and 33 females (53.2%) in their respective age groups living below the poverty level.
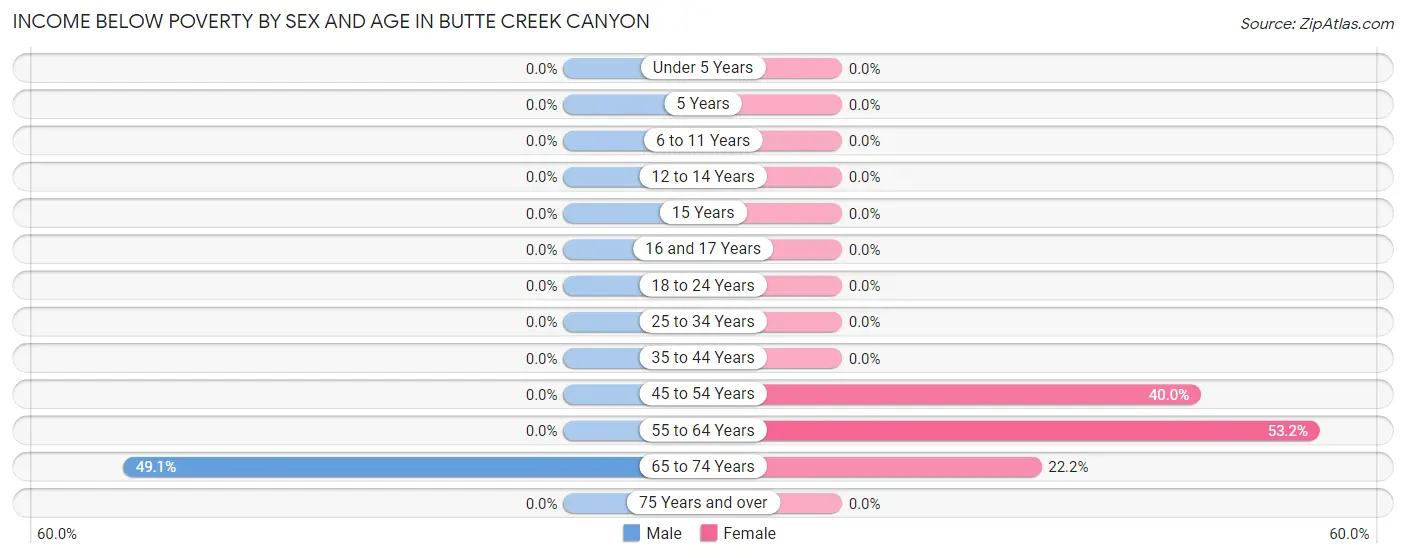
| Age Bracket | Male | Female |
| Under 5 Years | 0 (0.0%) | 0 (0.0%) |
| 5 Years | 0 (0.0%) | 0 (0.0%) |
| 6 to 11 Years | 0 (0.0%) | 0 (0.0%) |
| 12 to 14 Years | 0 (0.0%) | 0 (0.0%) |
| 15 Years | 0 (0.0%) | 0 (0.0%) |
| 16 and 17 Years | 0 (0.0%) | 0 (0.0%) |
| 18 to 24 Years | 0 (0.0%) | 0 (0.0%) |
| 25 to 34 Years | 0 (0.0%) | 0 (0.0%) |
| 35 to 44 Years | 0 (0.0%) | 0 (0.0%) |
| 45 to 54 Years | 0 (0.0%) | 20 (40.0%) |
| 55 to 64 Years | 0 (0.0%) | 33 (53.2%) |
| 65 to 74 Years | 52 (49.1%) | 22 (22.2%) |
| 75 Years and over | 0 (0.0%) | 0 (0.0%) |
| Total | 52 (13.8%) | 75 (24.0%) |
Income Above Poverty by Sex and Age in Butte Creek Canyon
According to the poverty statistics in Butte Creek Canyon, males aged 6 to 11 years and females aged 6 to 11 years are the age groups that are most secure financially, with 100.0% of males and 100.0% of females in these age groups living above the poverty line.
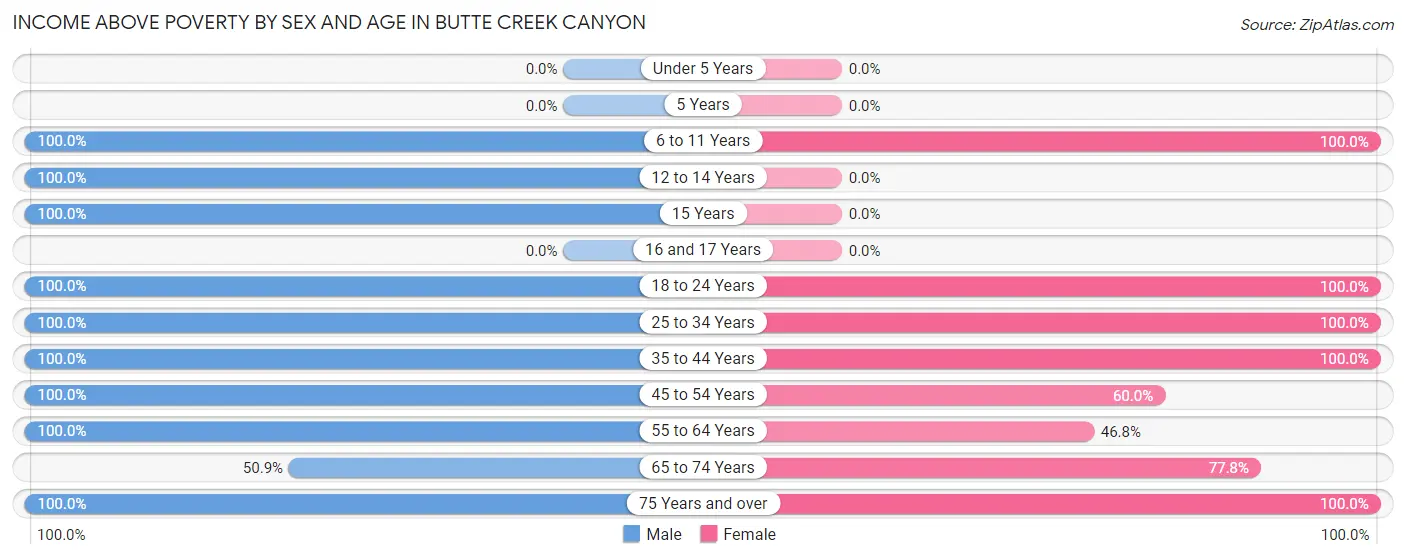
| Age Bracket | Male | Female |
| Under 5 Years | 0 (0.0%) | 0 (0.0%) |
| 5 Years | 0 (0.0%) | 0 (0.0%) |
| 6 to 11 Years | 16 (100.0%) | 34 (100.0%) |
| 12 to 14 Years | 42 (100.0%) | 0 (0.0%) |
| 15 Years | 11 (100.0%) | 0 (0.0%) |
| 16 and 17 Years | 0 (0.0%) | 0 (0.0%) |
| 18 to 24 Years | 19 (100.0%) | 21 (100.0%) |
| 25 to 34 Years | 30 (100.0%) | 6 (100.0%) |
| 35 to 44 Years | 47 (100.0%) | 23 (100.0%) |
| 45 to 54 Years | 10 (100.0%) | 30 (60.0%) |
| 55 to 64 Years | 61 (100.0%) | 29 (46.8%) |
| 65 to 74 Years | 54 (50.9%) | 77 (77.8%) |
| 75 Years and over | 36 (100.0%) | 17 (100.0%) |
| Total | 326 (86.2%) | 237 (76.0%) |
Income Below Poverty Among Married-Couple Families in Butte Creek Canyon
The poverty statistics for married-couple families in Butte Creek Canyon show that 26.7% or 55 of the total 206 families live below the poverty line. Families with no children have the highest poverty rate of 30.2%, comprising of 55 families. On the other hand, families with 1 or 2 children have the lowest poverty rate of 0.0%, which includes 0 families.
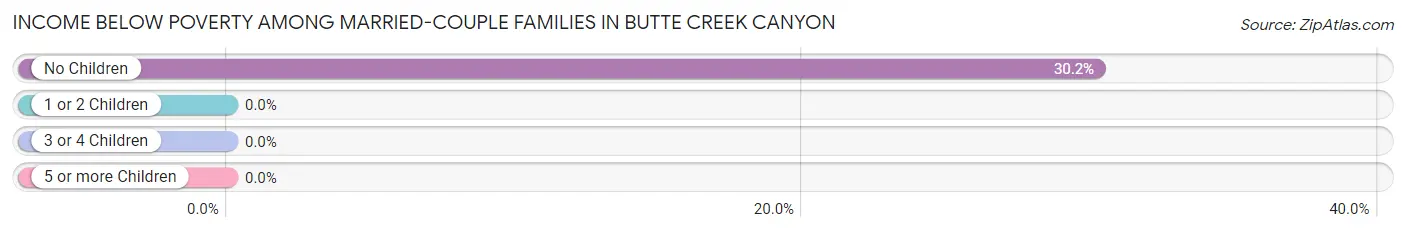
| Children | Above Poverty | Below Poverty |
| No Children | 127 (69.8%) | 55 (30.2%) |
| 1 or 2 Children | 17 (100.0%) | 0 (0.0%) |
| 3 or 4 Children | 7 (100.0%) | 0 (0.0%) |
| 5 or more Children | 0 (0.0%) | 0 (0.0%) |
| Total | 151 (73.3%) | 55 (26.7%) |
Income Below Poverty Among Single-Parent Households in Butte Creek Canyon
| Children | Single Father | Single Mother |
| No Children | 0 (0.0%) | 0 (0.0%) |
| 1 or 2 Children | 0 (0.0%) | 0 (0.0%) |
| 3 or 4 Children | 0 (0.0%) | 0 (0.0%) |
| 5 or more Children | 0 (0.0%) | 0 (0.0%) |
| Total | 0 (0.0%) | 0 (0.0%) |
Income Below Poverty Among Married-Couple vs Single-Parent Households in Butte Creek Canyon
| Children | Married-Couple Families | Single-Parent Households |
| No Children | 55 (30.2%) | 0 (0.0%) |
| 1 or 2 Children | 0 (0.0%) | 0 (0.0%) |
| 3 or 4 Children | 0 (0.0%) | 0 (0.0%) |
| 5 or more Children | 0 (0.0%) | 0 (0.0%) |
| Total | 55 (26.7%) | 0 (0.0%) |
Race in Butte Creek Canyon
The most populous races in Butte Creek Canyon are White / Caucasian (568 | 82.3%), Hispanic or Latino (87 | 12.6%), and Some other Race (87 | 12.6%).
| Race | # Population | % Population |
| Asian | 28 | 4.1% |
| Black / African American | 0 | 0.0% |
| Hawaiian / Pacific | 0 | 0.0% |
| Hispanic or Latino | 87 | 12.6% |
| Native / Alaskan | 0 | 0.0% |
| White / Caucasian | 568 | 82.3% |
| Two or more Races | 7 | 1.0% |
| Some other Race | 87 | 12.6% |
| Total | 690 | 100.0% |
Ancestry in Butte Creek Canyon
The most populous ancestries reported in Butte Creek Canyon are German (163 | 23.6%), English (91 | 13.2%), Irish (89 | 12.9%), Mexican (87 | 12.6%), and Danish (54 | 7.8%), together accounting for 70.2% of all Butte Creek Canyon residents.
| Ancestry | # Population | % Population |
| American | 27 | 3.9% |
| Bhutanese | 10 | 1.5% |
| Cherokee | 7 | 1.0% |
| Danish | 54 | 7.8% |
| English | 91 | 13.2% |
| European | 48 | 7.0% |
| German | 163 | 23.6% |
| Indian (Asian) | 14 | 2.0% |
| Irish | 89 | 12.9% |
| Italian | 15 | 2.2% |
| Luxembourger | 15 | 2.2% |
| Mexican | 87 | 12.6% |
| Northern European | 14 | 2.0% |
| Pakistani | 4 | 0.6% |
| Polish | 33 | 4.8% |
| Portuguese | 44 | 6.4% |
| Scotch-Irish | 9 | 1.3% |
| Scottish | 20 | 2.9% |
| Swiss | 31 | 4.5% | View All 19 Rows |
Immigrants in Butte Creek Canyon
The most numerous immigrant groups reported in Butte Creek Canyon came from Central America (43 | 6.2%), Latin America (43 | 6.2%), Mexico (43 | 6.2%), Asia (18 | 2.6%), and China (14 | 2.0%), together accounting for 23.3% of all Butte Creek Canyon residents.
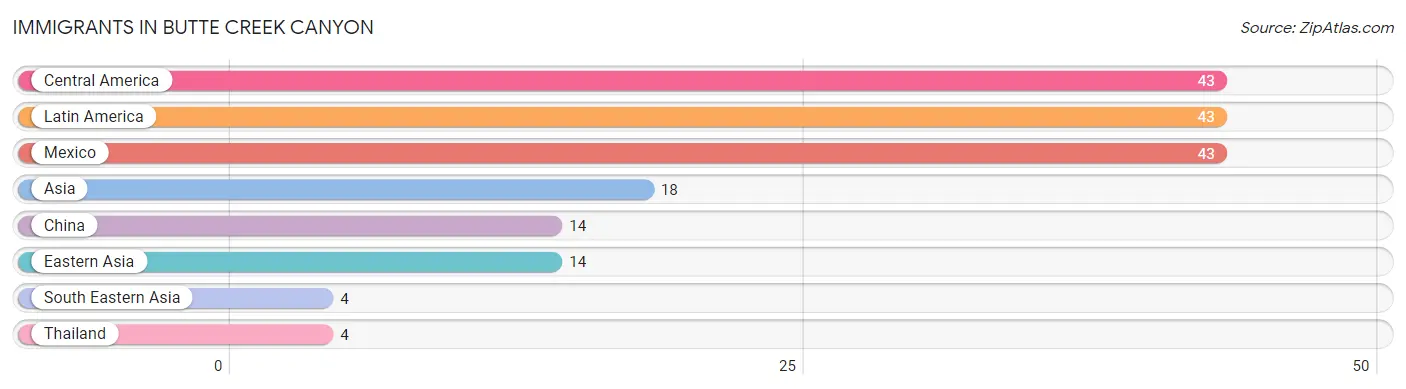
| Immigration Origin | # Population | % Population |
| Asia | 18 | 2.6% |
| Central America | 43 | 6.2% |
| China | 14 | 2.0% |
| Eastern Asia | 14 | 2.0% |
| Latin America | 43 | 6.2% |
| Mexico | 43 | 6.2% |
| South Eastern Asia | 4 | 0.6% |
| Thailand | 4 | 0.6% | View All 8 Rows |
Sex and Age in Butte Creek Canyon
Sex and Age in Butte Creek Canyon
The most populous age groups in Butte Creek Canyon are 65 to 69 Years (92 | 24.3%) for men and 65 to 69 Years (75 | 24.0%) for women.
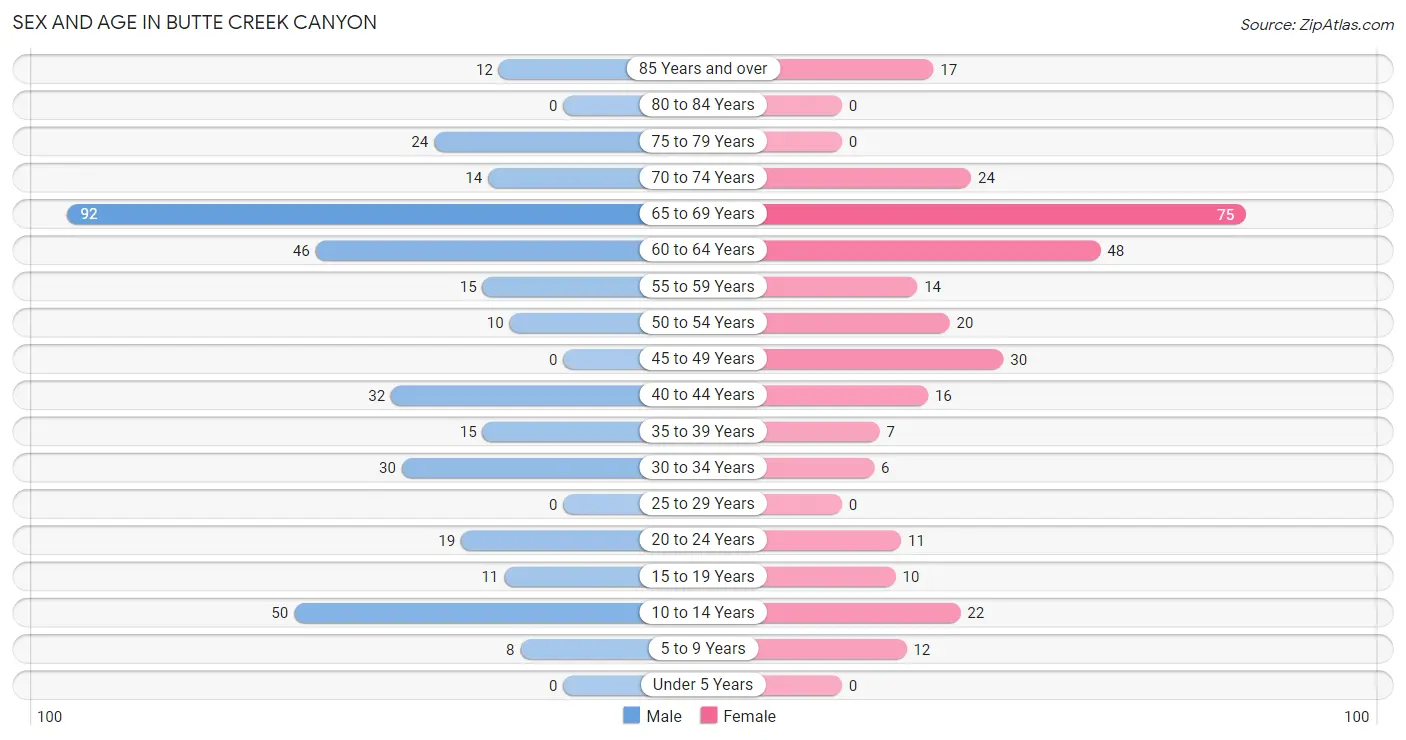
| Age Bracket | Male | Female |
| Under 5 Years | 0 (0.0%) | 0 (0.0%) |
| 5 to 9 Years | 8 (2.1%) | 12 (3.8%) |
| 10 to 14 Years | 50 (13.2%) | 22 (7.0%) |
| 15 to 19 Years | 11 (2.9%) | 10 (3.2%) |
| 20 to 24 Years | 19 (5.0%) | 11 (3.5%) |
| 25 to 29 Years | 0 (0.0%) | 0 (0.0%) |
| 30 to 34 Years | 30 (7.9%) | 6 (1.9%) |
| 35 to 39 Years | 15 (4.0%) | 7 (2.2%) |
| 40 to 44 Years | 32 (8.5%) | 16 (5.1%) |
| 45 to 49 Years | 0 (0.0%) | 30 (9.6%) |
| 50 to 54 Years | 10 (2.6%) | 20 (6.4%) |
| 55 to 59 Years | 15 (4.0%) | 14 (4.5%) |
| 60 to 64 Years | 46 (12.2%) | 48 (15.4%) |
| 65 to 69 Years | 92 (24.3%) | 75 (24.0%) |
| 70 to 74 Years | 14 (3.7%) | 24 (7.7%) |
| 75 to 79 Years | 24 (6.4%) | 0 (0.0%) |
| 80 to 84 Years | 0 (0.0%) | 0 (0.0%) |
| 85 Years and over | 12 (3.2%) | 17 (5.4%) |
| Total | 378 (100.0%) | 312 (100.0%) |
Families and Households in Butte Creek Canyon
Median Family Size in Butte Creek Canyon
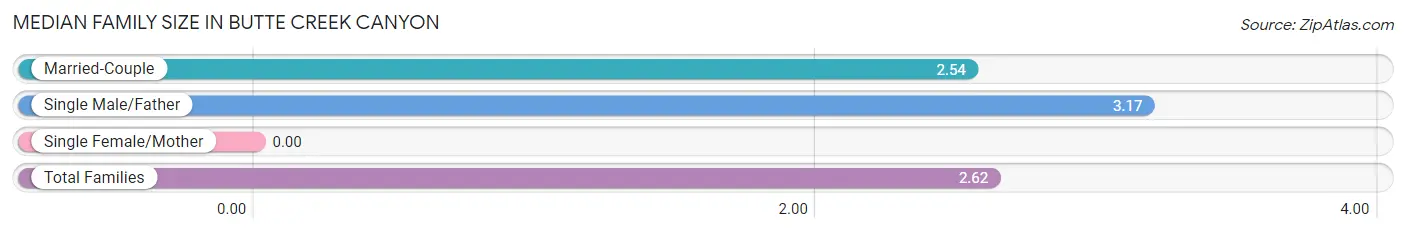
| Family Type | # Families | Family Size |
| Married-Couple | 206 (87.3%) | 2.54 |
| Single Male/Father | 30 (12.7%) | 3.17 |
| Single Female/Mother | 0 (0.0%) | - |
| Total Families | 236 (100.0%) | 2.62 |
Median Household Size in Butte Creek Canyon
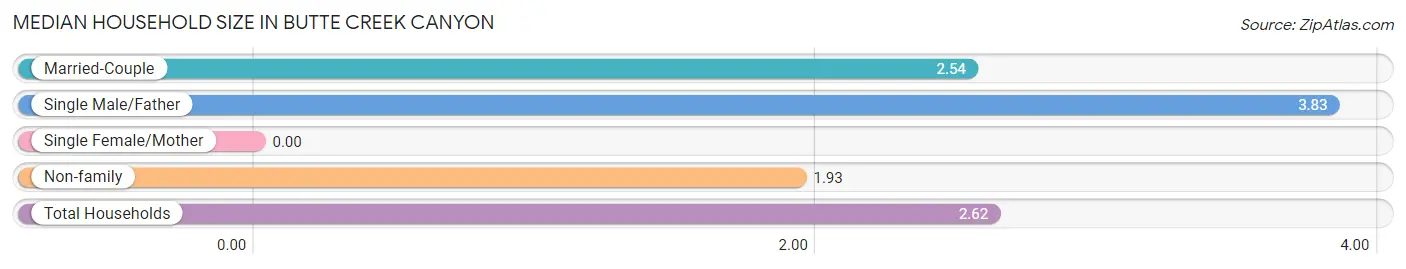
| Household Type | # Households | Household Size |
| Married-Couple | 206 (78.3%) | 2.54 |
| Single Male/Father | 30 (11.4%) | 3.83 |
| Single Female/Mother | 0 (0.0%) | - |
| Non-family | 27 (10.3%) | 1.93 |
| Total Households | 263 (100.0%) | 2.62 |
Household Size by Marriage Status in Butte Creek Canyon
Out of a total of 263 households in Butte Creek Canyon, 236 (89.7%) are family households, while 27 (10.3%) are nonfamily households. The most numerous type of family households are 2-person households, comprising 133, and the most common type of nonfamily households are 2-person households, comprising 27.
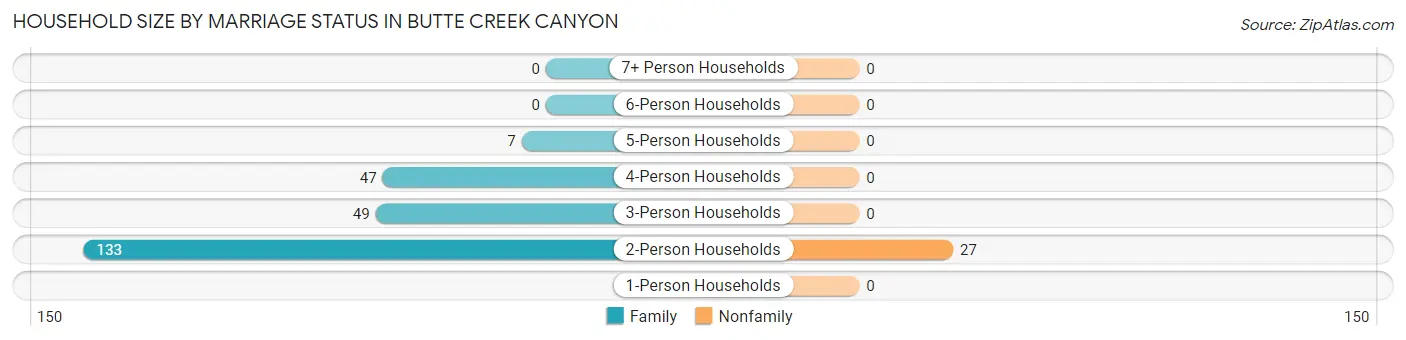
| Household Size | Family Households | Nonfamily Households |
| 1-Person Households | - | 0 (0.0%) |
| 2-Person Households | 133 (50.6%) | 27 (10.3%) |
| 3-Person Households | 49 (18.6%) | 0 (0.0%) |
| 4-Person Households | 47 (17.9%) | 0 (0.0%) |
| 5-Person Households | 7 (2.7%) | 0 (0.0%) |
| 6-Person Households | 0 (0.0%) | 0 (0.0%) |
| 7+ Person Households | 0 (0.0%) | 0 (0.0%) |
| Total | 236 (89.7%) | 27 (10.3%) |
Female Fertility in Butte Creek Canyon
Fertility by Age in Butte Creek Canyon
| Age Bracket | Women with Births | Births / 1,000 Women |
| 15 to 19 years | 0 (0.0%) | 0.0 |
| 20 to 34 years | 0 (0.0%) | 0.0 |
| 35 to 50 years | 0 (0.0%) | 0.0 |
| Total | 0 (0.0%) | 0.0 |
Fertility by Age by Marriage Status in Butte Creek Canyon
| Age Bracket | Married | Unmarried |
| 15 to 19 years | 0 (0.0%) | 0 (0.0%) |
| 20 to 34 years | 0 (0.0%) | 0 (0.0%) |
| 35 to 50 years | 0 (0.0%) | 0 (0.0%) |
| Total | 0 (0.0%) | 0 (0.0%) |
Fertility by Education in Butte Creek Canyon
| Educational Attainment | Women with Births | Births / 1,000 Women |
| Less than High School | 0 (0.0%) | 0.0 |
| High School Diploma | 0 (0.0%) | 0.0 |
| College or Associate's Degree | 0 (0.0%) | 0.0 |
| Bachelor's Degree | 0 (0.0%) | 0.0 |
| Graduate Degree | 0 (0.0%) | 0.0 |
| Total | 0 (0.0%) | 0.0 |
Fertility by Education by Marriage Status in Butte Creek Canyon
| Educational Attainment | Married | Unmarried |
| Less than High School | 0 (0.0%) | 0 (0.0%) |
| High School Diploma | 0 (0.0%) | 0 (0.0%) |
| College or Associate's Degree | 0 (0.0%) | 0 (0.0%) |
| Bachelor's Degree | 0 (0.0%) | 0 (0.0%) |
| Graduate Degree | 0 (0.0%) | 0 (0.0%) |
| Total | 0 (0.0%) | 0 (0.0%) |
Employment Characteristics in Butte Creek Canyon
Employment by Class of Employer in Butte Creek Canyon
Among the 275 employed individuals in Butte Creek Canyon, private company employees (158 | 57.5%), self-employed (not incorporated) (43 | 15.6%), and local government employees (27 | 9.8%) make up the most common classes of employment.
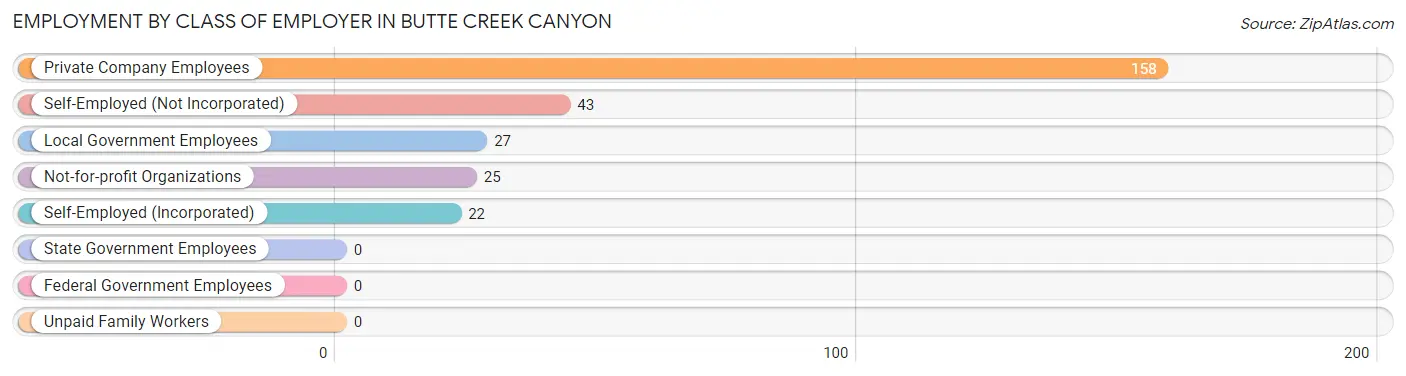
| Employer Class | # Employees | % Employees |
| Private Company Employees | 158 | 57.5% |
| Self-Employed (Incorporated) | 22 | 8.0% |
| Self-Employed (Not Incorporated) | 43 | 15.6% |
| Not-for-profit Organizations | 25 | 9.1% |
| Local Government Employees | 27 | 9.8% |
| State Government Employees | 0 | 0.0% |
| Federal Government Employees | 0 | 0.0% |
| Unpaid Family Workers | 0 | 0.0% |
| Total | 275 | 100.0% |
Employment Status by Age in Butte Creek Canyon
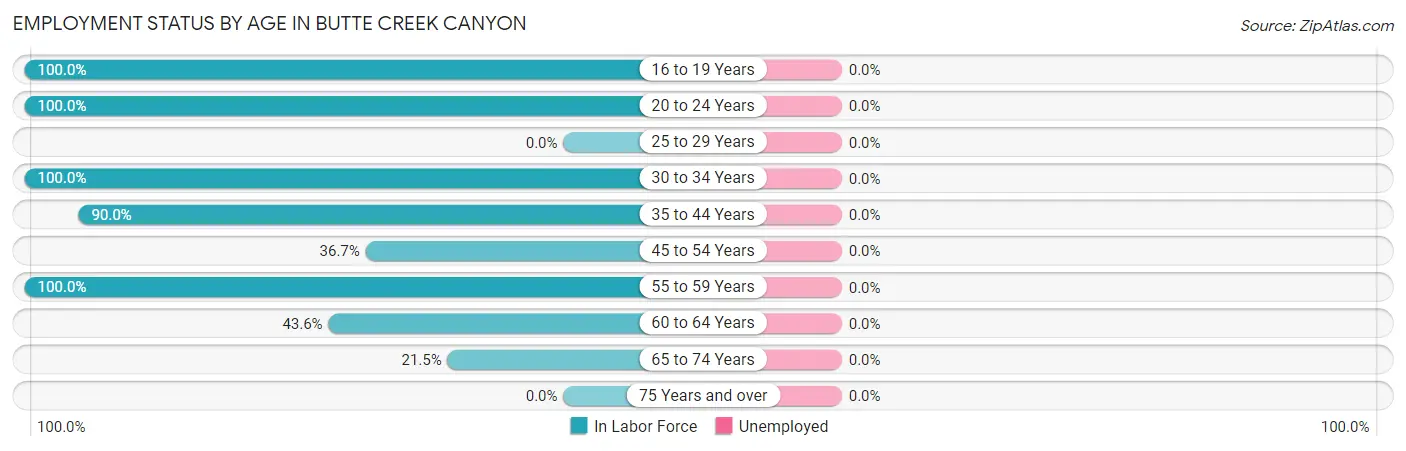
| Age Bracket | In Labor Force | Unemployed |
| 16 to 19 Years | 10 (100.0%) | 0 (0.0%) |
| 20 to 24 Years | 30 (100.0%) | 0 (0.0%) |
| 25 to 29 Years | 0 (0.0%) | 0 (0.0%) |
| 30 to 34 Years | 36 (100.0%) | 0 (0.0%) |
| 35 to 44 Years | 63 (90.0%) | 0 (0.0%) |
| 45 to 54 Years | 22 (36.7%) | 0 (0.0%) |
| 55 to 59 Years | 29 (100.0%) | 0 (0.0%) |
| 60 to 64 Years | 41 (43.6%) | 0 (0.0%) |
| 65 to 74 Years | 44 (21.5%) | 0 (0.0%) |
| 75 Years and over | 0 (0.0%) | 0 (0.0%) |
| Total | 275 (46.8%) | 0 (0.0%) |
Employment Status by Educational Attainment in Butte Creek Canyon
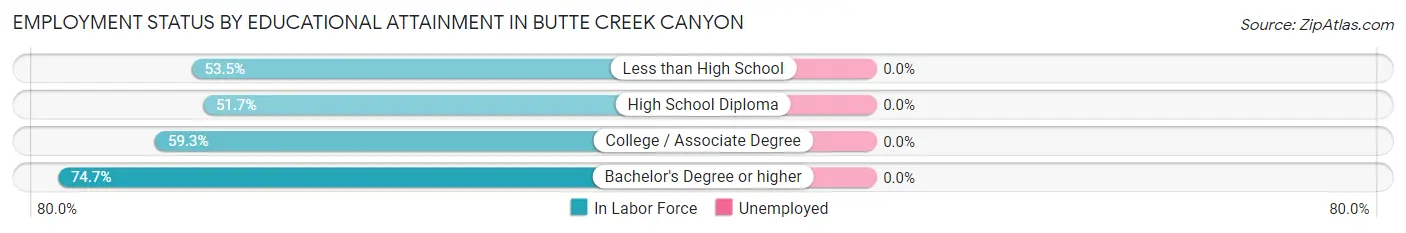
| Educational Attainment | In Labor Force | Unemployed |
| Less than High School | 23 (53.5%) | 0 (0.0%) |
| High School Diploma | 15 (51.7%) | 0 (0.0%) |
| College / Associate Degree | 35 (59.3%) | 0 (0.0%) |
| Bachelor's Degree or higher | 118 (74.7%) | 0 (0.0%) |
| Total | 191 (66.1%) | 0 (0.0%) |
Employment Occupations by Sex in Butte Creek Canyon
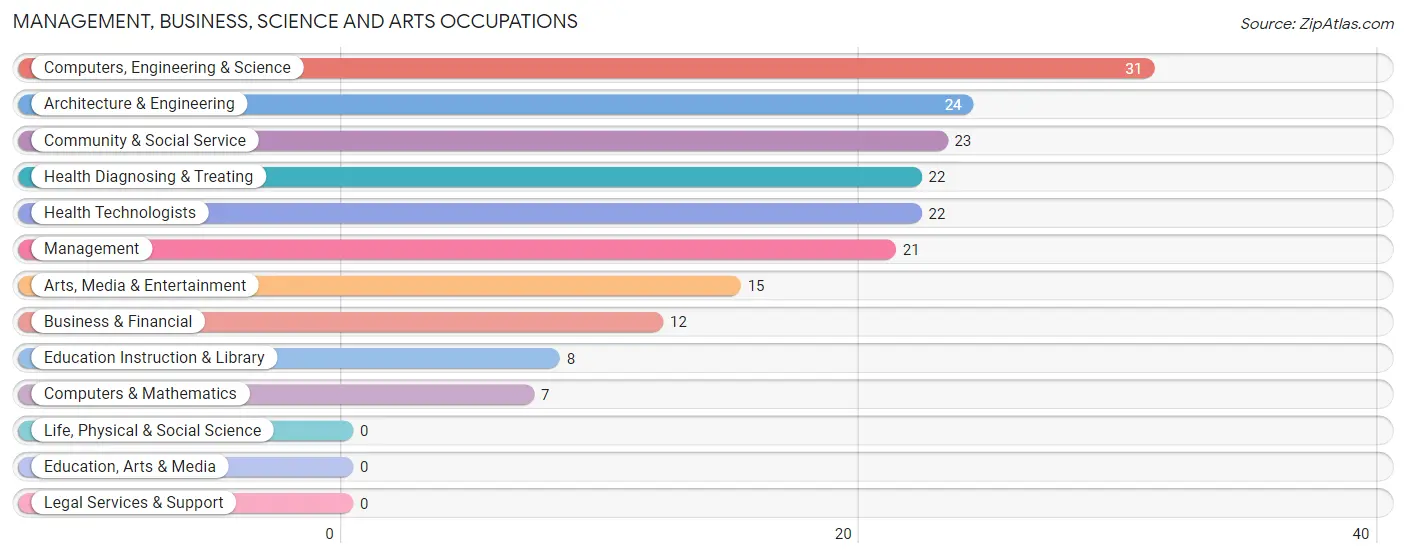
Management, Business, Science and Arts Occupations
The most common Management, Business, Science and Arts occupations in Butte Creek Canyon are Computers, Engineering & Science (31 | 11.3%), Architecture & Engineering (24 | 8.7%), Community & Social Service (23 | 8.4%), Health Diagnosing & Treating (22 | 8.0%), and Health Technologists (22 | 8.0%).
Management, Business, Science and Arts Occupations by Sex
Within the Management, Business, Science and Arts occupations in Butte Creek Canyon, the most male-oriented occupations are Computers, Engineering & Science (100.0%), Computers & Mathematics (100.0%), and Architecture & Engineering (100.0%), while the most female-oriented occupations are Business & Financial (100.0%), Education Instruction & Library (100.0%), and Health Diagnosing & Treating (100.0%).
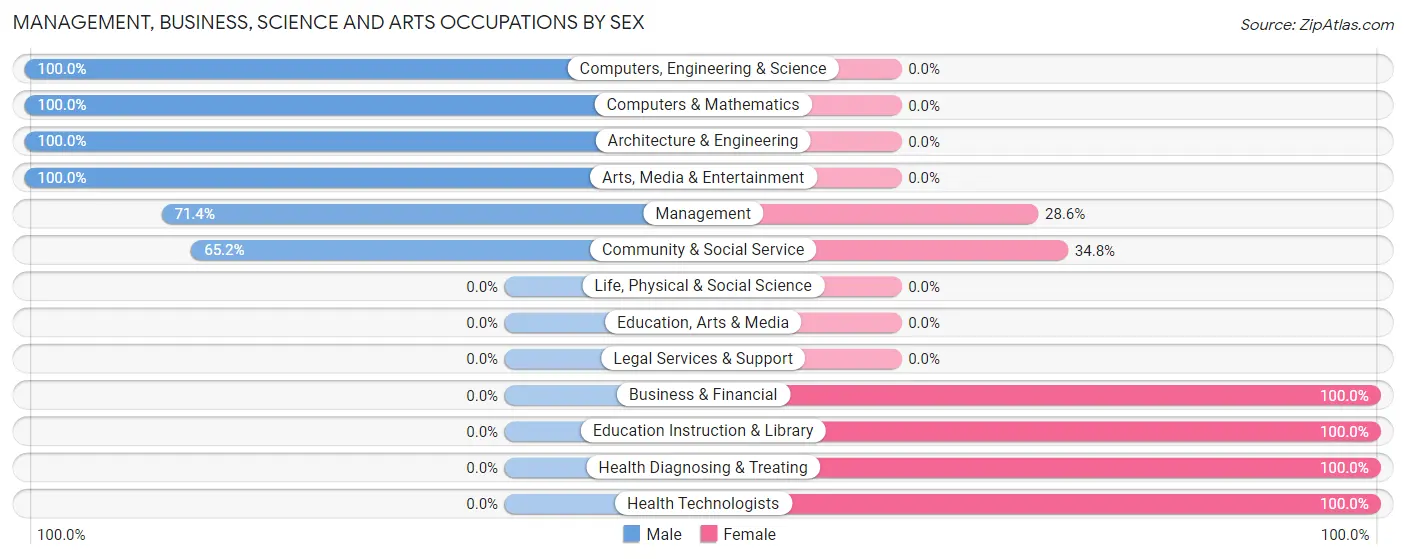
| Occupation | Male | Female |
| Management | 15 (71.4%) | 6 (28.6%) |
| Business & Financial | 0 (0.0%) | 12 (100.0%) |
| Computers, Engineering & Science | 31 (100.0%) | 0 (0.0%) |
| Computers & Mathematics | 7 (100.0%) | 0 (0.0%) |
| Architecture & Engineering | 24 (100.0%) | 0 (0.0%) |
| Life, Physical & Social Science | 0 (0.0%) | 0 (0.0%) |
| Community & Social Service | 15 (65.2%) | 8 (34.8%) |
| Education, Arts & Media | 0 (0.0%) | 0 (0.0%) |
| Legal Services & Support | 0 (0.0%) | 0 (0.0%) |
| Education Instruction & Library | 0 (0.0%) | 8 (100.0%) |
| Arts, Media & Entertainment | 15 (100.0%) | 0 (0.0%) |
| Health Diagnosing & Treating | 0 (0.0%) | 22 (100.0%) |
| Health Technologists | 0 (0.0%) | 22 (100.0%) |
| Total (Category) | 61 (56.0%) | 48 (44.0%) |
| Total (Overall) | 167 (60.7%) | 108 (39.3%) |
Services Occupations
The most common Services occupations in Butte Creek Canyon are Cleaning & Maintenance (70 | 25.5%), Personal Care & Service (19 | 6.9%), and Food Preparation & Serving (11 | 4.0%).
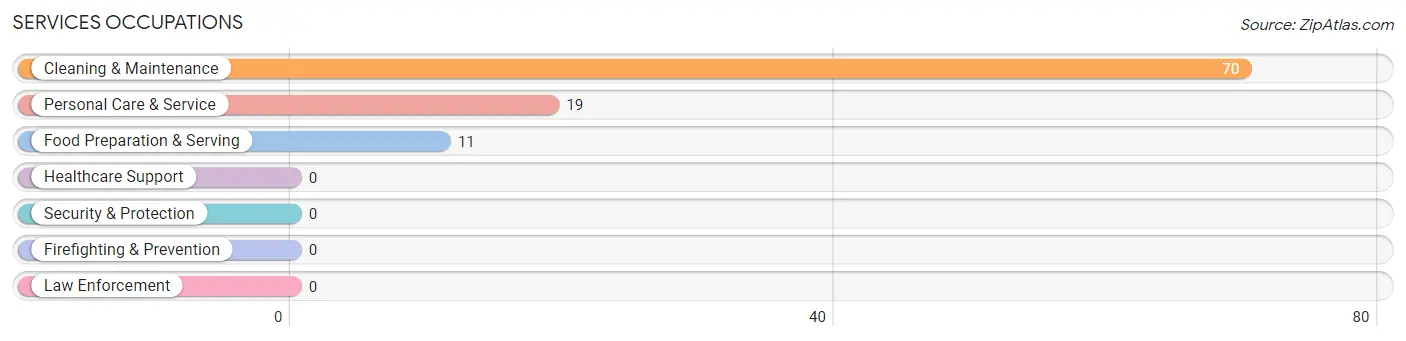
Services Occupations by Sex
Within the Services occupations in Butte Creek Canyon, the most male-oriented occupations are Personal Care & Service (100.0%), and Cleaning & Maintenance (78.6%), while the most female-oriented occupations are Food Preparation & Serving (100.0%), and Cleaning & Maintenance (21.4%).
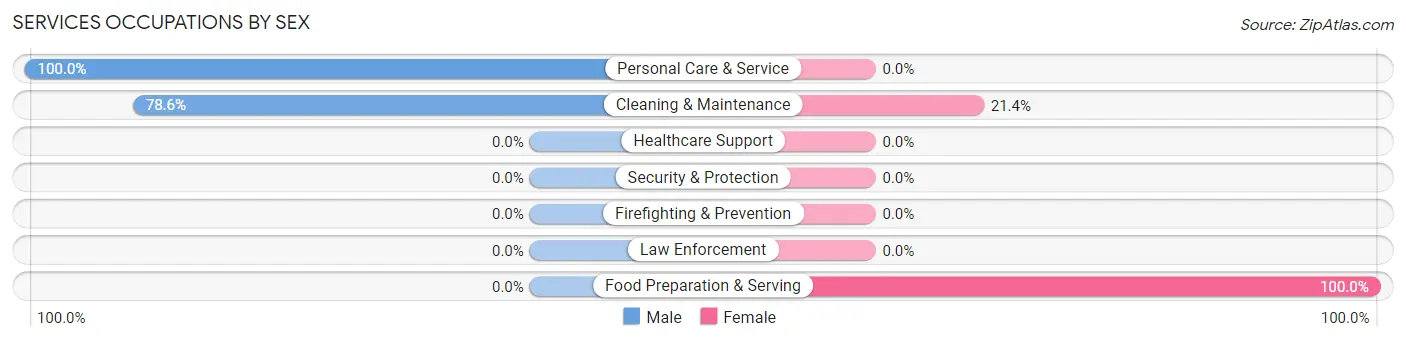
| Occupation | Male | Female |
| Healthcare Support | 0 (0.0%) | 0 (0.0%) |
| Security & Protection | 0 (0.0%) | 0 (0.0%) |
| Firefighting & Prevention | 0 (0.0%) | 0 (0.0%) |
| Law Enforcement | 0 (0.0%) | 0 (0.0%) |
| Food Preparation & Serving | 0 (0.0%) | 11 (100.0%) |
| Cleaning & Maintenance | 55 (78.6%) | 15 (21.4%) |
| Personal Care & Service | 19 (100.0%) | 0 (0.0%) |
| Total (Category) | 74 (74.0%) | 26 (26.0%) |
| Total (Overall) | 167 (60.7%) | 108 (39.3%) |
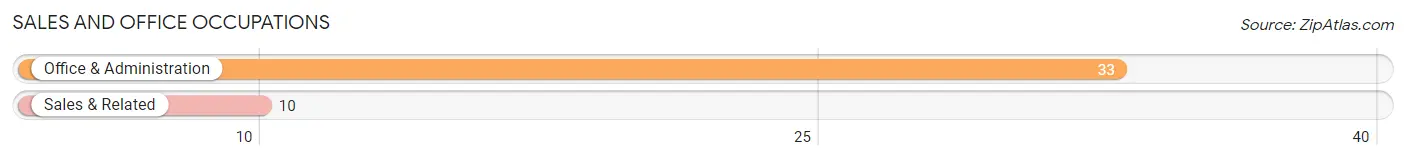
Sales and Office Occupations
The most common Sales and Office occupations in Butte Creek Canyon are Office & Administration (33 | 12.0%), and Sales & Related (10 | 3.6%).
Sales and Office Occupations by Sex
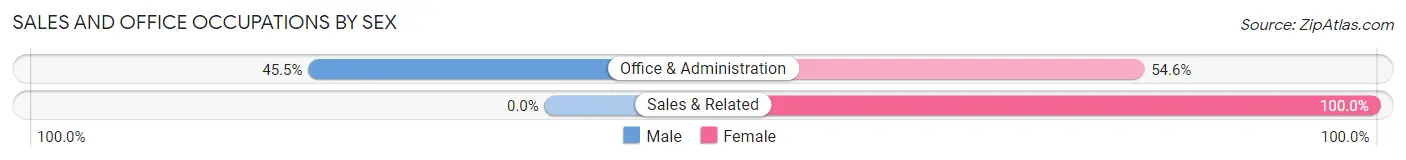
| Occupation | Male | Female |
| Sales & Related | 0 (0.0%) | 10 (100.0%) |
| Office & Administration | 15 (45.5%) | 18 (54.5%) |
| Total (Category) | 15 (34.9%) | 28 (65.1%) |
| Total (Overall) | 167 (60.7%) | 108 (39.3%) |
Natural Resources, Construction and Maintenance Occupations
Natural Resources, Construction and Maintenance Occupations by Sex
| Occupation | Male | Female |
| Farming, Fishing & Forestry | 0 (0.0%) | 0 (0.0%) |
| Construction & Extraction | 0 (0.0%) | 0 (0.0%) |
| Installation, Maintenance & Repair | 0 (0.0%) | 0 (0.0%) |
| Total (Category) | 0 (0.0%) | 0 (0.0%) |
| Total (Overall) | 167 (60.7%) | 108 (39.3%) |
Production, Transportation and Moving Occupations
The most common Production, Transportation and Moving occupations in Butte Creek Canyon are Material Moving (16 | 5.8%), and Production (7 | 2.5%).
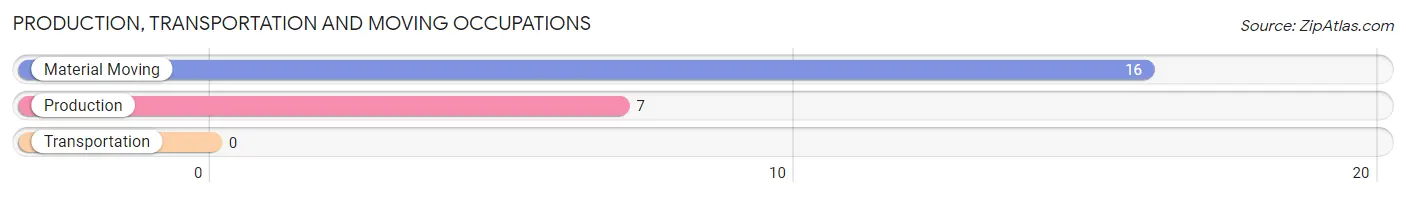
Production, Transportation and Moving Occupations by Sex
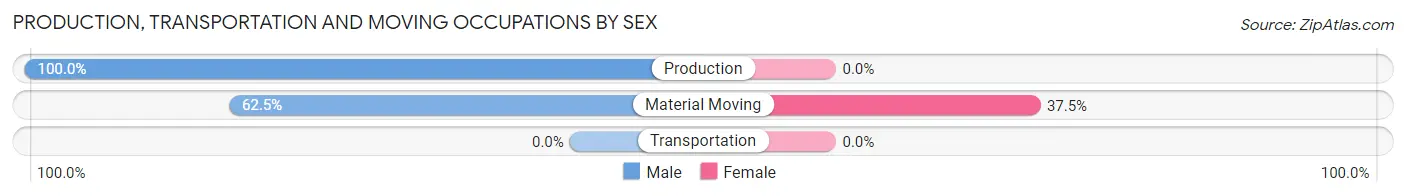
| Occupation | Male | Female |
| Production | 7 (100.0%) | 0 (0.0%) |
| Transportation | 0 (0.0%) | 0 (0.0%) |
| Material Moving | 10 (62.5%) | 6 (37.5%) |
| Total (Category) | 17 (73.9%) | 6 (26.1%) |
| Total (Overall) | 167 (60.7%) | 108 (39.3%) |
Employment Industries by Sex in Butte Creek Canyon
Employment Industries in Butte Creek Canyon
The major employment industries in Butte Creek Canyon include Health Care & Social Assistance (41 | 14.9%), Administrative & Support (36 | 13.1%), Professional & Scientific (33 | 12.0%), Educational Services (30 | 10.9%), and Manufacturing (29 | 10.5%).
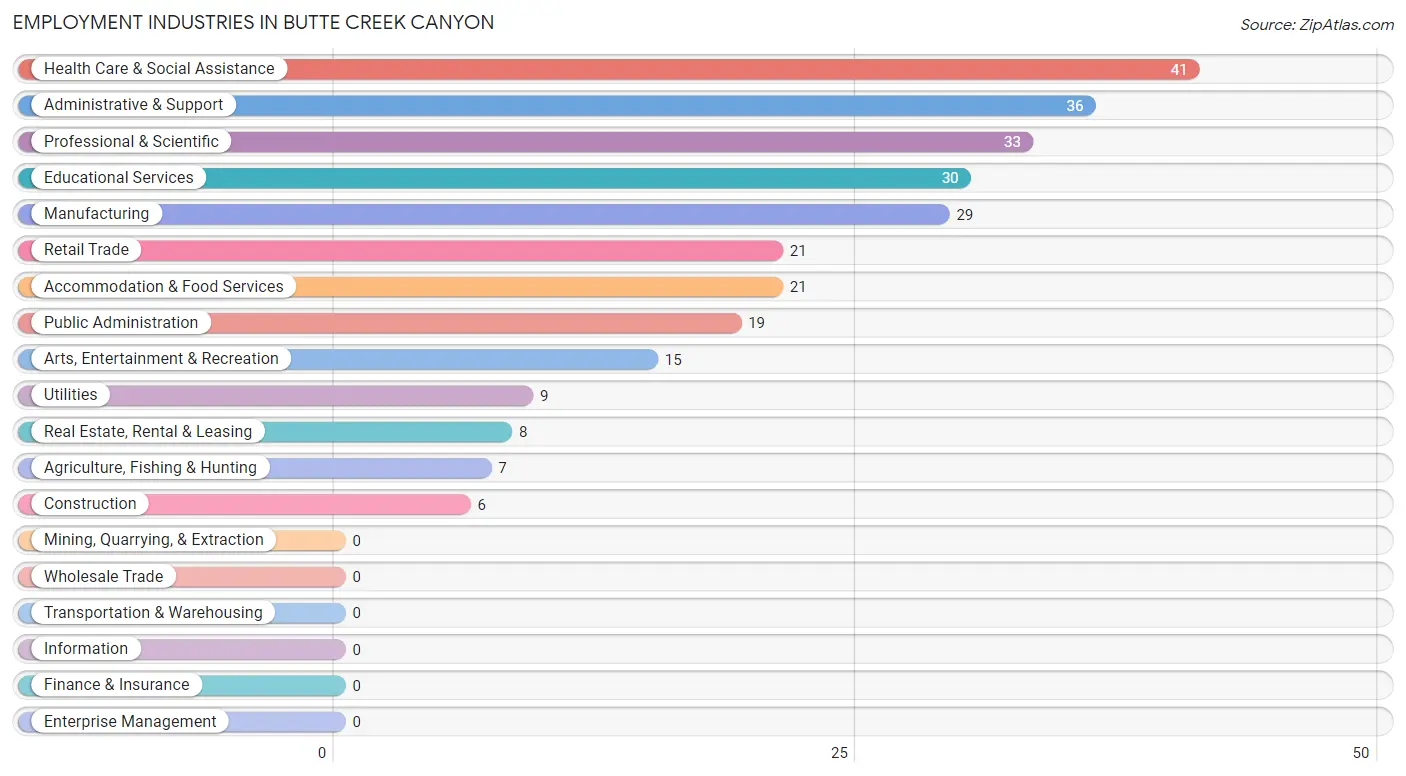
Employment Industries by Sex in Butte Creek Canyon
The Butte Creek Canyon industries that see more men than women are Agriculture, Fishing & Hunting (100.0%), Utilities (100.0%), and Real Estate, Rental & Leasing (100.0%), whereas the industries that tend to have a higher number of women are Construction (100.0%), Accommodation & Food Services (100.0%), and Educational Services (76.7%).
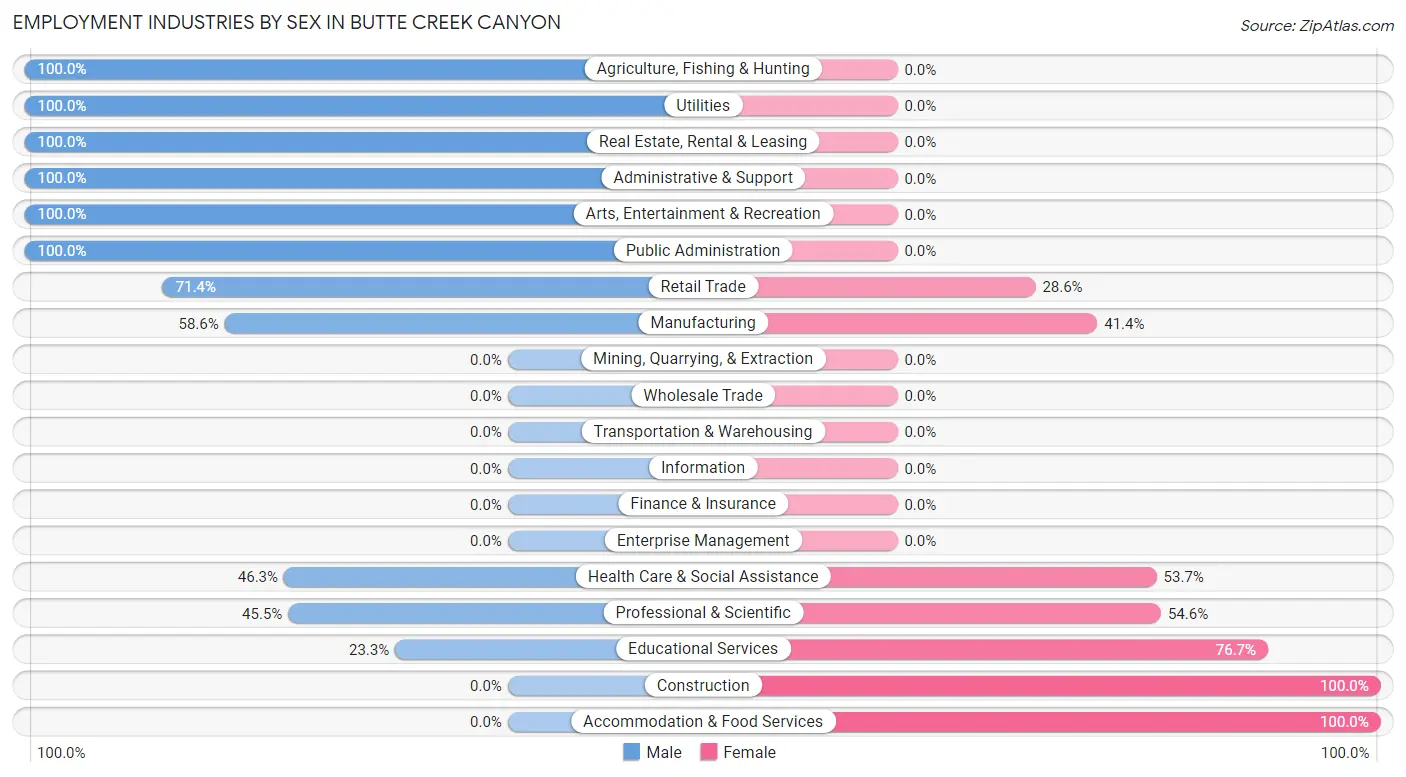
| Industry | Male | Female |
| Agriculture, Fishing & Hunting | 7 (100.0%) | 0 (0.0%) |
| Mining, Quarrying, & Extraction | 0 (0.0%) | 0 (0.0%) |
| Construction | 0 (0.0%) | 6 (100.0%) |
| Manufacturing | 17 (58.6%) | 12 (41.4%) |
| Wholesale Trade | 0 (0.0%) | 0 (0.0%) |
| Retail Trade | 15 (71.4%) | 6 (28.6%) |
| Transportation & Warehousing | 0 (0.0%) | 0 (0.0%) |
| Utilities | 9 (100.0%) | 0 (0.0%) |
| Information | 0 (0.0%) | 0 (0.0%) |
| Finance & Insurance | 0 (0.0%) | 0 (0.0%) |
| Real Estate, Rental & Leasing | 8 (100.0%) | 0 (0.0%) |
| Professional & Scientific | 15 (45.5%) | 18 (54.5%) |
| Enterprise Management | 0 (0.0%) | 0 (0.0%) |
| Administrative & Support | 36 (100.0%) | 0 (0.0%) |
| Educational Services | 7 (23.3%) | 23 (76.7%) |
| Health Care & Social Assistance | 19 (46.3%) | 22 (53.7%) |
| Arts, Entertainment & Recreation | 15 (100.0%) | 0 (0.0%) |
| Accommodation & Food Services | 0 (0.0%) | 21 (100.0%) |
| Public Administration | 19 (100.0%) | 0 (0.0%) |
| Total | 167 (60.7%) | 108 (39.3%) |
Education in Butte Creek Canyon
School Enrollment in Butte Creek Canyon
The most common levels of schooling among the 144 students in Butte Creek Canyon are high school (45 | 31.2%), middle school (38 | 26.4%), and college / undergraduate (34 | 23.6%).
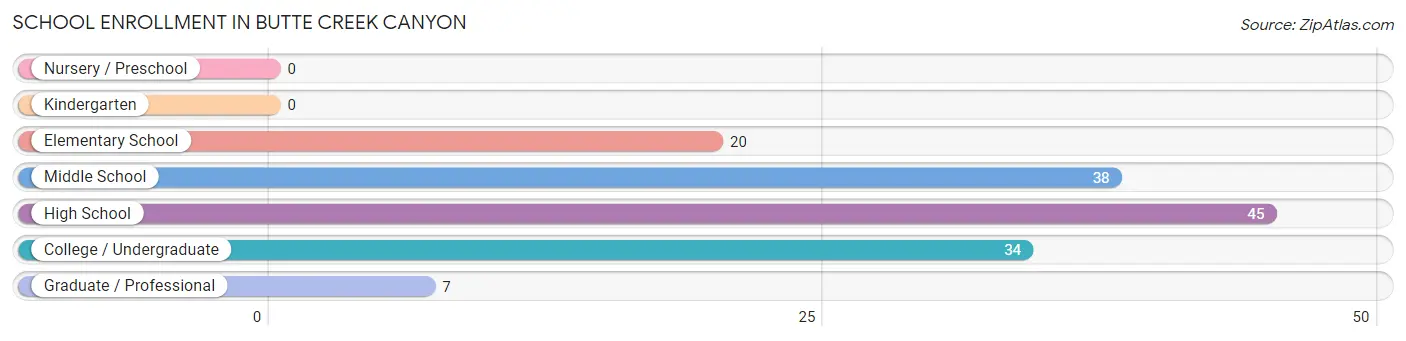
| School Level | # Students | % Students |
| Nursery / Preschool | 0 | 0.0% |
| Kindergarten | 0 | 0.0% |
| Elementary School | 20 | 13.9% |
| Middle School | 38 | 26.4% |
| High School | 45 | 31.2% |
| College / Undergraduate | 34 | 23.6% |
| Graduate / Professional | 7 | 4.9% |
| Total | 144 | 100.0% |
School Enrollment by Age by Funding Source in Butte Creek Canyon
Out of a total of 144 students who are enrolled in schools in Butte Creek Canyon, 10 (6.9%) attend a private institution, while the remaining 134 (93.1%) are enrolled in public schools. The age group of 18 to 19 year olds has the highest likelihood of being enrolled in private schools, with 10 (100.0% in the age bracket) enrolled. Conversely, the age group of 5 to 9 year old has the lowest likelihood of being enrolled in a private school, with 20 (100.0% in the age bracket) attending a public institution.
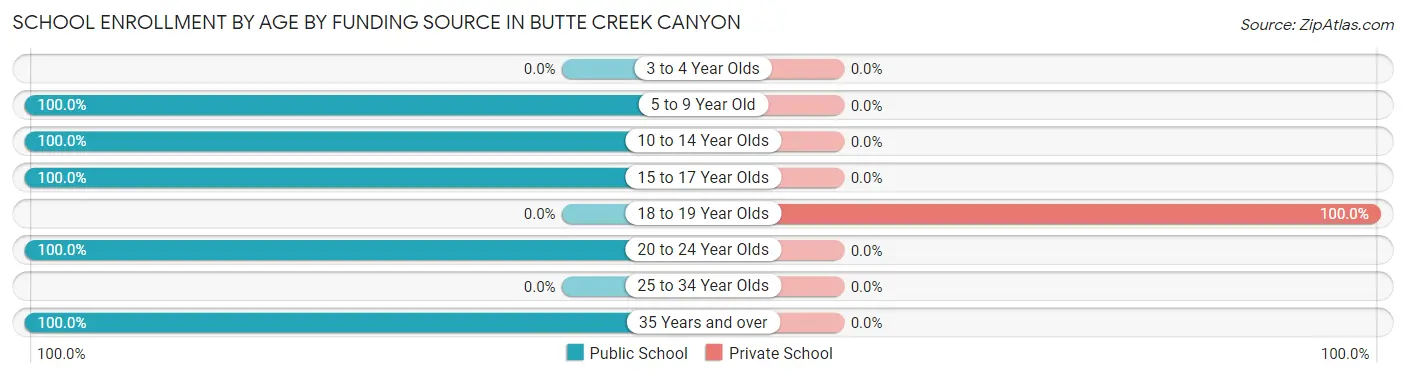
| Age Bracket | Public School | Private School |
| 3 to 4 Year Olds | 0 (0.0%) | 0 (0.0%) |
| 5 to 9 Year Old | 20 (100.0%) | 0 (0.0%) |
| 10 to 14 Year Olds | 72 (100.0%) | 0 (0.0%) |
| 15 to 17 Year Olds | 11 (100.0%) | 0 (0.0%) |
| 18 to 19 Year Olds | 0 (0.0%) | 10 (100.0%) |
| 20 to 24 Year Olds | 11 (100.0%) | 0 (0.0%) |
| 25 to 34 Year Olds | 0 (0.0%) | 0 (0.0%) |
| 35 Years and over | 20 (100.0%) | 0 (0.0%) |
| Total | 134 (93.1%) | 10 (6.9%) |
Educational Attainment by Field of Study in Butte Creek Canyon
Bio, nature & agricultural (62 | 17.8%), business (52 | 14.9%), social sciences (44 | 12.6%), arts & humanities (36 | 10.3%), and education (34 | 9.7%) are the most common fields of study among 349 individuals in Butte Creek Canyon who have obtained a bachelor's degree or higher.
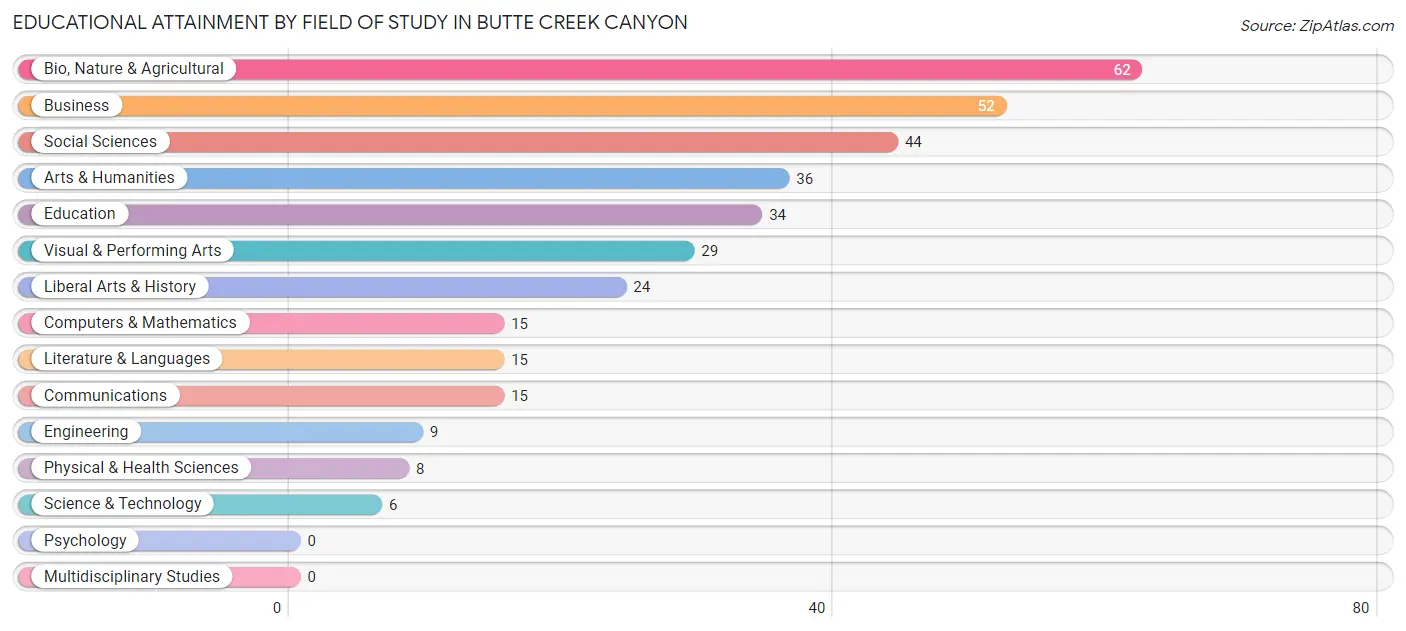
| Field of Study | # Graduates | % Graduates |
| Computers & Mathematics | 15 | 4.3% |
| Bio, Nature & Agricultural | 62 | 17.8% |
| Physical & Health Sciences | 8 | 2.3% |
| Psychology | 0 | 0.0% |
| Social Sciences | 44 | 12.6% |
| Engineering | 9 | 2.6% |
| Multidisciplinary Studies | 0 | 0.0% |
| Science & Technology | 6 | 1.7% |
| Business | 52 | 14.9% |
| Education | 34 | 9.7% |
| Literature & Languages | 15 | 4.3% |
| Liberal Arts & History | 24 | 6.9% |
| Visual & Performing Arts | 29 | 8.3% |
| Communications | 15 | 4.3% |
| Arts & Humanities | 36 | 10.3% |
| Total | 349 | 100.0% |
Transportation & Commute in Butte Creek Canyon
Vehicle Availability by Sex in Butte Creek Canyon
The most prevalent vehicle ownership categories in Butte Creek Canyon are males with 2 vehicles (87, accounting for 52.1%) and females with 2 vehicles (34, making up 80.6%).
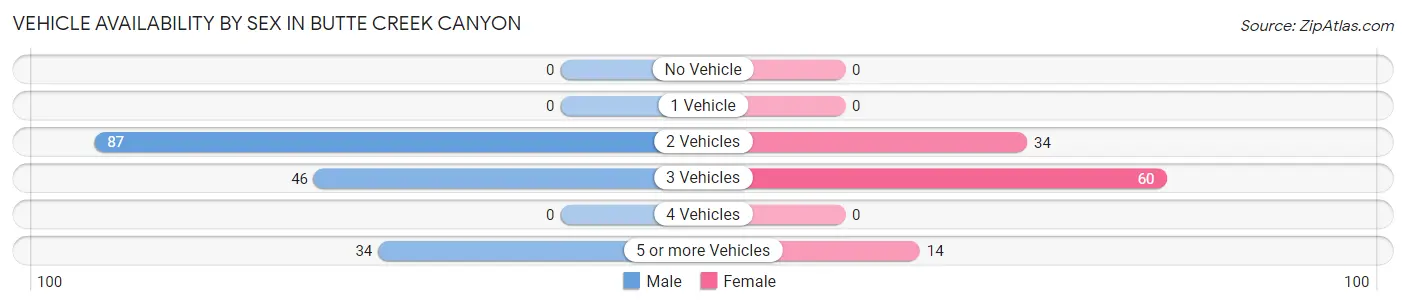
| Vehicles Available | Male | Female |
| No Vehicle | 0 (0.0%) | 0 (0.0%) |
| 1 Vehicle | 0 (0.0%) | 0 (0.0%) |
| 2 Vehicles | 87 (52.1%) | 34 (31.5%) |
| 3 Vehicles | 46 (27.5%) | 60 (55.6%) |
| 4 Vehicles | 0 (0.0%) | 0 (0.0%) |
| 5 or more Vehicles | 34 (20.4%) | 14 (13.0%) |
| Total | 167 (100.0%) | 108 (100.0%) |
Commute Time in Butte Creek Canyon
The most frequently occuring commute durations in Butte Creek Canyon are 20 to 24 minutes (81 commuters, 34.2%), 15 to 19 minutes (76 commuters, 32.1%), and 10 to 14 minutes (25 commuters, 10.5%).
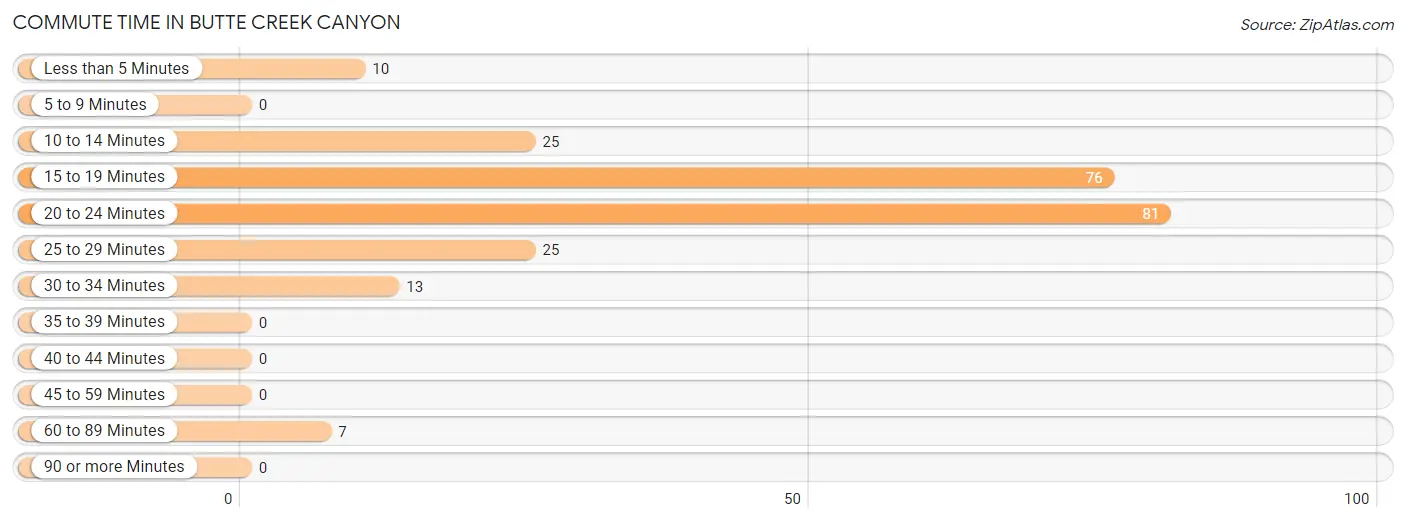
| Commute Time | # Commuters | % Commuters |
| Less than 5 Minutes | 10 | 4.2% |
| 5 to 9 Minutes | 0 | 0.0% |
| 10 to 14 Minutes | 25 | 10.5% |
| 15 to 19 Minutes | 76 | 32.1% |
| 20 to 24 Minutes | 81 | 34.2% |
| 25 to 29 Minutes | 25 | 10.5% |
| 30 to 34 Minutes | 13 | 5.5% |
| 35 to 39 Minutes | 0 | 0.0% |
| 40 to 44 Minutes | 0 | 0.0% |
| 45 to 59 Minutes | 0 | 0.0% |
| 60 to 89 Minutes | 7 | 2.9% |
| 90 or more Minutes | 0 | 0.0% |
Commute Time by Sex in Butte Creek Canyon
The most common commute times in Butte Creek Canyon are 20 to 24 minutes (63 commuters, 46.0%) for males and 15 to 19 minutes (48 commuters, 48.0%) for females.
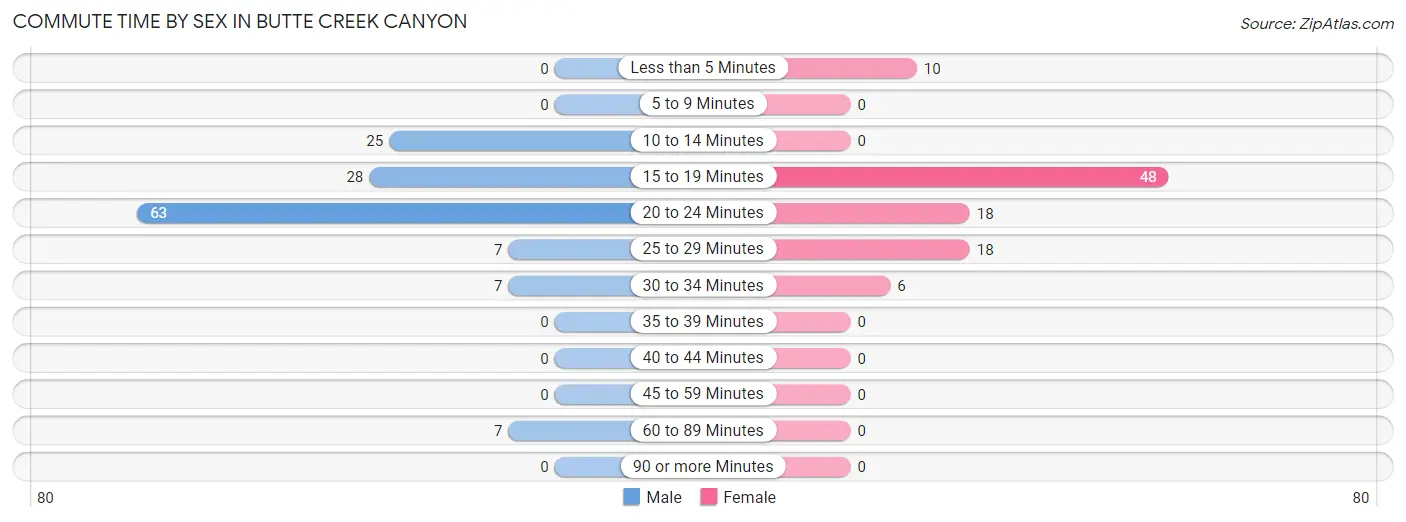
| Commute Time | Male | Female |
| Less than 5 Minutes | 0 (0.0%) | 10 (10.0%) |
| 5 to 9 Minutes | 0 (0.0%) | 0 (0.0%) |
| 10 to 14 Minutes | 25 (18.2%) | 0 (0.0%) |
| 15 to 19 Minutes | 28 (20.4%) | 48 (48.0%) |
| 20 to 24 Minutes | 63 (46.0%) | 18 (18.0%) |
| 25 to 29 Minutes | 7 (5.1%) | 18 (18.0%) |
| 30 to 34 Minutes | 7 (5.1%) | 6 (6.0%) |
| 35 to 39 Minutes | 0 (0.0%) | 0 (0.0%) |
| 40 to 44 Minutes | 0 (0.0%) | 0 (0.0%) |
| 45 to 59 Minutes | 0 (0.0%) | 0 (0.0%) |
| 60 to 89 Minutes | 7 (5.1%) | 0 (0.0%) |
| 90 or more Minutes | 0 (0.0%) | 0 (0.0%) |
Time of Departure to Work by Sex in Butte Creek Canyon
The most frequent times of departure to work in Butte Creek Canyon are 6:00 AM to 6:29 AM (37, 27.0%) for males and 8:00 AM to 8:29 AM (20, 20.0%) for females.
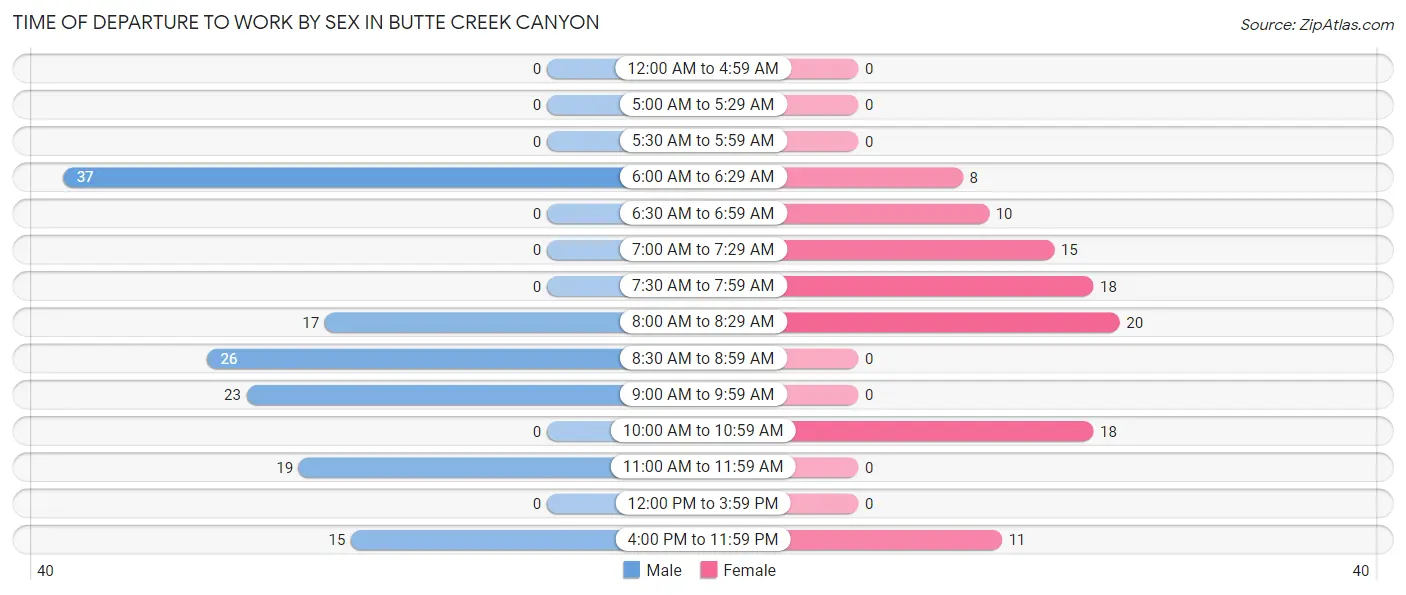
| Time of Departure | Male | Female |
| 12:00 AM to 4:59 AM | 0 (0.0%) | 0 (0.0%) |
| 5:00 AM to 5:29 AM | 0 (0.0%) | 0 (0.0%) |
| 5:30 AM to 5:59 AM | 0 (0.0%) | 0 (0.0%) |
| 6:00 AM to 6:29 AM | 37 (27.0%) | 8 (8.0%) |
| 6:30 AM to 6:59 AM | 0 (0.0%) | 10 (10.0%) |
| 7:00 AM to 7:29 AM | 0 (0.0%) | 15 (15.0%) |
| 7:30 AM to 7:59 AM | 0 (0.0%) | 18 (18.0%) |
| 8:00 AM to 8:29 AM | 17 (12.4%) | 20 (20.0%) |
| 8:30 AM to 8:59 AM | 26 (19.0%) | 0 (0.0%) |
| 9:00 AM to 9:59 AM | 23 (16.8%) | 0 (0.0%) |
| 10:00 AM to 10:59 AM | 0 (0.0%) | 18 (18.0%) |
| 11:00 AM to 11:59 AM | 19 (13.9%) | 0 (0.0%) |
| 12:00 PM to 3:59 PM | 0 (0.0%) | 0 (0.0%) |
| 4:00 PM to 11:59 PM | 15 (11.0%) | 11 (11.0%) |
| Total | 137 (100.0%) | 100 (100.0%) |
Housing Occupancy in Butte Creek Canyon
Occupancy by Ownership in Butte Creek Canyon
Of the total 263 dwellings in Butte Creek Canyon, owner-occupied units account for 206 (78.3%), while renter-occupied units make up 57 (21.7%).
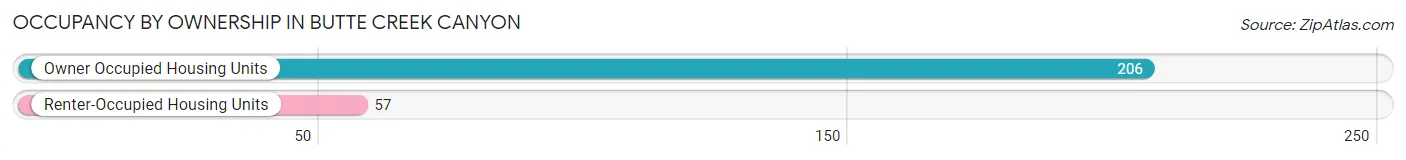
| Occupancy | # Housing Units | % Housing Units |
| Owner Occupied Housing Units | 206 | 78.3% |
| Renter-Occupied Housing Units | 57 | 21.7% |
| Total Occupied Housing Units | 263 | 100.0% |
Occupancy by Household Size in Butte Creek Canyon
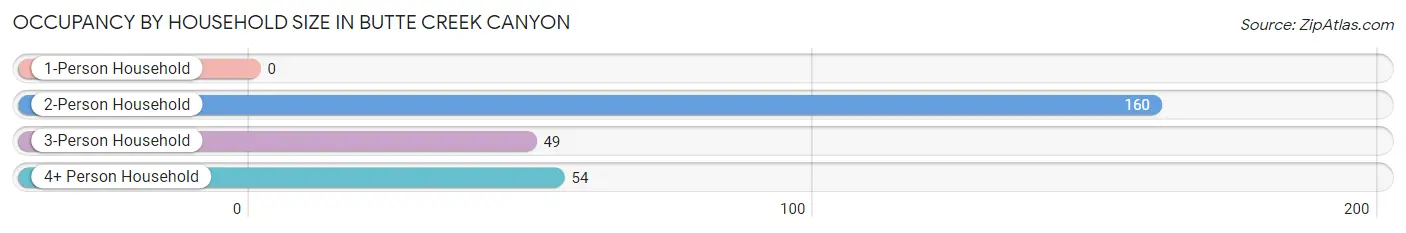
| Household Size | # Housing Units | % Housing Units |
| 1-Person Household | 0 | 0.0% |
| 2-Person Household | 160 | 60.8% |
| 3-Person Household | 49 | 18.6% |
| 4+ Person Household | 54 | 20.5% |
| Total Housing Units | 263 | 100.0% |
Occupancy by Ownership by Household Size in Butte Creek Canyon
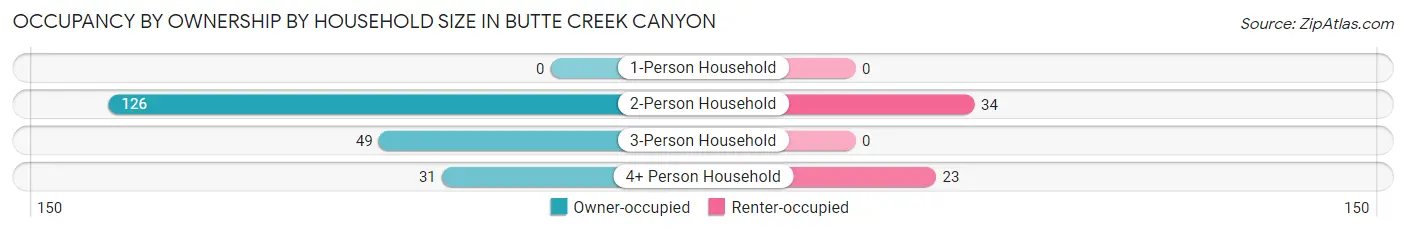
| Household Size | Owner-occupied | Renter-occupied |
| 1-Person Household | 0 (0.0%) | 0 (0.0%) |
| 2-Person Household | 126 (78.7%) | 34 (21.2%) |
| 3-Person Household | 49 (100.0%) | 0 (0.0%) |
| 4+ Person Household | 31 (57.4%) | 23 (42.6%) |
| Total Housing Units | 206 (78.3%) | 57 (21.7%) |
Occupancy by Educational Attainment in Butte Creek Canyon
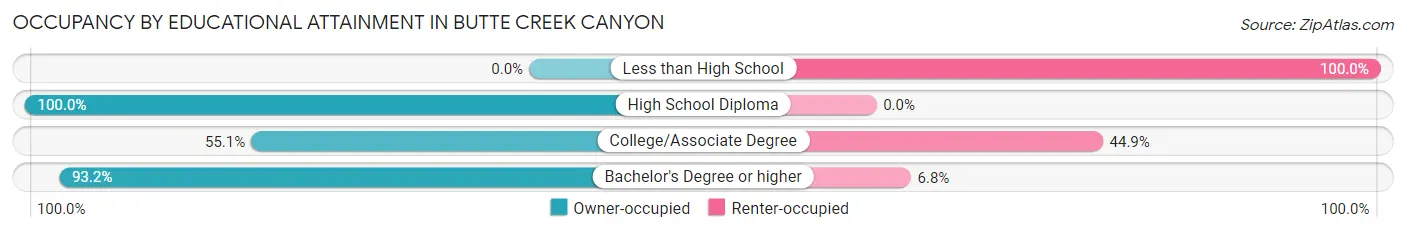
| Household Size | Owner-occupied | Renter-occupied |
| Less than High School | 0 (0.0%) | 23 (100.0%) |
| High School Diploma | 15 (100.0%) | 0 (0.0%) |
| College/Associate Degree | 27 (55.1%) | 22 (44.9%) |
| Bachelor's Degree or higher | 164 (93.2%) | 12 (6.8%) |
Occupancy by Age of Householder in Butte Creek Canyon
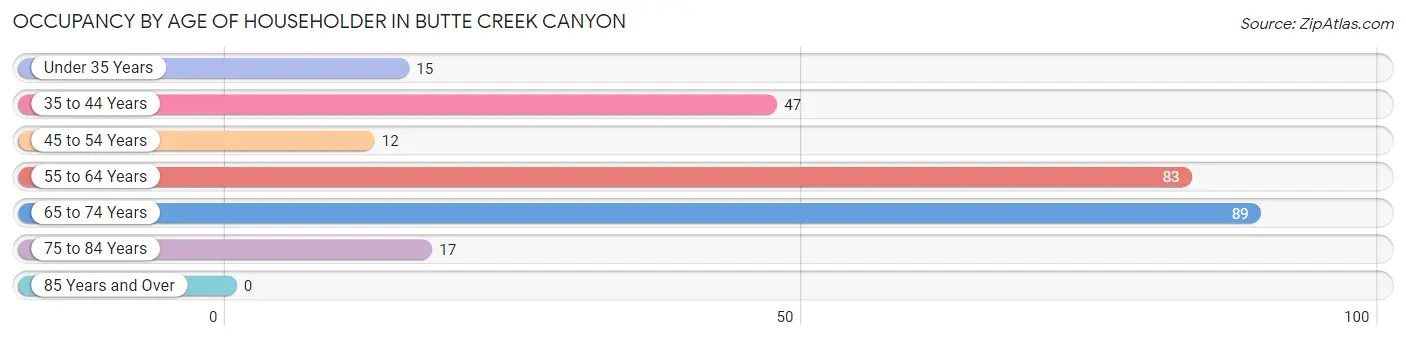
| Age Bracket | # Households | % Households |
| Under 35 Years | 15 | 5.7% |
| 35 to 44 Years | 47 | 17.9% |
| 45 to 54 Years | 12 | 4.6% |
| 55 to 64 Years | 83 | 31.6% |
| 65 to 74 Years | 89 | 33.8% |
| 75 to 84 Years | 17 | 6.5% |
| 85 Years and Over | 0 | 0.0% |
| Total | 263 | 100.0% |
Housing Finances in Butte Creek Canyon
Median Income by Occupancy in Butte Creek Canyon
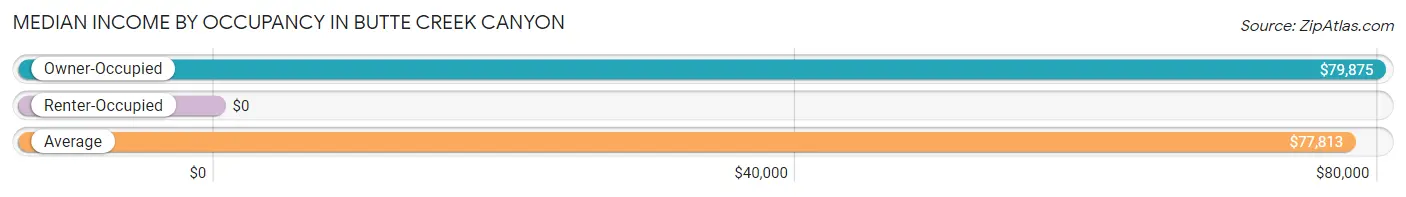
| Occupancy Type | # Households | Median Income |
| Owner-Occupied | 206 (78.3%) | $79,875 |
| Renter-Occupied | 57 (21.7%) | $0 |
| Average | 263 (100.0%) | $77,813 |
Occupancy by Householder Income Bracket in Butte Creek Canyon
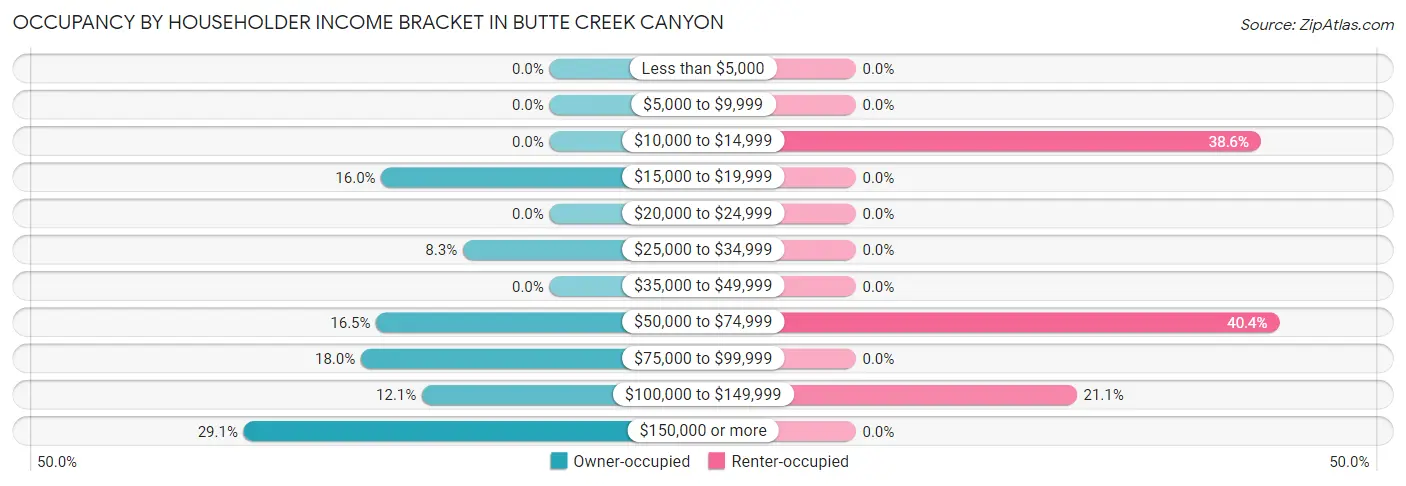
| Income Bracket | Owner-occupied | Renter-occupied |
| Less than $5,000 | 0 (0.0%) | 0 (0.0%) |
| $5,000 to $9,999 | 0 (0.0%) | 0 (0.0%) |
| $10,000 to $14,999 | 0 (0.0%) | 22 (38.6%) |
| $15,000 to $19,999 | 33 (16.0%) | 0 (0.0%) |
| $20,000 to $24,999 | 0 (0.0%) | 0 (0.0%) |
| $25,000 to $34,999 | 17 (8.3%) | 0 (0.0%) |
| $35,000 to $49,999 | 0 (0.0%) | 0 (0.0%) |
| $50,000 to $74,999 | 34 (16.5%) | 23 (40.4%) |
| $75,000 to $99,999 | 37 (18.0%) | 0 (0.0%) |
| $100,000 to $149,999 | 25 (12.1%) | 12 (21.0%) |
| $150,000 or more | 60 (29.1%) | 0 (0.0%) |
| Total | 206 (100.0%) | 57 (100.0%) |
Monthly Housing Cost Tiers in Butte Creek Canyon
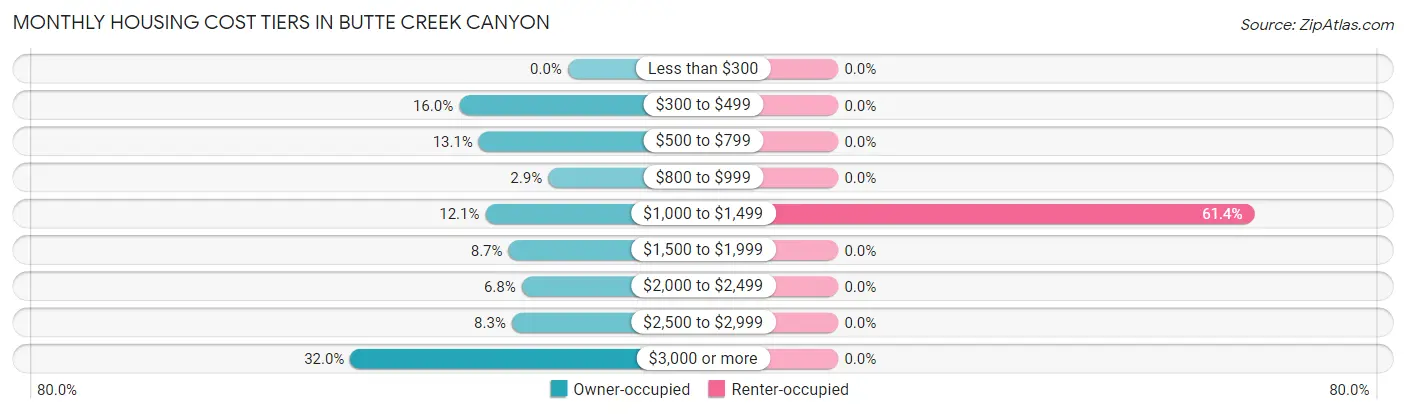
| Monthly Cost | Owner-occupied | Renter-occupied |
| Less than $300 | 0 (0.0%) | 0 (0.0%) |
| $300 to $499 | 33 (16.0%) | 0 (0.0%) |
| $500 to $799 | 27 (13.1%) | 0 (0.0%) |
| $800 to $999 | 6 (2.9%) | 0 (0.0%) |
| $1,000 to $1,499 | 25 (12.1%) | 35 (61.4%) |
| $1,500 to $1,999 | 18 (8.7%) | 0 (0.0%) |
| $2,000 to $2,499 | 14 (6.8%) | 0 (0.0%) |
| $2,500 to $2,999 | 17 (8.3%) | 0 (0.0%) |
| $3,000 or more | 66 (32.0%) | 0 (0.0%) |
| Total | 206 (100.0%) | 57 (100.0%) |
Physical Housing Characteristics in Butte Creek Canyon
Housing Structures in Butte Creek Canyon
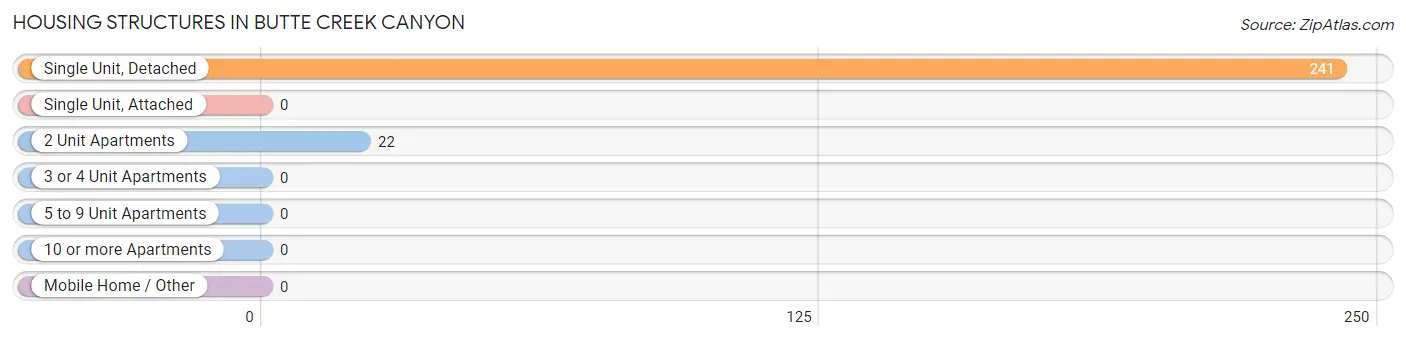
| Structure Type | # Housing Units | % Housing Units |
| Single Unit, Detached | 241 | 91.6% |
| Single Unit, Attached | 0 | 0.0% |
| 2 Unit Apartments | 22 | 8.4% |
| 3 or 4 Unit Apartments | 0 | 0.0% |
| 5 to 9 Unit Apartments | 0 | 0.0% |
| 10 or more Apartments | 0 | 0.0% |
| Mobile Home / Other | 0 | 0.0% |
| Total | 263 | 100.0% |
Housing Structures by Occupancy in Butte Creek Canyon
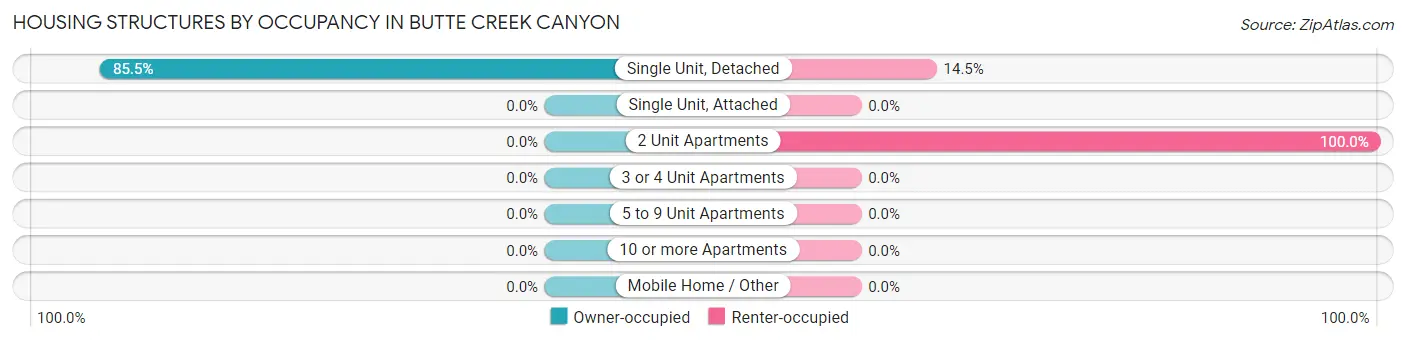
| Structure Type | Owner-occupied | Renter-occupied |
| Single Unit, Detached | 206 (85.5%) | 35 (14.5%) |
| Single Unit, Attached | 0 (0.0%) | 0 (0.0%) |
| 2 Unit Apartments | 0 (0.0%) | 22 (100.0%) |
| 3 or 4 Unit Apartments | 0 (0.0%) | 0 (0.0%) |
| 5 to 9 Unit Apartments | 0 (0.0%) | 0 (0.0%) |
| 10 or more Apartments | 0 (0.0%) | 0 (0.0%) |
| Mobile Home / Other | 0 (0.0%) | 0 (0.0%) |
| Total | 206 (78.3%) | 57 (21.7%) |
Housing Structures by Number of Rooms in Butte Creek Canyon
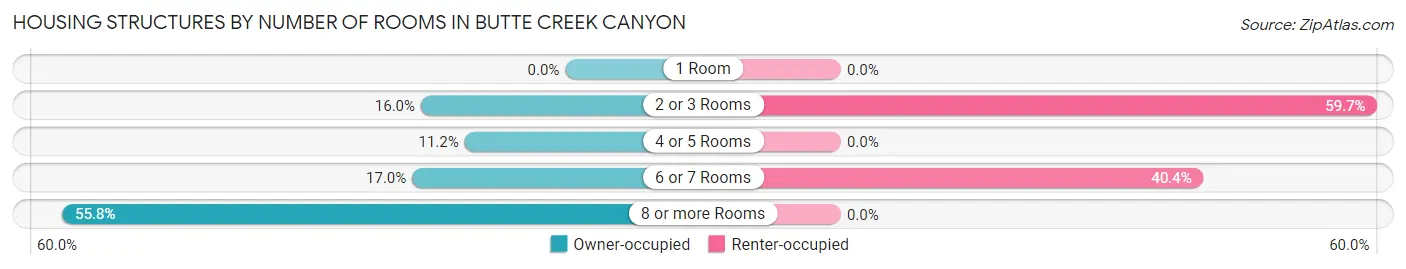
| Number of Rooms | Owner-occupied | Renter-occupied |
| 1 Room | 0 (0.0%) | 0 (0.0%) |
| 2 or 3 Rooms | 33 (16.0%) | 34 (59.7%) |
| 4 or 5 Rooms | 23 (11.2%) | 0 (0.0%) |
| 6 or 7 Rooms | 35 (17.0%) | 23 (40.4%) |
| 8 or more Rooms | 115 (55.8%) | 0 (0.0%) |
| Total | 206 (100.0%) | 57 (100.0%) |
Housing Structure by Heating Type in Butte Creek Canyon
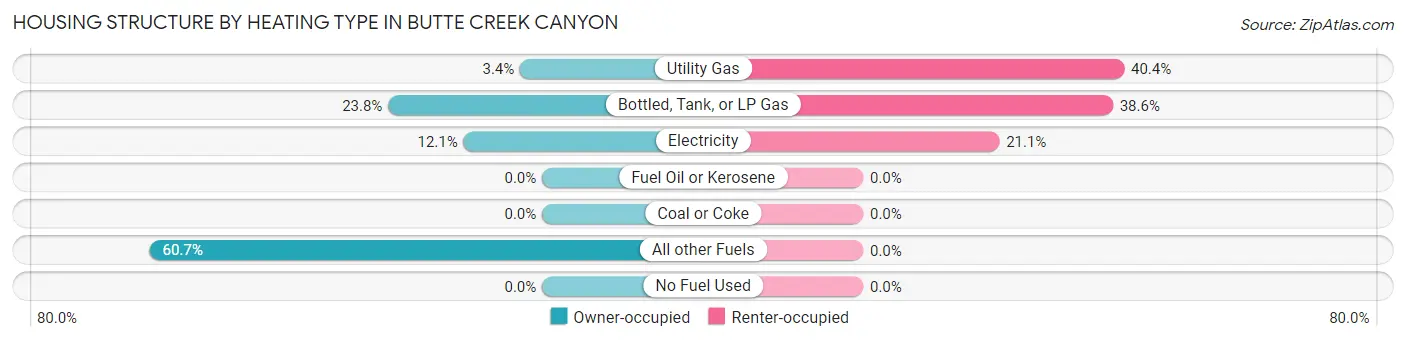
| Heating Type | Owner-occupied | Renter-occupied |
| Utility Gas | 7 (3.4%) | 23 (40.4%) |
| Bottled, Tank, or LP Gas | 49 (23.8%) | 22 (38.6%) |
| Electricity | 25 (12.1%) | 12 (21.0%) |
| Fuel Oil or Kerosene | 0 (0.0%) | 0 (0.0%) |
| Coal or Coke | 0 (0.0%) | 0 (0.0%) |
| All other Fuels | 125 (60.7%) | 0 (0.0%) |
| No Fuel Used | 0 (0.0%) | 0 (0.0%) |
| Total | 206 (100.0%) | 57 (100.0%) |
Household Vehicle Usage in Butte Creek Canyon
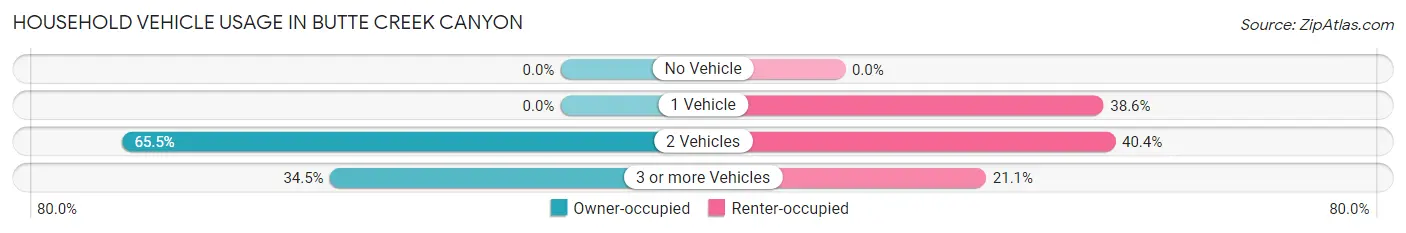
| Vehicles per Household | Owner-occupied | Renter-occupied |
| No Vehicle | 0 (0.0%) | 0 (0.0%) |
| 1 Vehicle | 0 (0.0%) | 22 (38.6%) |
| 2 Vehicles | 135 (65.5%) | 23 (40.4%) |
| 3 or more Vehicles | 71 (34.5%) | 12 (21.0%) |
| Total | 206 (100.0%) | 57 (100.0%) |
Real Estate & Mortgages in Butte Creek Canyon
Real Estate and Mortgage Overview in Butte Creek Canyon
| Characteristic | Without Mortgage | With Mortgage |
| Housing Units | 70 | 136 |
| Median Property Value | - | - |
| Median Household Income | - | - |
| Monthly Housing Costs | $610 | $66 |
| Real Estate Taxes | $2,583 | $0 |
Property Value by Mortgage Status in Butte Creek Canyon
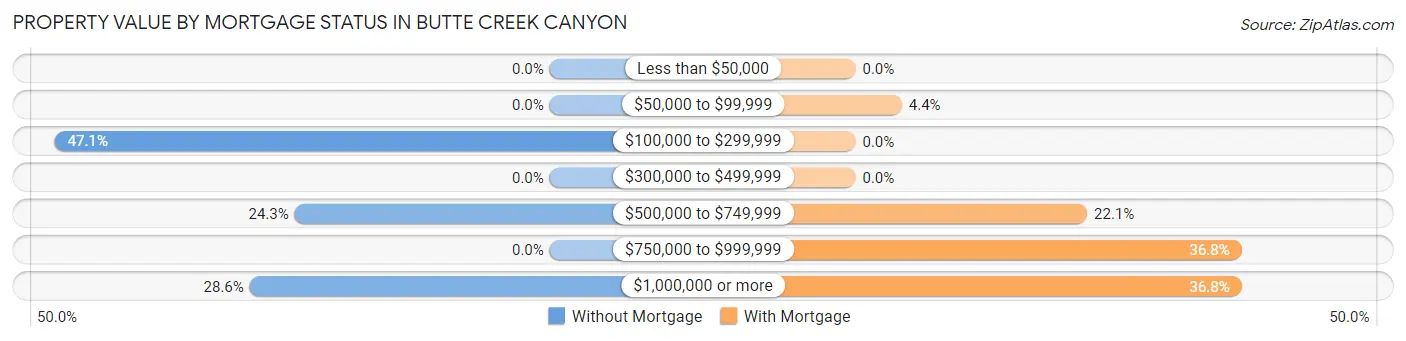
| Property Value | Without Mortgage | With Mortgage |
| Less than $50,000 | 0 (0.0%) | 0 (0.0%) |
| $50,000 to $99,999 | 0 (0.0%) | 6 (4.4%) |
| $100,000 to $299,999 | 33 (47.1%) | 0 (0.0%) |
| $300,000 to $499,999 | 0 (0.0%) | 0 (0.0%) |
| $500,000 to $749,999 | 17 (24.3%) | 30 (22.1%) |
| $750,000 to $999,999 | 0 (0.0%) | 50 (36.8%) |
| $1,000,000 or more | 20 (28.6%) | 50 (36.8%) |
| Total | 70 (100.0%) | 136 (100.0%) |
Household Income by Mortgage Status in Butte Creek Canyon
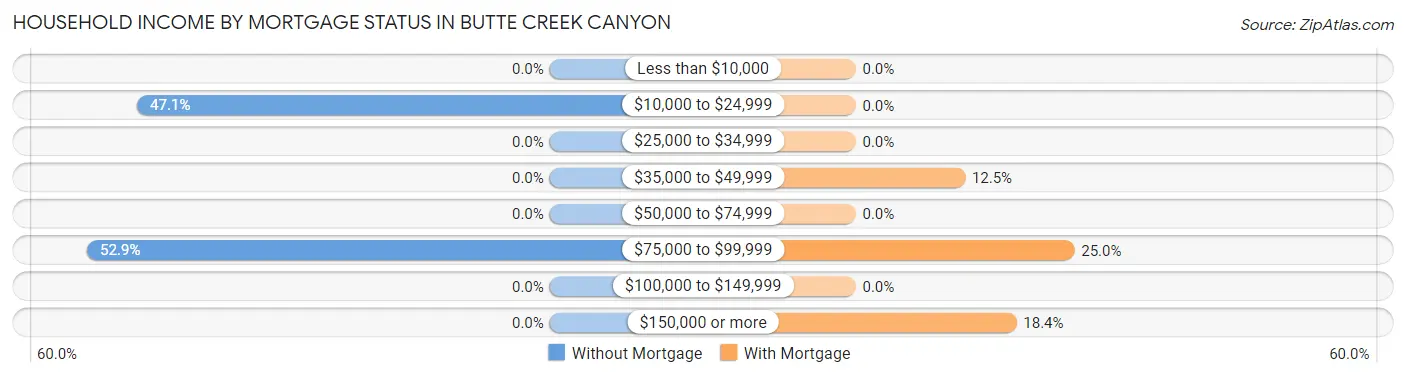
| Household Income | Without Mortgage | With Mortgage |
| Less than $10,000 | 0 (0.0%) | 0 (0.0%) |
| $10,000 to $24,999 | 33 (47.1%) | 0 (0.0%) |
| $25,000 to $34,999 | 0 (0.0%) | 0 (0.0%) |
| $35,000 to $49,999 | 0 (0.0%) | 17 (12.5%) |
| $50,000 to $74,999 | 0 (0.0%) | 0 (0.0%) |
| $75,000 to $99,999 | 37 (52.9%) | 34 (25.0%) |
| $100,000 to $149,999 | 0 (0.0%) | 0 (0.0%) |
| $150,000 or more | 0 (0.0%) | 25 (18.4%) |
| Total | 70 (100.0%) | 136 (100.0%) |
Property Value to Household Income Ratio in Butte Creek Canyon
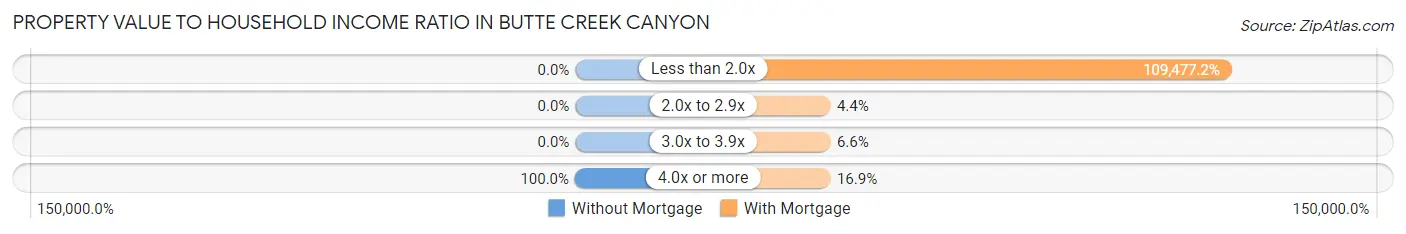
| Value-to-Income Ratio | Without Mortgage | With Mortgage |
| Less than 2.0x | 0 (0.0%) | 148,889 (109,477.2%) |
| 2.0x to 2.9x | 0 (0.0%) | 6 (4.4%) |
| 3.0x to 3.9x | 0 (0.0%) | 9 (6.6%) |
| 4.0x or more | 70 (100.0%) | 23 (16.9%) |
| Total | 70 (100.0%) | 136 (100.0%) |
Real Estate Taxes by Mortgage Status in Butte Creek Canyon
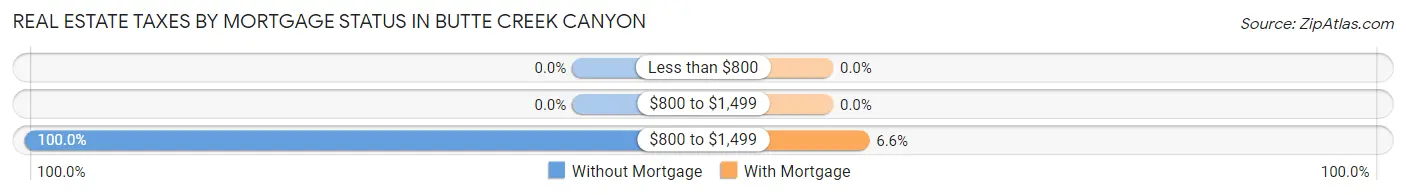
| Property Taxes | Without Mortgage | With Mortgage |
| Less than $800 | 0 (0.0%) | 0 (0.0%) |
| $800 to $1,499 | 0 (0.0%) | 0 (0.0%) |
| $800 to $1,499 | 70 (100.0%) | 9 (6.6%) |
| Total | 70 (100.0%) | 136 (100.0%) |
Health & Disability in Butte Creek Canyon
Health Insurance Coverage by Age in Butte Creek Canyon
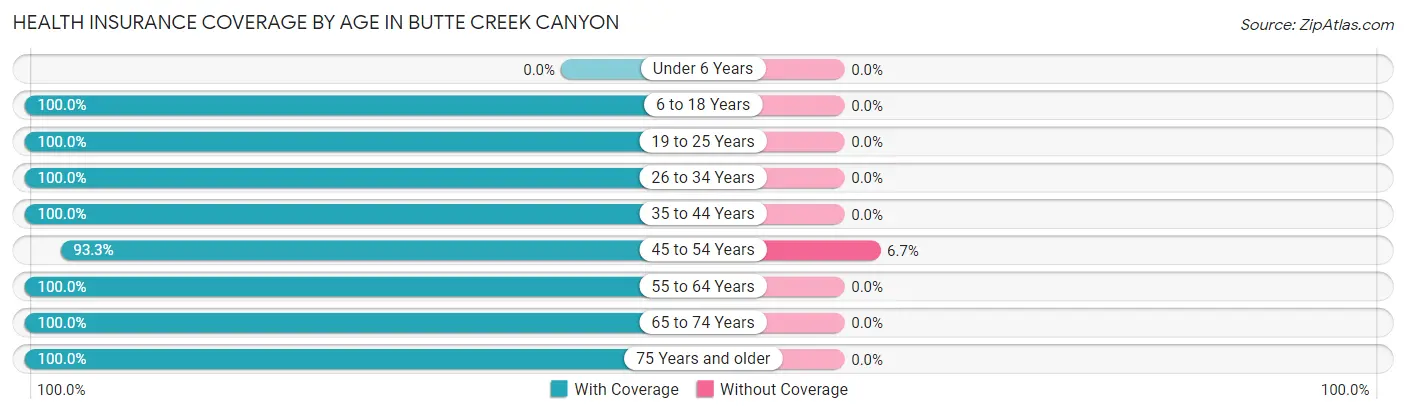
| Age Bracket | With Coverage | Without Coverage |
| Under 6 Years | 0 (0.0%) | 0 (0.0%) |
| 6 to 18 Years | 113 (100.0%) | 0 (0.0%) |
| 19 to 25 Years | 30 (100.0%) | 0 (0.0%) |
| 26 to 34 Years | 36 (100.0%) | 0 (0.0%) |
| 35 to 44 Years | 70 (100.0%) | 0 (0.0%) |
| 45 to 54 Years | 56 (93.3%) | 4 (6.7%) |
| 55 to 64 Years | 123 (100.0%) | 0 (0.0%) |
| 65 to 74 Years | 205 (100.0%) | 0 (0.0%) |
| 75 Years and older | 53 (100.0%) | 0 (0.0%) |
| Total | 686 (99.4%) | 4 (0.6%) |
Health Insurance Coverage by Citizenship Status in Butte Creek Canyon
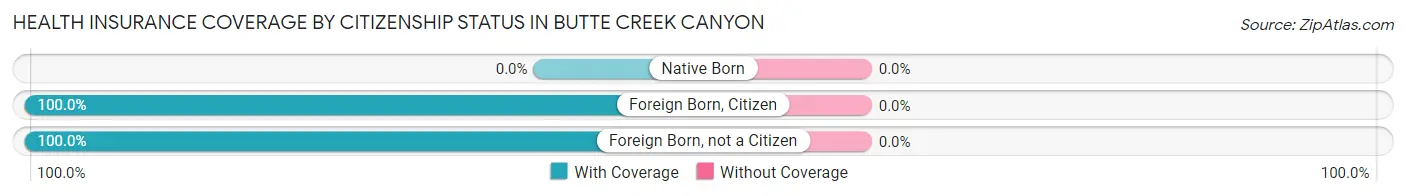
| Citizenship Status | With Coverage | Without Coverage |
| Native Born | 0 (0.0%) | 0 (0.0%) |
| Foreign Born, Citizen | 113 (100.0%) | 0 (0.0%) |
| Foreign Born, not a Citizen | 30 (100.0%) | 0 (0.0%) |
Health Insurance Coverage by Household Income in Butte Creek Canyon
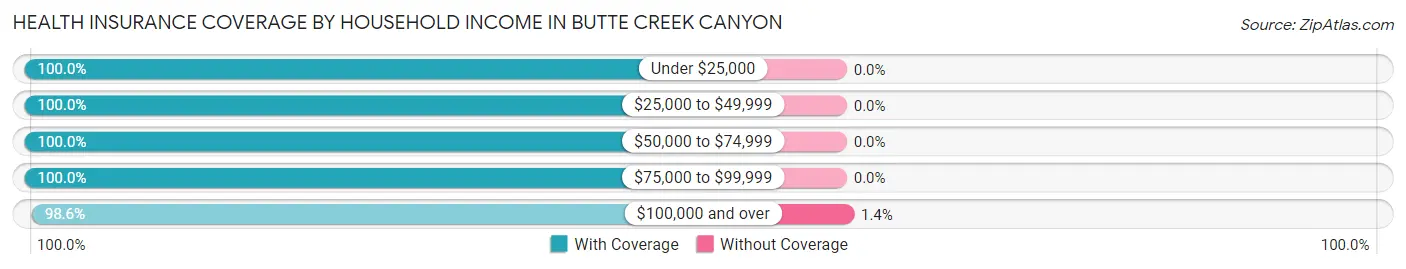
| Household Income | With Coverage | Without Coverage |
| Under $25,000 | 107 (100.0%) | 0 (0.0%) |
| $25,000 to $49,999 | 34 (100.0%) | 0 (0.0%) |
| $50,000 to $74,999 | 183 (100.0%) | 0 (0.0%) |
| $75,000 to $99,999 | 72 (100.0%) | 0 (0.0%) |
| $100,000 and over | 290 (98.6%) | 4 (1.4%) |
Public vs Private Health Insurance Coverage by Age in Butte Creek Canyon
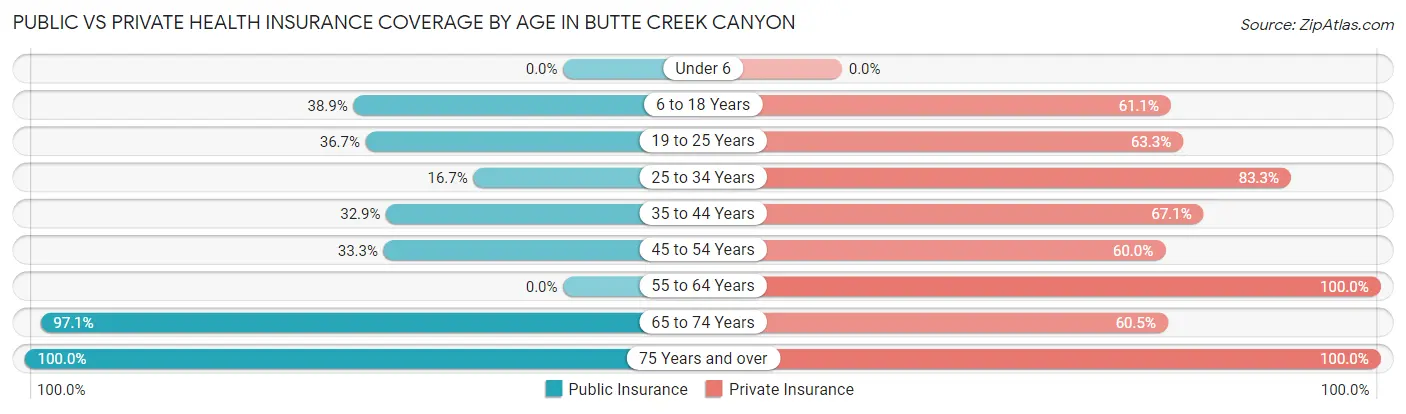
| Age Bracket | Public Insurance | Private Insurance |
| Under 6 | 0 (0.0%) | 0 (0.0%) |
| 6 to 18 Years | 44 (38.9%) | 69 (61.1%) |
| 19 to 25 Years | 11 (36.7%) | 19 (63.3%) |
| 25 to 34 Years | 6 (16.7%) | 30 (83.3%) |
| 35 to 44 Years | 23 (32.9%) | 47 (67.1%) |
| 45 to 54 Years | 20 (33.3%) | 36 (60.0%) |
| 55 to 64 Years | 0 (0.0%) | 123 (100.0%) |
| 65 to 74 Years | 199 (97.1%) | 124 (60.5%) |
| 75 Years and over | 53 (100.0%) | 53 (100.0%) |
| Total | 356 (51.6%) | 501 (72.6%) |
Disability Status by Sex by Age in Butte Creek Canyon
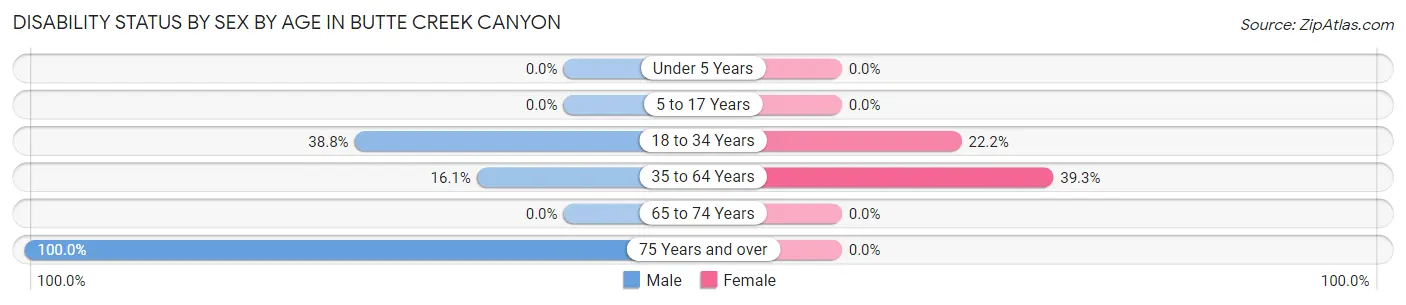
| Age Bracket | Male | Female |
| Under 5 Years | 0 (0.0%) | 0 (0.0%) |
| 5 to 17 Years | 0 (0.0%) | 0 (0.0%) |
| 18 to 34 Years | 19 (38.8%) | 6 (22.2%) |
| 35 to 64 Years | 19 (16.1%) | 53 (39.3%) |
| 65 to 74 Years | 0 (0.0%) | 0 (0.0%) |
| 75 Years and over | 36 (100.0%) | 0 (0.0%) |
Disability Class by Sex by Age in Butte Creek Canyon
Disability Class: Hearing Difficulty
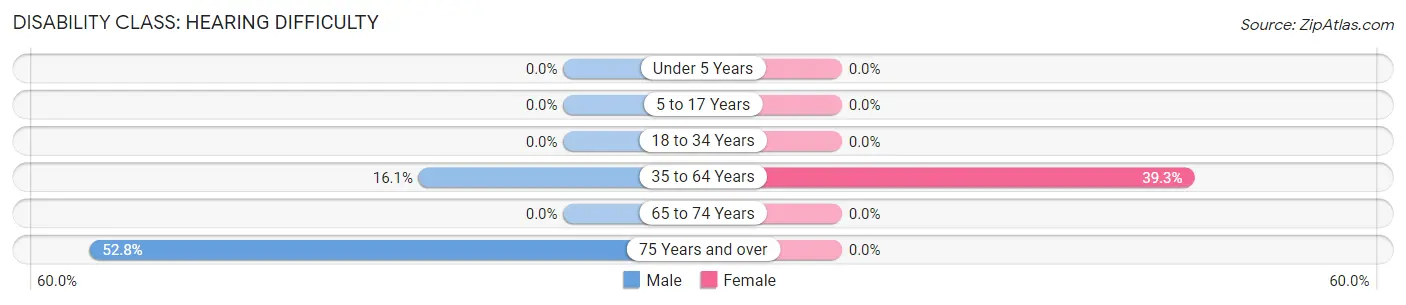
| Age Bracket | Male | Female |
| Under 5 Years | 0 (0.0%) | 0 (0.0%) |
| 5 to 17 Years | 0 (0.0%) | 0 (0.0%) |
| 18 to 34 Years | 0 (0.0%) | 0 (0.0%) |
| 35 to 64 Years | 19 (16.1%) | 53 (39.3%) |
| 65 to 74 Years | 0 (0.0%) | 0 (0.0%) |
| 75 Years and over | 19 (52.8%) | 0 (0.0%) |
Disability Class: Vision Difficulty
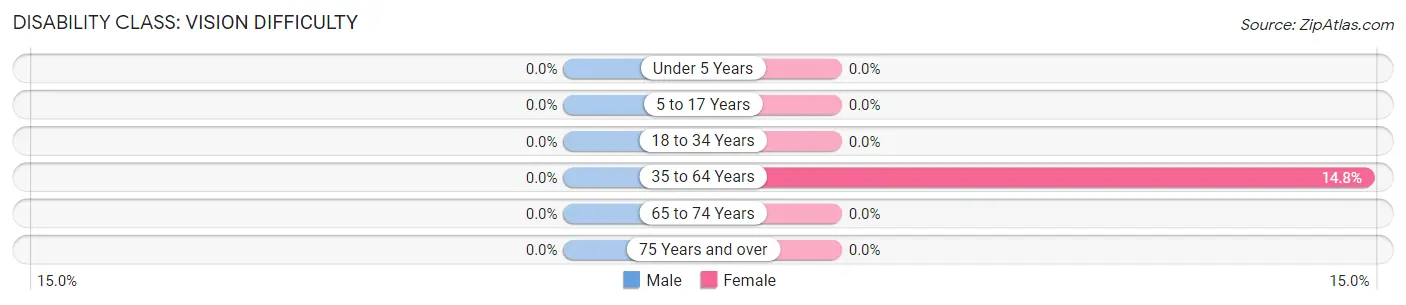
| Age Bracket | Male | Female |
| Under 5 Years | 0 (0.0%) | 0 (0.0%) |
| 5 to 17 Years | 0 (0.0%) | 0 (0.0%) |
| 18 to 34 Years | 0 (0.0%) | 0 (0.0%) |
| 35 to 64 Years | 0 (0.0%) | 20 (14.8%) |
| 65 to 74 Years | 0 (0.0%) | 0 (0.0%) |
| 75 Years and over | 0 (0.0%) | 0 (0.0%) |
Disability Class: Cognitive Difficulty
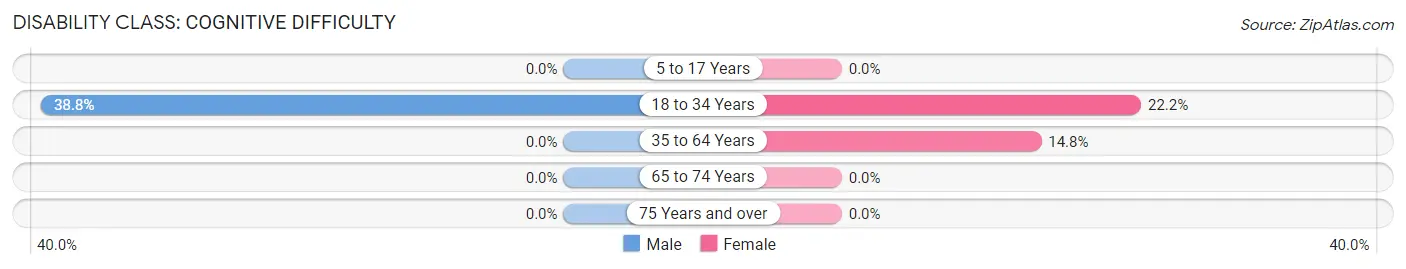
| Age Bracket | Male | Female |
| 5 to 17 Years | 0 (0.0%) | 0 (0.0%) |
| 18 to 34 Years | 19 (38.8%) | 6 (22.2%) |
| 35 to 64 Years | 0 (0.0%) | 20 (14.8%) |
| 65 to 74 Years | 0 (0.0%) | 0 (0.0%) |
| 75 Years and over | 0 (0.0%) | 0 (0.0%) |
Disability Class: Ambulatory Difficulty
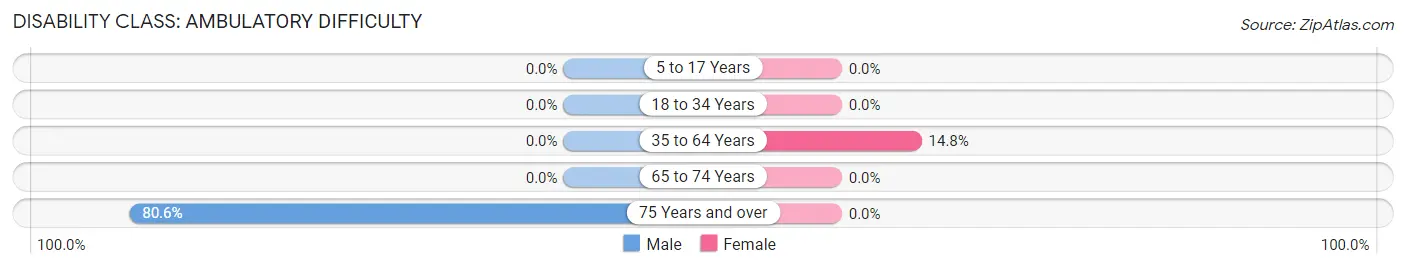
| Age Bracket | Male | Female |
| 5 to 17 Years | 0 (0.0%) | 0 (0.0%) |
| 18 to 34 Years | 0 (0.0%) | 0 (0.0%) |
| 35 to 64 Years | 0 (0.0%) | 20 (14.8%) |
| 65 to 74 Years | 0 (0.0%) | 0 (0.0%) |
| 75 Years and over | 29 (80.6%) | 0 (0.0%) |
Disability Class: Self-Care Difficulty
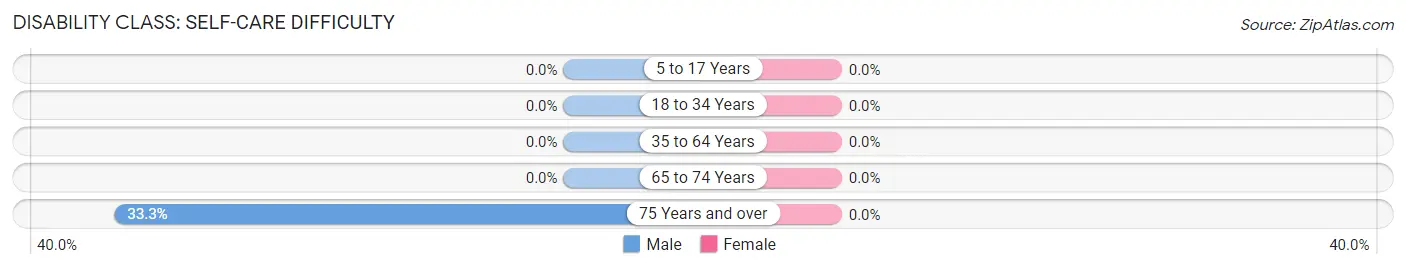
| Age Bracket | Male | Female |
| 5 to 17 Years | 0 (0.0%) | 0 (0.0%) |
| 18 to 34 Years | 0 (0.0%) | 0 (0.0%) |
| 35 to 64 Years | 0 (0.0%) | 0 (0.0%) |
| 65 to 74 Years | 0 (0.0%) | 0 (0.0%) |
| 75 Years and over | 12 (33.3%) | 0 (0.0%) |
Technology Access in Butte Creek Canyon
Computing Device Access in Butte Creek Canyon
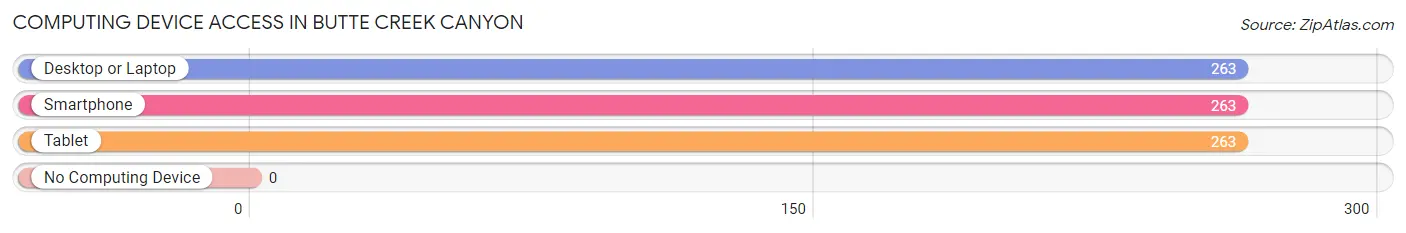
| Device Type | # Households | % Households |
| Desktop or Laptop | 263 | 100.0% |
| Smartphone | 263 | 100.0% |
| Tablet | 263 | 100.0% |
| No Computing Device | 0 | 0.0% |
| Total | 263 | 100.0% |
Internet Access in Butte Creek Canyon
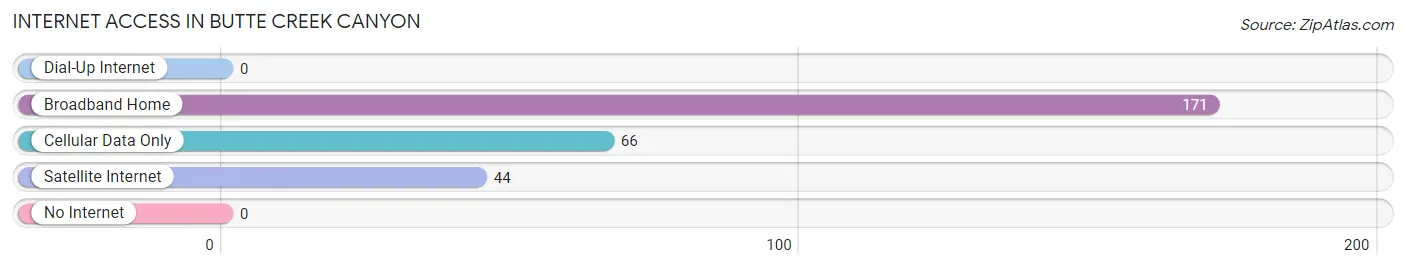
| Internet Type | # Households | % Households |
| Dial-Up Internet | 0 | 0.0% |
| Broadband Home | 171 | 65.0% |
| Cellular Data Only | 66 | 25.1% |
| Satellite Internet | 44 | 16.7% |
| No Internet | 0 | 0.0% |
| Total | 263 | 100.0% |
Butte Creek Canyon Summary
Butte Creek Canyon is a rural area located in the foothills of the Sierra Nevada Mountains in Northern California. It is situated in Butte County, approximately 10 miles east of Chico, the county seat. The canyon is home to a variety of wildlife, including black bears, mountain lions, deer, and numerous species of birds. The area is also known for its abundance of wildflowers, including the California poppy, lupine, and Indian paintbrush.
Geography
Butte Creek Canyon is located in the foothills of the Sierra Nevada Mountains, approximately 10 miles east of Chico, the county seat. The canyon is approximately 8 miles long and 1 mile wide, and is bordered by the Butte Creek and Feather River. The canyon is characterized by steep, rugged terrain, with elevations ranging from 500 to 2,000 feet. The area is heavily forested, with a variety of trees, including oak, pine, and madrone.
Economy
The economy of Butte Creek Canyon is largely based on agriculture and tourism. The area is home to several small farms, which produce a variety of crops, including almonds, walnuts, and olives. The canyon is also a popular destination for outdoor recreation, including camping, fishing, and hiking. The area is also home to several wineries, which produce a variety of wines.
Demographics
As of the 2010 census, the population of Butte Creek Canyon was 1,845. The population is largely white (90.2%), with small percentages of Hispanic (4.2%), Asian (2.2%), and African American (1.2%) residents. The median household income is $50,000, and the median age is 44.
History
Butte Creek Canyon has a long and varied history. The area was originally inhabited by the Maidu and Mechoopda Native American tribes, who lived in the area for thousands of years. In the mid-1800s, the area was settled by European-American settlers, who established farms and ranches in the canyon. In the early 1900s, the area became a popular destination for outdoor recreation, and several resorts were established in the area. In the late 1900s, the area became a popular destination for wine production, and several wineries were established in the canyon.
Common Questions
What is Per Capita Income in Butte Creek Canyon?
Per Capita income in Butte Creek Canyon is $45,420.
What is the Median Family Income in Butte Creek Canyon?
Median Family Income in Butte Creek Canyon is $68,553.
What is the Median Household income in Butte Creek Canyon?
Median Household Income in Butte Creek Canyon is $77,813.
What is Inequality or Gini Index in Butte Creek Canyon?
Inequality or Gini Index in Butte Creek Canyon is 0.53.
What is the Total Population of Butte Creek Canyon?
Total Population of Butte Creek Canyon is 690.
What is the Total Male Population of Butte Creek Canyon?
Total Male Population of Butte Creek Canyon is 378.
What is the Total Female Population of Butte Creek Canyon?
Total Female Population of Butte Creek Canyon is 312.
What is the Ratio of Males per 100 Females in Butte Creek Canyon?
There are 121.15 Males per 100 Females in Butte Creek Canyon.
What is the Ratio of Females per 100 Males in Butte Creek Canyon?
There are 82.54 Females per 100 Males in Butte Creek Canyon.
What is the Median Population Age in Butte Creek Canyon?
Median Population Age in Butte Creek Canyon is 61.2 Years.
What is the Average Family Size in Butte Creek Canyon
Average Family Size in Butte Creek Canyon is 2.6 People.
What is the Average Household Size in Butte Creek Canyon
Average Household Size in Butte Creek Canyon is 2.6 People.
How Large is the Labor Force in Butte Creek Canyon?
There are 275 People in the Labor Forcein in Butte Creek Canyon.
What is the Percentage of People in the Labor Force in Butte Creek Canyon?
46.8% of People are in the Labor Force in Butte Creek Canyon.