Zip Codes with the Highest Percentage of Population Employed in Architecture & Engineering in Danville, CA
RELATED REPORTS & OPTIONS
Architecture & Engineering
Danville
Compare Zip Codes
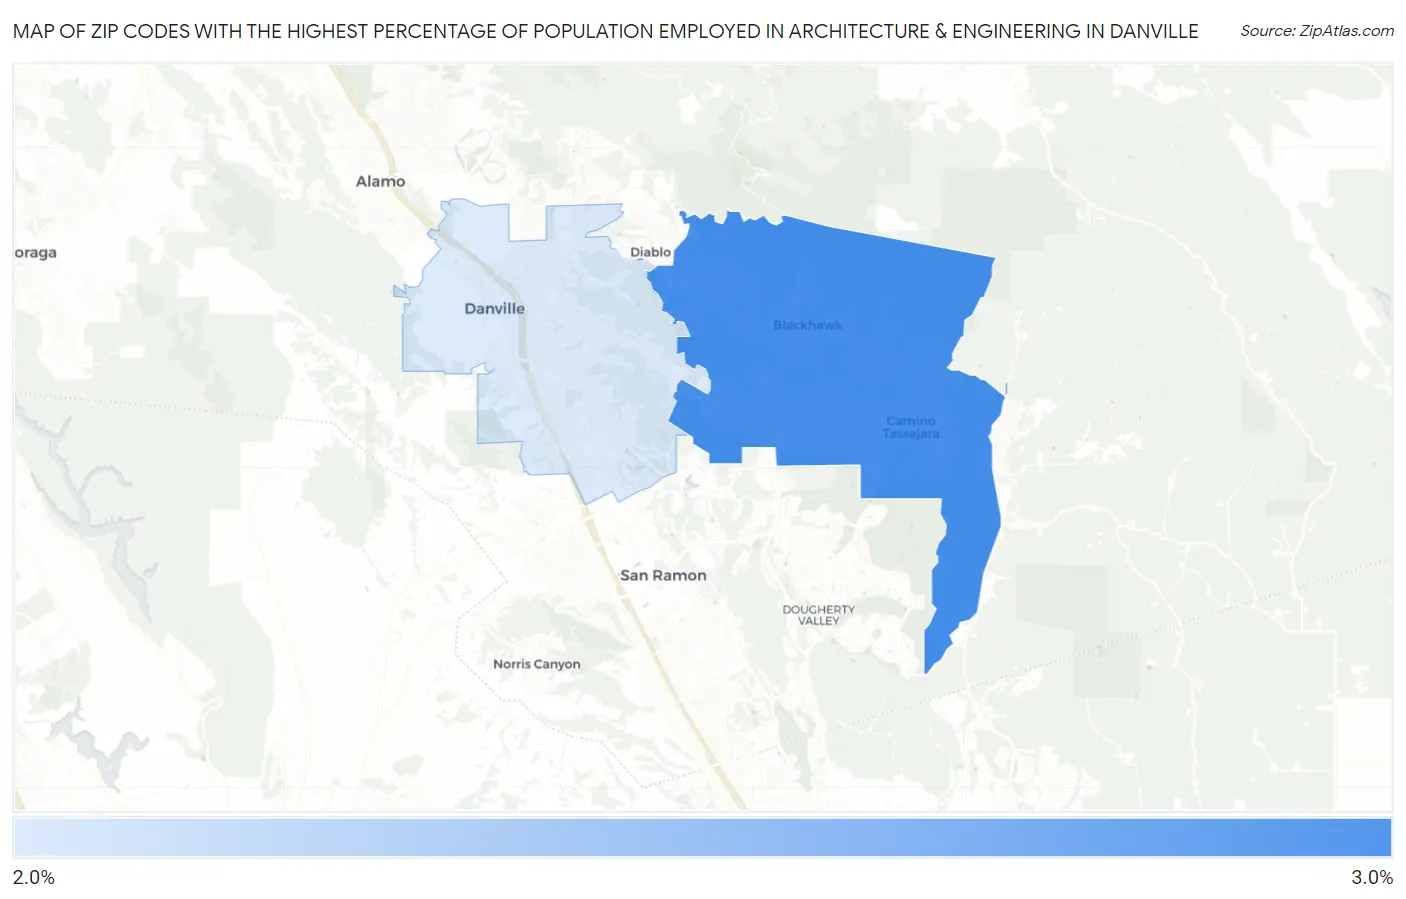
Map of Zip Codes with the Highest Percentage of Population Employed in Architecture & Engineering in Danville
2.1%
2.5%
Zip Codes with the Highest Percentage of Population Employed in Architecture & Engineering in Danville, CA
| Zip Code | % Employed | vs State | vs National | |
| 1. | 94506 | 2.5% | 2.6%(-0.009)#517 | 2.1%(+0.396)#6,813 |
| 2. | 94526 | 2.1% | 2.6%(-0.478)#663 | 2.1%(-0.074)#9,174 |
1
Common Questions
What are the Top Zip Codes with the Highest Percentage of Population Employed in Architecture & Engineering in Danville, CA?
Top Zip Codes with the Highest Percentage of Population Employed in Architecture & Engineering in Danville, CA are:
What zip code has the Highest Percentage of Population Employed in Architecture & Engineering in Danville, CA?
94506 has the Highest Percentage of Population Employed in Architecture & Engineering in Danville, CA with 2.5%.
What is the Percentage of Population Employed in Architecture & Engineering in Danville, CA?
Percentage of Population Employed in Architecture & Engineering in Danville is 2.1%.
What is the Percentage of Population Employed in Architecture & Engineering in California?
Percentage of Population Employed in Architecture & Engineering in California is 2.6%.
What is the Percentage of Population Employed in Architecture & Engineering in the United States?
Percentage of Population Employed in Architecture & Engineering in the United States is 2.1%.