Cities with the Highest Percentage of Population Employed in Architecture & Engineering in New York
RELATED REPORTS & OPTIONS
Architecture & Engineering
New York
Compare Cities
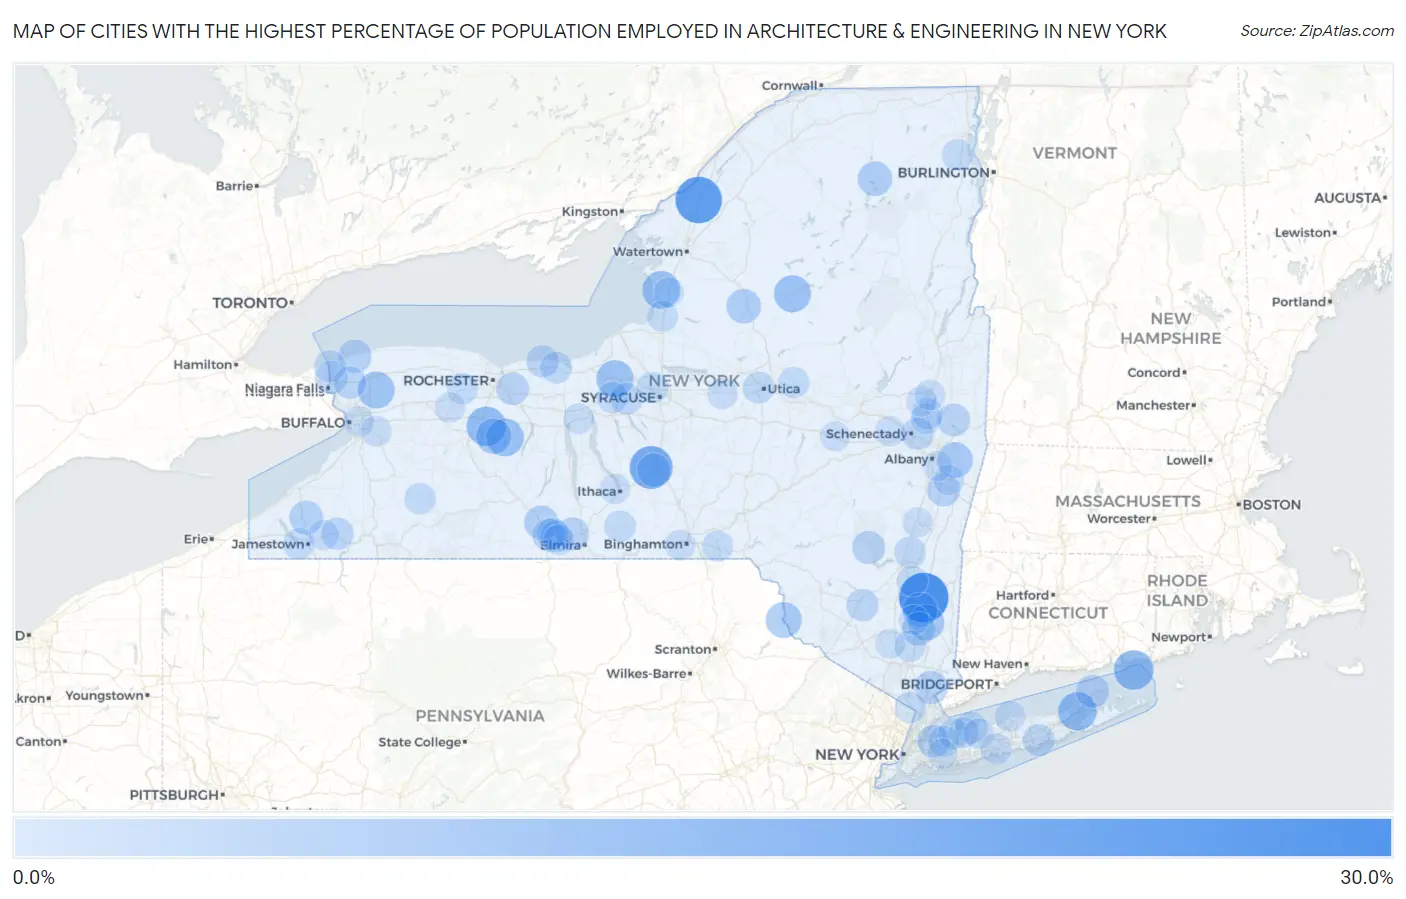
Map of Cities with the Highest Percentage of Population Employed in Architecture & Engineering in New York
0.0%
30.0%
Cities with the Highest Percentage of Population Employed in Architecture & Engineering in New York
| City | % Employed | vs State | vs National | |
| 1. | Pleasant Valley | 27.3% | 1.6%(+25.7)#1 | 2.1%(+25.2)#70 |
| 2. | Redwood | 23.6% | 1.6%(+22.0)#2 | 2.1%(+21.5)#97 |
| 3. | Cortland West | 19.3% | 1.6%(+17.7)#3 | 2.1%(+17.1)#142 |
| 4. | Otter Lake | 15.6% | 1.6%(+13.9)#4 | 2.1%(+13.4)#214 |
| 5. | Fishers Island | 15.4% | 1.6%(+13.8)#5 | 2.1%(+13.2)#220 |
| 6. | South Lima | 14.9% | 1.6%(+13.3)#6 | 2.1%(+12.7)#234 |
| 7. | Clifton Gardens | 14.4% | 1.6%(+12.7)#7 | 2.1%(+12.2)#247 |
| 8. | New Suffolk | 14.2% | 1.6%(+12.6)#8 | 2.1%(+12.0)#258 |
| 9. | Ellisburg | 13.3% | 1.6%(+11.7)#9 | 2.1%(+11.2)#293 |
| 10. | Nassau Lake | 13.3% | 1.6%(+11.7)#10 | 2.1%(+11.2)#296 |
| 11. | Honeoye | 13.1% | 1.6%(+11.4)#11 | 2.1%(+10.9)#301 |
| 12. | Meridian | 12.5% | 1.6%(+10.9)#12 | 2.1%(+10.4)#330 |
| 13. | Old Forge | 12.3% | 1.6%(+10.7)#13 | 2.1%(+10.2)#341 |
| 14. | Rapids | 12.0% | 1.6%(+10.4)#14 | 2.1%(+9.84)#354 |
| 15. | Rochester Institute Of Technology | 11.3% | 1.6%(+9.66)#15 | 2.1%(+9.12)#401 |
| 16. | Narrowsburg | 11.0% | 1.6%(+9.38)#16 | 2.1%(+8.84)#424 |
| 17. | Hopewell Junction | 10.9% | 1.6%(+9.34)#17 | 2.1%(+8.80)#427 |
| 18. | Averill Park | 10.7% | 1.6%(+9.11)#18 | 2.1%(+8.57)#438 |
| 19. | Hemlock | 10.4% | 1.6%(+8.76)#19 | 2.1%(+8.22)#467 |
| 20. | Grahamsville | 10.3% | 1.6%(+8.66)#20 | 2.1%(+8.12)#474 |
| 21. | Titusville | 10.0% | 1.6%(+8.42)#21 | 2.1%(+7.89)#489 |
| 22. | Turin | 9.5% | 1.6%(+7.91)#22 | 2.1%(+7.37)#536 |
| 23. | Paul Smiths | 9.4% | 1.6%(+7.82)#23 | 2.1%(+7.28)#543 |
| 24. | Campbell | 9.0% | 1.6%(+7.42)#24 | 2.1%(+6.88)#571 |
| 25. | Sinclairville | 8.5% | 1.6%(+6.87)#25 | 2.1%(+6.33)#642 |
| 26. | Conesus | 8.5% | 1.6%(+6.86)#26 | 2.1%(+6.33)#643 |
| 27. | Merritt Park | 8.4% | 1.6%(+6.78)#27 | 2.1%(+6.24)#654 |
| 28. | Munsons Corners | 8.2% | 1.6%(+6.63)#28 | 2.1%(+6.10)#674 |
| 29. | Chappaqua | 8.1% | 1.6%(+6.44)#29 | 2.1%(+5.90)#715 |
| 30. | Wilson | 8.0% | 1.6%(+6.35)#30 | 2.1%(+5.81)#730 |
| 31. | East Marion | 7.8% | 1.6%(+6.21)#31 | 2.1%(+5.67)#751 |
| 32. | Big Flats | 7.8% | 1.6%(+6.17)#32 | 2.1%(+5.63)#757 |
| 33. | Phoenicia | 7.7% | 1.6%(+6.14)#33 | 2.1%(+5.60)#762 |
| 34. | Niverville | 7.7% | 1.6%(+6.09)#34 | 2.1%(+5.55)#766 |
| 35. | Round Top | 7.6% | 1.6%(+6.00)#35 | 2.1%(+5.46)#790 |
| 36. | Saddle Rock Estates | 7.5% | 1.6%(+5.86)#36 | 2.1%(+5.32)#814 |
| 37. | Valley Falls | 7.4% | 1.6%(+5.75)#37 | 2.1%(+5.22)#834 |
| 38. | Fairport | 7.3% | 1.6%(+5.70)#38 | 2.1%(+5.16)#847 |
| 39. | Lewiston | 7.3% | 1.6%(+5.68)#39 | 2.1%(+5.14)#851 |
| 40. | Randolph | 7.2% | 1.6%(+5.59)#40 | 2.1%(+5.05)#880 |
| 41. | Gang Mills | 7.2% | 1.6%(+5.57)#41 | 2.1%(+5.03)#885 |
| 42. | Ellenville | 7.0% | 1.6%(+5.38)#42 | 2.1%(+4.85)#929 |
| 43. | Sanborn | 6.9% | 1.6%(+5.33)#43 | 2.1%(+4.79)#946 |
| 44. | Pultneyville | 6.9% | 1.6%(+5.27)#44 | 2.1%(+4.73)#966 |
| 45. | South Lansing | 6.7% | 1.6%(+5.07)#45 | 2.1%(+4.53)#998 |
| 46. | Moriches | 6.6% | 1.6%(+4.94)#46 | 2.1%(+4.40)#1,035 |
| 47. | Niskayuna | 6.6% | 1.6%(+4.94)#47 | 2.1%(+4.40)#1,036 |
| 48. | Yorkville | 6.5% | 1.6%(+4.88)#48 | 2.1%(+4.34)#1,050 |
| 49. | Sodus | 6.4% | 1.6%(+4.83)#49 | 2.1%(+4.30)#1,068 |
| 50. | Youngstown | 6.4% | 1.6%(+4.76)#50 | 2.1%(+4.22)#1,095 |
| 51. | Glasco | 6.3% | 1.6%(+4.70)#51 | 2.1%(+4.16)#1,111 |
| 52. | York | 6.3% | 1.6%(+4.68)#52 | 2.1%(+4.14)#1,122 |
| 53. | Corning | 6.2% | 1.6%(+4.62)#53 | 2.1%(+4.08)#1,147 |
| 54. | Painted Post | 6.2% | 1.6%(+4.62)#54 | 2.1%(+4.08)#1,149 |
| 55. | Halesite | 6.2% | 1.6%(+4.58)#55 | 2.1%(+4.04)#1,165 |
| 56. | Elbridge | 6.2% | 1.6%(+4.55)#56 | 2.1%(+4.01)#1,176 |
| 57. | Peru | 6.1% | 1.6%(+4.53)#57 | 2.1%(+3.99)#1,181 |
| 58. | Spencer | 6.1% | 1.6%(+4.52)#58 | 2.1%(+3.98)#1,183 |
| 59. | Weedsport | 6.0% | 1.6%(+4.38)#59 | 2.1%(+3.84)#1,246 |
| 60. | Liverpool | 6.0% | 1.6%(+4.37)#60 | 2.1%(+3.83)#1,250 |
| 61. | Tappan | 5.9% | 1.6%(+4.31)#61 | 2.1%(+3.77)#1,281 |
| 62. | Middleville | 5.9% | 1.6%(+4.25)#62 | 2.1%(+3.71)#1,311 |
| 63. | Lakewood | 5.8% | 1.6%(+4.20)#63 | 2.1%(+3.67)#1,336 |
| 64. | Rushford | 5.8% | 1.6%(+4.20)#64 | 2.1%(+3.66)#1,337 |
| 65. | Highland-On-The-Lake | 5.8% | 1.6%(+4.19)#65 | 2.1%(+3.65)#1,342 |
| 66. | Nelsonville | 5.7% | 1.6%(+4.12)#66 | 2.1%(+3.58)#1,375 |
| 67. | Windsor | 5.7% | 1.6%(+4.05)#67 | 2.1%(+3.51)#1,411 |
| 68. | Pulaski | 5.6% | 1.6%(+4.03)#68 | 2.1%(+3.49)#1,419 |
| 69. | Upper Brookville | 5.6% | 1.6%(+3.99)#69 | 2.1%(+3.45)#1,448 |
| 70. | Churchville | 5.6% | 1.6%(+3.98)#70 | 2.1%(+3.44)#1,453 |
| 71. | Round Lake | 5.5% | 1.6%(+3.93)#71 | 2.1%(+3.39)#1,487 |
| 72. | Roslyn | 5.4% | 1.6%(+3.80)#72 | 2.1%(+3.26)#1,557 |
| 73. | Country Knolls | 5.4% | 1.6%(+3.75)#73 | 2.1%(+3.21)#1,581 |
| 74. | Islip Terrace | 5.3% | 1.6%(+3.74)#74 | 2.1%(+3.20)#1,597 |
| 75. | South Corning | 5.3% | 1.6%(+3.70)#75 | 2.1%(+3.16)#1,623 |
| 76. | Crest View Heights | 5.3% | 1.6%(+3.70)#76 | 2.1%(+3.16)#1,625 |
| 77. | Elma Center | 5.3% | 1.6%(+3.65)#77 | 2.1%(+3.11)#1,663 |
| 78. | Sherrill | 5.2% | 1.6%(+3.63)#78 | 2.1%(+3.10)#1,671 |
| 79. | Staatsburg | 5.1% | 1.6%(+3.52)#79 | 2.1%(+2.98)#1,747 |
| 80. | Waterloo | 5.1% | 1.6%(+3.50)#80 | 2.1%(+2.96)#1,755 |
| 81. | Nassau | 5.1% | 1.6%(+3.47)#81 | 2.1%(+2.93)#1,781 |
| 82. | Laurel Hollow | 5.1% | 1.6%(+3.44)#82 | 2.1%(+2.90)#1,795 |
| 83. | Binghamton University | 5.1% | 1.6%(+3.44)#83 | 2.1%(+2.90)#1,796 |
| 84. | Le Roy | 5.0% | 1.6%(+3.39)#84 | 2.1%(+2.85)#1,828 |
| 85. | Belle Terre | 5.0% | 1.6%(+3.36)#85 | 2.1%(+2.82)#1,859 |
| 86. | Macdonnell Heights | 4.9% | 1.6%(+3.25)#86 | 2.1%(+2.72)#1,924 |
| 87. | North Ballston Spa | 4.8% | 1.6%(+3.23)#87 | 2.1%(+2.69)#1,954 |
| 88. | Kennedy | 4.8% | 1.6%(+3.20)#88 | 2.1%(+2.66)#1,975 |
| 89. | Mariaville Lake | 4.8% | 1.6%(+3.17)#89 | 2.1%(+2.63)#1,991 |
| 90. | Elwood | 4.7% | 1.6%(+3.12)#90 | 2.1%(+2.58)#2,031 |
| 91. | Saratoga Springs | 4.7% | 1.6%(+3.11)#91 | 2.1%(+2.57)#2,041 |
| 92. | Sloan | 4.7% | 1.6%(+3.09)#92 | 2.1%(+2.55)#2,053 |
| 93. | Northwest Ithaca | 4.7% | 1.6%(+3.05)#93 | 2.1%(+2.51)#2,088 |
| 94. | Sharon Springs | 4.7% | 1.6%(+3.04)#94 | 2.1%(+2.50)#2,095 |
| 95. | Jefferson Heights | 4.6% | 1.6%(+3.02)#95 | 2.1%(+2.48)#2,113 |
| 96. | Beaver Dam Lake | 4.5% | 1.6%(+2.94)#96 | 2.1%(+2.40)#2,183 |
| 97. | Mannsville | 4.5% | 1.6%(+2.88)#97 | 2.1%(+2.34)#2,241 |
| 98. | Garden City South | 4.5% | 1.6%(+2.87)#98 | 2.1%(+2.33)#2,245 |
| 99. | Wappingers Falls | 4.5% | 1.6%(+2.86)#99 | 2.1%(+2.32)#2,250 |
| 100. | East Greenbush | 4.4% | 1.6%(+2.83)#100 | 2.1%(+2.29)#2,280 |
Common Questions
What are the Top 10 Cities with the Highest Percentage of Population Employed in Architecture & Engineering in New York?
Top 10 Cities with the Highest Percentage of Population Employed in Architecture & Engineering in New York are:
#1
27.3%
#2
23.6%
#3
19.3%
#4
15.4%
#5
14.9%
#6
14.2%
#7
13.3%
#8
13.1%
#9
12.5%
#10
12.3%
What city has the Highest Percentage of Population Employed in Architecture & Engineering in New York?
Pleasant Valley has the Highest Percentage of Population Employed in Architecture & Engineering in New York with 27.3%.
What is the Percentage of Population Employed in Architecture & Engineering in the State of New York?
Percentage of Population Employed in Architecture & Engineering in New York is 1.6%.
What is the Percentage of Population Employed in Architecture & Engineering in the United States?
Percentage of Population Employed in Architecture & Engineering in the United States is 2.1%.