Cities with the Highest Percentage of Population Employed in Architecture & Engineering in Minnesota
RELATED REPORTS & OPTIONS
Architecture & Engineering
Minnesota
Compare Cities
Map of Cities with the Highest Percentage of Population Employed in Architecture & Engineering in Minnesota
0.0%
25.0%
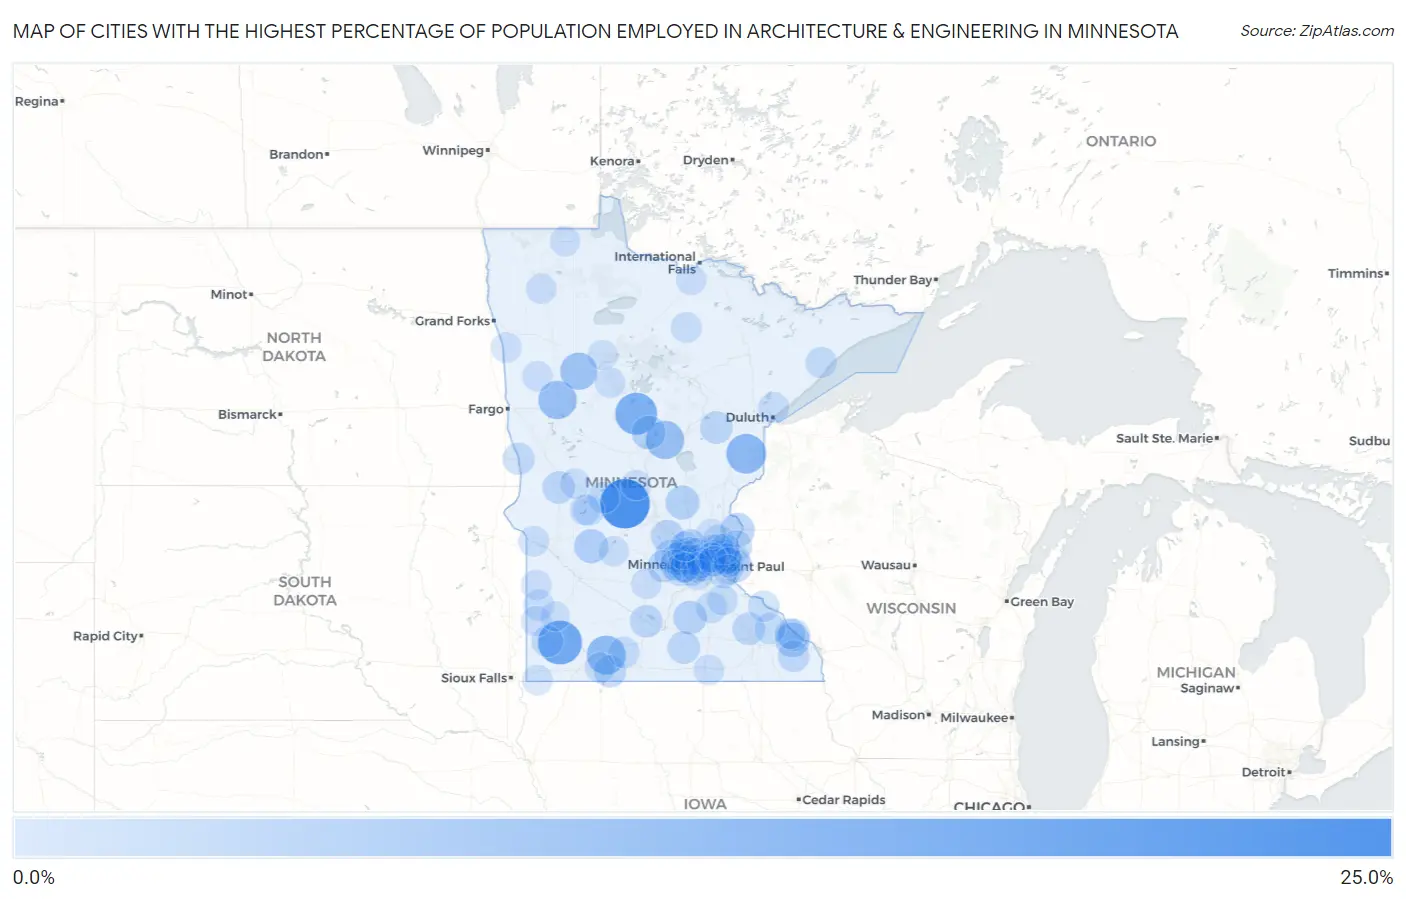
Cities with the Highest Percentage of Population Employed in Architecture & Engineering in Minnesota
| City | % Employed | vs State | vs National | |
| 1. | St Rosa | 22.2% | 2.4%(+19.9)#1 | 2.1%(+20.1)#108 |
| 2. | Hadley | 16.7% | 2.4%(+14.3)#2 | 2.1%(+14.5)#188 |
| 3. | Backus | 14.6% | 2.4%(+12.2)#3 | 2.1%(+12.5)#241 |
| 4. | Kerrick | 12.5% | 2.4%(+10.1)#4 | 2.1%(+10.4)#334 |
| 5. | Fish Lake | 11.8% | 2.4%(+9.40)#5 | 2.1%(+9.62)#372 |
| 6. | Callaway | 11.1% | 2.4%(+8.74)#6 | 2.1%(+8.96)#410 |
| 7. | Trommald | 11.1% | 2.4%(+8.74)#7 | 2.1%(+8.96)#411 |
| 8. | Roy Lake | 10.0% | 2.4%(+7.63)#8 | 2.1%(+7.85)#500 |
| 9. | Credit River | 8.8% | 2.4%(+6.46)#9 | 2.1%(+6.68)#603 |
| 10. | Pickwick | 8.2% | 2.4%(+5.83)#10 | 2.1%(+6.05)#687 |
| 11. | Birchwood Village | 8.1% | 2.4%(+5.73)#11 | 2.1%(+5.95)#704 |
| 12. | Stockton | 7.5% | 2.4%(+5.10)#12 | 2.1%(+5.32)#815 |
| 13. | Rogers | 7.2% | 2.4%(+4.84)#13 | 2.1%(+5.06)#876 |
| 14. | Shafer | 7.2% | 2.4%(+4.82)#14 | 2.1%(+5.04)#884 |
| 15. | Greenwood | 7.1% | 2.4%(+4.72)#15 | 2.1%(+4.94)#909 |
| 16. | Kerkhoven | 7.1% | 2.4%(+4.71)#16 | 2.1%(+4.93)#911 |
| 17. | Foreston | 7.0% | 2.4%(+4.62)#17 | 2.1%(+4.84)#932 |
| 18. | Pequot Lakes | 6.8% | 2.4%(+4.44)#18 | 2.1%(+4.66)#981 |
| 19. | Kilkenny | 6.5% | 2.4%(+4.08)#19 | 2.1%(+4.30)#1,062 |
| 20. | Corcoran | 6.4% | 2.4%(+4.05)#20 | 2.1%(+4.27)#1,079 |
| 21. | Montrose | 6.2% | 2.4%(+3.85)#21 | 2.1%(+4.07)#1,153 |
| 22. | Silver Creek | 6.1% | 2.4%(+3.69)#22 | 2.1%(+3.91)#1,208 |
| 23. | Loretto | 5.9% | 2.4%(+3.48)#23 | 2.1%(+3.70)#1,315 |
| 24. | Medicine Lake | 5.8% | 2.4%(+3.44)#24 | 2.1%(+3.65)#1,339 |
| 25. | Lexington | 5.8% | 2.4%(+3.42)#25 | 2.1%(+3.64)#1,345 |
| 26. | Oronoco | 5.8% | 2.4%(+3.39)#26 | 2.1%(+3.61)#1,358 |
| 27. | Waldorf | 5.7% | 2.4%(+3.35)#27 | 2.1%(+3.57)#1,382 |
| 28. | Tamarack | 5.7% | 2.4%(+3.35)#28 | 2.1%(+3.57)#1,386 |
| 29. | Delano | 5.6% | 2.4%(+3.24)#29 | 2.1%(+3.46)#1,437 |
| 30. | Jackson | 5.6% | 2.4%(+3.23)#30 | 2.1%(+3.45)#1,444 |
| 31. | Courtland | 5.6% | 2.4%(+3.22)#31 | 2.1%(+3.44)#1,451 |
| 32. | Barrett | 5.6% | 2.4%(+3.19)#32 | 2.1%(+3.41)#1,471 |
| 33. | St Anthony City Stearns County | 5.6% | 2.4%(+3.19)#33 | 2.1%(+3.41)#1,479 |
| 34. | Winsted | 5.5% | 2.4%(+3.15)#34 | 2.1%(+3.37)#1,498 |
| 35. | Minnesota City | 5.4% | 2.4%(+3.07)#35 | 2.1%(+3.29)#1,540 |
| 36. | Shoreview | 5.4% | 2.4%(+2.99)#36 | 2.1%(+3.21)#1,591 |
| 37. | Lakeland Shores | 5.3% | 2.4%(+2.97)#37 | 2.1%(+3.18)#1,604 |
| 38. | Breckenridge | 5.2% | 2.4%(+2.79)#38 | 2.1%(+3.01)#1,731 |
| 39. | Maple Plain | 5.1% | 2.4%(+2.70)#39 | 2.1%(+2.92)#1,783 |
| 40. | St Bonifacius | 5.0% | 2.4%(+2.67)#40 | 2.1%(+2.89)#1,810 |
| 41. | Oak Park Heights | 5.0% | 2.4%(+2.65)#41 | 2.1%(+2.87)#1,819 |
| 42. | Gem Lake | 5.0% | 2.4%(+2.65)#42 | 2.1%(+2.87)#1,820 |
| 43. | Marine On St Croix | 5.0% | 2.4%(+2.63)#43 | 2.1%(+2.85)#1,832 |
| 44. | Maple Grove | 4.9% | 2.4%(+2.55)#44 | 2.1%(+2.77)#1,890 |
| 45. | Rushford | 4.9% | 2.4%(+2.53)#45 | 2.1%(+2.75)#1,897 |
| 46. | Woodstock | 4.9% | 2.4%(+2.51)#46 | 2.1%(+2.73)#1,917 |
| 47. | West Union | 4.9% | 2.4%(+2.51)#47 | 2.1%(+2.73)#1,918 |
| 48. | Newport | 4.9% | 2.4%(+2.50)#48 | 2.1%(+2.72)#1,925 |
| 49. | Glenwood | 4.7% | 2.4%(+2.35)#49 | 2.1%(+2.57)#2,039 |
| 50. | Odin | 4.6% | 2.4%(+2.25)#50 | 2.1%(+2.47)#2,128 |
| 51. | Medina | 4.6% | 2.4%(+2.23)#51 | 2.1%(+2.45)#2,145 |
| 52. | Finland | 4.5% | 2.4%(+2.18)#52 | 2.1%(+2.40)#2,194 |
| 53. | Plainview | 4.4% | 2.4%(+2.08)#53 | 2.1%(+2.30)#2,266 |
| 54. | Dundas | 4.4% | 2.4%(+2.06)#54 | 2.1%(+2.28)#2,286 |
| 55. | Lake City | 4.4% | 2.4%(+2.04)#55 | 2.1%(+2.26)#2,304 |
| 56. | Plymouth | 4.3% | 2.4%(+1.90)#56 | 2.1%(+2.12)#2,431 |
| 57. | Ivanhoe | 4.2% | 2.4%(+1.84)#57 | 2.1%(+2.06)#2,515 |
| 58. | Columbus | 4.1% | 2.4%(+1.78)#58 | 2.1%(+2.00)#2,590 |
| 59. | Rice Lake | 4.1% | 2.4%(+1.77)#59 | 2.1%(+1.99)#2,605 |
| 60. | Randolph | 4.1% | 2.4%(+1.77)#60 | 2.1%(+1.99)#2,606 |
| 61. | Minnetrista | 4.1% | 2.4%(+1.72)#61 | 2.1%(+1.94)#2,654 |
| 62. | Effie | 4.1% | 2.4%(+1.71)#62 | 2.1%(+1.93)#2,669 |
| 63. | Watertown | 4.1% | 2.4%(+1.71)#63 | 2.1%(+1.93)#2,675 |
| 64. | Pine Springs | 4.1% | 2.4%(+1.69)#64 | 2.1%(+1.91)#2,699 |
| 65. | Rollingstone | 4.0% | 2.4%(+1.65)#65 | 2.1%(+1.86)#2,758 |
| 66. | Odessa | 4.0% | 2.4%(+1.63)#66 | 2.1%(+1.85)#2,775 |
| 67. | Lakefield | 4.0% | 2.4%(+1.62)#67 | 2.1%(+1.84)#2,786 |
| 68. | Greenfield | 4.0% | 2.4%(+1.60)#68 | 2.1%(+1.82)#2,813 |
| 69. | New Hope | 3.9% | 2.4%(+1.55)#69 | 2.1%(+1.77)#2,863 |
| 70. | Long Beach | 3.9% | 2.4%(+1.54)#70 | 2.1%(+1.76)#2,890 |
| 71. | St Louis Park | 3.9% | 2.4%(+1.54)#71 | 2.1%(+1.76)#2,891 |
| 72. | Lake Benton | 3.9% | 2.4%(+1.52)#72 | 2.1%(+1.74)#2,909 |
| 73. | Hayward | 3.9% | 2.4%(+1.52)#73 | 2.1%(+1.73)#2,922 |
| 74. | Twin Valley | 3.9% | 2.4%(+1.49)#74 | 2.1%(+1.71)#2,947 |
| 75. | Lake George | 3.8% | 2.4%(+1.48)#75 | 2.1%(+1.70)#2,961 |
| 76. | Holt | 3.8% | 2.4%(+1.48)#76 | 2.1%(+1.70)#2,963 |
| 77. | Lauderdale | 3.8% | 2.4%(+1.46)#77 | 2.1%(+1.68)#2,977 |
| 78. | Climax | 3.8% | 2.4%(+1.43)#78 | 2.1%(+1.65)#3,025 |
| 79. | Roseau | 3.8% | 2.4%(+1.42)#79 | 2.1%(+1.64)#3,040 |
| 80. | Canby | 3.8% | 2.4%(+1.41)#80 | 2.1%(+1.63)#3,050 |
| 81. | Steen | 3.8% | 2.4%(+1.41)#81 | 2.1%(+1.62)#3,060 |
| 82. | Golden Valley | 3.8% | 2.4%(+1.40)#82 | 2.1%(+1.62)#3,064 |
| 83. | Littlefork | 3.7% | 2.4%(+1.37)#83 | 2.1%(+1.59)#3,109 |
| 84. | Lino Lakes | 3.7% | 2.4%(+1.36)#84 | 2.1%(+1.58)#3,124 |
| 85. | Hugo | 3.7% | 2.4%(+1.33)#85 | 2.1%(+1.55)#3,169 |
| 86. | Eden Prairie | 3.7% | 2.4%(+1.32)#86 | 2.1%(+1.54)#3,189 |
| 87. | Flensburg | 3.7% | 2.4%(+1.30)#87 | 2.1%(+1.52)#3,227 |
| 88. | Brownton | 3.7% | 2.4%(+1.29)#88 | 2.1%(+1.51)#3,243 |
| 89. | Woodbury | 3.6% | 2.4%(+1.27)#89 | 2.1%(+1.49)#3,280 |
| 90. | Kandiyohi | 3.6% | 2.4%(+1.24)#90 | 2.1%(+1.46)#3,326 |
| 91. | Brandon | 3.6% | 2.4%(+1.24)#91 | 2.1%(+1.46)#3,334 |
| 92. | Minnetonka | 3.6% | 2.4%(+1.20)#92 | 2.1%(+1.42)#3,405 |
| 93. | East Bethel | 3.6% | 2.4%(+1.19)#93 | 2.1%(+1.41)#3,413 |
| 94. | New Brighton | 3.5% | 2.4%(+1.18)#94 | 2.1%(+1.40)#3,441 |
| 95. | Roseville | 3.5% | 2.4%(+1.17)#95 | 2.1%(+1.39)#3,456 |
| 96. | Mound | 3.5% | 2.4%(+1.13)#96 | 2.1%(+1.35)#3,535 |
| 97. | Lake Elmo | 3.5% | 2.4%(+1.12)#97 | 2.1%(+1.34)#3,552 |
| 98. | St Michael | 3.5% | 2.4%(+1.10)#98 | 2.1%(+1.32)#3,577 |
| 99. | Russell | 3.4% | 2.4%(+1.08)#99 | 2.1%(+1.30)#3,617 |
| 100. | Solway | 3.4% | 2.4%(+1.08)#100 | 2.1%(+1.30)#3,624 |
Common Questions
What are the Top 10 Cities with the Highest Percentage of Population Employed in Architecture & Engineering in Minnesota?
Top 10 Cities with the Highest Percentage of Population Employed in Architecture & Engineering in Minnesota are:
What city has the Highest Percentage of Population Employed in Architecture & Engineering in Minnesota?
St Rosa has the Highest Percentage of Population Employed in Architecture & Engineering in Minnesota with 22.2%.
What is the Percentage of Population Employed in Architecture & Engineering in the State of Minnesota?
Percentage of Population Employed in Architecture & Engineering in Minnesota is 2.4%.
What is the Percentage of Population Employed in Architecture & Engineering in the United States?
Percentage of Population Employed in Architecture & Engineering in the United States is 2.1%.