Atherton, CA Map & Demographics
Atherton Map
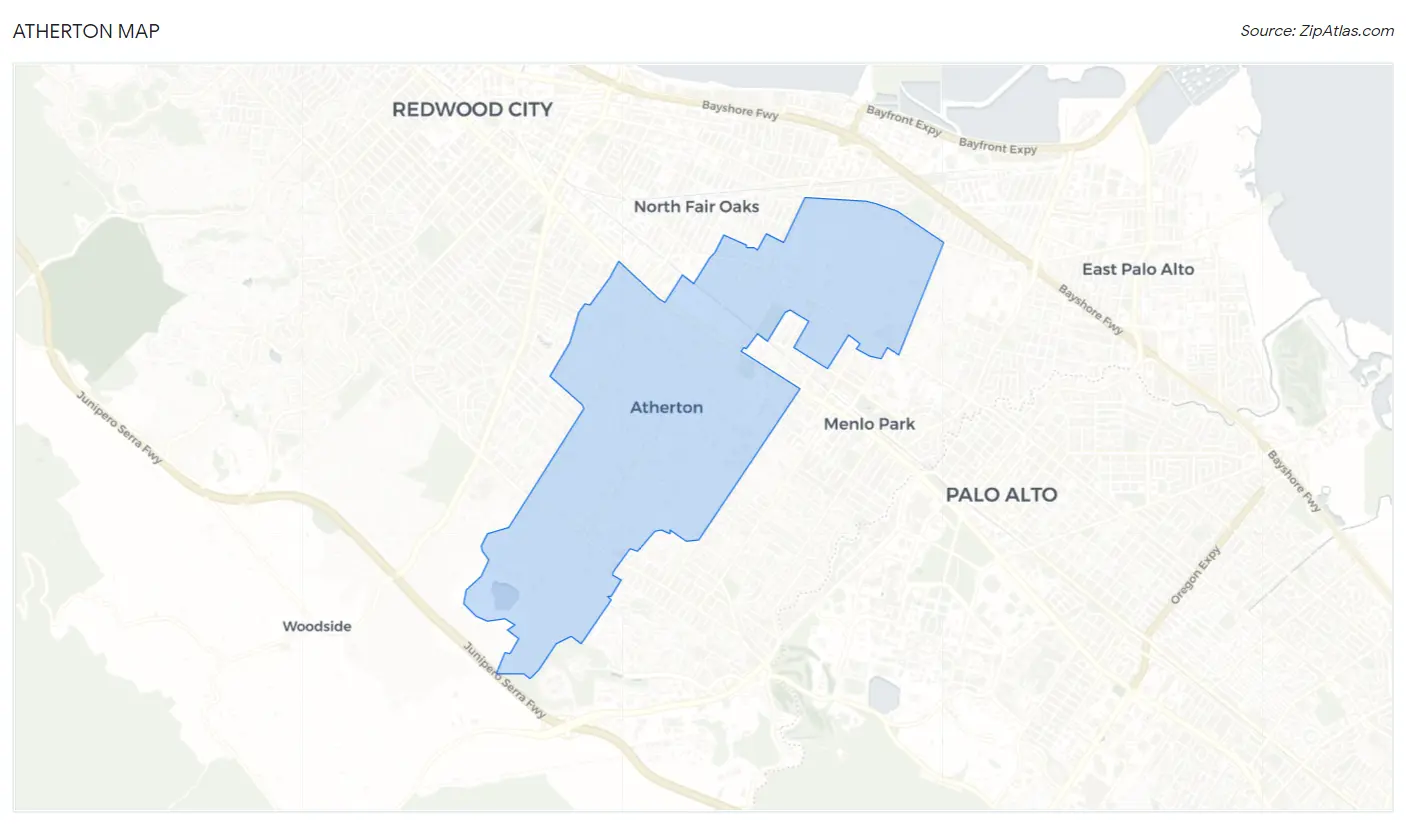
Atherton Overview
$186,810
PER CAPITA INCOME
$250,001
AVG FAMILY INCOME
$250,001
AVG HOUSEHOLD INCOME
40.4%
WAGE / INCOME GAP [ % ]
59.6¢/ $1
WAGE / INCOME GAP [ $ ]
0.51
INEQUALITY / GINI INDEX
7,124
TOTAL POPULATION
3,560
MALE POPULATION
3,564
FEMALE POPULATION
99.89
MALES / 100 FEMALES
100.11
FEMALES / 100 MALES
46.2
MEDIAN AGE
3.2
AVG FAMILY SIZE
3.0
AVG HOUSEHOLD SIZE
3,044
LABOR FORCE [ PEOPLE ]
50.8%
PERCENT IN LABOR FORCE
2.2%
UNEMPLOYMENT RATE
Atherton Zip Codes
Income in Atherton
Income Overview in Atherton
Per Capita Income in Atherton is $186,810, while median incomes of families and households are $250,001 and $250,001 respectively.
| Characteristic | Number | Measure |
| Per Capita Income | 7,124 | $186,810 |
| Median Family Income | 1,787 | $250,001 |
| Mean Family Income | 1,787 | $648,513 |
| Median Household Income | 2,183 | $250,001 |
| Mean Household Income | 2,183 | $594,651 |
| Income Deficit | 1,787 | $0 |
| Wage / Income Gap (%) | 7,124 | 40.45% |
| Wage / Income Gap ($) | 7,124 | 59.55¢ per $1 |
| Gini / Inequality Index | 7,124 | 0.51 |
Earnings by Sex in Atherton
Average Earnings in Atherton are $100,746, $114,931 for men and $68,442 for women, a difference of 40.5%.
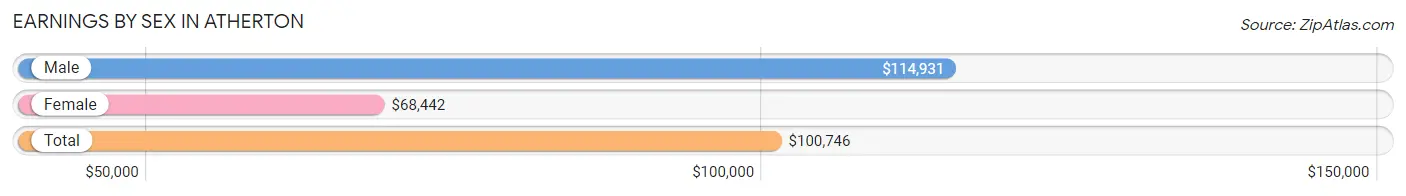
| Sex | Number | Average Earnings |
| Male | 1,875 (56.0%) | $114,931 |
| Female | 1,471 (44.0%) | $68,442 |
| Total | 3,346 (100.0%) | $100,746 |
Earnings by Sex by Income Bracket in Atherton
The most common earnings brackets in Atherton are $100,000+ for men (1,108 | 59.1%) and $100,000+ for women (585 | 39.8%).
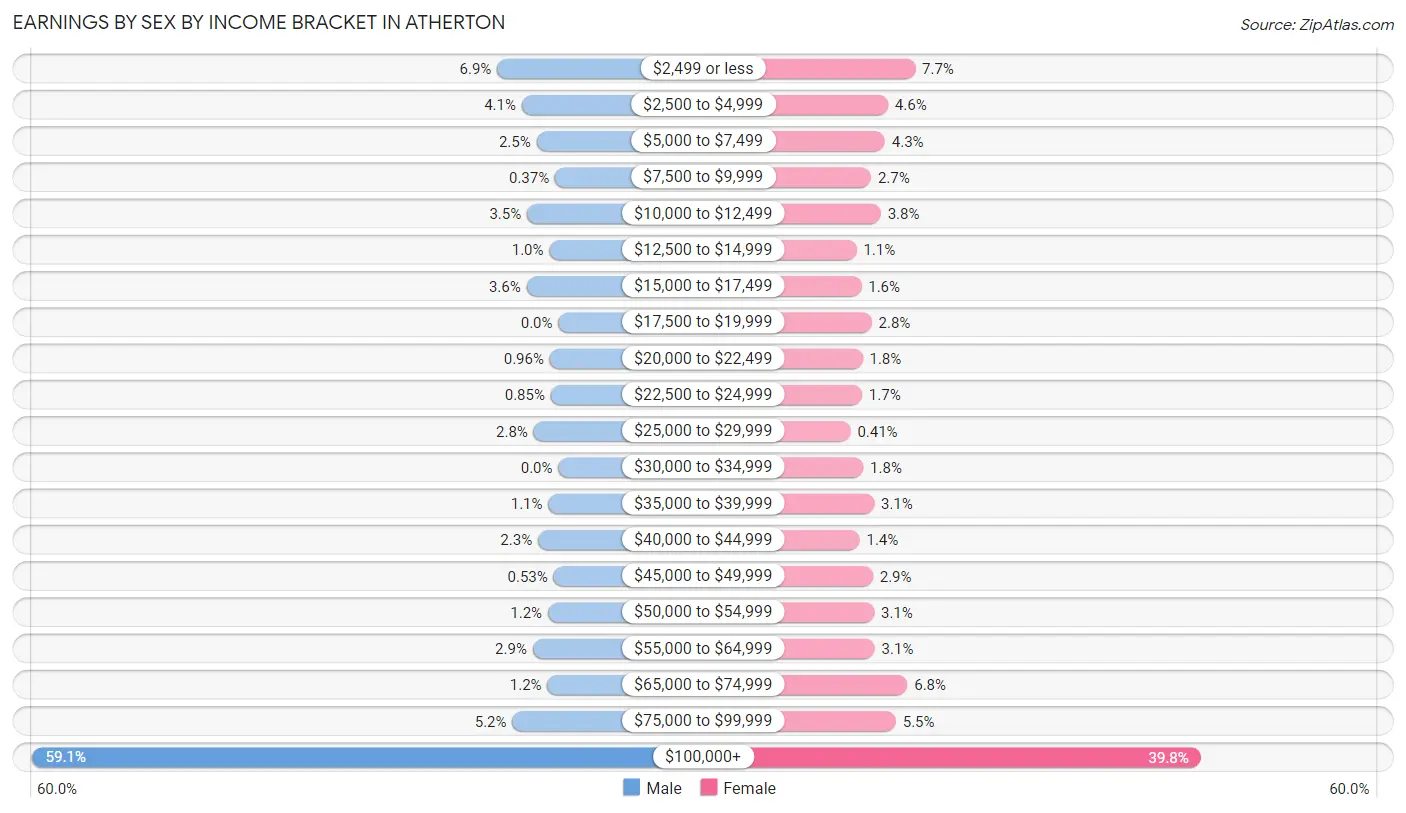
| Income | Male | Female |
| $2,499 or less | 129 (6.9%) | 113 (7.7%) |
| $2,500 to $4,999 | 77 (4.1%) | 68 (4.6%) |
| $5,000 to $7,499 | 46 (2.5%) | 63 (4.3%) |
| $7,500 to $9,999 | 7 (0.4%) | 40 (2.7%) |
| $10,000 to $12,499 | 66 (3.5%) | 56 (3.8%) |
| $12,500 to $14,999 | 19 (1.0%) | 16 (1.1%) |
| $15,000 to $17,499 | 67 (3.6%) | 24 (1.6%) |
| $17,500 to $19,999 | 0 (0.0%) | 41 (2.8%) |
| $20,000 to $22,499 | 18 (1.0%) | 26 (1.8%) |
| $22,500 to $24,999 | 16 (0.9%) | 25 (1.7%) |
| $25,000 to $29,999 | 52 (2.8%) | 6 (0.4%) |
| $30,000 to $34,999 | 0 (0.0%) | 27 (1.8%) |
| $35,000 to $39,999 | 21 (1.1%) | 45 (3.1%) |
| $40,000 to $44,999 | 43 (2.3%) | 21 (1.4%) |
| $45,000 to $49,999 | 10 (0.5%) | 43 (2.9%) |
| $50,000 to $54,999 | 22 (1.2%) | 45 (3.1%) |
| $55,000 to $64,999 | 54 (2.9%) | 46 (3.1%) |
| $65,000 to $74,999 | 23 (1.2%) | 100 (6.8%) |
| $75,000 to $99,999 | 97 (5.2%) | 81 (5.5%) |
| $100,000+ | 1,108 (59.1%) | 585 (39.8%) |
| Total | 1,875 (100.0%) | 1,471 (100.0%) |
Earnings by Sex by Educational Attainment in Atherton
Average earnings in Atherton are $160,625 for men and $100,223 for women, a difference of 37.6%. Men with an educational attainment of graduate degree enjoy the highest average annual earnings of $226,563, while those with bachelor's degree education earn the least with $101,218. Women with an educational attainment of graduate degree earn the most with the average annual earnings of $170,750, while those with bachelor's degree education have the smallest earnings of $52,250.
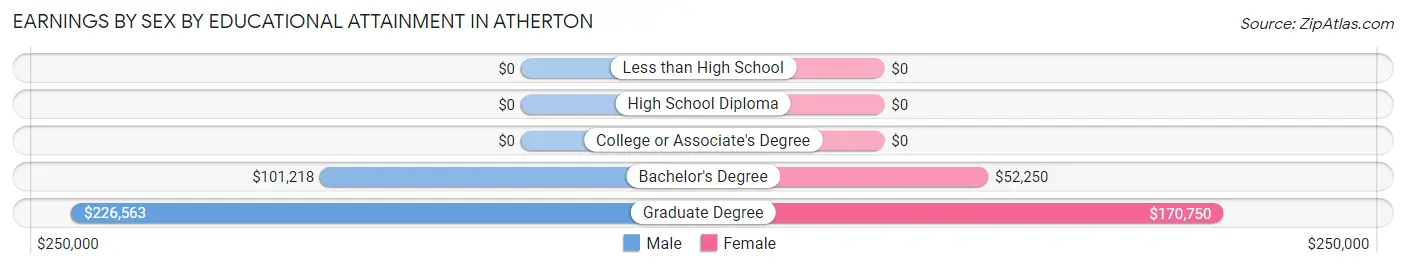
| Educational Attainment | Male Income | Female Income |
| Less than High School | - | - |
| High School Diploma | - | - |
| College or Associate's Degree | - | - |
| Bachelor's Degree | $101,218 | $52,250 |
| Graduate Degree | $226,563 | $170,750 |
| Total | $160,625 | $100,223 |
Family Income in Atherton
Family Income Brackets in Atherton
According to the Atherton family income data, there are 1,328 families falling into the $200,000+ income range, which is the most common income bracket and makes up 74.3% of all families.
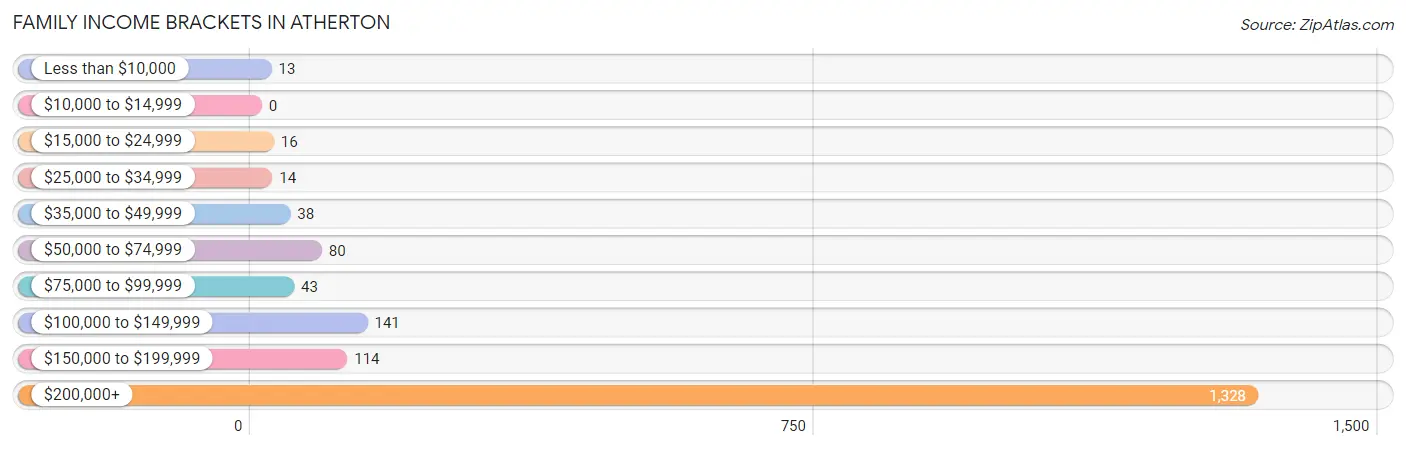
| Income Bracket | # Families | % Families |
| Less than $10,000 | 13 | 0.7% |
| $10,000 to $14,999 | 0 | 0.0% |
| $15,000 to $24,999 | 16 | 0.9% |
| $25,000 to $34,999 | 14 | 0.8% |
| $35,000 to $49,999 | 38 | 2.1% |
| $50,000 to $74,999 | 80 | 4.5% |
| $75,000 to $99,999 | 43 | 2.4% |
| $100,000 to $149,999 | 141 | 7.9% |
| $150,000 to $199,999 | 114 | 6.4% |
| $200,000+ | 1,328 | 74.3% |
Family Income by Famaliy Size in Atherton
2-person families (793 | 44.4%) account for the highest median family income in Atherton with $250,001 per family, while 2-person families (793 | 44.4%) have the highest median income of $125,000 per family member.
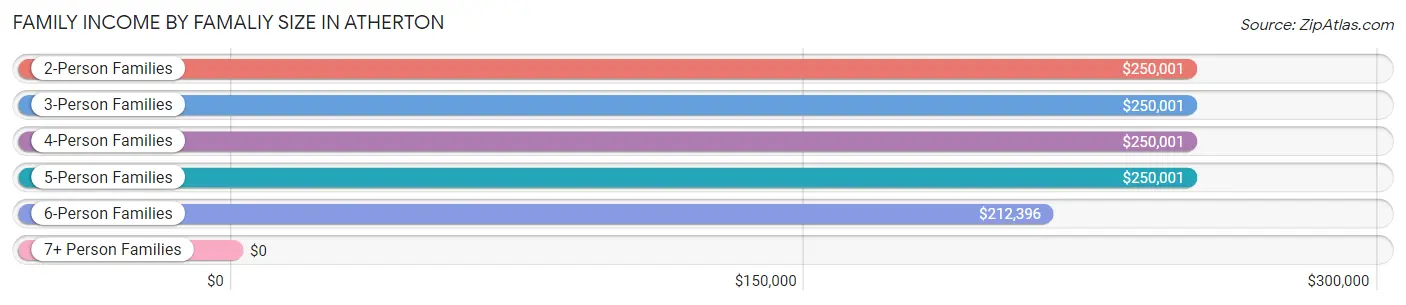
| Income Bracket | # Families | Median Income |
| 2-Person Families | 793 (44.4%) | $250,001 |
| 3-Person Families | 424 (23.7%) | $250,001 |
| 4-Person Families | 380 (21.3%) | $250,001 |
| 5-Person Families | 162 (9.1%) | $250,001 |
| 6-Person Families | 23 (1.3%) | $212,396 |
| 7+ Person Families | 5 (0.3%) | $0 |
| Total | 1,787 (100.0%) | $250,001 |
Family Income by Number of Earners in Atherton
The median family income in Atherton is $250,001, with families comprising 1 earner (717) having the highest median family income of $250,001, while families with no earners (355) have the lowest median family income of $249,750, accounting for 40.1% and 19.9% of families, respectively.
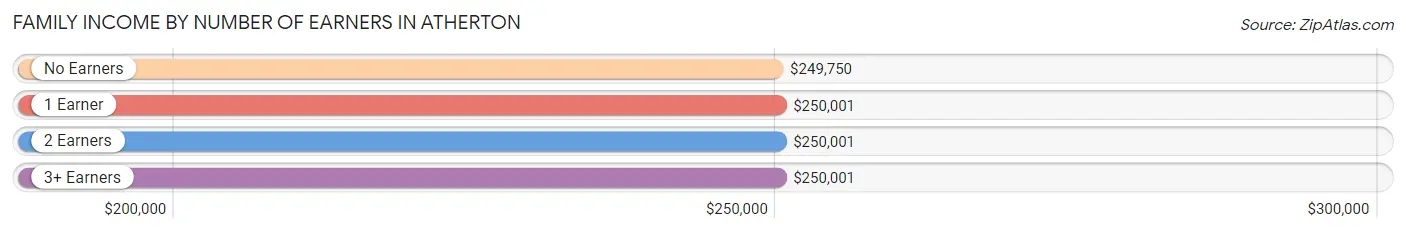
| Number of Earners | # Families | Median Income |
| No Earners | 355 (19.9%) | $249,750 |
| 1 Earner | 717 (40.1%) | $250,001 |
| 2 Earners | 607 (34.0%) | $250,001 |
| 3+ Earners | 108 (6.0%) | $250,001 |
| Total | 1,787 (100.0%) | $250,001 |
Household Income in Atherton
Household Income Brackets in Atherton
With 1,487 households falling in the category, the $200,000+ income range is the most frequent in Atherton, accounting for 68.1% of all households. In contrast, only 20 households (0.9%) fall into the $25,000 to $34,999 income bracket, making it the least populous group.
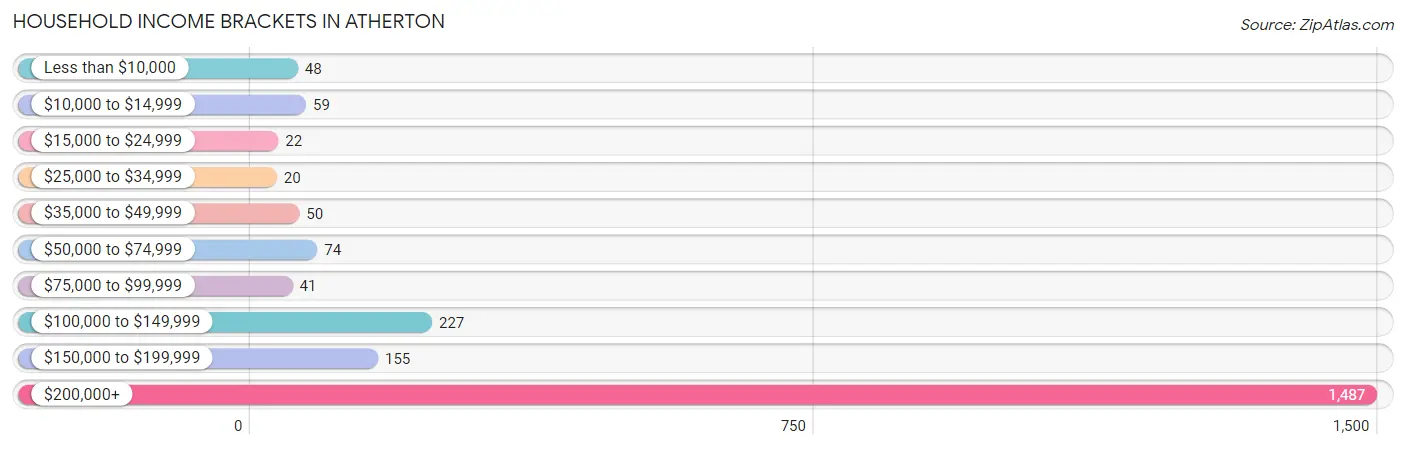
| Income Bracket | # Households | % Households |
| Less than $10,000 | 48 | 2.2% |
| $10,000 to $14,999 | 59 | 2.7% |
| $15,000 to $24,999 | 22 | 1.0% |
| $25,000 to $34,999 | 20 | 0.9% |
| $35,000 to $49,999 | 50 | 2.3% |
| $50,000 to $74,999 | 74 | 3.4% |
| $75,000 to $99,999 | 41 | 1.9% |
| $100,000 to $149,999 | 227 | 10.4% |
| $150,000 to $199,999 | 155 | 7.1% |
| $200,000+ | 1,487 | 68.1% |
Household Income by Householder Age in Atherton
The median household income in Atherton is $250,001, with the highest median household income of $250,001 found in the 25 to 44 years age bracket for the primary householder. A total of 236 households (10.8%) fall into this category. Meanwhile, the 15 to 24 years age bracket for the primary householder has the lowest median household income of $0, with 9 households (0.4%) in this group.
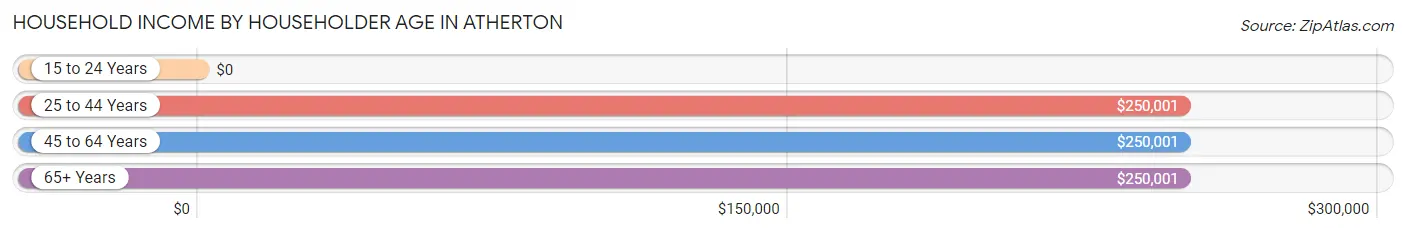
| Income Bracket | # Households | Median Income |
| 15 to 24 Years | 9 (0.4%) | $0 |
| 25 to 44 Years | 236 (10.8%) | $250,001 |
| 45 to 64 Years | 1,005 (46.0%) | $250,001 |
| 65+ Years | 933 (42.7%) | $250,001 |
| Total | 2,183 (100.0%) | $250,001 |
Poverty in Atherton
Income Below Poverty by Sex and Age in Atherton
With 2.6% poverty level for males and 5.3% for females among the residents of Atherton, 25 to 34 year old males and 65 to 74 year old females are the most vulnerable to poverty, with 43 males (13.3%) and 59 females (14.0%) in their respective age groups living below the poverty level.
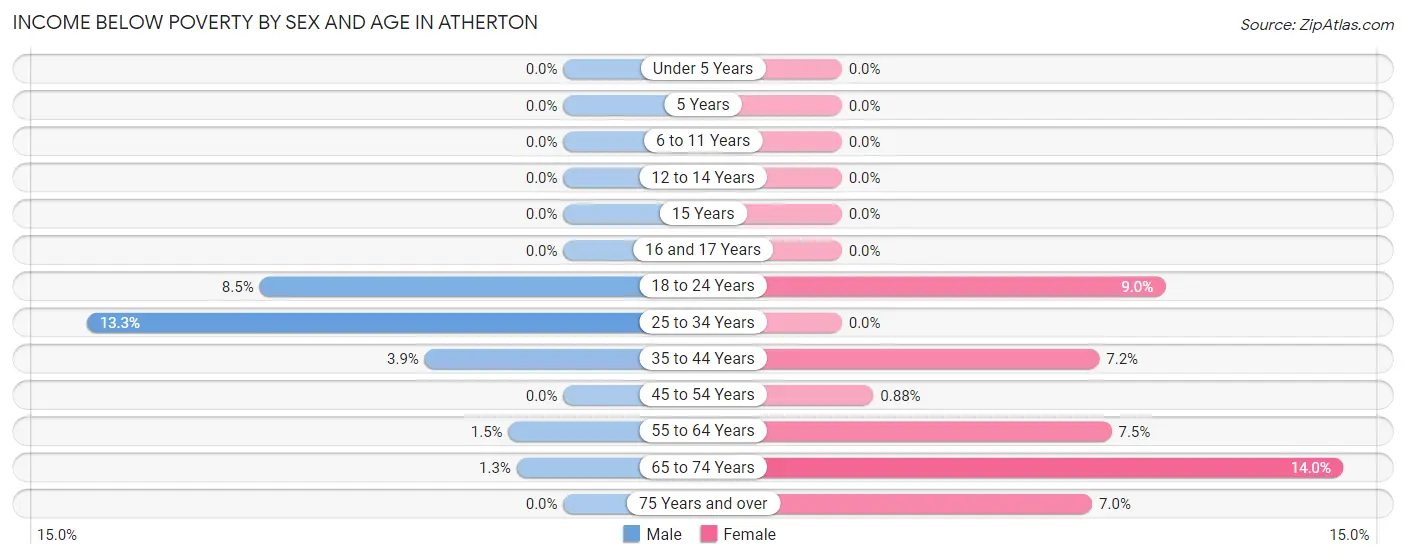
| Age Bracket | Male | Female |
| Under 5 Years | 0 (0.0%) | 0 (0.0%) |
| 5 Years | 0 (0.0%) | 0 (0.0%) |
| 6 to 11 Years | 0 (0.0%) | 0 (0.0%) |
| 12 to 14 Years | 0 (0.0%) | 0 (0.0%) |
| 15 Years | 0 (0.0%) | 0 (0.0%) |
| 16 and 17 Years | 0 (0.0%) | 0 (0.0%) |
| 18 to 24 Years | 23 (8.5%) | 19 (9.0%) |
| 25 to 34 Years | 43 (13.3%) | 0 (0.0%) |
| 35 to 44 Years | 8 (3.9%) | 20 (7.2%) |
| 45 to 54 Years | 0 (0.0%) | 5 (0.9%) |
| 55 to 64 Years | 7 (1.5%) | 38 (7.5%) |
| 65 to 74 Years | 6 (1.3%) | 59 (14.0%) |
| 75 Years and over | 0 (0.0%) | 32 (7.0%) |
| Total | 87 (2.6%) | 173 (5.3%) |
Income Above Poverty by Sex and Age in Atherton
According to the poverty statistics in Atherton, males aged under 5 years and females aged under 5 years are the age groups that are most secure financially, with 100.0% of males and 100.0% of females in these age groups living above the poverty line.
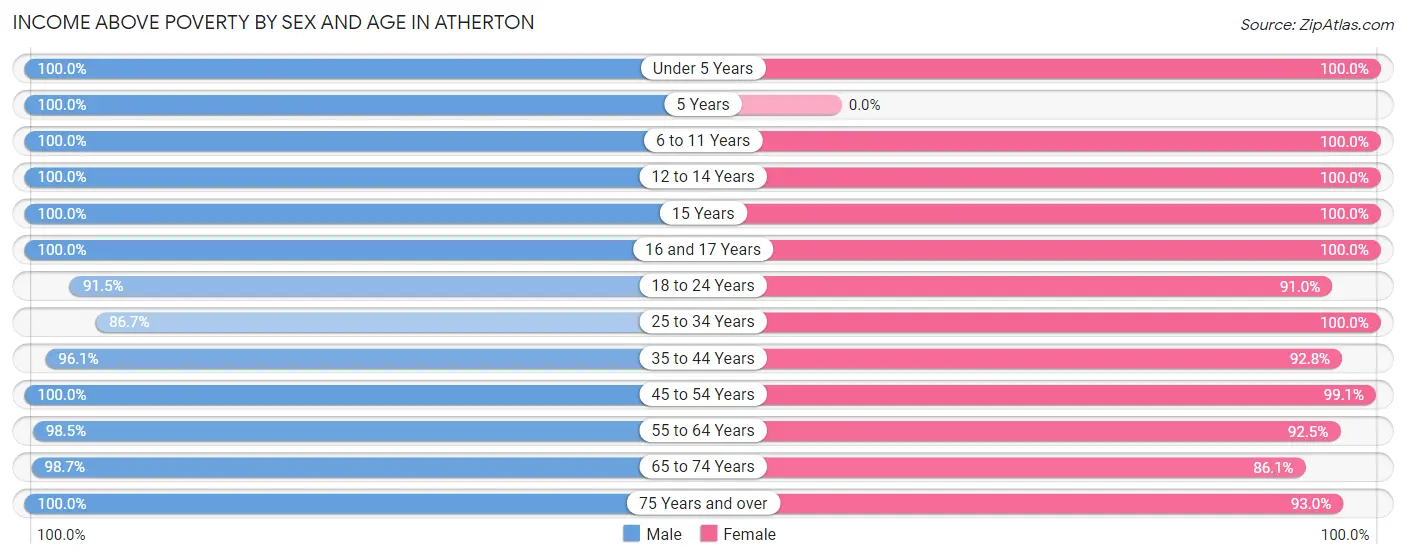
| Age Bracket | Male | Female |
| Under 5 Years | 85 (100.0%) | 38 (100.0%) |
| 5 Years | 26 (100.0%) | 0 (0.0%) |
| 6 to 11 Years | 189 (100.0%) | 185 (100.0%) |
| 12 to 14 Years | 230 (100.0%) | 233 (100.0%) |
| 15 Years | 82 (100.0%) | 64 (100.0%) |
| 16 and 17 Years | 196 (100.0%) | 91 (100.0%) |
| 18 to 24 Years | 249 (91.5%) | 192 (91.0%) |
| 25 to 34 Years | 281 (86.7%) | 227 (100.0%) |
| 35 to 44 Years | 199 (96.1%) | 259 (92.8%) |
| 45 to 54 Years | 413 (100.0%) | 563 (99.1%) |
| 55 to 64 Years | 450 (98.5%) | 468 (92.5%) |
| 65 to 74 Years | 456 (98.7%) | 364 (86.1%) |
| 75 Years and over | 358 (100.0%) | 427 (93.0%) |
| Total | 3,214 (97.4%) | 3,111 (94.7%) |
Income Below Poverty Among Married-Couple Families in Atherton
The poverty statistics for married-couple families in Atherton show that 0.7% or 12 of the total 1,665 families live below the poverty line. Families with no children have the highest poverty rate of 1.2%, comprising of 12 families. On the other hand, families with 1 or 2 children have the lowest poverty rate of 0.0%, which includes 0 families.
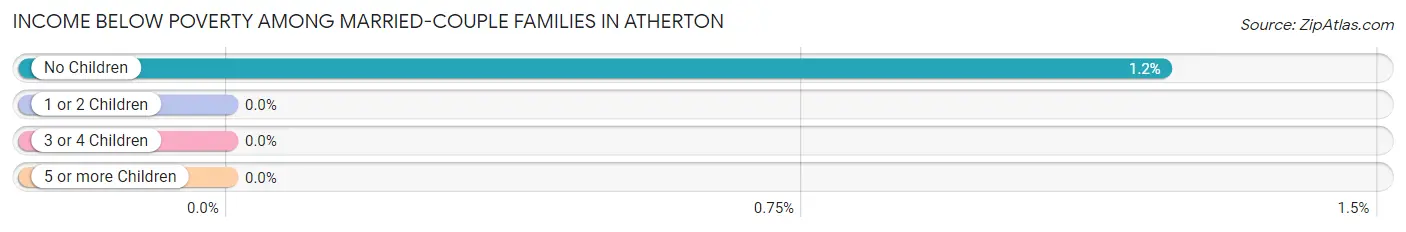
| Children | Above Poverty | Below Poverty |
| No Children | 970 (98.8%) | 12 (1.2%) |
| 1 or 2 Children | 554 (100.0%) | 0 (0.0%) |
| 3 or 4 Children | 124 (100.0%) | 0 (0.0%) |
| 5 or more Children | 5 (100.0%) | 0 (0.0%) |
| Total | 1,653 (99.3%) | 12 (0.7%) |
Income Below Poverty Among Single-Parent Households in Atherton
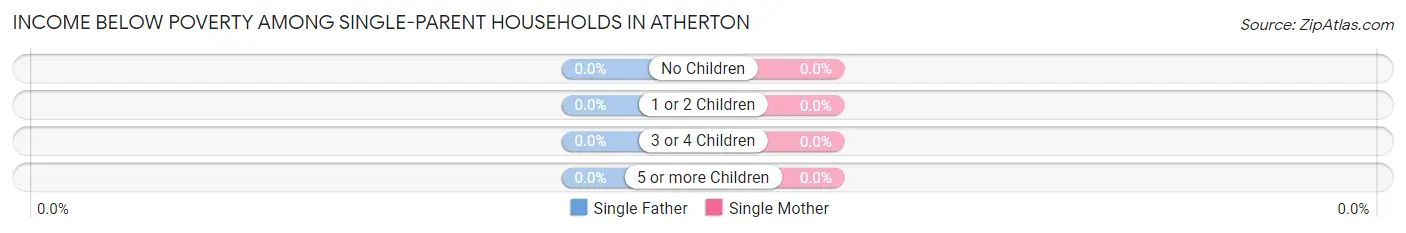
| Children | Single Father | Single Mother |
| No Children | 0 (0.0%) | 0 (0.0%) |
| 1 or 2 Children | 0 (0.0%) | 0 (0.0%) |
| 3 or 4 Children | 0 (0.0%) | 0 (0.0%) |
| 5 or more Children | 0 (0.0%) | 0 (0.0%) |
| Total | 0 (0.0%) | 0 (0.0%) |
Income Below Poverty Among Married-Couple vs Single-Parent Households in Atherton
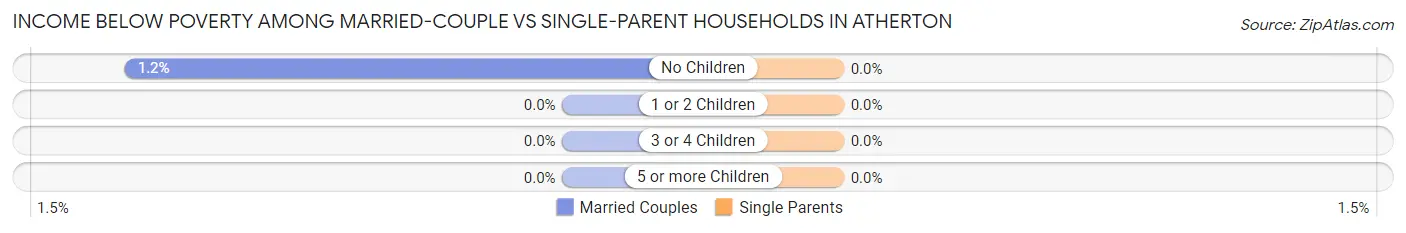
| Children | Married-Couple Families | Single-Parent Households |
| No Children | 12 (1.2%) | 0 (0.0%) |
| 1 or 2 Children | 0 (0.0%) | 0 (0.0%) |
| 3 or 4 Children | 0 (0.0%) | 0 (0.0%) |
| 5 or more Children | 0 (0.0%) | 0 (0.0%) |
| Total | 12 (0.7%) | 0 (0.0%) |
Race in Atherton
The most populous races in Atherton are White / Caucasian (5,099 | 71.6%), Asian (1,390 | 19.5%), and Hispanic or Latino (646 | 9.1%).
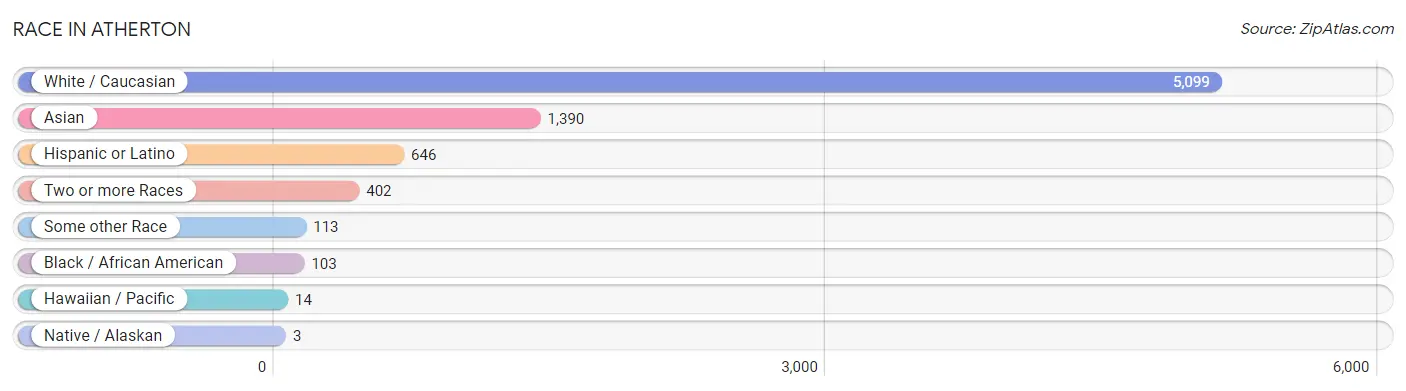
| Race | # Population | % Population |
| Asian | 1,390 | 19.5% |
| Black / African American | 103 | 1.5% |
| Hawaiian / Pacific | 14 | 0.2% |
| Hispanic or Latino | 646 | 9.1% |
| Native / Alaskan | 3 | 0.0% |
| White / Caucasian | 5,099 | 71.6% |
| Two or more Races | 402 | 5.6% |
| Some other Race | 113 | 1.6% |
| Total | 7,124 | 100.0% |
Ancestry in Atherton
The most populous ancestries reported in Atherton are Indian (Asian) (1,066 | 15.0%), English (889 | 12.5%), German (874 | 12.3%), Irish (505 | 7.1%), and Mexican (361 | 5.1%), together accounting for 51.9% of all Atherton residents.
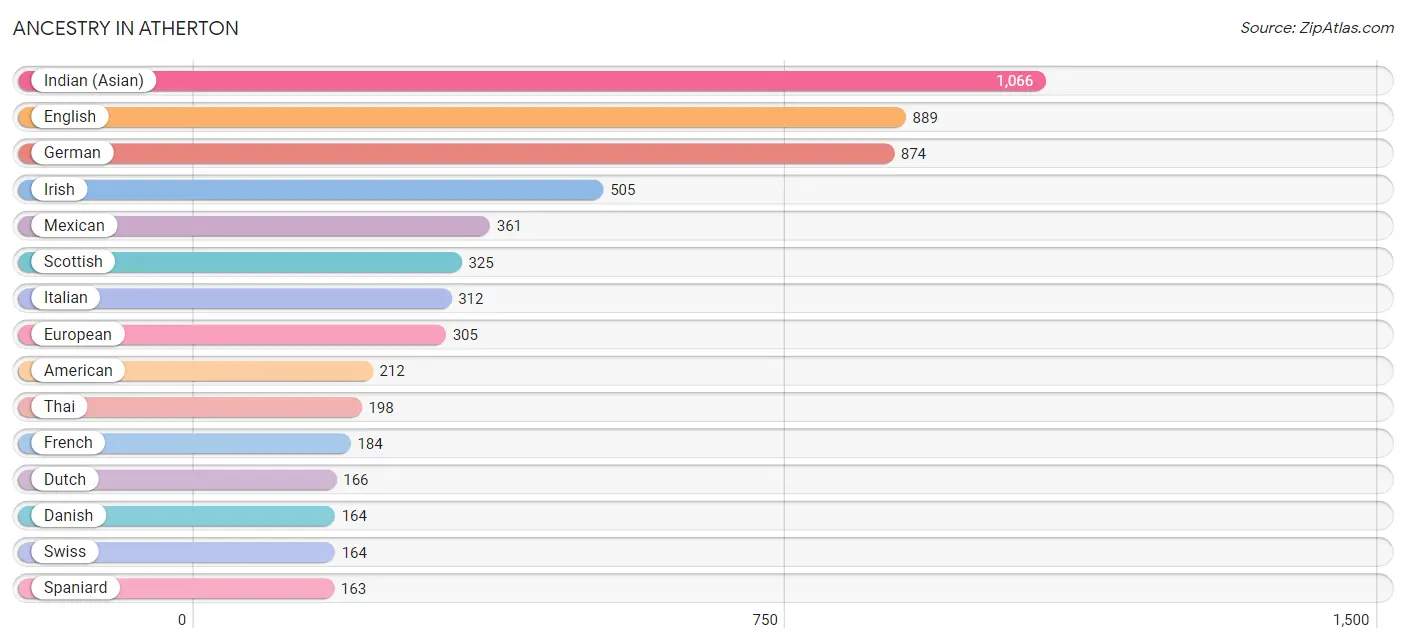
| Ancestry | # Population | % Population |
| American | 212 | 3.0% |
| Arab | 23 | 0.3% |
| Argentinean | 7 | 0.1% |
| Armenian | 8 | 0.1% |
| Austrian | 29 | 0.4% |
| Belgian | 72 | 1.0% |
| Bhutanese | 118 | 1.7% |
| Brazilian | 11 | 0.2% |
| British | 86 | 1.2% |
| Burmese | 104 | 1.5% |
| Canadian | 42 | 0.6% |
| Celtic | 8 | 0.1% |
| Central American | 15 | 0.2% |
| Cherokee | 11 | 0.2% |
| Colombian | 9 | 0.1% |
| Croatian | 5 | 0.1% |
| Cuban | 5 | 0.1% |
| Czech | 32 | 0.4% |
| Danish | 164 | 2.3% |
| Dominican | 12 | 0.2% |
| Dutch | 166 | 2.3% |
| Eastern European | 59 | 0.8% |
| English | 889 | 12.5% |
| European | 305 | 4.3% |
| Filipino | 12 | 0.2% |
| Finnish | 15 | 0.2% |
| French | 184 | 2.6% |
| French Canadian | 39 | 0.5% |
| German | 874 | 12.3% |
| Greek | 29 | 0.4% |
| Guamanian / Chamorro | 9 | 0.1% |
| Honduran | 4 | 0.1% |
| Hungarian | 29 | 0.4% |
| Indian (Asian) | 1,066 | 15.0% |
| Indonesian | 25 | 0.4% |
| Iranian | 88 | 1.2% |
| Irish | 505 | 7.1% |
| Italian | 312 | 4.4% |
| Korean | 65 | 0.9% |
| Lithuanian | 102 | 1.4% |
| Macedonian | 74 | 1.0% |
| Mexican | 361 | 5.1% |
| Native Hawaiian | 31 | 0.4% |
| New Zealander | 6 | 0.1% |
| Northern European | 38 | 0.5% |
| Norwegian | 150 | 2.1% |
| Okinawan | 9 | 0.1% |
| Pakistani | 29 | 0.4% |
| Peruvian | 11 | 0.2% |
| Polish | 118 | 1.7% |
| Portuguese | 21 | 0.3% |
| Puerto Rican | 4 | 0.1% |
| Romanian | 5 | 0.1% |
| Russian | 81 | 1.1% |
| Salvadoran | 11 | 0.2% |
| Samoan | 10 | 0.1% |
| Scandinavian | 15 | 0.2% |
| Scotch-Irish | 67 | 0.9% |
| Scottish | 325 | 4.6% |
| Slavic | 12 | 0.2% |
| Slovak | 11 | 0.2% |
| South American | 42 | 0.6% |
| Spaniard | 163 | 2.3% |
| Spanish | 22 | 0.3% |
| Spanish American | 22 | 0.3% |
| Spanish American Indian | 22 | 0.3% |
| Sri Lankan | 40 | 0.6% |
| Swedish | 154 | 2.2% |
| Swiss | 164 | 2.3% |
| Thai | 198 | 2.8% |
| Tongan | 6 | 0.1% |
| Turkish | 8 | 0.1% |
| Ukrainian | 59 | 0.8% |
| Venezuelan | 15 | 0.2% |
| Welsh | 40 | 0.6% | View All 75 Rows |
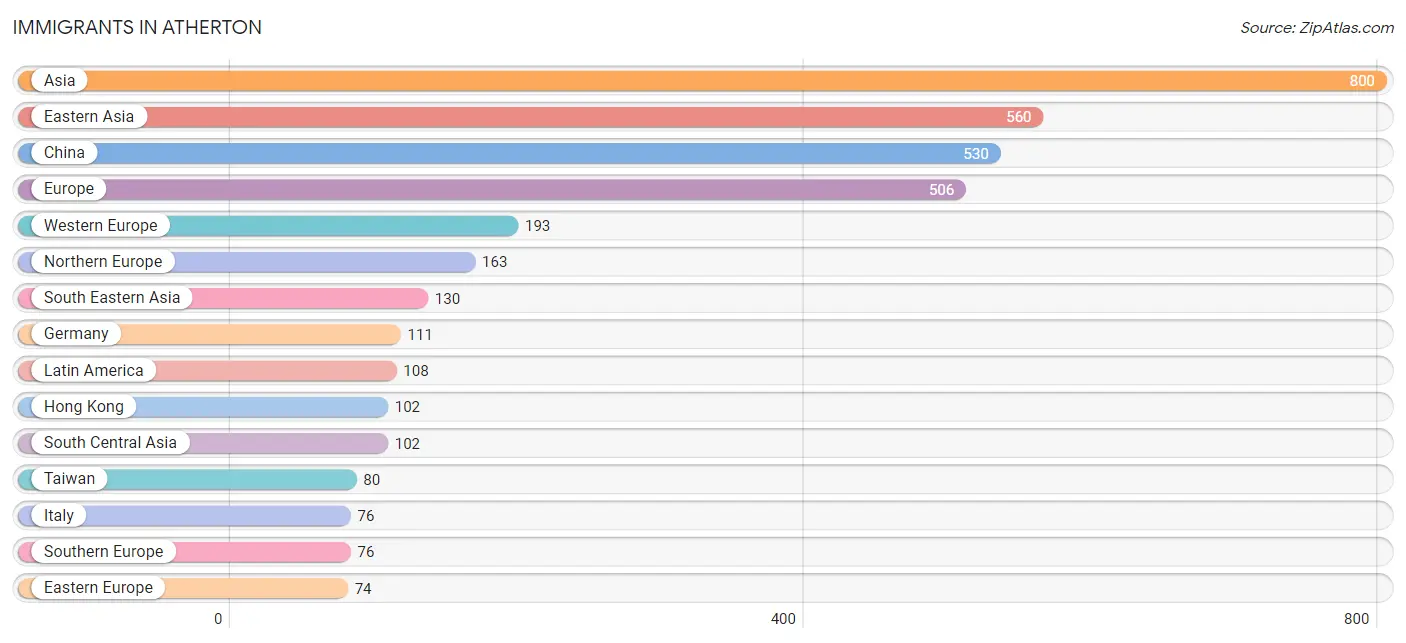
Immigrants in Atherton
The most numerous immigrant groups reported in Atherton came from Asia (800 | 11.2%), Eastern Asia (560 | 7.9%), China (530 | 7.4%), Europe (506 | 7.1%), and Western Europe (193 | 2.7%), together accounting for 36.3% of all Atherton residents.
| Immigration Origin | # Population | % Population |
| Asia | 800 | 11.2% |
| Australia | 7 | 0.1% |
| Brazil | 9 | 0.1% |
| Canada | 52 | 0.7% |
| Caribbean | 17 | 0.2% |
| Central America | 62 | 0.9% |
| China | 530 | 7.4% |
| Colombia | 9 | 0.1% |
| Cuba | 5 | 0.1% |
| Czechoslovakia | 10 | 0.1% |
| Denmark | 35 | 0.5% |
| Dominican Republic | 12 | 0.2% |
| Eastern Asia | 560 | 7.9% |
| Eastern Europe | 74 | 1.0% |
| England | 28 | 0.4% |
| Europe | 506 | 7.1% |
| France | 59 | 0.8% |
| Germany | 111 | 1.6% |
| Honduras | 4 | 0.1% |
| Hong Kong | 102 | 1.4% |
| India | 46 | 0.6% |
| Iran | 56 | 0.8% |
| Ireland | 24 | 0.3% |
| Italy | 76 | 1.1% |
| Japan | 24 | 0.3% |
| Korea | 6 | 0.1% |
| Latin America | 108 | 1.5% |
| Mexico | 58 | 0.8% |
| Northern Europe | 163 | 2.3% |
| Oceania | 13 | 0.2% |
| Peru | 11 | 0.2% |
| Philippines | 45 | 0.6% |
| Poland | 12 | 0.2% |
| Singapore | 38 | 0.5% |
| South America | 29 | 0.4% |
| South Central Asia | 102 | 1.4% |
| South Eastern Asia | 130 | 1.8% |
| Southern Europe | 76 | 1.1% |
| Sweden | 24 | 0.3% |
| Switzerland | 23 | 0.3% |
| Taiwan | 80 | 1.1% |
| Thailand | 13 | 0.2% |
| Turkey | 8 | 0.1% |
| Ukraine | 45 | 0.6% |
| Vietnam | 22 | 0.3% |
| Western Asia | 8 | 0.1% |
| Western Europe | 193 | 2.7% | View All 47 Rows |
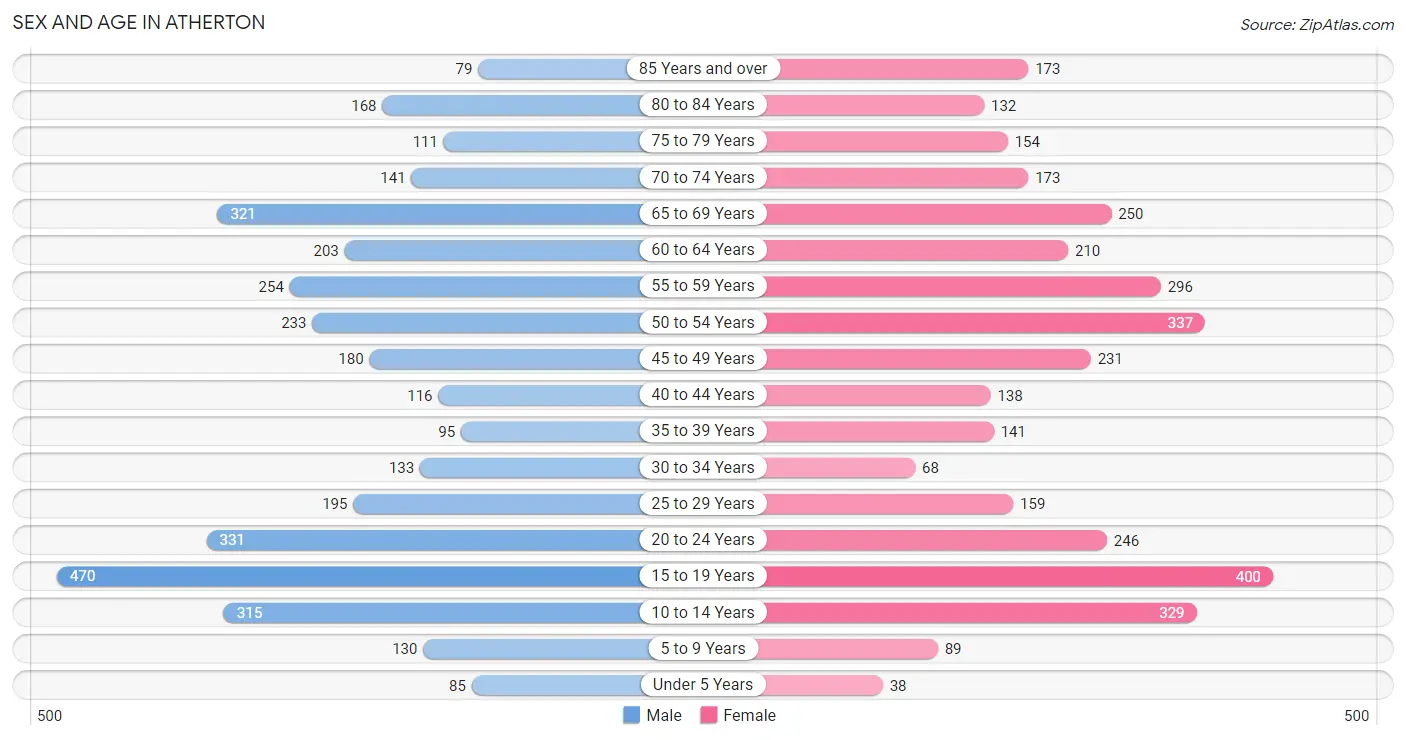
Sex and Age in Atherton
Sex and Age in Atherton
The most populous age groups in Atherton are 15 to 19 Years (470 | 13.2%) for men and 15 to 19 Years (400 | 11.2%) for women.
| Age Bracket | Male | Female |
| Under 5 Years | 85 (2.4%) | 38 (1.1%) |
| 5 to 9 Years | 130 (3.6%) | 89 (2.5%) |
| 10 to 14 Years | 315 (8.8%) | 329 (9.2%) |
| 15 to 19 Years | 470 (13.2%) | 400 (11.2%) |
| 20 to 24 Years | 331 (9.3%) | 246 (6.9%) |
| 25 to 29 Years | 195 (5.5%) | 159 (4.5%) |
| 30 to 34 Years | 133 (3.7%) | 68 (1.9%) |
| 35 to 39 Years | 95 (2.7%) | 141 (4.0%) |
| 40 to 44 Years | 116 (3.3%) | 138 (3.9%) |
| 45 to 49 Years | 180 (5.1%) | 231 (6.5%) |
| 50 to 54 Years | 233 (6.5%) | 337 (9.5%) |
| 55 to 59 Years | 254 (7.1%) | 296 (8.3%) |
| 60 to 64 Years | 203 (5.7%) | 210 (5.9%) |
| 65 to 69 Years | 321 (9.0%) | 250 (7.0%) |
| 70 to 74 Years | 141 (4.0%) | 173 (4.9%) |
| 75 to 79 Years | 111 (3.1%) | 154 (4.3%) |
| 80 to 84 Years | 168 (4.7%) | 132 (3.7%) |
| 85 Years and over | 79 (2.2%) | 173 (4.9%) |
| Total | 3,560 (100.0%) | 3,564 (100.0%) |
Families and Households in Atherton
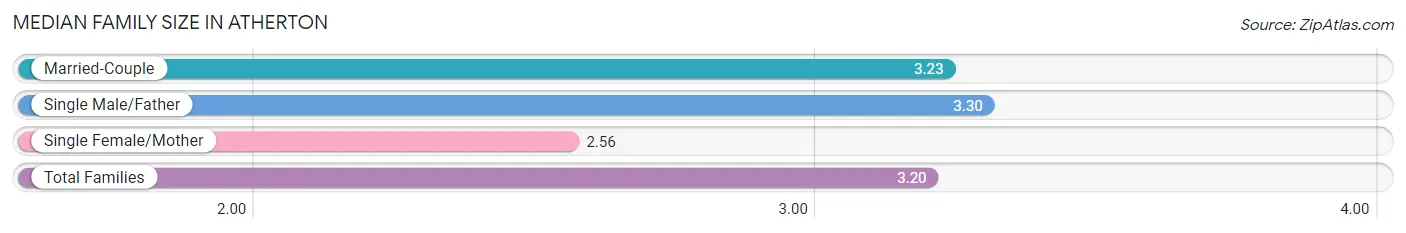
Median Family Size in Atherton
The median family size in Atherton is 3.20 persons per family, with single male/father families (54 | 3.0%) accounting for the largest median family size of 3.3 persons per family. On the other hand, single female/mother families (68 | 3.8%) represent the smallest median family size with 2.56 persons per family.
| Family Type | # Families | Family Size |
| Married-Couple | 1,665 (93.2%) | 3.23 |
| Single Male/Father | 54 (3.0%) | 3.30 |
| Single Female/Mother | 68 (3.8%) | 2.56 |
| Total Families | 1,787 (100.0%) | 3.20 |
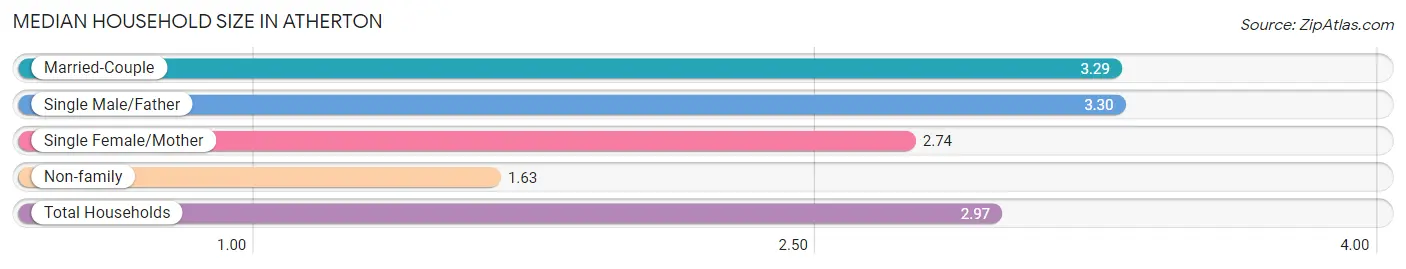
Median Household Size in Atherton
The median household size in Atherton is 2.97 persons per household, with single male/father households (54 | 2.5%) accounting for the largest median household size of 3.3 persons per household. non-family households (396 | 18.1%) represent the smallest median household size with 1.63 persons per household.
| Household Type | # Households | Household Size |
| Married-Couple | 1,665 (76.3%) | 3.29 |
| Single Male/Father | 54 (2.5%) | 3.30 |
| Single Female/Mother | 68 (3.1%) | 2.74 |
| Non-family | 396 (18.1%) | 1.63 |
| Total Households | 2,183 (100.0%) | 2.97 |
Household Size by Marriage Status in Atherton
Out of a total of 2,183 households in Atherton, 1,787 (81.9%) are family households, while 396 (18.1%) are nonfamily households. The most numerous type of family households are 2-person households, comprising 764, and the most common type of nonfamily households are 1-person households, comprising 269.
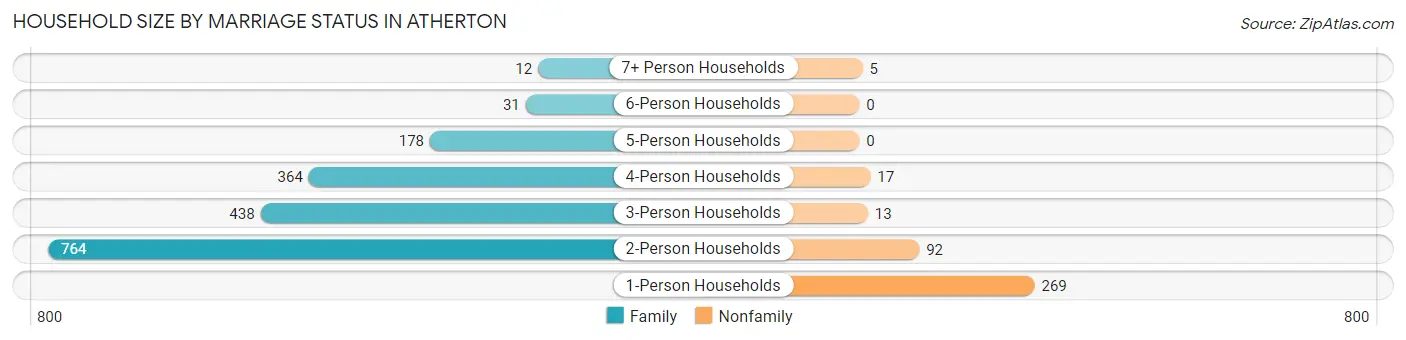
| Household Size | Family Households | Nonfamily Households |
| 1-Person Households | - | 269 (12.3%) |
| 2-Person Households | 764 (35.0%) | 92 (4.2%) |
| 3-Person Households | 438 (20.1%) | 13 (0.6%) |
| 4-Person Households | 364 (16.7%) | 17 (0.8%) |
| 5-Person Households | 178 (8.2%) | 0 (0.0%) |
| 6-Person Households | 31 (1.4%) | 0 (0.0%) |
| 7+ Person Households | 12 (0.5%) | 5 (0.2%) |
| Total | 1,787 (81.9%) | 396 (18.1%) |
Female Fertility in Atherton
Fertility by Age in Atherton
Average fertility rate in Atherton is 13.0 births per 1,000 women. Women in the age bracket of 35 to 50 years have the highest fertility rate with 33.0 births per 1,000 women. Women in the age bracket of 35 to 50 years acount for 100.0% of all women with births.
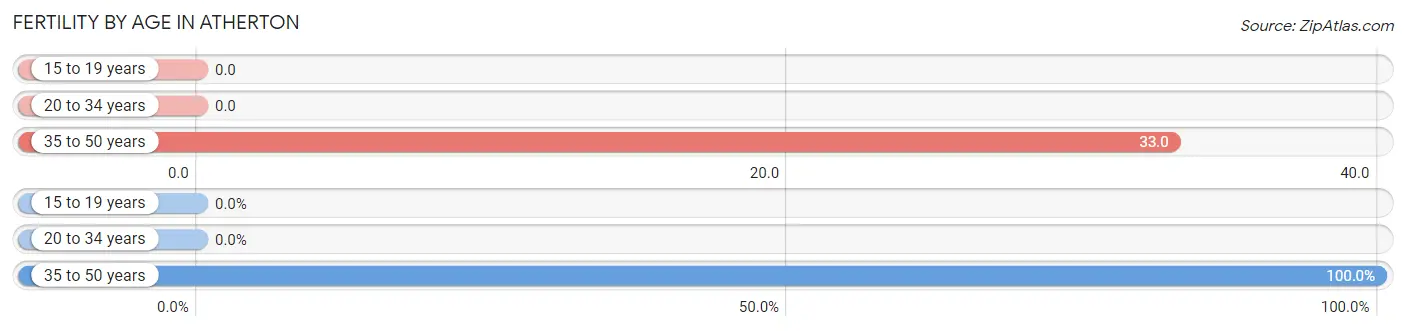
| Age Bracket | Women with Births | Births / 1,000 Women |
| 15 to 19 years | 0 (0.0%) | 0.0 |
| 20 to 34 years | 0 (0.0%) | 0.0 |
| 35 to 50 years | 18 (100.0%) | 33.0 |
| Total | 18 (100.0%) | 13.0 |
Fertility by Age by Marriage Status in Atherton
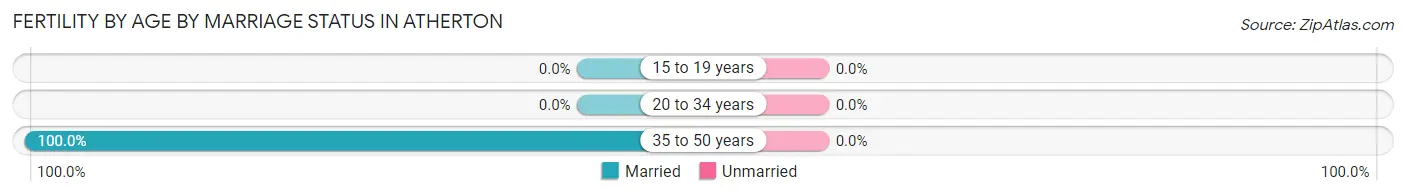
| Age Bracket | Married | Unmarried |
| 15 to 19 years | 0 (0.0%) | 0 (0.0%) |
| 20 to 34 years | 0 (0.0%) | 0 (0.0%) |
| 35 to 50 years | 18 (100.0%) | 0 (0.0%) |
| Total | 18 (100.0%) | 0 (0.0%) |
Fertility by Education in Atherton
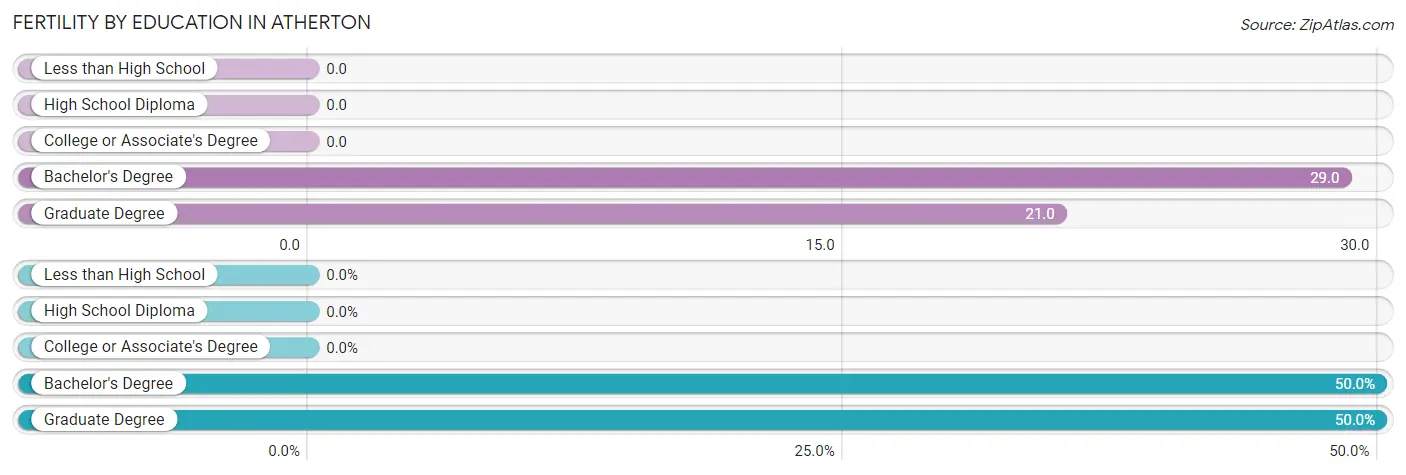
| Educational Attainment | Women with Births | Births / 1,000 Women |
| Less than High School | 0 (0.0%) | 0.0 |
| High School Diploma | 0 (0.0%) | 0.0 |
| College or Associate's Degree | 0 (0.0%) | 0.0 |
| Bachelor's Degree | 9 (50.0%) | 29.0 |
| Graduate Degree | 9 (50.0%) | 21.0 |
| Total | 18 (100.0%) | 13.0 |
Fertility by Education by Marriage Status in Atherton
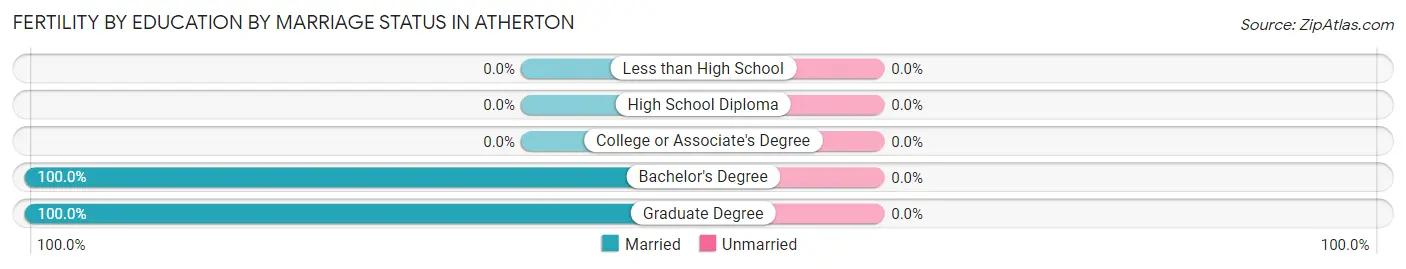
| Educational Attainment | Married | Unmarried |
| Less than High School | 0 (0.0%) | 0 (0.0%) |
| High School Diploma | 0 (0.0%) | 0 (0.0%) |
| College or Associate's Degree | 0 (0.0%) | 0 (0.0%) |
| Bachelor's Degree | 9 (100.0%) | 0 (0.0%) |
| Graduate Degree | 9 (100.0%) | 0 (0.0%) |
| Total | 18 (100.0%) | 0 (0.0%) |
Employment Characteristics in Atherton
Employment by Class of Employer in Atherton
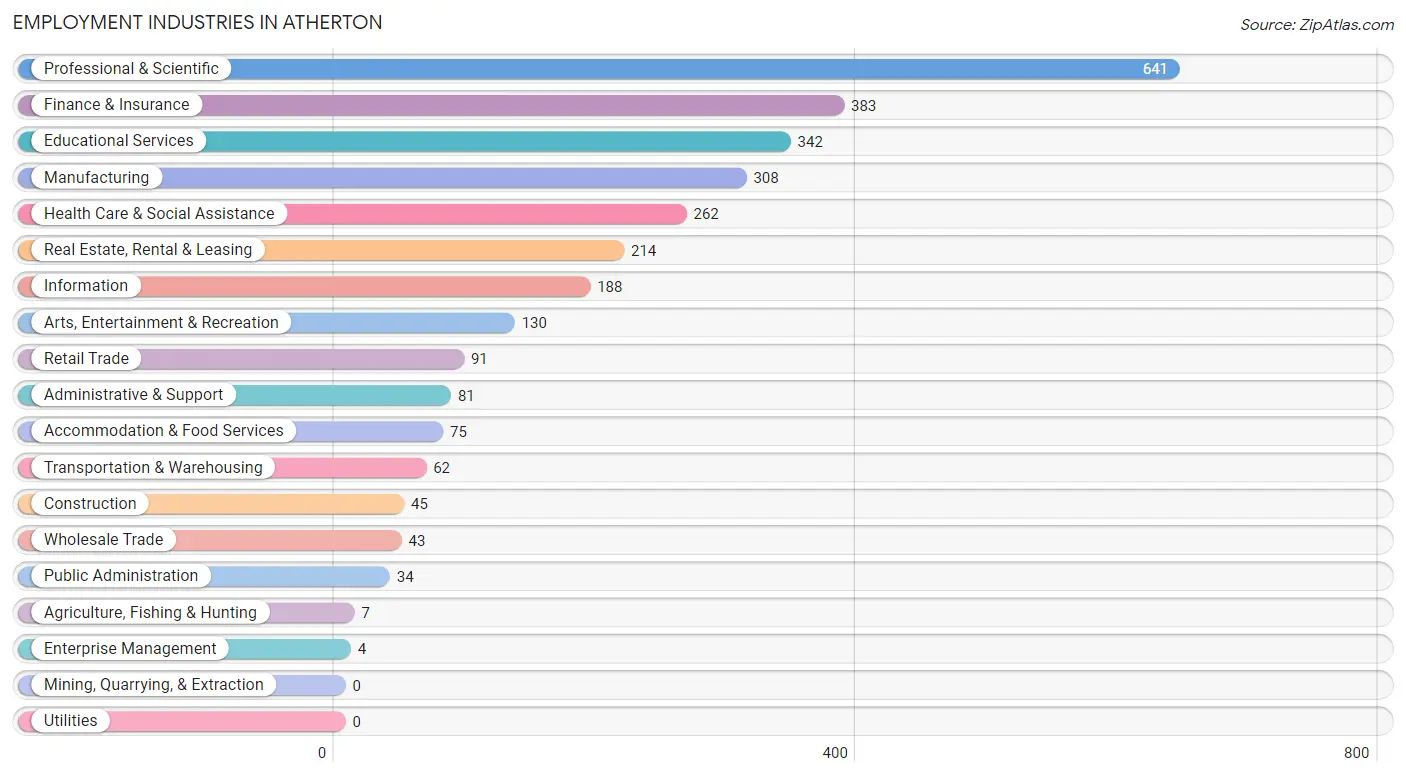
Among the 2,907 employed individuals in Atherton, private company employees (1,766 | 60.8%), self-employed (incorporated) (402 | 13.8%), and not-for-profit organizations (321 | 11.0%) make up the most common classes of employment.
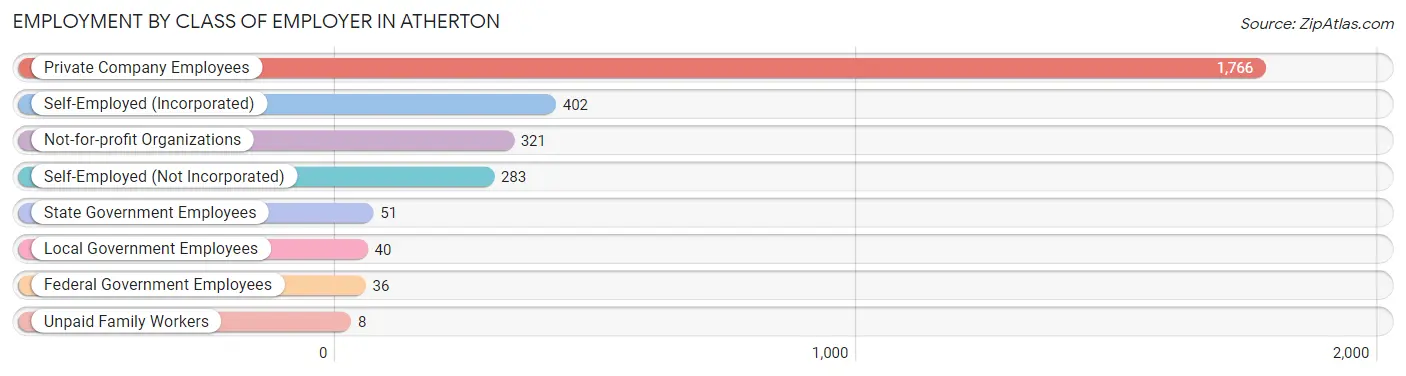
| Employer Class | # Employees | % Employees |
| Private Company Employees | 1,766 | 60.8% |
| Self-Employed (Incorporated) | 402 | 13.8% |
| Self-Employed (Not Incorporated) | 283 | 9.7% |
| Not-for-profit Organizations | 321 | 11.0% |
| Local Government Employees | 40 | 1.4% |
| State Government Employees | 51 | 1.8% |
| Federal Government Employees | 36 | 1.2% |
| Unpaid Family Workers | 8 | 0.3% |
| Total | 2,907 | 100.0% |
Employment Status by Age in Atherton
According to the labor force statistics for Atherton, out of the total population over 16 years of age (5,992), 50.8% or 3,044 individuals are in the labor force, with 2.2% or 67 of them unemployed. The age group with the highest labor force participation rate is 30 to 34 years, with 91.5% or 184 individuals in the labor force. Within the labor force, the 20 to 24 years age range has the highest percentage of unemployed individuals, with 11.9% or 35 of them being unemployed.
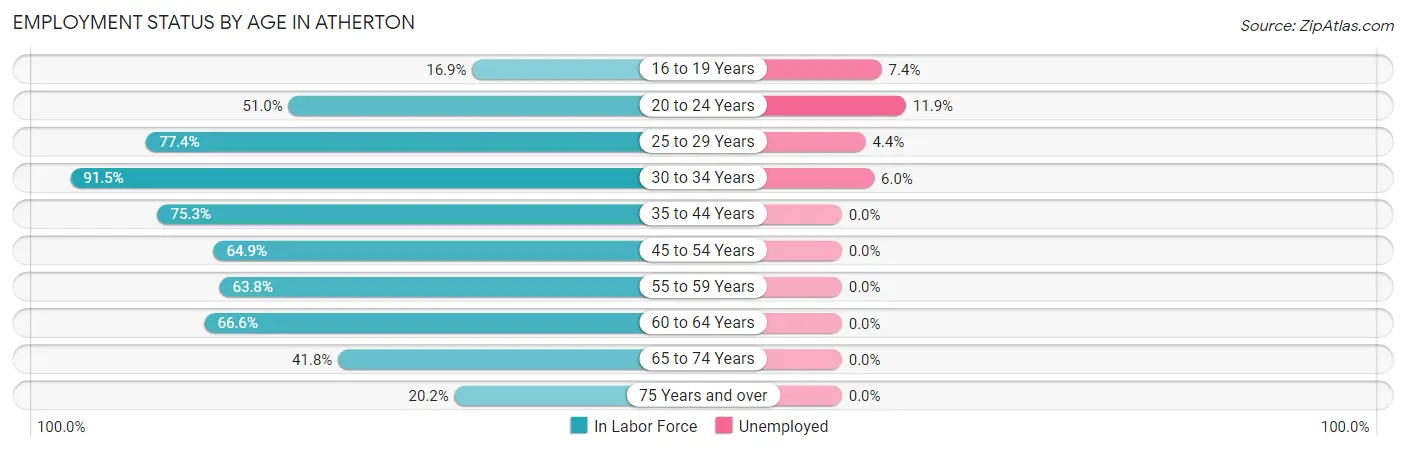
| Age Bracket | In Labor Force | Unemployed |
| 16 to 19 Years | 122 (16.9%) | 9 (7.4%) |
| 20 to 24 Years | 294 (51.0%) | 35 (11.9%) |
| 25 to 29 Years | 274 (77.4%) | 12 (4.4%) |
| 30 to 34 Years | 184 (91.5%) | 11 (6.0%) |
| 35 to 44 Years | 369 (75.3%) | 0 (0.0%) |
| 45 to 54 Years | 637 (64.9%) | 0 (0.0%) |
| 55 to 59 Years | 351 (63.8%) | 0 (0.0%) |
| 60 to 64 Years | 275 (66.6%) | 0 (0.0%) |
| 65 to 74 Years | 370 (41.8%) | 0 (0.0%) |
| 75 Years and over | 165 (20.2%) | 0 (0.0%) |
| Total | 3,044 (50.8%) | 67 (2.2%) |
Employment Status by Educational Attainment in Atherton
According to labor force statistics for Atherton, 69.9% of individuals (2,089) out of the total population between 25 and 64 years of age (2,989) are in the labor force, with 1.1% or 23 of them being unemployed. The group with the highest labor force participation rate are those with the educational attainment of less than high school, with 100.0% or 24 individuals in the labor force. Within the labor force, individuals with bachelor's degree or higher education have the highest percentage of unemployment, with 1.3% or 23 of them being unemployed.
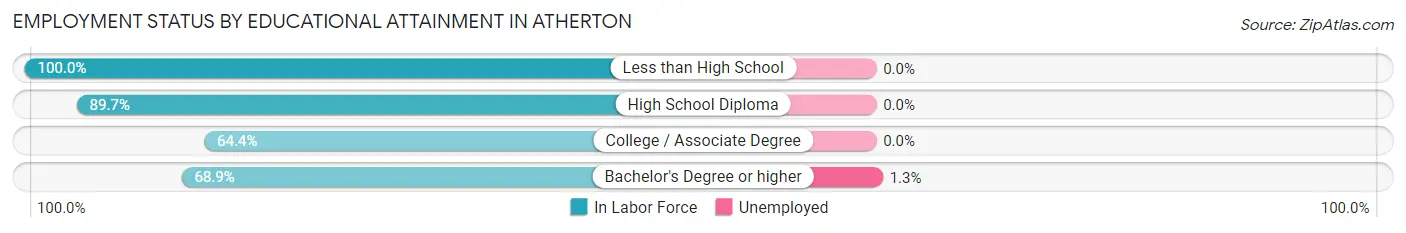
| Educational Attainment | In Labor Force | Unemployed |
| Less than High School | 24 (100.0%) | 0 (0.0%) |
| High School Diploma | 139 (89.7%) | 0 (0.0%) |
| College / Associate Degree | 125 (64.4%) | 0 (0.0%) |
| Bachelor's Degree or higher | 1,802 (68.9%) | 34 (1.3%) |
| Total | 2,089 (69.9%) | 33 (1.1%) |
Employment Occupations by Sex in Atherton
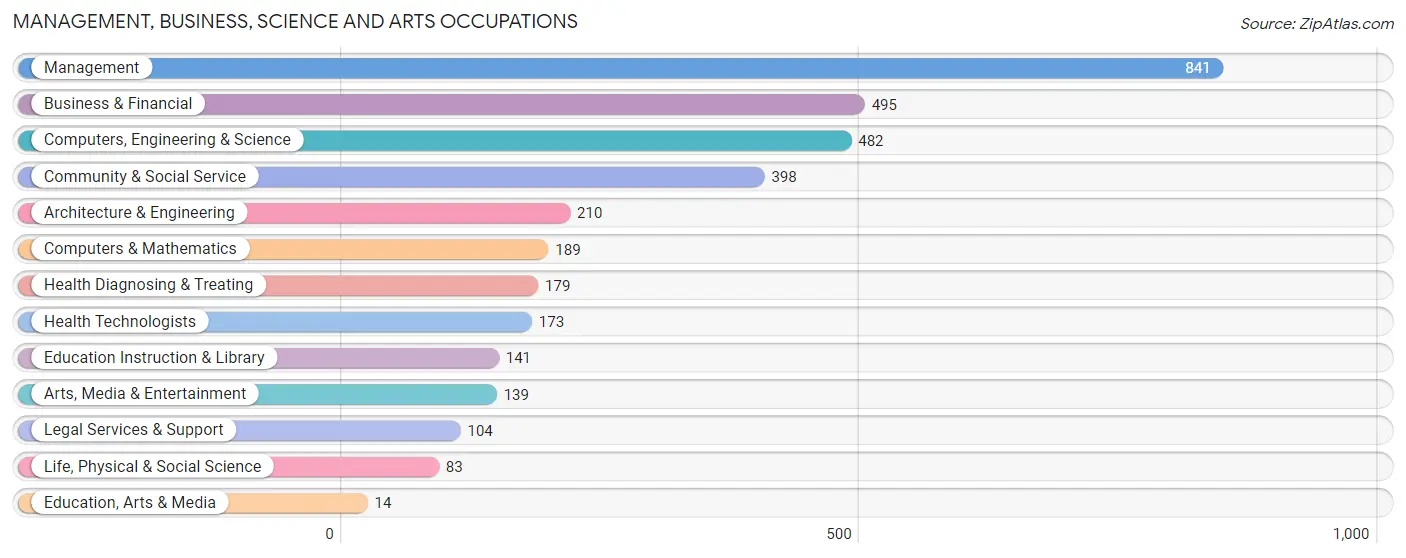
Management, Business, Science and Arts Occupations
The most common Management, Business, Science and Arts occupations in Atherton are Management (841 | 28.3%), Business & Financial (495 | 16.6%), Computers, Engineering & Science (482 | 16.2%), Community & Social Service (398 | 13.4%), and Architecture & Engineering (210 | 7.1%).
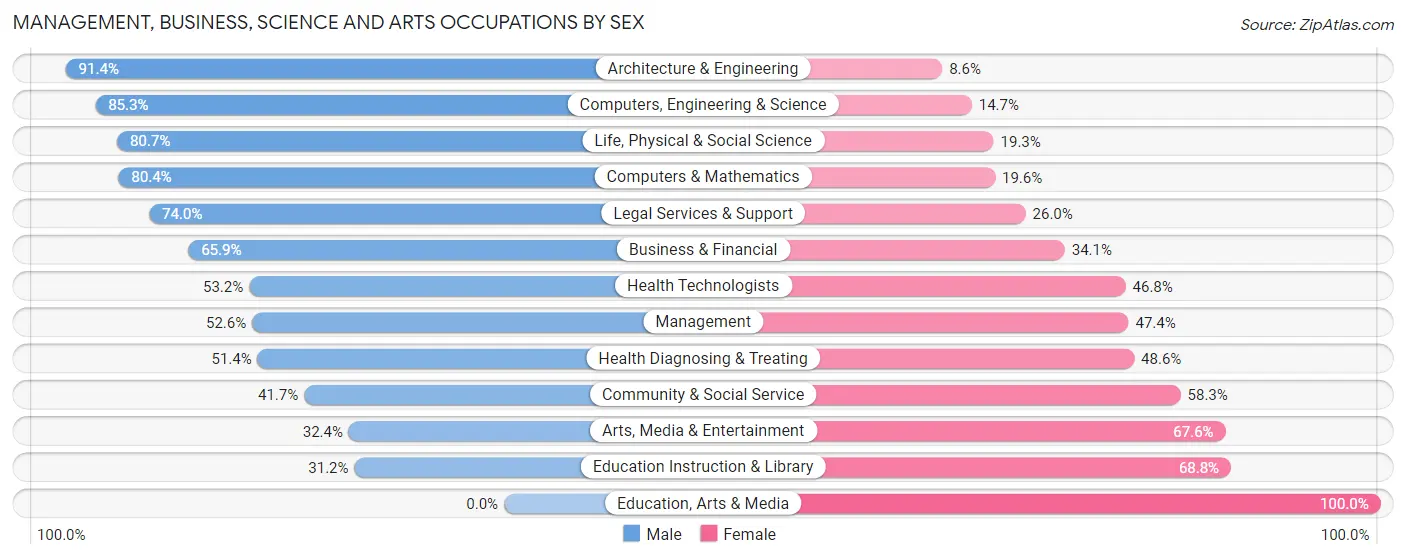
Management, Business, Science and Arts Occupations by Sex
Within the Management, Business, Science and Arts occupations in Atherton, the most male-oriented occupations are Architecture & Engineering (91.4%), Computers, Engineering & Science (85.3%), and Life, Physical & Social Science (80.7%), while the most female-oriented occupations are Education, Arts & Media (100.0%), Education Instruction & Library (68.8%), and Arts, Media & Entertainment (67.6%).
| Occupation | Male | Female |
| Management | 442 (52.6%) | 399 (47.4%) |
| Business & Financial | 326 (65.9%) | 169 (34.1%) |
| Computers, Engineering & Science | 411 (85.3%) | 71 (14.7%) |
| Computers & Mathematics | 152 (80.4%) | 37 (19.6%) |
| Architecture & Engineering | 192 (91.4%) | 18 (8.6%) |
| Life, Physical & Social Science | 67 (80.7%) | 16 (19.3%) |
| Community & Social Service | 166 (41.7%) | 232 (58.3%) |
| Education, Arts & Media | 0 (0.0%) | 14 (100.0%) |
| Legal Services & Support | 77 (74.0%) | 27 (26.0%) |
| Education Instruction & Library | 44 (31.2%) | 97 (68.8%) |
| Arts, Media & Entertainment | 45 (32.4%) | 94 (67.6%) |
| Health Diagnosing & Treating | 92 (51.4%) | 87 (48.6%) |
| Health Technologists | 92 (53.2%) | 81 (46.8%) |
| Total (Category) | 1,437 (60.0%) | 958 (40.0%) |
| Total (Overall) | 1,663 (55.9%) | 1,311 (44.1%) |
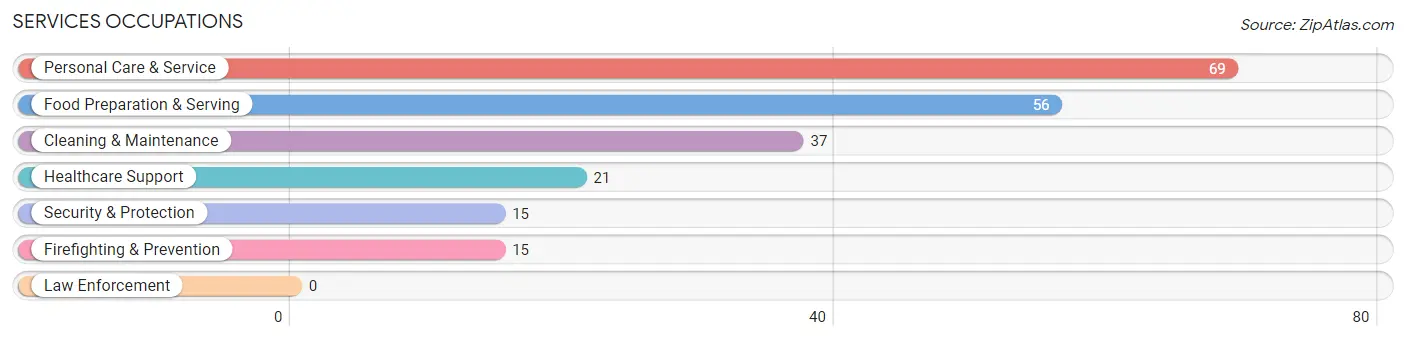
Services Occupations
The most common Services occupations in Atherton are Personal Care & Service (69 | 2.3%), Food Preparation & Serving (56 | 1.9%), Cleaning & Maintenance (37 | 1.2%), Healthcare Support (21 | 0.7%), and Security & Protection (15 | 0.5%).
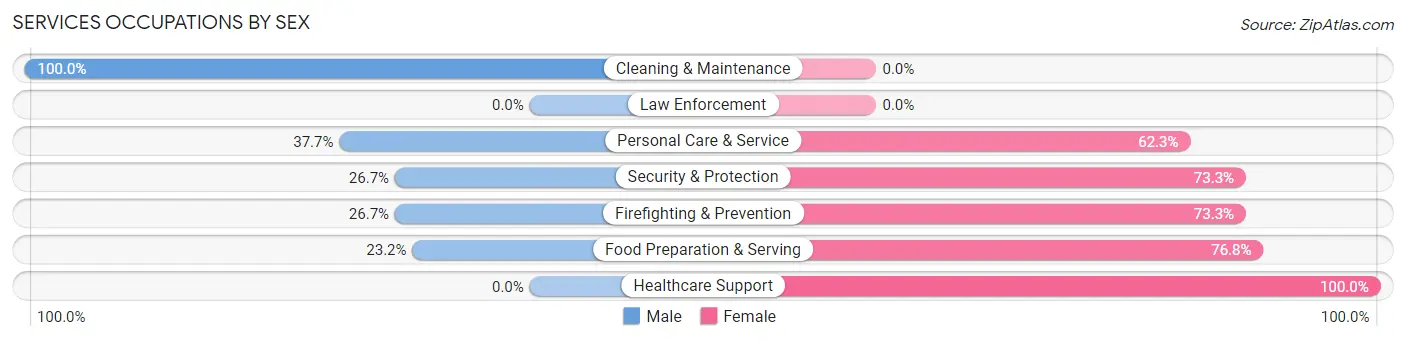
Services Occupations by Sex
Within the Services occupations in Atherton, the most male-oriented occupations are Cleaning & Maintenance (100.0%), Personal Care & Service (37.7%), and Security & Protection (26.7%), while the most female-oriented occupations are Healthcare Support (100.0%), Food Preparation & Serving (76.8%), and Security & Protection (73.3%).
| Occupation | Male | Female |
| Healthcare Support | 0 (0.0%) | 21 (100.0%) |
| Security & Protection | 4 (26.7%) | 11 (73.3%) |
| Firefighting & Prevention | 4 (26.7%) | 11 (73.3%) |
| Law Enforcement | 0 (0.0%) | 0 (0.0%) |
| Food Preparation & Serving | 13 (23.2%) | 43 (76.8%) |
| Cleaning & Maintenance | 37 (100.0%) | 0 (0.0%) |
| Personal Care & Service | 26 (37.7%) | 43 (62.3%) |
| Total (Category) | 80 (40.4%) | 118 (59.6%) |
| Total (Overall) | 1,663 (55.9%) | 1,311 (44.1%) |
Sales and Office Occupations
The most common Sales and Office occupations in Atherton are Office & Administration (177 | 5.9%), and Sales & Related (159 | 5.3%).
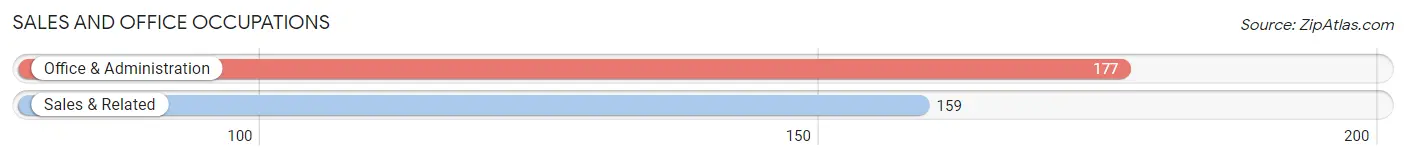
Sales and Office Occupations by Sex
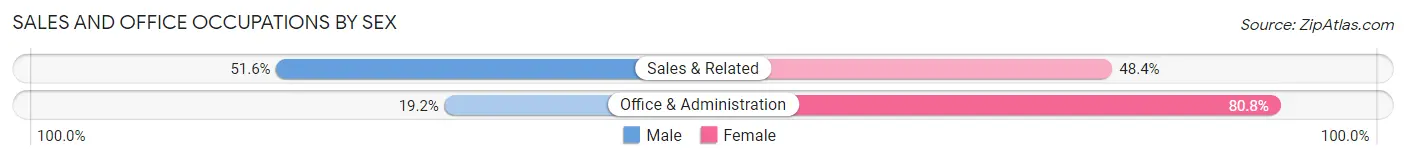
| Occupation | Male | Female |
| Sales & Related | 82 (51.6%) | 77 (48.4%) |
| Office & Administration | 34 (19.2%) | 143 (80.8%) |
| Total (Category) | 116 (34.5%) | 220 (65.5%) |
| Total (Overall) | 1,663 (55.9%) | 1,311 (44.1%) |
Natural Resources, Construction and Maintenance Occupations
The most common Natural Resources, Construction and Maintenance occupations in Atherton are Farming, Fishing & Forestry (7 | 0.2%), and Construction & Extraction (6 | 0.2%).
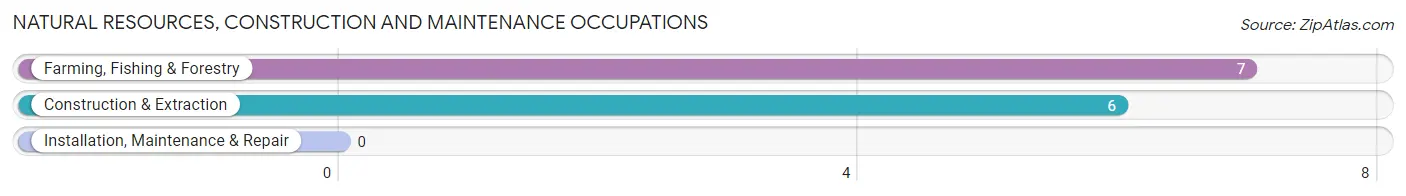
Natural Resources, Construction and Maintenance Occupations by Sex
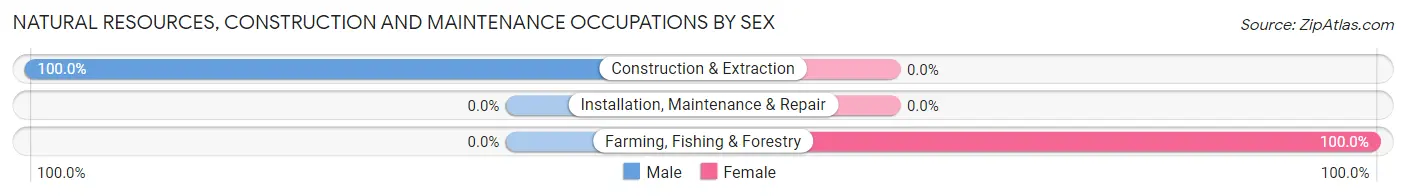
| Occupation | Male | Female |
| Farming, Fishing & Forestry | 0 (0.0%) | 7 (100.0%) |
| Construction & Extraction | 6 (100.0%) | 0 (0.0%) |
| Installation, Maintenance & Repair | 0 (0.0%) | 0 (0.0%) |
| Total (Category) | 6 (46.2%) | 7 (53.8%) |
| Total (Overall) | 1,663 (55.9%) | 1,311 (44.1%) |
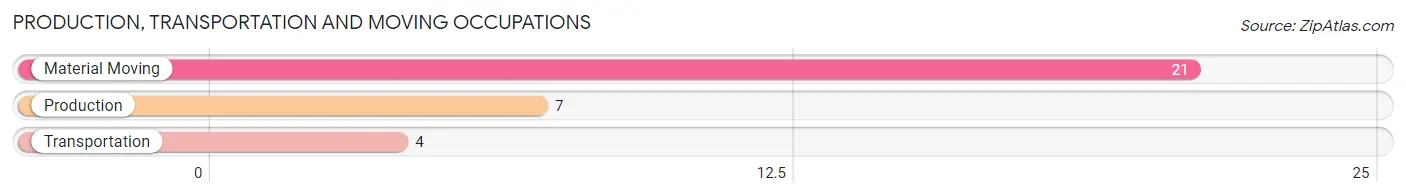
Production, Transportation and Moving Occupations
The most common Production, Transportation and Moving occupations in Atherton are Material Moving (21 | 0.7%), Production (7 | 0.2%), and Transportation (4 | 0.1%).
Production, Transportation and Moving Occupations by Sex
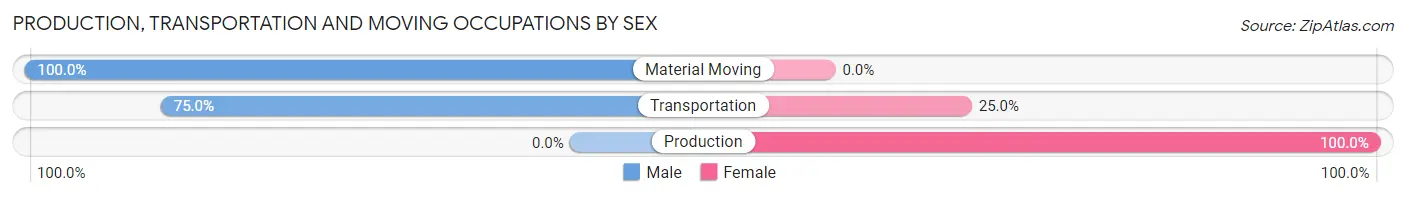
| Occupation | Male | Female |
| Production | 0 (0.0%) | 7 (100.0%) |
| Transportation | 3 (75.0%) | 1 (25.0%) |
| Material Moving | 21 (100.0%) | 0 (0.0%) |
| Total (Category) | 24 (75.0%) | 8 (25.0%) |
| Total (Overall) | 1,663 (55.9%) | 1,311 (44.1%) |
Employment Industries by Sex in Atherton
Employment Industries in Atherton
The major employment industries in Atherton include Professional & Scientific (641 | 21.5%), Finance & Insurance (383 | 12.9%), Educational Services (342 | 11.5%), Manufacturing (308 | 10.4%), and Health Care & Social Assistance (262 | 8.8%).
Employment Industries by Sex in Atherton
The Atherton industries that see more men than women are Agriculture, Fishing & Hunting (100.0%), Enterprise Management (100.0%), and Transportation & Warehousing (85.5%), whereas the industries that tend to have a higher number of women are Accommodation & Food Services (88.0%), Public Administration (79.4%), and Health Care & Social Assistance (64.5%).
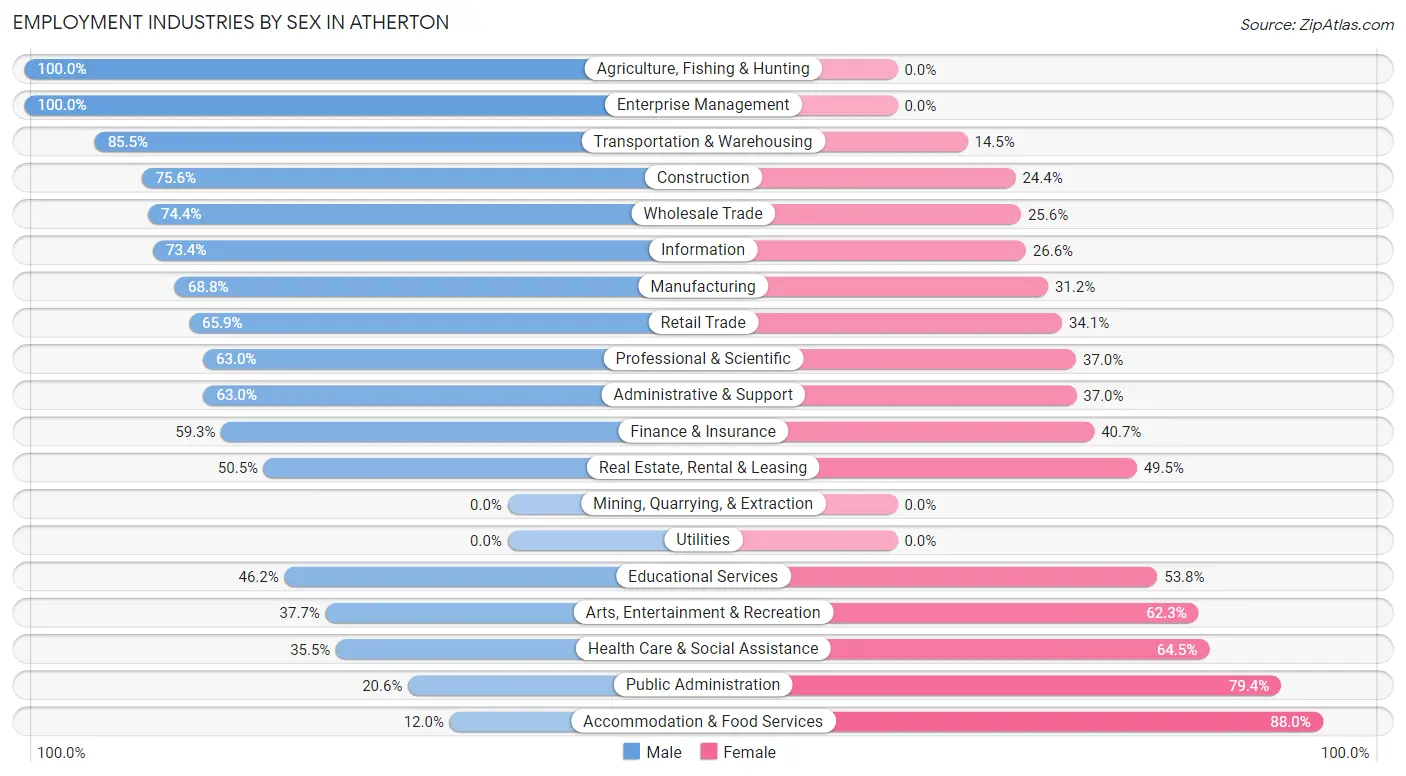
| Industry | Male | Female |
| Agriculture, Fishing & Hunting | 7 (100.0%) | 0 (0.0%) |
| Mining, Quarrying, & Extraction | 0 (0.0%) | 0 (0.0%) |
| Construction | 34 (75.6%) | 11 (24.4%) |
| Manufacturing | 212 (68.8%) | 96 (31.2%) |
| Wholesale Trade | 32 (74.4%) | 11 (25.6%) |
| Retail Trade | 60 (65.9%) | 31 (34.1%) |
| Transportation & Warehousing | 53 (85.5%) | 9 (14.5%) |
| Utilities | 0 (0.0%) | 0 (0.0%) |
| Information | 138 (73.4%) | 50 (26.6%) |
| Finance & Insurance | 227 (59.3%) | 156 (40.7%) |
| Real Estate, Rental & Leasing | 108 (50.5%) | 106 (49.5%) |
| Professional & Scientific | 404 (63.0%) | 237 (37.0%) |
| Enterprise Management | 4 (100.0%) | 0 (0.0%) |
| Administrative & Support | 51 (63.0%) | 30 (37.0%) |
| Educational Services | 158 (46.2%) | 184 (53.8%) |
| Health Care & Social Assistance | 93 (35.5%) | 169 (64.5%) |
| Arts, Entertainment & Recreation | 49 (37.7%) | 81 (62.3%) |
| Accommodation & Food Services | 9 (12.0%) | 66 (88.0%) |
| Public Administration | 7 (20.6%) | 27 (79.4%) |
| Total | 1,663 (55.9%) | 1,311 (44.1%) |
Education in Atherton
School Enrollment in Atherton
The most common levels of schooling among the 2,422 students in Atherton are college / undergraduate (833 | 34.4%), high school (633 | 26.1%), and middle school (455 | 18.8%).
| School Level | # Students | % Students |
| Nursery / Preschool | 83 | 3.4% |
| Kindergarten | 34 | 1.4% |
| Elementary School | 265 | 10.9% |
| Middle School | 455 | 18.8% |
| High School | 633 | 26.1% |
| College / Undergraduate | 833 | 34.4% |
| Graduate / Professional | 119 | 4.9% |
| Total | 2,422 | 100.0% |
School Enrollment by Age by Funding Source in Atherton
Out of a total of 2,422 students who are enrolled in schools in Atherton, 1,710 (70.6%) attend a private institution, while the remaining 712 (29.4%) are enrolled in public schools. The age group of 18 to 19 year olds has the highest likelihood of being enrolled in private schools, with 343 (83.1% in the age bracket) enrolled. Conversely, the age group of 5 to 9 year old has the lowest likelihood of being enrolled in a private school, with 122 (55.7% in the age bracket) attending a public institution.
| Age Bracket | Public School | Private School |
| 3 to 4 Year Olds | 15 (19.7%) | 61 (80.3%) |
| 5 to 9 Year Old | 122 (55.7%) | 97 (44.3%) |
| 10 to 14 Year Olds | 214 (33.6%) | 423 (66.4%) |
| 15 to 17 Year Olds | 101 (23.3%) | 332 (76.7%) |
| 18 to 19 Year Olds | 70 (17.0%) | 343 (83.1%) |
| 20 to 24 Year Olds | 131 (26.0%) | 372 (74.0%) |
| 25 to 34 Year Olds | 16 (29.6%) | 38 (70.4%) |
| 35 Years and over | 44 (50.6%) | 43 (49.4%) |
| Total | 712 (29.4%) | 1,710 (70.6%) |
Educational Attainment by Field of Study in Atherton
Social sciences (685 | 15.7%), engineering (635 | 14.5%), business (517 | 11.8%), literature & languages (354 | 8.1%), and liberal arts & history (340 | 7.8%) are the most common fields of study among 4,363 individuals in Atherton who have obtained a bachelor's degree or higher.
| Field of Study | # Graduates | % Graduates |
| Computers & Mathematics | 255 | 5.8% |
| Bio, Nature & Agricultural | 271 | 6.2% |
| Physical & Health Sciences | 295 | 6.8% |
| Psychology | 103 | 2.4% |
| Social Sciences | 685 | 15.7% |
| Engineering | 635 | 14.5% |
| Multidisciplinary Studies | 51 | 1.2% |
| Science & Technology | 159 | 3.6% |
| Business | 517 | 11.8% |
| Education | 111 | 2.5% |
| Literature & Languages | 354 | 8.1% |
| Liberal Arts & History | 340 | 7.8% |
| Visual & Performing Arts | 205 | 4.7% |
| Communications | 241 | 5.5% |
| Arts & Humanities | 141 | 3.2% |
| Total | 4,363 | 100.0% |
Transportation & Commute in Atherton
Vehicle Availability by Sex in Atherton
The most prevalent vehicle ownership categories in Atherton are males with 3 vehicles (662, accounting for 43.4%) and females with 3 vehicles (454, making up 58.5%).
| Vehicles Available | Male | Female |
| No Vehicle | 42 (2.8%) | 19 (1.7%) |
| 1 Vehicle | 52 (3.4%) | 57 (5.0%) |
| 2 Vehicles | 313 (20.5%) | 326 (28.8%) |
| 3 Vehicles | 662 (43.4%) | 454 (40.1%) |
| 4 Vehicles | 259 (17.0%) | 151 (13.4%) |
| 5 or more Vehicles | 196 (12.9%) | 124 (11.0%) |
| Total | 1,524 (100.0%) | 1,131 (100.0%) |
Commute Time in Atherton
The most frequently occuring commute durations in Atherton are 15 to 19 minutes (441 commuters, 24.3%), 10 to 14 minutes (410 commuters, 22.6%), and 20 to 24 minutes (232 commuters, 12.8%).
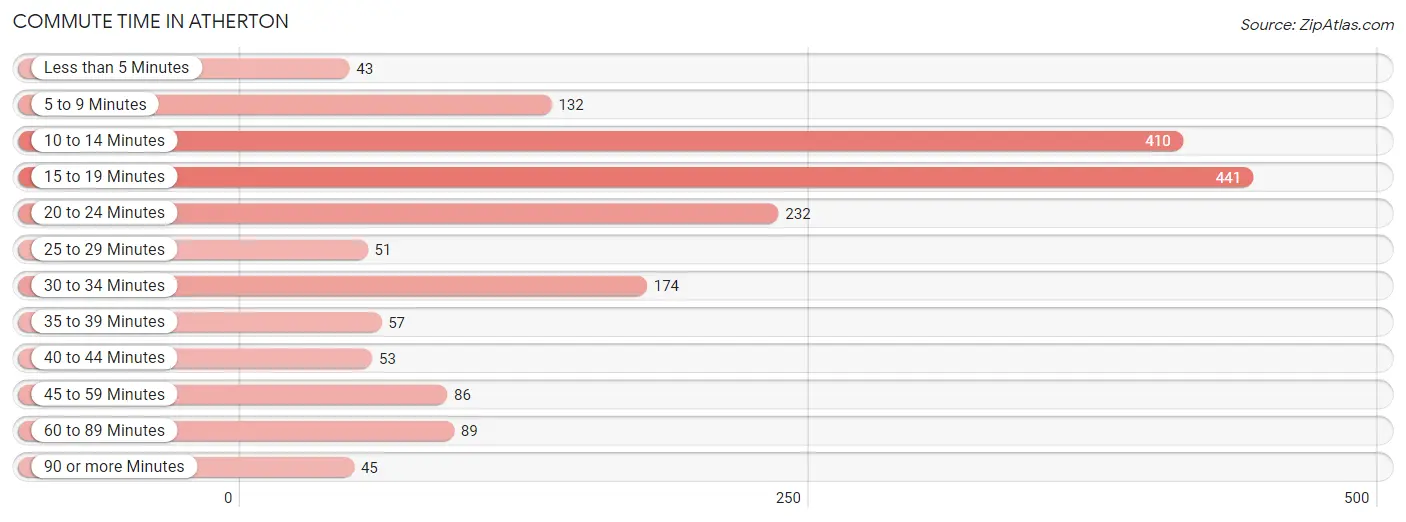
| Commute Time | # Commuters | % Commuters |
| Less than 5 Minutes | 43 | 2.4% |
| 5 to 9 Minutes | 132 | 7.3% |
| 10 to 14 Minutes | 410 | 22.6% |
| 15 to 19 Minutes | 441 | 24.3% |
| 20 to 24 Minutes | 232 | 12.8% |
| 25 to 29 Minutes | 51 | 2.8% |
| 30 to 34 Minutes | 174 | 9.6% |
| 35 to 39 Minutes | 57 | 3.1% |
| 40 to 44 Minutes | 53 | 2.9% |
| 45 to 59 Minutes | 86 | 4.7% |
| 60 to 89 Minutes | 89 | 4.9% |
| 90 or more Minutes | 45 | 2.5% |
Commute Time by Sex in Atherton
The most common commute times in Atherton are 15 to 19 minutes (302 commuters, 27.8%) for males and 10 to 14 minutes (167 commuters, 23.0%) for females.
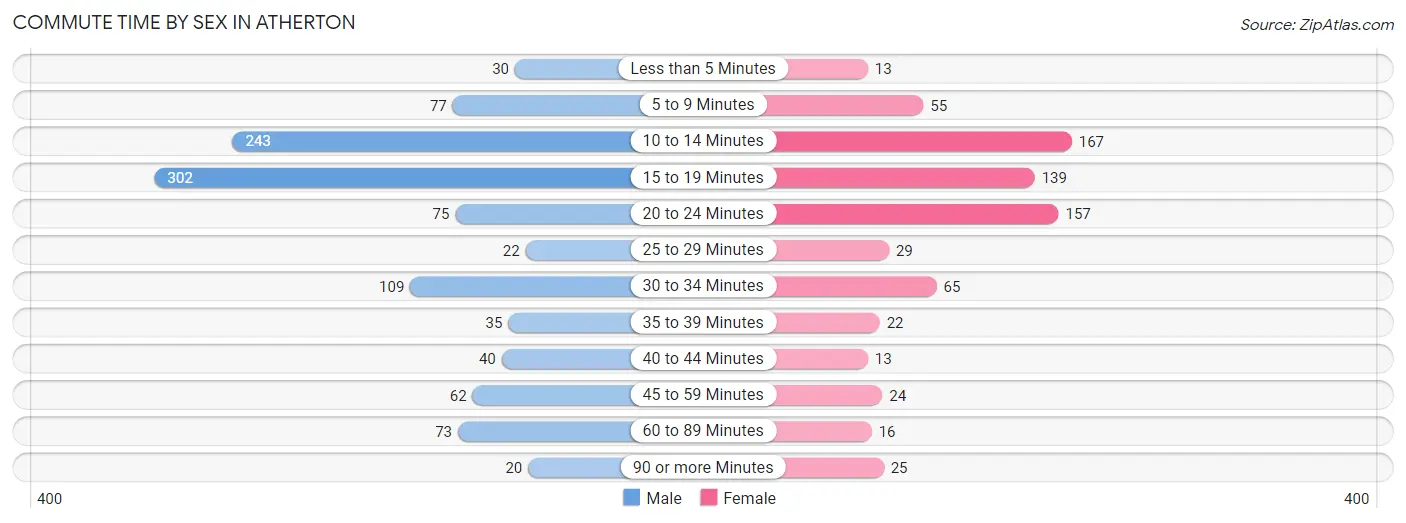
| Commute Time | Male | Female |
| Less than 5 Minutes | 30 (2.8%) | 13 (1.8%) |
| 5 to 9 Minutes | 77 (7.1%) | 55 (7.6%) |
| 10 to 14 Minutes | 243 (22.3%) | 167 (23.0%) |
| 15 to 19 Minutes | 302 (27.8%) | 139 (19.2%) |
| 20 to 24 Minutes | 75 (6.9%) | 157 (21.7%) |
| 25 to 29 Minutes | 22 (2.0%) | 29 (4.0%) |
| 30 to 34 Minutes | 109 (10.0%) | 65 (9.0%) |
| 35 to 39 Minutes | 35 (3.2%) | 22 (3.0%) |
| 40 to 44 Minutes | 40 (3.7%) | 13 (1.8%) |
| 45 to 59 Minutes | 62 (5.7%) | 24 (3.3%) |
| 60 to 89 Minutes | 73 (6.7%) | 16 (2.2%) |
| 90 or more Minutes | 20 (1.8%) | 25 (3.5%) |
Time of Departure to Work by Sex in Atherton
The most frequent times of departure to work in Atherton are 8:00 AM to 8:29 AM (270, 24.8%) for males and 8:00 AM to 8:29 AM (136, 18.8%) for females.
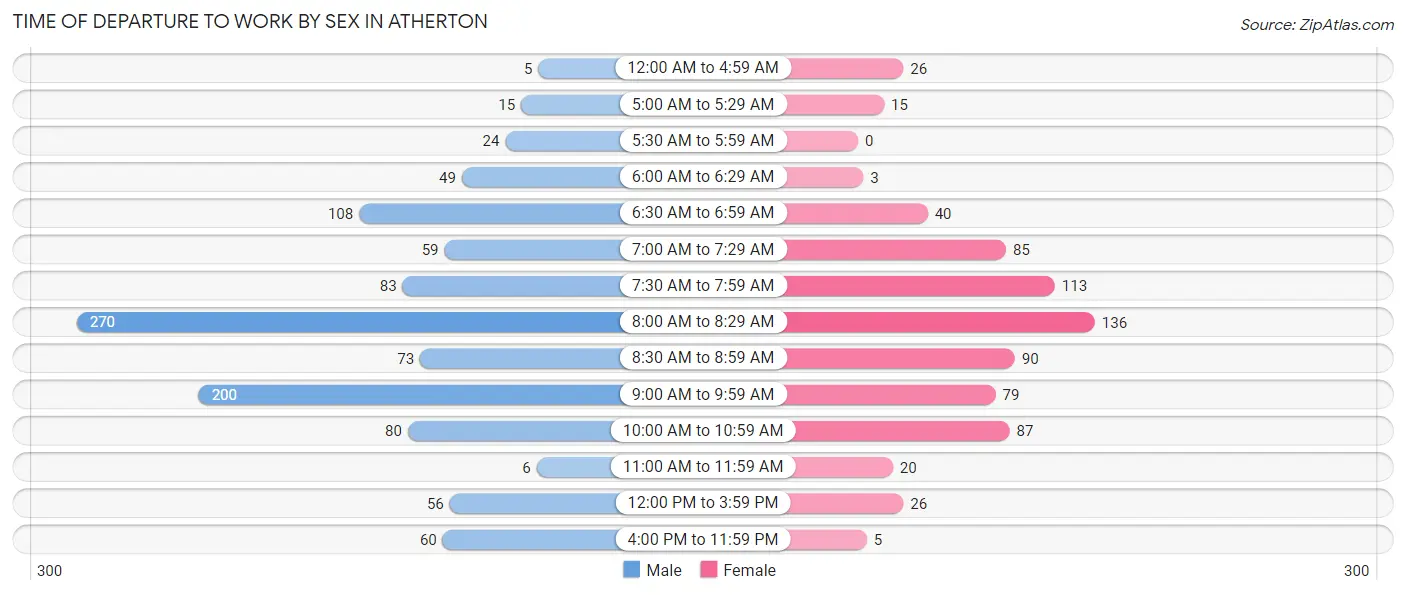
| Time of Departure | Male | Female |
| 12:00 AM to 4:59 AM | 5 (0.5%) | 26 (3.6%) |
| 5:00 AM to 5:29 AM | 15 (1.4%) | 15 (2.1%) |
| 5:30 AM to 5:59 AM | 24 (2.2%) | 0 (0.0%) |
| 6:00 AM to 6:29 AM | 49 (4.5%) | 3 (0.4%) |
| 6:30 AM to 6:59 AM | 108 (9.9%) | 40 (5.5%) |
| 7:00 AM to 7:29 AM | 59 (5.4%) | 85 (11.7%) |
| 7:30 AM to 7:59 AM | 83 (7.6%) | 113 (15.6%) |
| 8:00 AM to 8:29 AM | 270 (24.8%) | 136 (18.8%) |
| 8:30 AM to 8:59 AM | 73 (6.7%) | 90 (12.4%) |
| 9:00 AM to 9:59 AM | 200 (18.4%) | 79 (10.9%) |
| 10:00 AM to 10:59 AM | 80 (7.3%) | 87 (12.0%) |
| 11:00 AM to 11:59 AM | 6 (0.5%) | 20 (2.8%) |
| 12:00 PM to 3:59 PM | 56 (5.1%) | 26 (3.6%) |
| 4:00 PM to 11:59 PM | 60 (5.5%) | 5 (0.7%) |
| Total | 1,088 (100.0%) | 725 (100.0%) |
Housing Occupancy in Atherton
Occupancy by Ownership in Atherton
Of the total 2,183 dwellings in Atherton, owner-occupied units account for 1,874 (85.9%), while renter-occupied units make up 309 (14.1%).
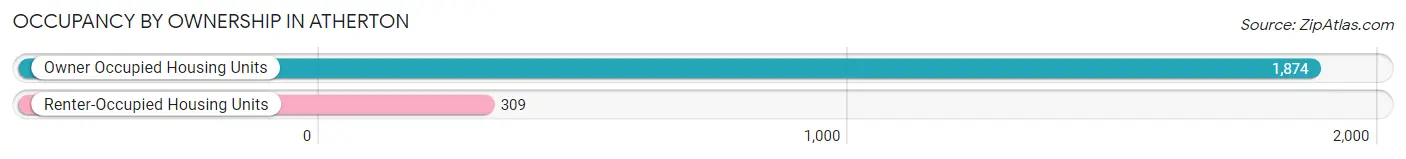
| Occupancy | # Housing Units | % Housing Units |
| Owner Occupied Housing Units | 1,874 | 85.9% |
| Renter-Occupied Housing Units | 309 | 14.1% |
| Total Occupied Housing Units | 2,183 | 100.0% |
Occupancy by Household Size in Atherton
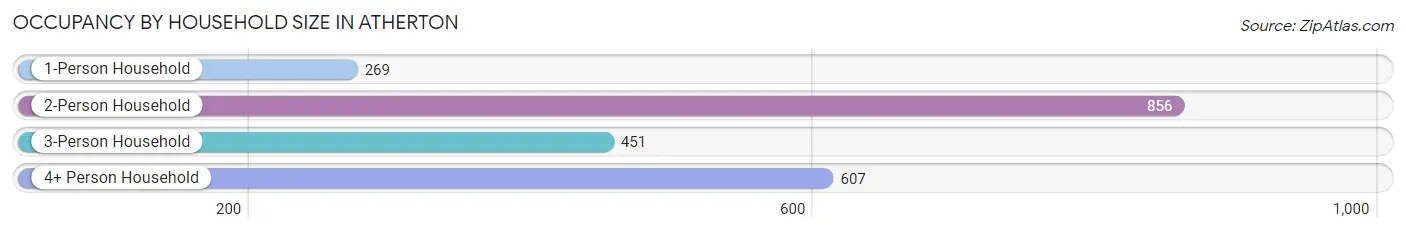
| Household Size | # Housing Units | % Housing Units |
| 1-Person Household | 269 | 12.3% |
| 2-Person Household | 856 | 39.2% |
| 3-Person Household | 451 | 20.7% |
| 4+ Person Household | 607 | 27.8% |
| Total Housing Units | 2,183 | 100.0% |
Occupancy by Ownership by Household Size in Atherton
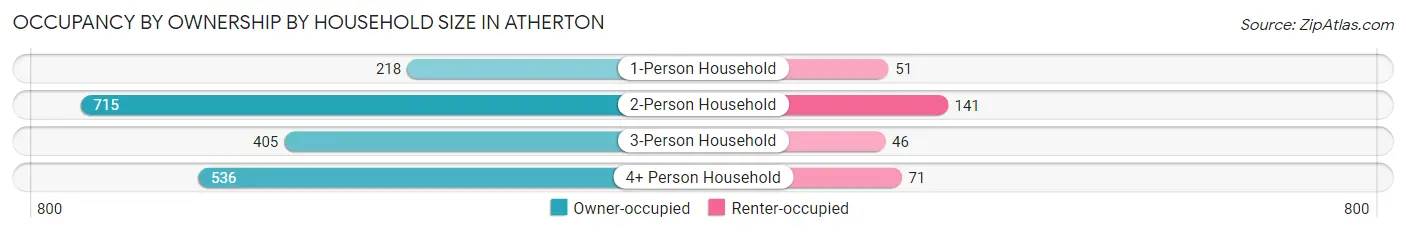
| Household Size | Owner-occupied | Renter-occupied |
| 1-Person Household | 218 (81.0%) | 51 (19.0%) |
| 2-Person Household | 715 (83.5%) | 141 (16.5%) |
| 3-Person Household | 405 (89.8%) | 46 (10.2%) |
| 4+ Person Household | 536 (88.3%) | 71 (11.7%) |
| Total Housing Units | 1,874 (85.9%) | 309 (14.1%) |
Occupancy by Educational Attainment in Atherton
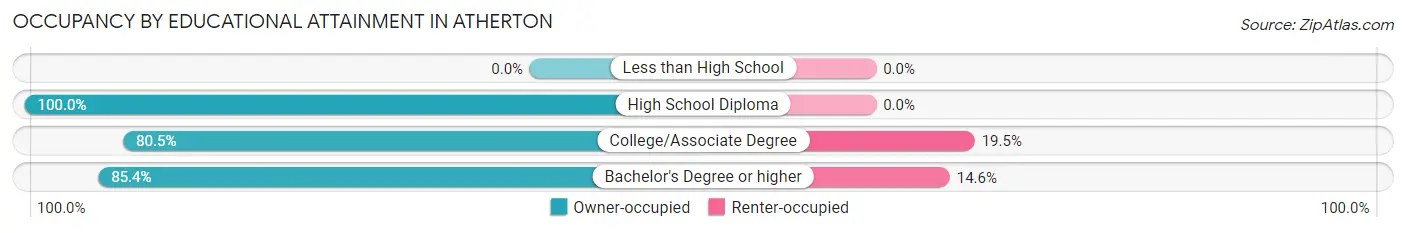
| Household Size | Owner-occupied | Renter-occupied |
| Less than High School | 0 (0.0%) | 0 (0.0%) |
| High School Diploma | 96 (100.0%) | 0 (0.0%) |
| College/Associate Degree | 70 (80.5%) | 17 (19.5%) |
| Bachelor's Degree or higher | 1,708 (85.4%) | 292 (14.6%) |
Occupancy by Age of Householder in Atherton
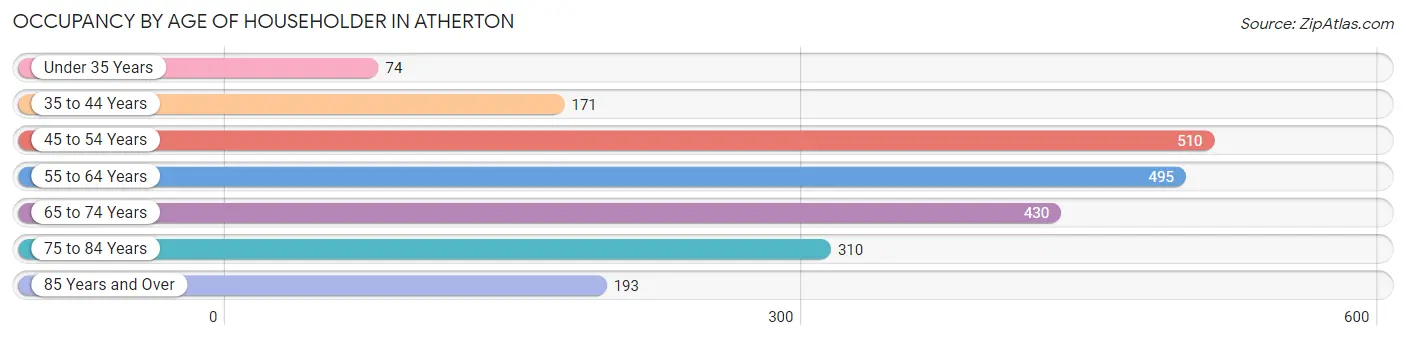
| Age Bracket | # Households | % Households |
| Under 35 Years | 74 | 3.4% |
| 35 to 44 Years | 171 | 7.8% |
| 45 to 54 Years | 510 | 23.4% |
| 55 to 64 Years | 495 | 22.7% |
| 65 to 74 Years | 430 | 19.7% |
| 75 to 84 Years | 310 | 14.2% |
| 85 Years and Over | 193 | 8.8% |
| Total | 2,183 | 100.0% |
Housing Finances in Atherton
Median Income by Occupancy in Atherton
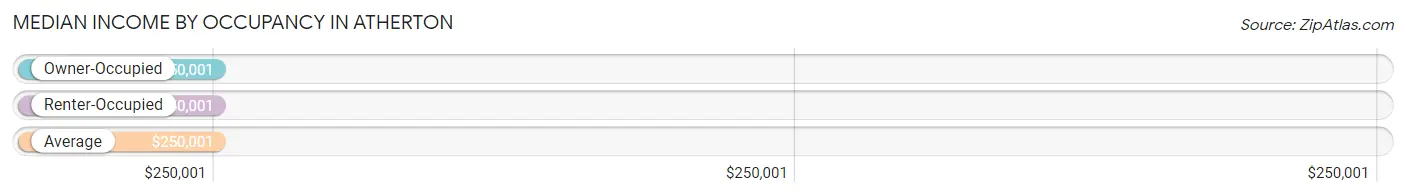
| Occupancy Type | # Households | Median Income |
| Owner-Occupied | 1,874 (85.9%) | $250,001 |
| Renter-Occupied | 309 (14.1%) | $250,001 |
| Average | 2,183 (100.0%) | $250,001 |
Occupancy by Householder Income Bracket in Atherton
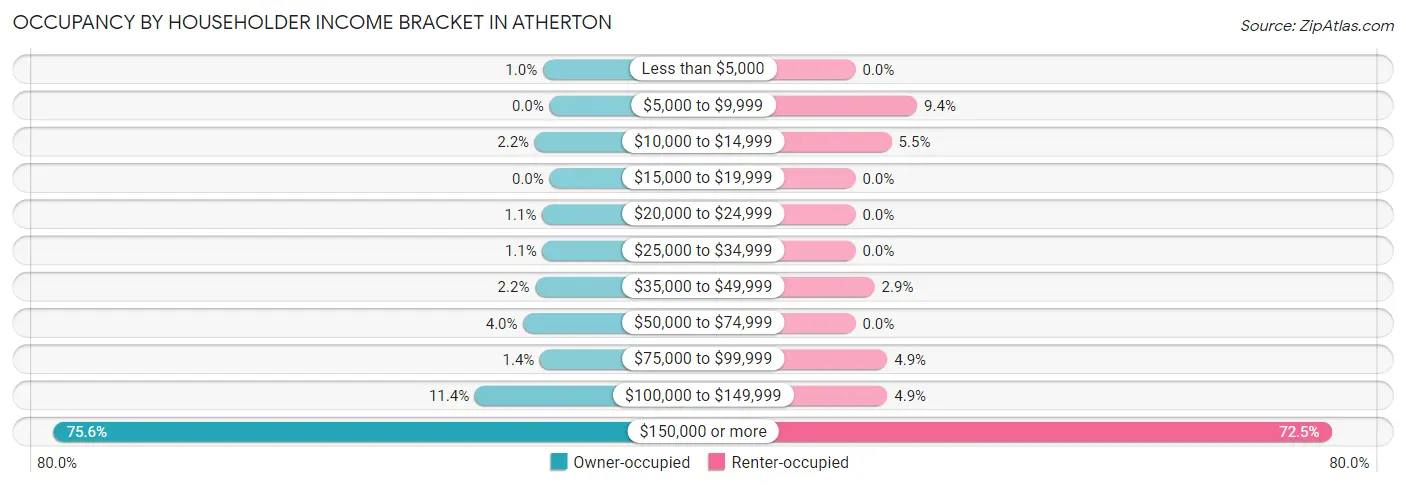
| Income Bracket | Owner-occupied | Renter-occupied |
| Less than $5,000 | 19 (1.0%) | 0 (0.0%) |
| $5,000 to $9,999 | 0 (0.0%) | 29 (9.4%) |
| $10,000 to $14,999 | 42 (2.2%) | 17 (5.5%) |
| $15,000 to $19,999 | 0 (0.0%) | 0 (0.0%) |
| $20,000 to $24,999 | 21 (1.1%) | 0 (0.0%) |
| $25,000 to $34,999 | 20 (1.1%) | 0 (0.0%) |
| $35,000 to $49,999 | 41 (2.2%) | 9 (2.9%) |
| $50,000 to $74,999 | 75 (4.0%) | 0 (0.0%) |
| $75,000 to $99,999 | 27 (1.4%) | 15 (4.9%) |
| $100,000 to $149,999 | 213 (11.4%) | 15 (4.9%) |
| $150,000 or more | 1,416 (75.6%) | 224 (72.5%) |
| Total | 1,874 (100.0%) | 309 (100.0%) |
Monthly Housing Cost Tiers in Atherton
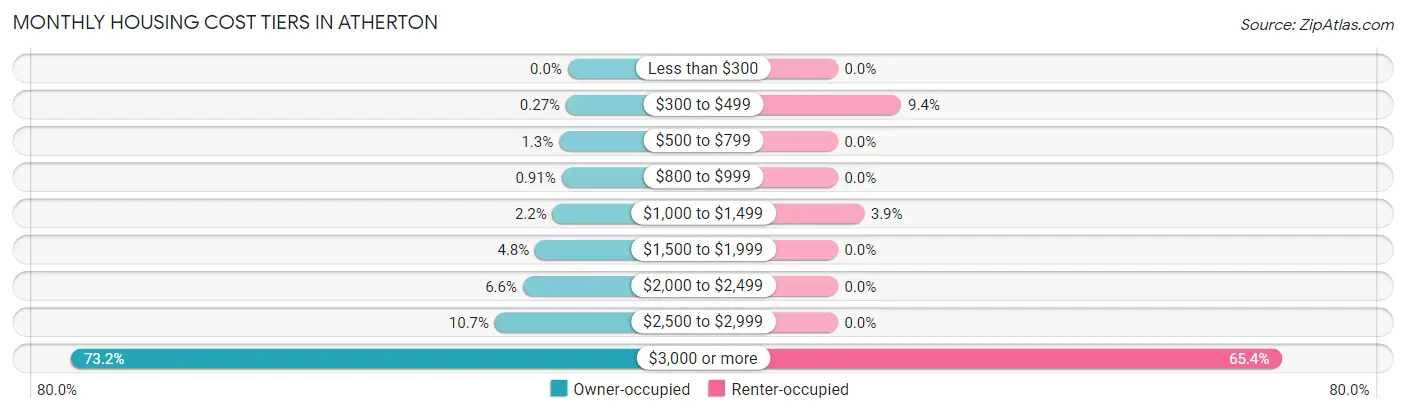
| Monthly Cost | Owner-occupied | Renter-occupied |
| Less than $300 | 0 (0.0%) | 0 (0.0%) |
| $300 to $499 | 5 (0.3%) | 29 (9.4%) |
| $500 to $799 | 24 (1.3%) | 0 (0.0%) |
| $800 to $999 | 17 (0.9%) | 0 (0.0%) |
| $1,000 to $1,499 | 42 (2.2%) | 12 (3.9%) |
| $1,500 to $1,999 | 90 (4.8%) | 0 (0.0%) |
| $2,000 to $2,499 | 124 (6.6%) | 0 (0.0%) |
| $2,500 to $2,999 | 201 (10.7%) | 0 (0.0%) |
| $3,000 or more | 1,371 (73.2%) | 202 (65.4%) |
| Total | 1,874 (100.0%) | 309 (100.0%) |
Physical Housing Characteristics in Atherton
Housing Structures in Atherton
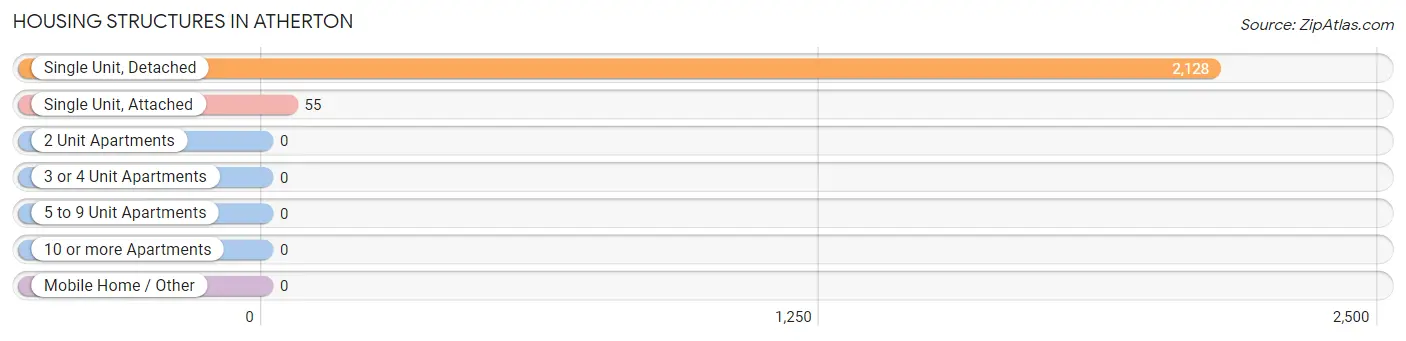
| Structure Type | # Housing Units | % Housing Units |
| Single Unit, Detached | 2,128 | 97.5% |
| Single Unit, Attached | 55 | 2.5% |
| 2 Unit Apartments | 0 | 0.0% |
| 3 or 4 Unit Apartments | 0 | 0.0% |
| 5 to 9 Unit Apartments | 0 | 0.0% |
| 10 or more Apartments | 0 | 0.0% |
| Mobile Home / Other | 0 | 0.0% |
| Total | 2,183 | 100.0% |
Housing Structures by Occupancy in Atherton
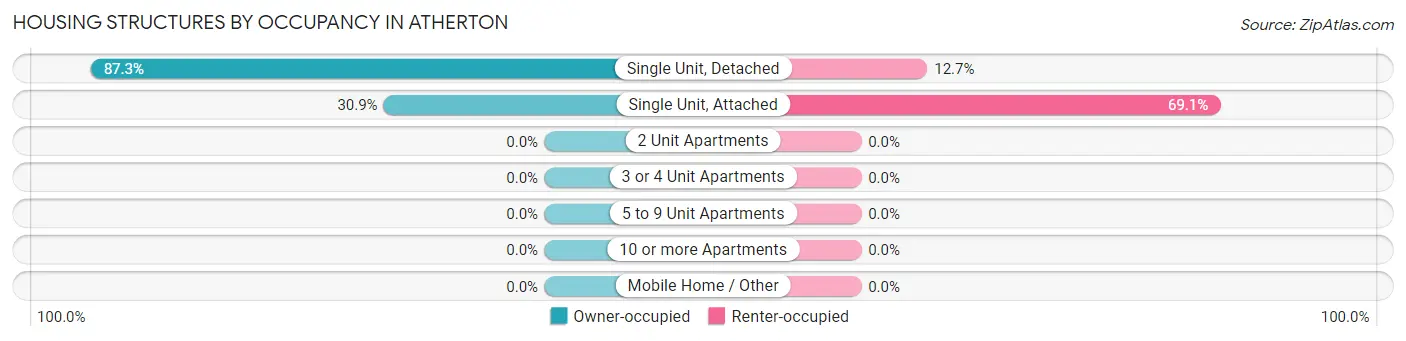
| Structure Type | Owner-occupied | Renter-occupied |
| Single Unit, Detached | 1,857 (87.3%) | 271 (12.7%) |
| Single Unit, Attached | 17 (30.9%) | 38 (69.1%) |
| 2 Unit Apartments | 0 (0.0%) | 0 (0.0%) |
| 3 or 4 Unit Apartments | 0 (0.0%) | 0 (0.0%) |
| 5 to 9 Unit Apartments | 0 (0.0%) | 0 (0.0%) |
| 10 or more Apartments | 0 (0.0%) | 0 (0.0%) |
| Mobile Home / Other | 0 (0.0%) | 0 (0.0%) |
| Total | 1,874 (85.9%) | 309 (14.1%) |
Housing Structures by Number of Rooms in Atherton
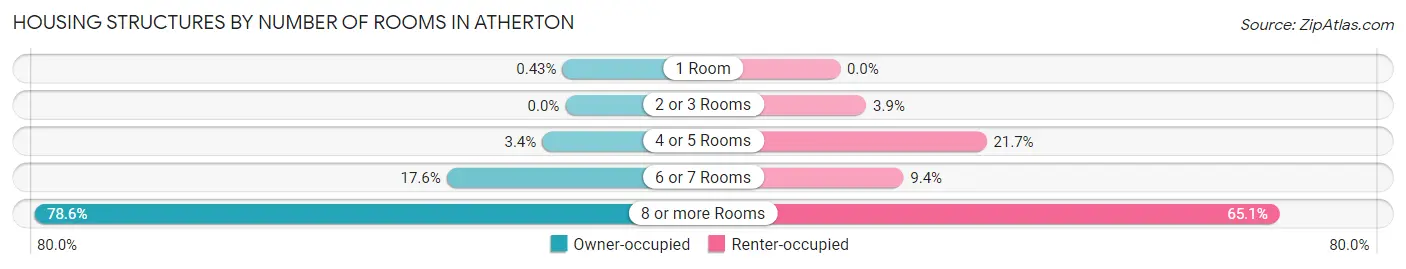
| Number of Rooms | Owner-occupied | Renter-occupied |
| 1 Room | 8 (0.4%) | 0 (0.0%) |
| 2 or 3 Rooms | 0 (0.0%) | 12 (3.9%) |
| 4 or 5 Rooms | 64 (3.4%) | 67 (21.7%) |
| 6 or 7 Rooms | 329 (17.6%) | 29 (9.4%) |
| 8 or more Rooms | 1,473 (78.6%) | 201 (65.0%) |
| Total | 1,874 (100.0%) | 309 (100.0%) |
Housing Structure by Heating Type in Atherton
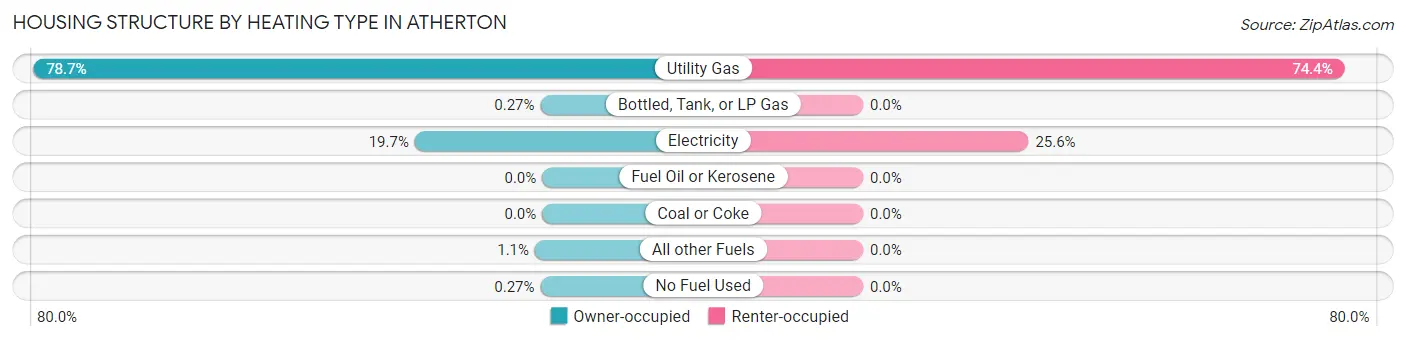
| Heating Type | Owner-occupied | Renter-occupied |
| Utility Gas | 1,474 (78.7%) | 230 (74.4%) |
| Bottled, Tank, or LP Gas | 5 (0.3%) | 0 (0.0%) |
| Electricity | 369 (19.7%) | 79 (25.6%) |
| Fuel Oil or Kerosene | 0 (0.0%) | 0 (0.0%) |
| Coal or Coke | 0 (0.0%) | 0 (0.0%) |
| All other Fuels | 21 (1.1%) | 0 (0.0%) |
| No Fuel Used | 5 (0.3%) | 0 (0.0%) |
| Total | 1,874 (100.0%) | 309 (100.0%) |
Household Vehicle Usage in Atherton
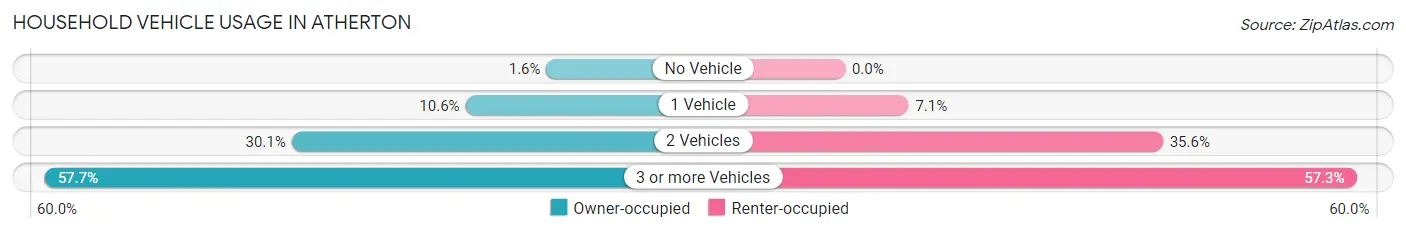
| Vehicles per Household | Owner-occupied | Renter-occupied |
| No Vehicle | 29 (1.5%) | 0 (0.0%) |
| 1 Vehicle | 199 (10.6%) | 22 (7.1%) |
| 2 Vehicles | 564 (30.1%) | 110 (35.6%) |
| 3 or more Vehicles | 1,082 (57.7%) | 177 (57.3%) |
| Total | 1,874 (100.0%) | 309 (100.0%) |
Real Estate & Mortgages in Atherton
Real Estate and Mortgage Overview in Atherton
| Characteristic | Without Mortgage | With Mortgage |
| Housing Units | 873 | 1,001 |
| Median Property Value | $2,000,001 | $2,000,001 |
| Median Household Income | $250,001 | $762 |
| Monthly Housing Costs | $1,501 | $929 |
| Real Estate Taxes | $10,001 | $3 |
Property Value by Mortgage Status in Atherton
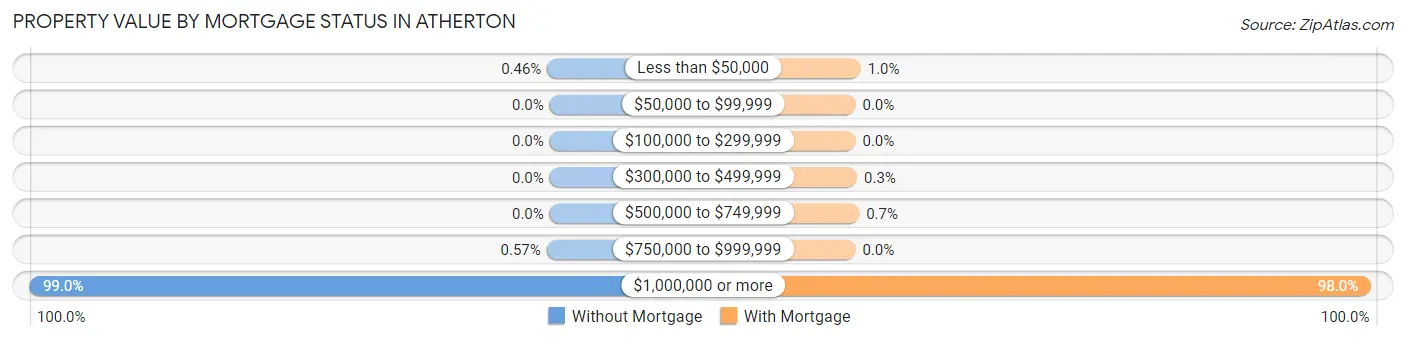
| Property Value | Without Mortgage | With Mortgage |
| Less than $50,000 | 4 (0.5%) | 10 (1.0%) |
| $50,000 to $99,999 | 0 (0.0%) | 0 (0.0%) |
| $100,000 to $299,999 | 0 (0.0%) | 0 (0.0%) |
| $300,000 to $499,999 | 0 (0.0%) | 3 (0.3%) |
| $500,000 to $749,999 | 0 (0.0%) | 7 (0.7%) |
| $750,000 to $999,999 | 5 (0.6%) | 0 (0.0%) |
| $1,000,000 or more | 864 (99.0%) | 981 (98.0%) |
| Total | 873 (100.0%) | 1,001 (100.0%) |
Household Income by Mortgage Status in Atherton
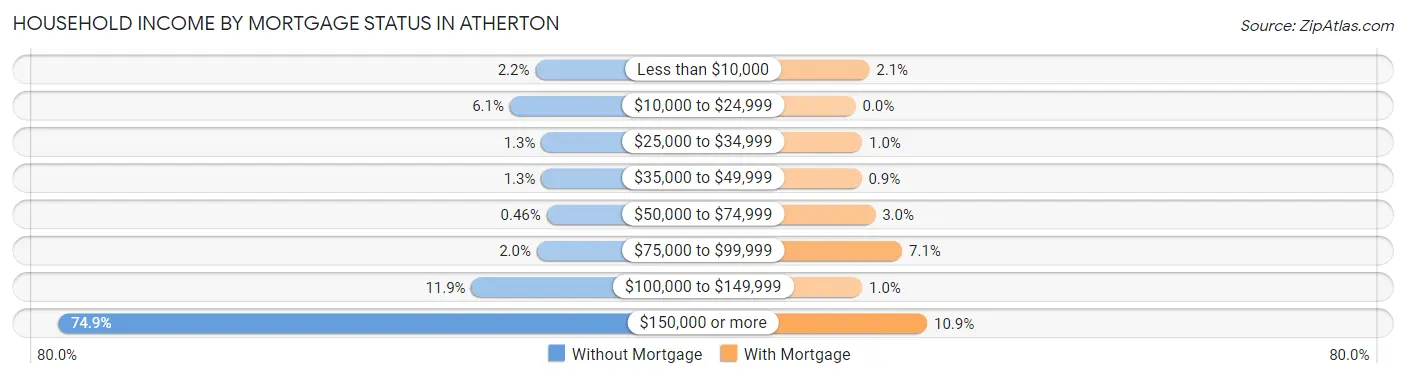
| Household Income | Without Mortgage | With Mortgage |
| Less than $10,000 | 19 (2.2%) | 21 (2.1%) |
| $10,000 to $24,999 | 53 (6.1%) | 0 (0.0%) |
| $25,000 to $34,999 | 11 (1.3%) | 10 (1.0%) |
| $35,000 to $49,999 | 11 (1.3%) | 9 (0.9%) |
| $50,000 to $74,999 | 4 (0.5%) | 30 (3.0%) |
| $75,000 to $99,999 | 17 (1.9%) | 71 (7.1%) |
| $100,000 to $149,999 | 104 (11.9%) | 10 (1.0%) |
| $150,000 or more | 654 (74.9%) | 109 (10.9%) |
| Total | 873 (100.0%) | 1,001 (100.0%) |
Property Value to Household Income Ratio in Atherton
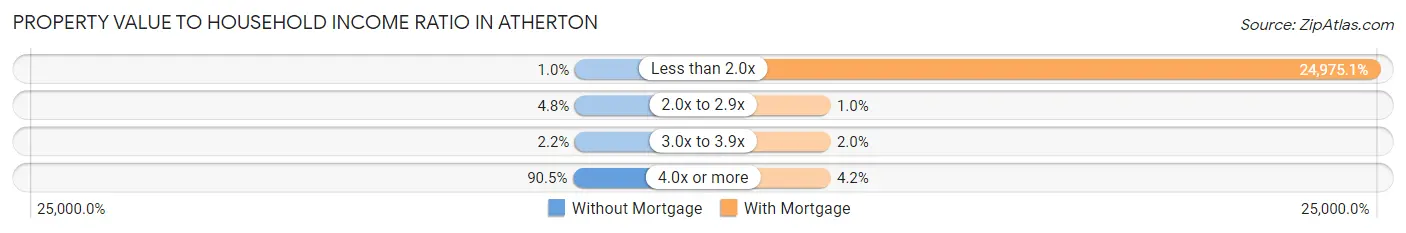
| Value-to-Income Ratio | Without Mortgage | With Mortgage |
| Less than 2.0x | 9 (1.0%) | 250,001 (24,975.1%) |
| 2.0x to 2.9x | 42 (4.8%) | 10 (1.0%) |
| 3.0x to 3.9x | 19 (2.2%) | 20 (2.0%) |
| 4.0x or more | 790 (90.5%) | 42 (4.2%) |
| Total | 873 (100.0%) | 1,001 (100.0%) |
Real Estate Taxes by Mortgage Status in Atherton
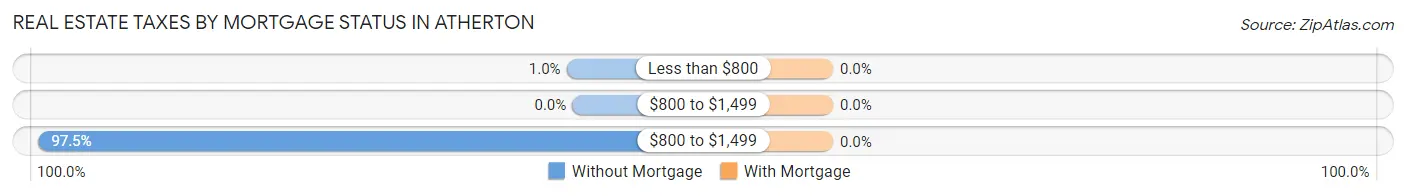
| Property Taxes | Without Mortgage | With Mortgage |
| Less than $800 | 9 (1.0%) | 0 (0.0%) |
| $800 to $1,499 | 0 (0.0%) | 0 (0.0%) |
| $800 to $1,499 | 851 (97.5%) | 0 (0.0%) |
| Total | 873 (100.0%) | 1,001 (100.0%) |
Health & Disability in Atherton
Health Insurance Coverage by Age in Atherton
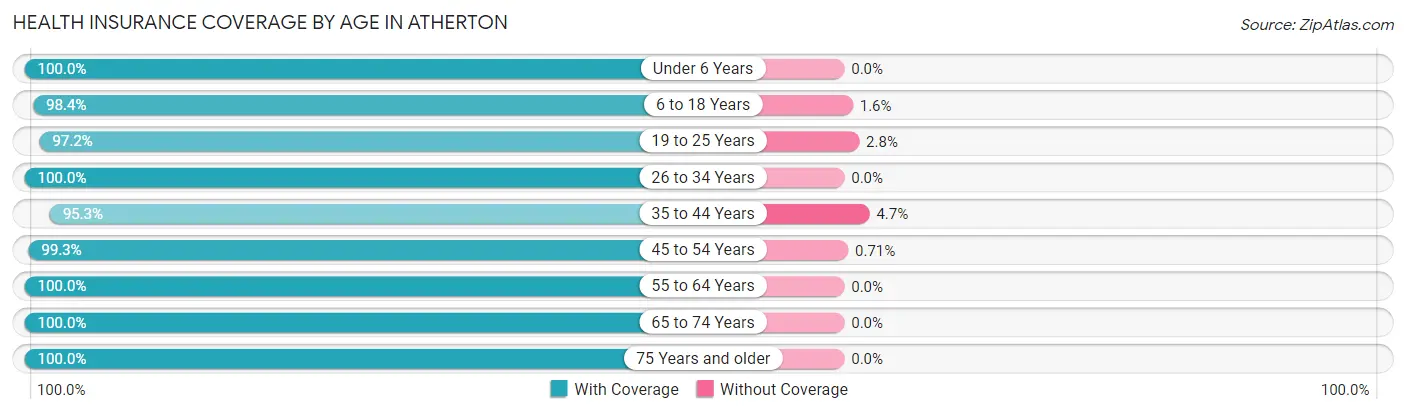
| Age Bracket | With Coverage | Without Coverage |
| Under 6 Years | 149 (100.0%) | 0 (0.0%) |
| 6 to 18 Years | 1,499 (98.4%) | 24 (1.6%) |
| 19 to 25 Years | 807 (97.2%) | 23 (2.8%) |
| 26 to 34 Years | 486 (100.0%) | 0 (0.0%) |
| 35 to 44 Years | 467 (95.3%) | 23 (4.7%) |
| 45 to 54 Years | 974 (99.3%) | 7 (0.7%) |
| 55 to 64 Years | 963 (100.0%) | 0 (0.0%) |
| 65 to 74 Years | 885 (100.0%) | 0 (0.0%) |
| 75 Years and older | 817 (100.0%) | 0 (0.0%) |
| Total | 7,047 (98.9%) | 77 (1.1%) |
Health Insurance Coverage by Citizenship Status in Atherton
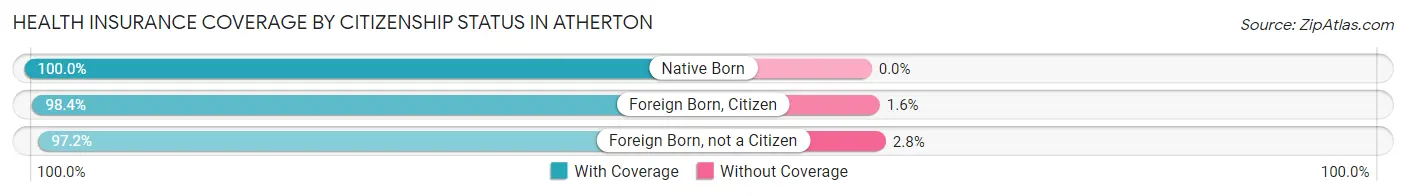
| Citizenship Status | With Coverage | Without Coverage |
| Native Born | 149 (100.0%) | 0 (0.0%) |
| Foreign Born, Citizen | 1,499 (98.4%) | 24 (1.6%) |
| Foreign Born, not a Citizen | 807 (97.2%) | 23 (2.8%) |
Health Insurance Coverage by Household Income in Atherton
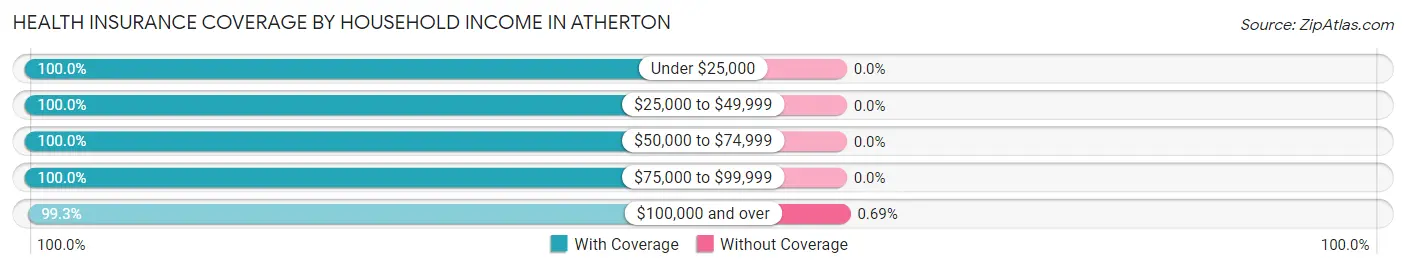
| Household Income | With Coverage | Without Coverage |
| Under $25,000 | 157 (100.0%) | 0 (0.0%) |
| $25,000 to $49,999 | 173 (100.0%) | 0 (0.0%) |
| $50,000 to $74,999 | 255 (100.0%) | 0 (0.0%) |
| $75,000 to $99,999 | 136 (100.0%) | 0 (0.0%) |
| $100,000 and over | 5,731 (99.3%) | 40 (0.7%) |
Public vs Private Health Insurance Coverage by Age in Atherton
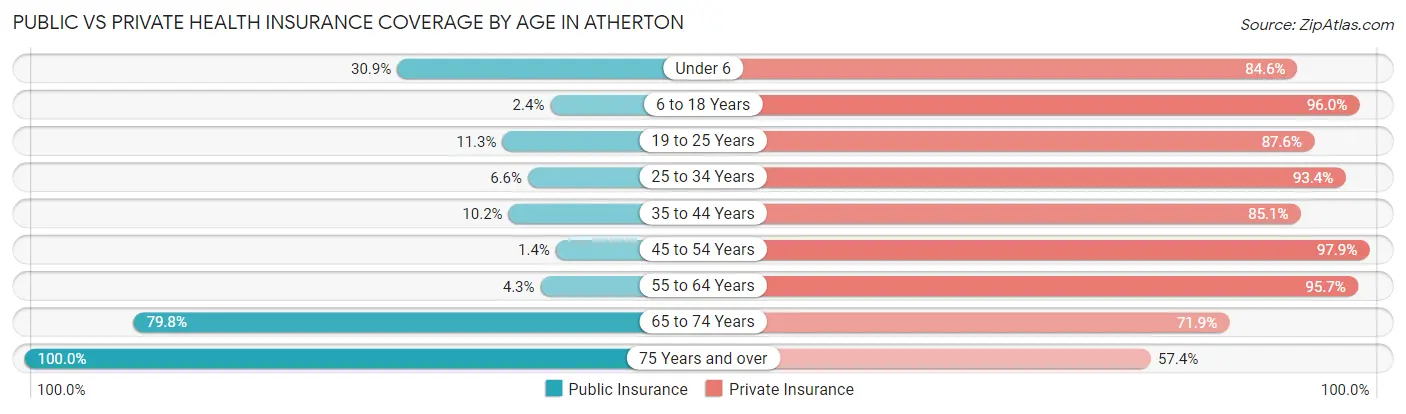
| Age Bracket | Public Insurance | Private Insurance |
| Under 6 | 46 (30.9%) | 126 (84.6%) |
| 6 to 18 Years | 37 (2.4%) | 1,462 (96.0%) |
| 19 to 25 Years | 94 (11.3%) | 727 (87.6%) |
| 25 to 34 Years | 32 (6.6%) | 454 (93.4%) |
| 35 to 44 Years | 50 (10.2%) | 417 (85.1%) |
| 45 to 54 Years | 14 (1.4%) | 960 (97.9%) |
| 55 to 64 Years | 41 (4.3%) | 922 (95.7%) |
| 65 to 74 Years | 706 (79.8%) | 636 (71.9%) |
| 75 Years and over | 817 (100.0%) | 469 (57.4%) |
| Total | 1,837 (25.8%) | 6,173 (86.7%) |
Disability Status by Sex by Age in Atherton
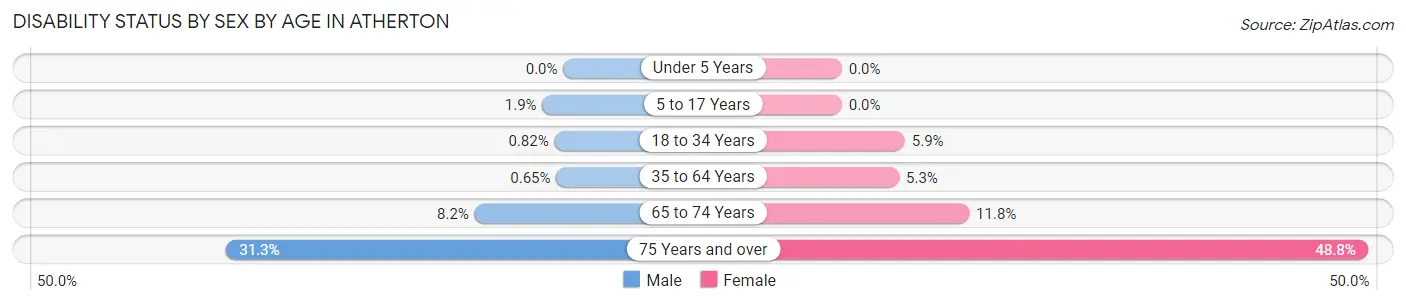
| Age Bracket | Male | Female |
| Under 5 Years | 0 (0.0%) | 0 (0.0%) |
| 5 to 17 Years | 14 (1.9%) | 0 (0.0%) |
| 18 to 34 Years | 7 (0.8%) | 42 (5.9%) |
| 35 to 64 Years | 7 (0.6%) | 72 (5.3%) |
| 65 to 74 Years | 38 (8.2%) | 50 (11.8%) |
| 75 Years and over | 112 (31.3%) | 224 (48.8%) |
Disability Class by Sex by Age in Atherton
Disability Class: Hearing Difficulty
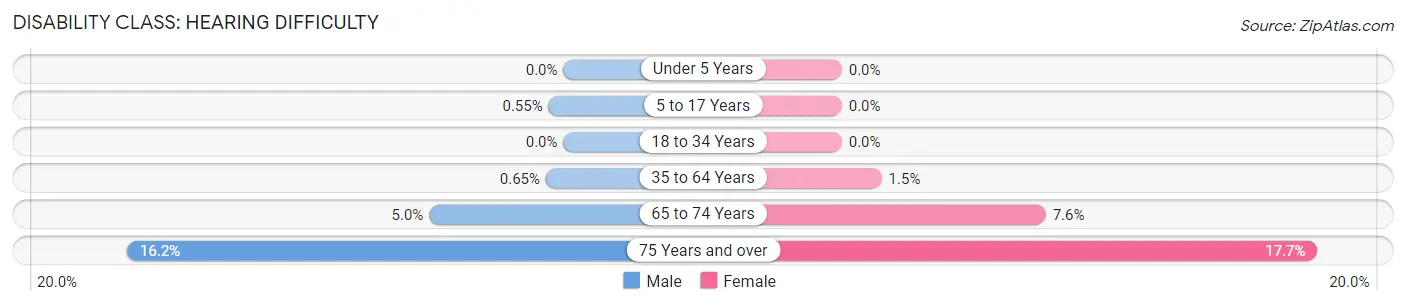
| Age Bracket | Male | Female |
| Under 5 Years | 0 (0.0%) | 0 (0.0%) |
| 5 to 17 Years | 4 (0.5%) | 0 (0.0%) |
| 18 to 34 Years | 0 (0.0%) | 0 (0.0%) |
| 35 to 64 Years | 7 (0.6%) | 20 (1.5%) |
| 65 to 74 Years | 23 (5.0%) | 32 (7.6%) |
| 75 Years and over | 58 (16.2%) | 81 (17.6%) |
Disability Class: Vision Difficulty
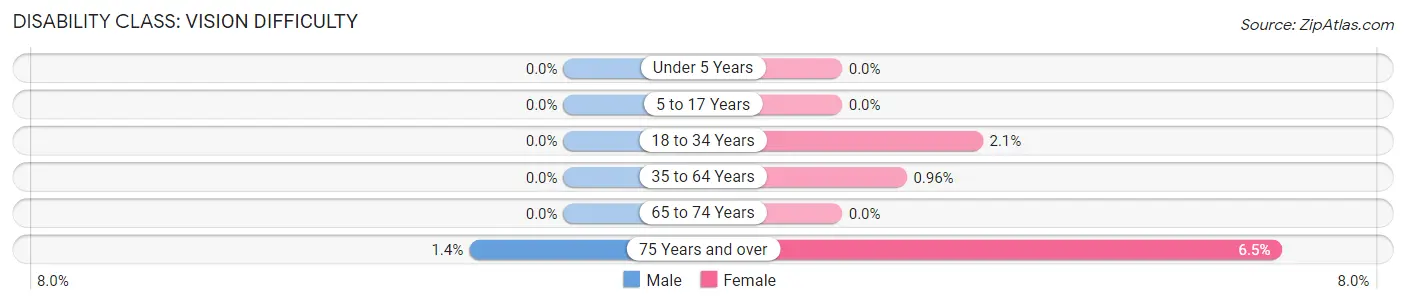
| Age Bracket | Male | Female |
| Under 5 Years | 0 (0.0%) | 0 (0.0%) |
| 5 to 17 Years | 0 (0.0%) | 0 (0.0%) |
| 18 to 34 Years | 0 (0.0%) | 15 (2.1%) |
| 35 to 64 Years | 0 (0.0%) | 13 (1.0%) |
| 65 to 74 Years | 0 (0.0%) | 0 (0.0%) |
| 75 Years and over | 5 (1.4%) | 30 (6.5%) |
Disability Class: Cognitive Difficulty
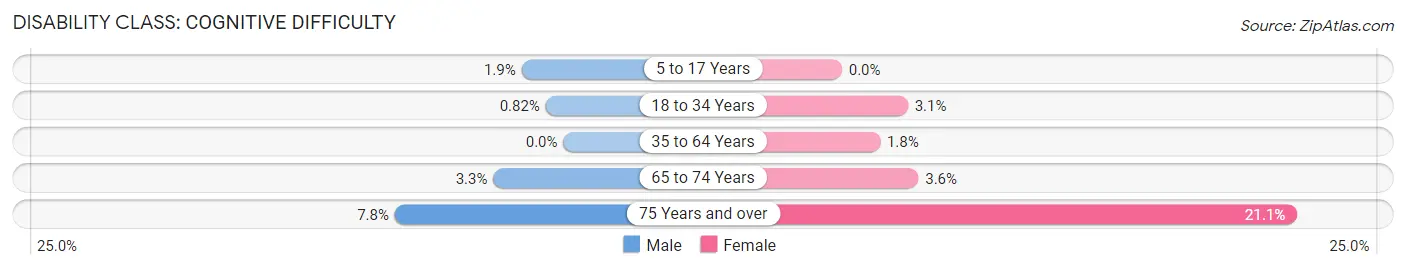
| Age Bracket | Male | Female |
| 5 to 17 Years | 14 (1.9%) | 0 (0.0%) |
| 18 to 34 Years | 7 (0.8%) | 22 (3.1%) |
| 35 to 64 Years | 0 (0.0%) | 24 (1.8%) |
| 65 to 74 Years | 15 (3.3%) | 15 (3.5%) |
| 75 Years and over | 28 (7.8%) | 97 (21.1%) |
Disability Class: Ambulatory Difficulty
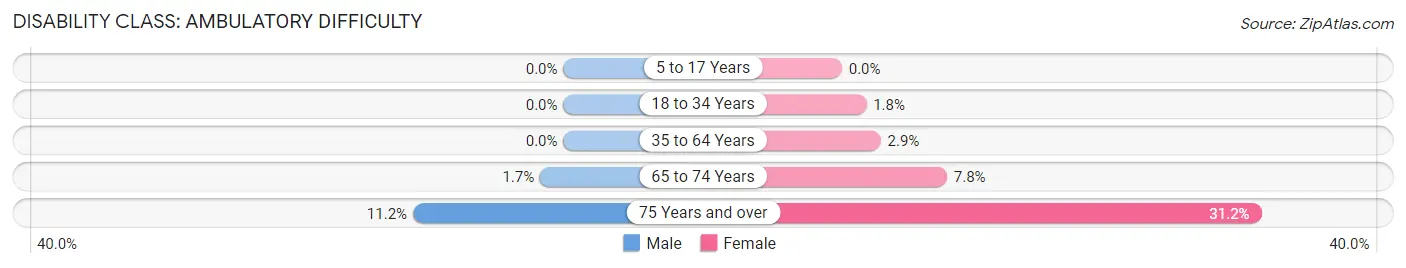
| Age Bracket | Male | Female |
| 5 to 17 Years | 0 (0.0%) | 0 (0.0%) |
| 18 to 34 Years | 0 (0.0%) | 13 (1.8%) |
| 35 to 64 Years | 0 (0.0%) | 39 (2.9%) |
| 65 to 74 Years | 8 (1.7%) | 33 (7.8%) |
| 75 Years and over | 40 (11.2%) | 143 (31.1%) |
Disability Class: Self-Care Difficulty
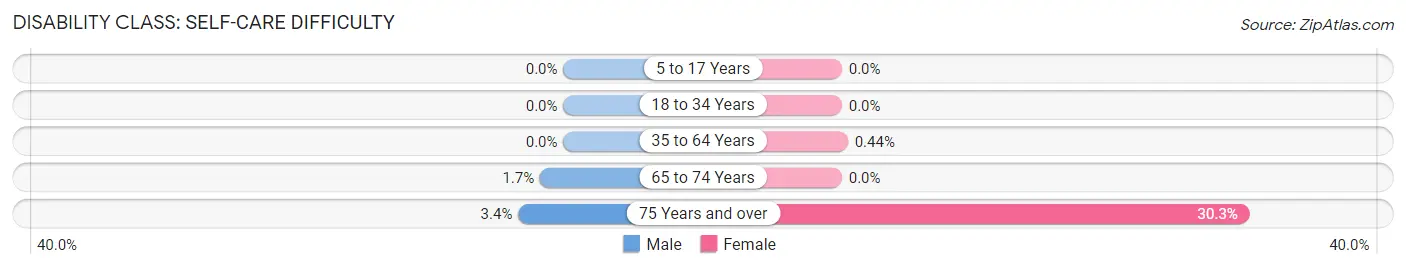
| Age Bracket | Male | Female |
| 5 to 17 Years | 0 (0.0%) | 0 (0.0%) |
| 18 to 34 Years | 0 (0.0%) | 0 (0.0%) |
| 35 to 64 Years | 0 (0.0%) | 6 (0.4%) |
| 65 to 74 Years | 8 (1.7%) | 0 (0.0%) |
| 75 Years and over | 12 (3.4%) | 139 (30.3%) |
Technology Access in Atherton
Computing Device Access in Atherton
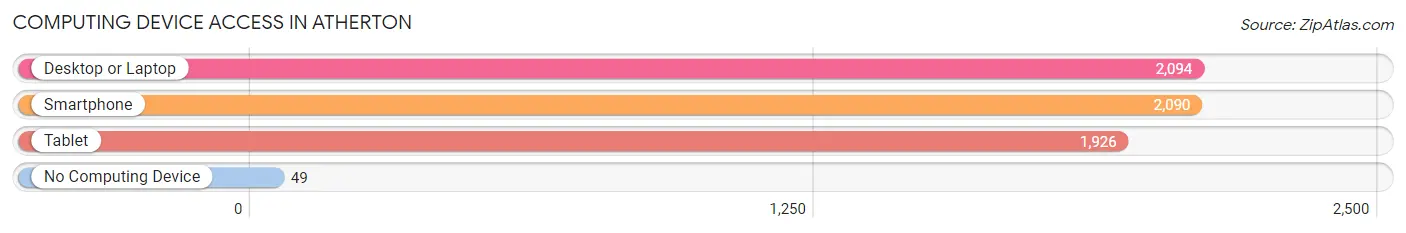
| Device Type | # Households | % Households |
| Desktop or Laptop | 2,094 | 95.9% |
| Smartphone | 2,090 | 95.7% |
| Tablet | 1,926 | 88.2% |
| No Computing Device | 49 | 2.2% |
| Total | 2,183 | 100.0% |
Internet Access in Atherton
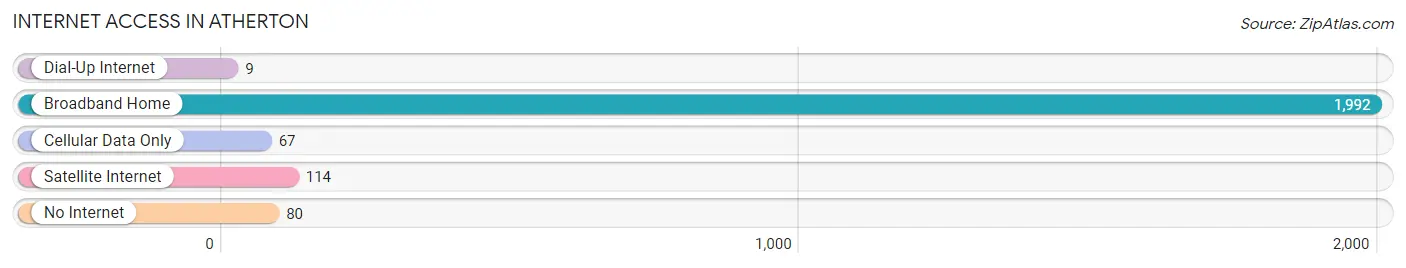
| Internet Type | # Households | % Households |
| Dial-Up Internet | 9 | 0.4% |
| Broadband Home | 1,992 | 91.2% |
| Cellular Data Only | 67 | 3.1% |
| Satellite Internet | 114 | 5.2% |
| No Internet | 80 | 3.7% |
| Total | 2,183 | 100.0% |
Atherton Summary
Atherton, California is a small town located in San Mateo County, in the San Francisco Bay Area. It is bordered by Menlo Park, Redwood City, and Woodside. Atherton is known for its large estates and is one of the wealthiest towns in the United States.
History
Atherton was originally part of the Rancho de las Pulgas, a Mexican land grant given to the Arguello family in 1839. In 1848, the land was sold to Faxon Atherton, a wealthy San Francisco lawyer. Atherton was incorporated in 1923 and was named after Faxon Atherton.
Geography
Atherton is located in the San Francisco Bay Area, in San Mateo County. It is bordered by Menlo Park, Redwood City, and Woodside. The town covers an area of 5.4 square miles and has a population of 7,159 people, as of the 2010 census.
The town is located in a hilly region, with elevations ranging from sea level to over 500 feet. The town is located in a temperate climate, with mild winters and warm summers.
Economy
Atherton is known for its large estates and is one of the wealthiest towns in the United States. The median household income in Atherton is $250,000, and the median home value is $3.5 million.
The town is home to several large companies, including Oracle Corporation, Facebook, and Google. The town is also home to several venture capital firms, such as Kleiner Perkins Caufield & Byers and Sequoia Capital.
Demographics
As of the 2010 census, Atherton had a population of 7,159 people. The racial makeup of the town was 79.2% White, 0.7% African American, 0.2% Native American, 15.2% Asian, 0.1% Pacific Islander, 0.7% from other races, and 3.9% from two or more races. Hispanic or Latino of any race were 4.3% of the population.
The median age in Atherton was 44.2 years, and the median household income was $250,000. The median home value was $3.5 million. The town had a low poverty rate of 2.3%.
Conclusion
Atherton, California is a small town located in San Mateo County, in the San Francisco Bay Area. It is bordered by Menlo Park, Redwood City, and Woodside. Atherton is known for its large estates and is one of the wealthiest towns in the United States. The town has a population of 7,159 people, as of the 2010 census, and has a median household income of $250,000. The town is home to several large companies, including Oracle Corporation, Facebook, and Google. Atherton is a desirable place to live, with its temperate climate, mild winters, and warm summers.
Common Questions
What is Per Capita Income in Atherton?
Per Capita income in Atherton is $186,810.
What is the Median Family Income in Atherton?
Median Family Income in Atherton is $250,001.
What is the Median Household income in Atherton?
Median Household Income in Atherton is $250,001.
What is Income or Wage Gap in Atherton?
Income or Wage Gap in Atherton is 40.4%.
Women in Atherton earn 59.6 cents for every dollar earned by a man.
What is Inequality or Gini Index in Atherton?
Inequality or Gini Index in Atherton is 0.51.
What is the Total Population of Atherton?
Total Population of Atherton is 7,124.
What is the Total Male Population of Atherton?
Total Male Population of Atherton is 3,560.
What is the Total Female Population of Atherton?
Total Female Population of Atherton is 3,564.
What is the Ratio of Males per 100 Females in Atherton?
There are 99.89 Males per 100 Females in Atherton.
What is the Ratio of Females per 100 Males in Atherton?
There are 100.11 Females per 100 Males in Atherton.
What is the Median Population Age in Atherton?
Median Population Age in Atherton is 46.2 Years.
What is the Average Family Size in Atherton
Average Family Size in Atherton is 3.2 People.
What is the Average Household Size in Atherton
Average Household Size in Atherton is 3.0 People.
How Large is the Labor Force in Atherton?
There are 3,044 People in the Labor Forcein in Atherton.
What is the Percentage of People in the Labor Force in Atherton?
50.8% of People are in the Labor Force in Atherton.
What is the Unemployment Rate in Atherton?
Unemployment Rate in Atherton is 2.2%.