Cities with the Highest Percentage of Population Employed in Architecture & Engineering in the United States
RELATED REPORTS & OPTIONS
Architecture & Engineering
United States
Compare Cities
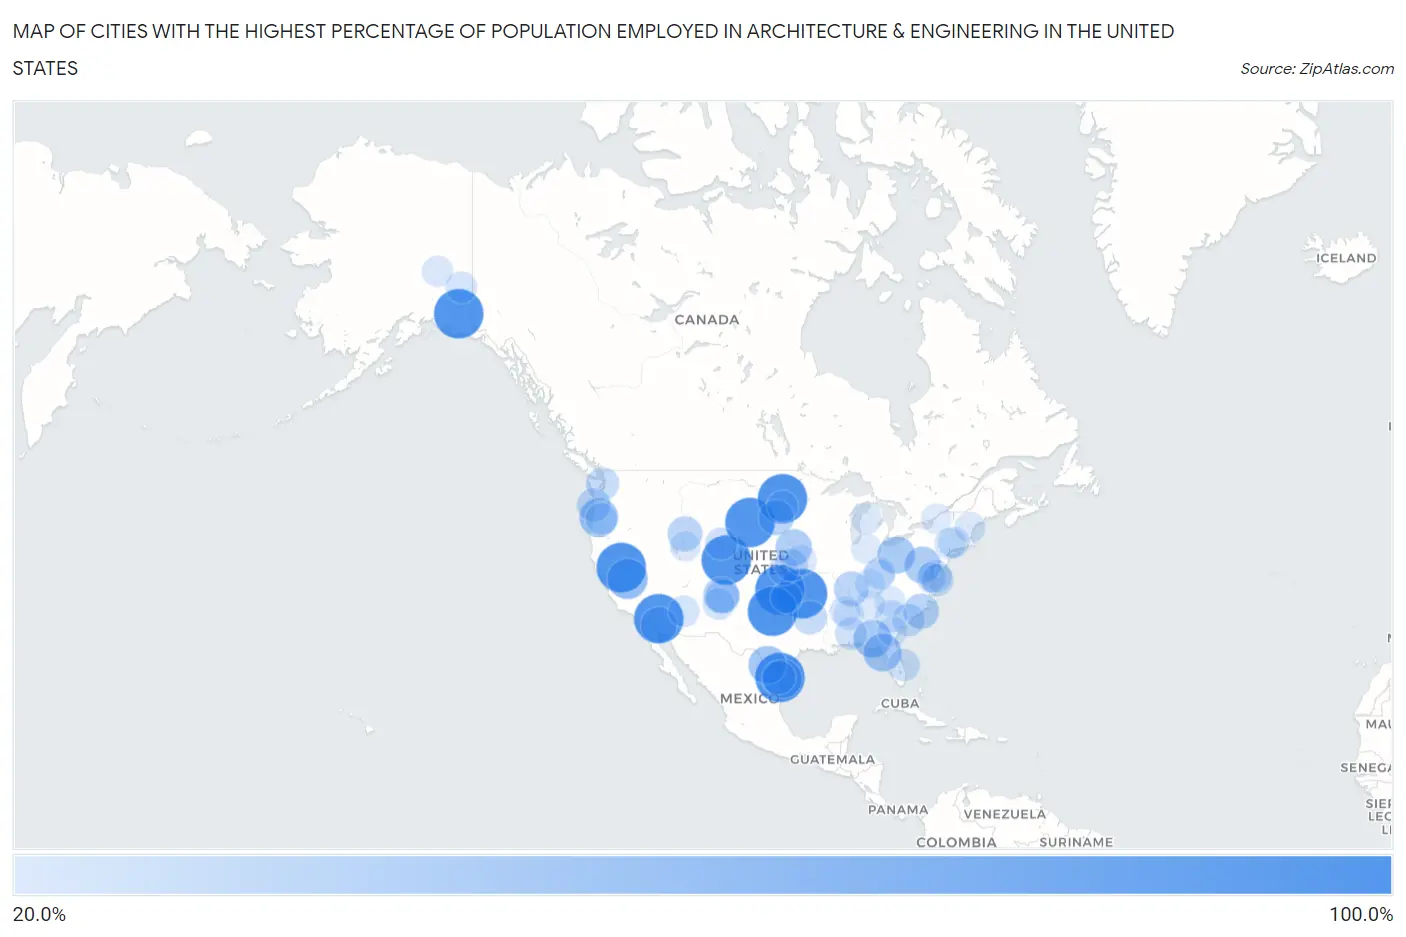
Map of Cities with the Highest Percentage of Population Employed in Architecture & Engineering in the United States
0.0%
100.0%
Cities with the Highest Percentage of Population Employed in Architecture & Engineering in the United States
| City | % Employed | vs State | vs National | |
| 1. | Crystal Bay | 100.0% | 1.5%(+98.5)#1 | 2.1%(+97.9)#1 |
| 2. | Seven Hills | 100.0% | 2.9%(+97.1)#1 | 2.1%(+97.9)#2 |
| 3. | Palo Verde | 100.0% | 2.6%(+97.4)#1 | 2.1%(+97.9)#4 |
| 4. | Cottonwood | 100.0% | 1.6%(+98.4)#1 | 2.1%(+97.9)#5 |
| 5. | Yznaga | 100.0% | 2.2%(+97.8)#1 | 2.1%(+97.9)#6 |
| 6. | Goodmanville | 100.0% | 2.6%(+97.4)#2 | 2.1%(+97.9)#7 |
| 7. | Cherokee City | 100.0% | 1.3%(+98.7)#1 | 2.1%(+97.9)#8 |
| 8. | Beacon View | 100.0% | 1.5%(+98.5)#1 | 2.1%(+97.9)#9 |
| 9. | De Lamere | 100.0% | 2.0%(+98.0)#1 | 2.1%(+97.9)#10 |
| 10. | Jefferson | 100.0% | 1.8%(+98.2)#1 | 2.1%(+97.9)#11 |
| 11. | Loveland | 100.0% | 1.8%(+98.2)#2 | 2.1%(+97.9)#12 |
| 12. | Mccarthy | 100.0% | 2.3%(+97.7)#1 | 2.1%(+97.9)#13 |
| 13. | Pinebrook | 83.2% | 2.2%(+81.0)#2 | 2.1%(+81.1)#14 |
| 14. | East Columbia | 69.1% | 2.2%(+66.9)#3 | 2.1%(+66.9)#15 |
| 15. | Lake Cicott | 67.6% | 2.2%(+65.4)#1 | 2.1%(+65.5)#16 |
| 16. | Mossville | 63.3% | 1.9%(+61.4)#1 | 2.1%(+61.2)#17 |
| 17. | Mono City | 63.1% | 2.6%(+60.5)#3 | 2.1%(+60.9)#18 |
| 18. | Ludell | 57.1% | 2.0%(+55.1)#1 | 2.1%(+55.0)#19 |
| 19. | Orason | 56.7% | 2.2%(+54.5)#4 | 2.1%(+54.6)#20 |
| 20. | Peoria | 56.2% | 2.8%(+53.4)#1 | 2.1%(+54.1)#21 |
| 21. | Garten | 55.8% | 1.6%(+54.3)#1 | 2.1%(+53.7)#22 |
| 22. | Boykin | 53.8% | 1.8%(+52.1)#1 | 2.1%(+51.7)#23 |
| 23. | Botines | 53.8% | 2.2%(+51.6)#5 | 2.1%(+51.7)#24 |
| 24. | Horseshoe Beach | 53.3% | 1.6%(+51.7)#1 | 2.1%(+51.2)#25 |
| 25. | Linnsburg | 52.6% | 2.2%(+50.4)#2 | 2.1%(+50.5)#26 |
| 26. | Sandyville | 51.3% | 2.1%(+49.1)#1 | 2.1%(+49.1)#27 |
| 27. | Richards | 48.8% | 2.2%(+46.6)#6 | 2.1%(+46.6)#28 |
| 28. | Mercersville | 48.2% | 2.4%(+45.8)#1 | 2.1%(+46.0)#29 |
| 29. | Drysdale | 47.4% | 2.4%(+45.0)#1 | 2.1%(+45.2)#30 |
| 30. | Weston | 47.4% | 1.8%(+45.6)#1 | 2.1%(+45.2)#31 |
| 31. | Elyria | 46.7% | 2.0%(+44.7)#2 | 2.1%(+44.6)#32 |
| 32. | Lyons | 45.7% | 2.2%(+43.4)#7 | 2.1%(+43.5)#33 |
| 33. | Canova | 44.9% | 2.5%(+42.4)#1 | 2.1%(+42.8)#34 |
| 34. | Blue Clay Farms | 42.9% | 1.9%(+41.0)#1 | 2.1%(+40.7)#35 |
| 35. | Broadland | 42.9% | 1.6%(+41.3)#2 | 2.1%(+40.7)#36 |
| 36. | Bolivar | 41.7% | 1.5%(+40.2)#1 | 2.1%(+39.5)#37 |
| 37. | Viola | 40.9% | 2.2%(+38.7)#1 | 2.1%(+38.8)#38 |
| 38. | Gracey | 40.7% | 1.7%(+39.0)#1 | 2.1%(+38.6)#39 |
| 39. | Auburn | 40.7% | 1.9%(+38.8)#1 | 2.1%(+38.5)#40 |
| 40. | Nesco | 38.2% | 1.9%(+36.3)#1 | 2.1%(+36.1)#41 |
| 41. | Crestview | 38.1% | 2.5%(+35.6)#2 | 2.1%(+35.9)#42 |
| 42. | Truchas | 37.8% | 2.5%(+35.3)#3 | 2.1%(+35.7)#43 |
| 43. | Ratamosa | 36.7% | 2.2%(+34.4)#8 | 2.1%(+34.5)#44 |
| 44. | Neahkahnie | 36.4% | 2.8%(+33.6)#2 | 2.1%(+34.3)#45 |
| 45. | Patmos | 36.4% | 1.3%(+35.1)#2 | 2.1%(+34.2)#46 |
| 46. | Green Meadows | 35.8% | 2.8%(+32.9)#3 | 2.1%(+33.6)#47 |
| 47. | Craigville | 34.9% | 2.2%(+32.7)#3 | 2.1%(+32.8)#48 |
| 48. | Keyport | 34.3% | 2.8%(+31.5)#1 | 2.1%(+32.2)#49 |
| 49. | Tyaskin | 33.3% | 2.4%(+30.9)#2 | 2.1%(+31.2)#50 |
| 50. | Havensville | 33.0% | 2.0%(+30.9)#3 | 2.1%(+30.8)#51 |
| 51. | Princeton | 32.6% | 1.5%(+31.1)#2 | 2.1%(+30.5)#52 |
| 52. | Glen | 32.4% | 1.8%(+30.6)#1 | 2.1%(+30.2)#53 |
| 53. | Jamestown | 31.9% | 2.2%(+29.7)#1 | 2.1%(+29.8)#54 |
| 54. | Rob Roy | 31.8% | 2.2%(+29.6)#4 | 2.1%(+29.7)#55 |
| 55. | Nelsonia | 31.3% | 2.3%(+29.0)#1 | 2.1%(+29.2)#56 |
| 56. | Rock River | 30.9% | 1.9%(+29.0)#2 | 2.1%(+28.8)#57 |
| 57. | Orchid | 30.6% | 1.6%(+29.0)#2 | 2.1%(+28.5)#58 |
| 58. | Whatley | 30.3% | 2.4%(+27.9)#1 | 2.1%(+28.2)#59 |
| 59. | Clarks Hill | 30.0% | 2.2%(+27.8)#2 | 2.1%(+27.9)#60 |
| 60. | Taft | 29.3% | 1.7%(+27.7)#1 | 2.1%(+27.2)#61 |
| 61. | Hanksville | 29.2% | 2.0%(+27.2)#1 | 2.1%(+27.0)#62 |
| 62. | La Madera | 29.1% | 2.5%(+26.6)#4 | 2.1%(+26.9)#63 |
| 63. | Mountain Meadows | 28.8% | 2.6%(+26.2)#4 | 2.1%(+26.7)#64 |
| 64. | Crawfordsville | 28.6% | 2.8%(+25.8)#4 | 2.1%(+26.5)#65 |
| 65. | Tetlin | 28.2% | 2.3%(+25.9)#2 | 2.1%(+26.1)#66 |
| 66. | Nye | 28.1% | 1.8%(+26.4)#2 | 2.1%(+26.0)#67 |
| 67. | Agra | 27.9% | 1.8%(+26.1)#3 | 2.1%(+25.8)#68 |
| 68. | East Verde Estates | 27.8% | 2.4%(+25.4)#2 | 2.1%(+25.6)#69 |
| 69. | Bentonville | 27.4% | 2.1%(+25.2)#2 | 2.1%(+25.2)#70 |
| 70. | Pleasant Valley | 27.3% | 1.6%(+25.7)#1 | 2.1%(+25.2)#71 |
| 71. | Friesville | 27.3% | 2.0%(+25.2)#1 | 2.1%(+25.1)#72 |
| 72. | Ben Arnold | 27.3% | 2.2%(+25.1)#9 | 2.1%(+25.1)#73 |
| 73. | Swedesburg | 26.9% | 1.8%(+25.1)#2 | 2.1%(+24.8)#74 |
| 74. | Eden | 26.8% | 1.6%(+25.2)#3 | 2.1%(+24.7)#75 |
| 75. | Norene | 26.5% | 1.7%(+24.9)#2 | 2.1%(+24.4)#76 |
| 76. | Falls Village | 26.5% | 2.6%(+23.9)#1 | 2.1%(+24.3)#77 |
| 77. | Whitestone | 26.3% | 2.3%(+24.0)#3 | 2.1%(+24.2)#78 |
| 78. | Elizaville | 26.2% | 1.7%(+24.5)#2 | 2.1%(+24.0)#79 |
| 79. | Boon | 26.1% | 3.4%(+22.7)#1 | 2.1%(+23.9)#80 |
| 80. | Beaver Dam | 25.9% | 2.2%(+23.7)#5 | 2.1%(+23.8)#81 |
| 81. | Helena | 25.9% | 2.2%(+23.7)#3 | 2.1%(+23.7)#82 |
| 82. | Milton Mills | 25.8% | 3.1%(+22.7)#1 | 2.1%(+23.7)#83 |
| 83. | Hilltown | 25.5% | 2.3%(+23.2)#2 | 2.1%(+23.4)#84 |
| 84. | Waterbury Center | 25.5% | 2.0%(+23.5)#2 | 2.1%(+23.3)#85 |
| 85. | Fair Oaks | 25.0% | 2.2%(+22.8)#6 | 2.1%(+22.9)#86 |
| 86. | Beaverton | 25.0% | 2.4%(+22.6)#2 | 2.1%(+22.9)#87 |
| 87. | Marvel | 25.0% | 2.9%(+22.1)#2 | 2.1%(+22.9)#88 |
| 88. | Rea | 25.0% | 1.7%(+23.3)#1 | 2.1%(+22.9)#89 |
| 89. | Tall Timbers | 24.4% | 2.4%(+22.0)#3 | 2.1%(+22.3)#90 |
| 90. | Mooreville | 24.3% | 1.5%(+22.8)#2 | 2.1%(+22.2)#91 |
| 91. | Sequatchie | 24.2% | 1.7%(+22.6)#3 | 2.1%(+22.1)#92 |
| 92. | Gerton | 24.2% | 1.9%(+22.3)#2 | 2.1%(+22.0)#93 |
| 93. | East Oolitic | 24.1% | 2.2%(+21.9)#7 | 2.1%(+22.0)#94 |
| 94. | Talmage | 24.1% | 2.0%(+22.1)#4 | 2.1%(+22.0)#95 |
| 95. | Woodruff | 23.9% | 2.2%(+21.7)#1 | 2.1%(+21.7)#96 |
| 96. | Larwill | 23.8% | 2.2%(+21.6)#8 | 2.1%(+21.7)#97 |
| 97. | Redwood | 23.6% | 1.6%(+22.0)#2 | 2.1%(+21.5)#98 |
| 98. | Mendes | 23.6% | 1.8%(+21.8)#2 | 2.1%(+21.4)#99 |
| 99. | Ooltewah | 23.3% | 1.7%(+21.6)#4 | 2.1%(+21.1)#100 |
| 100. | Bradfordsville | 23.2% | 1.7%(+21.5)#3 | 2.1%(+21.1)#101 |
Common Questions
What are the Top 10 Cities with the Highest Percentage of Population Employed in Architecture & Engineering in the United States?
Top 10 Cities with the Highest Percentage of Population Employed in Architecture & Engineering in the United States are:
#1
100.0%
#2
100.0%
#3
100.0%
#4
100.0%
#5
100.0%
#6
100.0%
#7
100.0%
#8
100.0%
#9
100.0%
#10
100.0%
What city has the Highest Percentage of Population Employed in Architecture & Engineering in the United States?
Crystal Bay has the Highest Percentage of Population Employed in Architecture & Engineering in the United States with 100.0%.
What is the Percentage of Population Employed in Architecture & Engineering in the United States?
Percentage of Population Employed in Architecture & Engineering in the United States is 2.1%.