San Jose, CA Map & Demographics
San Jose Map
San Jose Overview
$59,913
PER CAPITA INCOME
$152,266
AVG FAMILY INCOME
$136,010
AVG HOUSEHOLD INCOME
32.5%
WAGE / INCOME GAP [ % ]
67.5¢/ $1
WAGE / INCOME GAP [ $ ]
$10,730
FAMILY INCOME DEFICIT
0.46
INEQUALITY / GINI INDEX
1,001,176
TOTAL POPULATION
510,716
MALE POPULATION
490,460
FEMALE POPULATION
104.13
MALES / 100 FEMALES
96.03
FEMALES / 100 MALES
37.8
MEDIAN AGE
3.5
AVG FAMILY SIZE
3.0
AVG HOUSEHOLD SIZE
552,785
LABOR FORCE [ PEOPLE ]
67.9%
PERCENT IN LABOR FORCE
4.7%
UNEMPLOYMENT RATE
San Jose Zip Codes
Income in San Jose
Income Overview in San Jose
Per Capita Income in San Jose is $59,913, while median incomes of families and households are $152,266 and $136,010 respectively.
| Characteristic | Number | Measure |
| Per Capita Income | 1,001,176 | $59,913 |
| Median Family Income | 233,289 | $152,266 |
| Mean Family Income | 233,289 | $197,980 |
| Median Household Income | 324,842 | $136,010 |
| Mean Household Income | 324,842 | $179,853 |
| Income Deficit | 233,289 | $10,730 |
| Wage / Income Gap (%) | 1,001,176 | 32.52% |
| Wage / Income Gap ($) | 1,001,176 | 67.48¢ per $1 |
| Gini / Inequality Index | 1,001,176 | 0.46 |
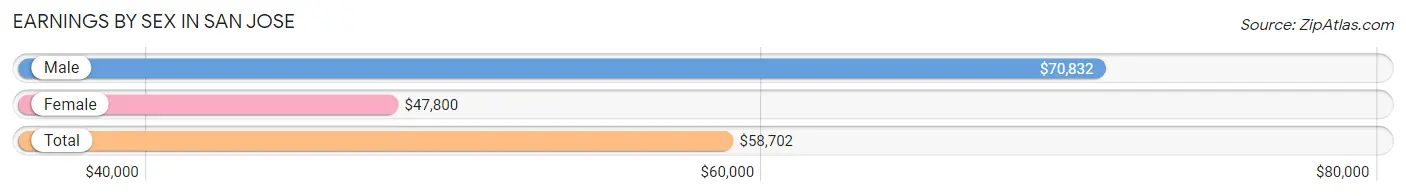
Earnings by Sex in San Jose
Average Earnings in San Jose are $58,702, $70,832 for men and $47,800 for women, a difference of 32.5%.
| Sex | Number | Average Earnings |
| Male | 312,314 (55.3%) | $70,832 |
| Female | 252,389 (44.7%) | $47,800 |
| Total | 564,703 (100.0%) | $58,702 |
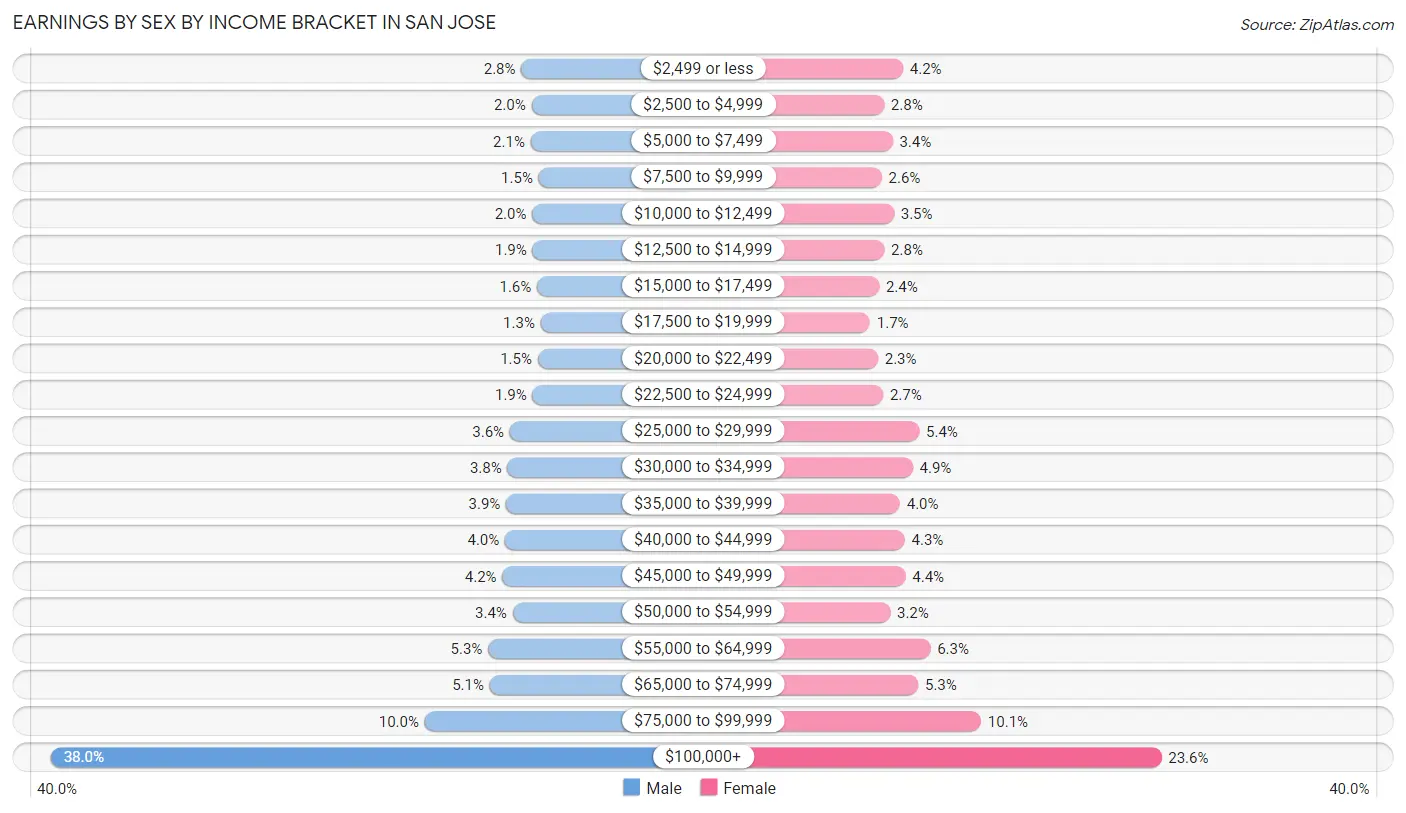
Earnings by Sex by Income Bracket in San Jose
The most common earnings brackets in San Jose are $100,000+ for men (118,812 | 38.0%) and $100,000+ for women (59,496 | 23.6%).
| Income | Male | Female |
| $2,499 or less | 8,661 (2.8%) | 10,607 (4.2%) |
| $2,500 to $4,999 | 6,268 (2.0%) | 7,026 (2.8%) |
| $5,000 to $7,499 | 6,476 (2.1%) | 8,632 (3.4%) |
| $7,500 to $9,999 | 4,604 (1.5%) | 6,580 (2.6%) |
| $10,000 to $12,499 | 6,097 (1.9%) | 8,889 (3.5%) |
| $12,500 to $14,999 | 6,026 (1.9%) | 7,072 (2.8%) |
| $15,000 to $17,499 | 4,979 (1.6%) | 6,077 (2.4%) |
| $17,500 to $19,999 | 4,137 (1.3%) | 4,364 (1.7%) |
| $20,000 to $22,499 | 4,809 (1.5%) | 5,861 (2.3%) |
| $22,500 to $24,999 | 6,013 (1.9%) | 6,831 (2.7%) |
| $25,000 to $29,999 | 11,343 (3.6%) | 13,685 (5.4%) |
| $30,000 to $34,999 | 11,908 (3.8%) | 12,453 (4.9%) |
| $35,000 to $39,999 | 12,220 (3.9%) | 10,032 (4.0%) |
| $40,000 to $44,999 | 12,474 (4.0%) | 10,919 (4.3%) |
| $45,000 to $49,999 | 13,089 (4.2%) | 11,082 (4.4%) |
| $50,000 to $54,999 | 10,676 (3.4%) | 8,174 (3.2%) |
| $55,000 to $64,999 | 16,413 (5.3%) | 15,770 (6.2%) |
| $65,000 to $74,999 | 16,049 (5.1%) | 13,481 (5.3%) |
| $75,000 to $99,999 | 31,260 (10.0%) | 25,358 (10.1%) |
| $100,000+ | 118,812 (38.0%) | 59,496 (23.6%) |
| Total | 312,314 (100.0%) | 252,389 (100.0%) |
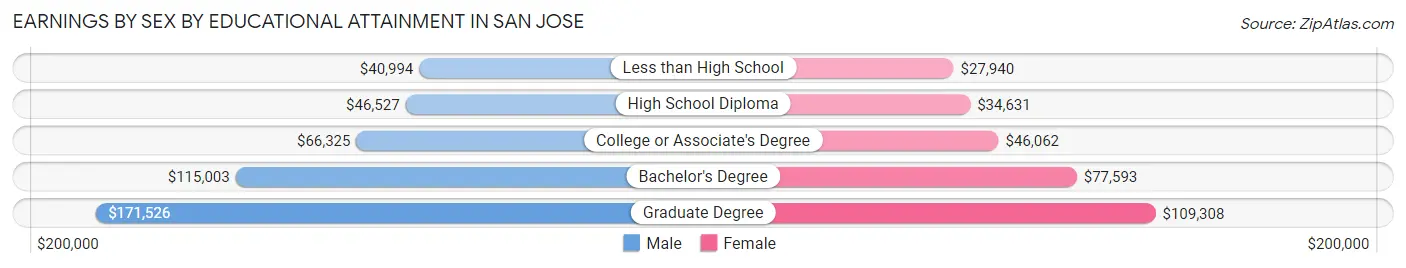
Earnings by Sex by Educational Attainment in San Jose
Average earnings in San Jose are $81,535 for men and $56,118 for women, a difference of 31.2%. Men with an educational attainment of graduate degree enjoy the highest average annual earnings of $171,526, while those with less than high school education earn the least with $40,994. Women with an educational attainment of graduate degree earn the most with the average annual earnings of $109,308, while those with less than high school education have the smallest earnings of $27,940.
| Educational Attainment | Male Income | Female Income |
| Less than High School | $40,994 | $27,940 |
| High School Diploma | $46,527 | $34,631 |
| College or Associate's Degree | $66,325 | $46,062 |
| Bachelor's Degree | $115,003 | $77,593 |
| Graduate Degree | $171,526 | $109,308 |
| Total | $81,535 | $56,118 |
Family Income in San Jose
Family Income Brackets in San Jose
According to the San Jose family income data, there are 85,850 families falling into the $200,000+ income range, which is the most common income bracket and makes up 36.8% of all families. Conversely, the $10,000 to $14,999 income bracket is the least frequent group with only 2,100 families (0.9%) belonging to this category.
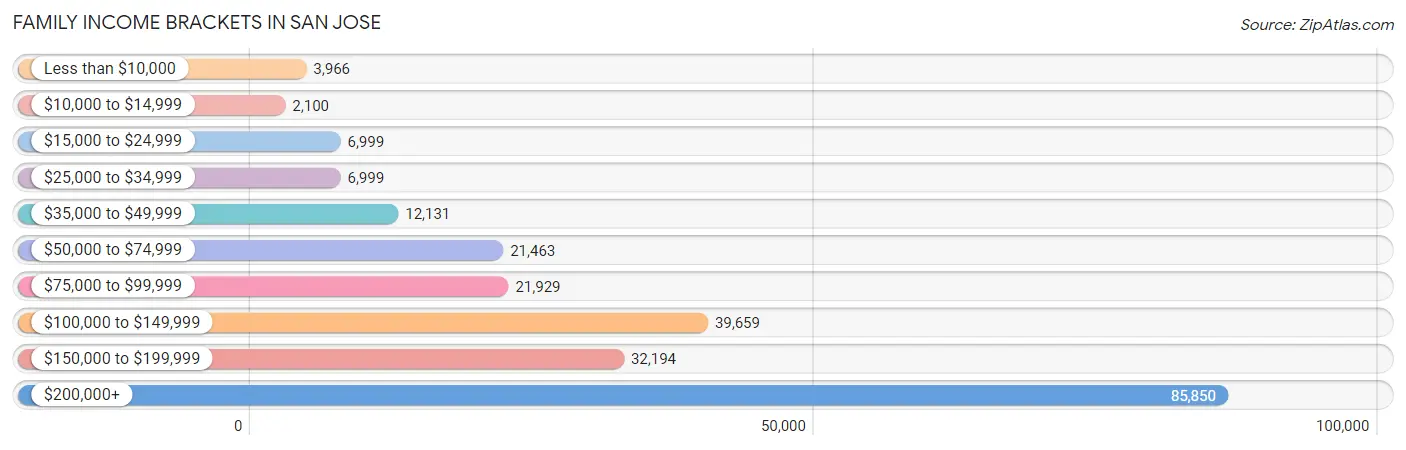
| Income Bracket | # Families | % Families |
| Less than $10,000 | 3,966 | 1.7% |
| $10,000 to $14,999 | 2,100 | 0.9% |
| $15,000 to $24,999 | 6,999 | 3.0% |
| $25,000 to $34,999 | 6,999 | 3.0% |
| $35,000 to $49,999 | 12,131 | 5.2% |
| $50,000 to $74,999 | 21,463 | 9.2% |
| $75,000 to $99,999 | 21,929 | 9.4% |
| $100,000 to $149,999 | 39,659 | 17.0% |
| $150,000 to $199,999 | 32,194 | 13.8% |
| $200,000+ | 85,850 | 36.8% |
Family Income by Famaliy Size in San Jose
4-person families (53,487 | 22.9%) account for the highest median family income in San Jose with $186,494 per family, while 2-person families (82,995 | 35.6%) have the highest median income of $62,491 per family member.
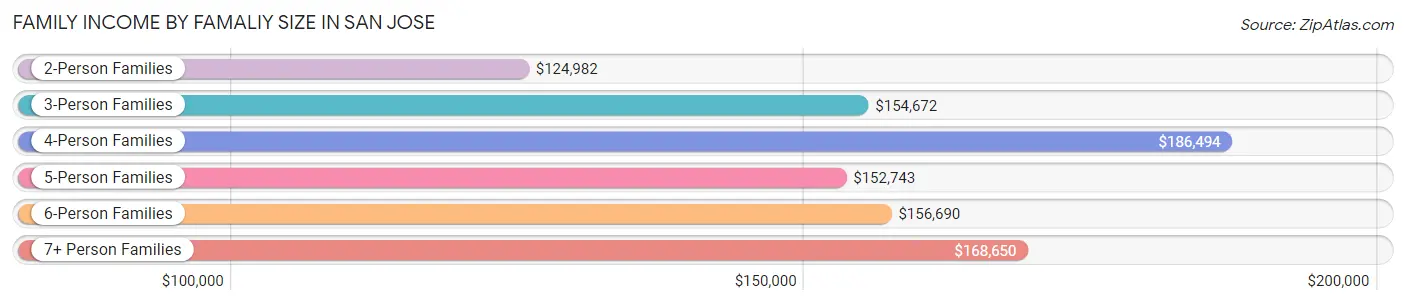
| Income Bracket | # Families | Median Income |
| 2-Person Families | 82,995 (35.6%) | $124,982 |
| 3-Person Families | 58,429 (25.1%) | $154,672 |
| 4-Person Families | 53,487 (22.9%) | $186,494 |
| 5-Person Families | 22,343 (9.6%) | $152,743 |
| 6-Person Families | 8,796 (3.8%) | $156,690 |
| 7+ Person Families | 7,239 (3.1%) | $168,650 |
| Total | 233,289 (100.0%) | $152,266 |
Family Income by Number of Earners in San Jose
The median family income in San Jose is $152,266, with families comprising 2 earners (102,656) having the highest median family income of $193,470, while families with no earners (21,121) have the lowest median family income of $53,887, accounting for 44.0% and 9.0% of families, respectively.
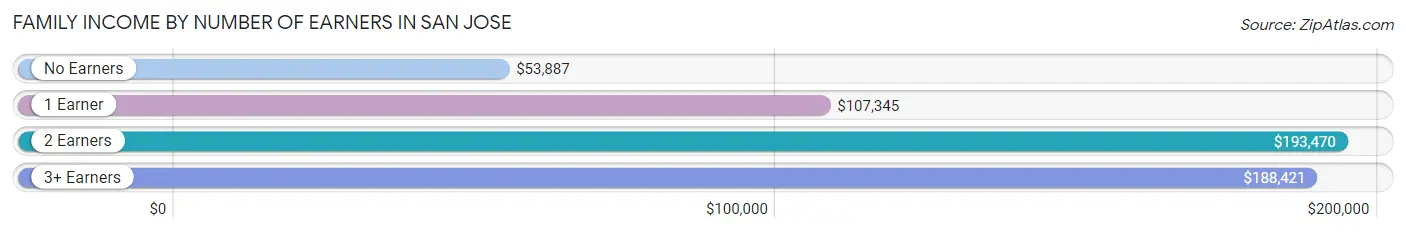
| Number of Earners | # Families | Median Income |
| No Earners | 21,121 (9.0%) | $53,887 |
| 1 Earner | 67,843 (29.1%) | $107,345 |
| 2 Earners | 102,656 (44.0%) | $193,470 |
| 3+ Earners | 41,669 (17.9%) | $188,421 |
| Total | 233,289 (100.0%) | $152,266 |
Household Income in San Jose
Household Income Brackets in San Jose
With 104,924 households falling in the category, the $200,000+ income range is the most frequent in San Jose, accounting for 32.3% of all households. In contrast, only 7,471 households (2.3%) fall into the $10,000 to $14,999 income bracket, making it the least populous group.
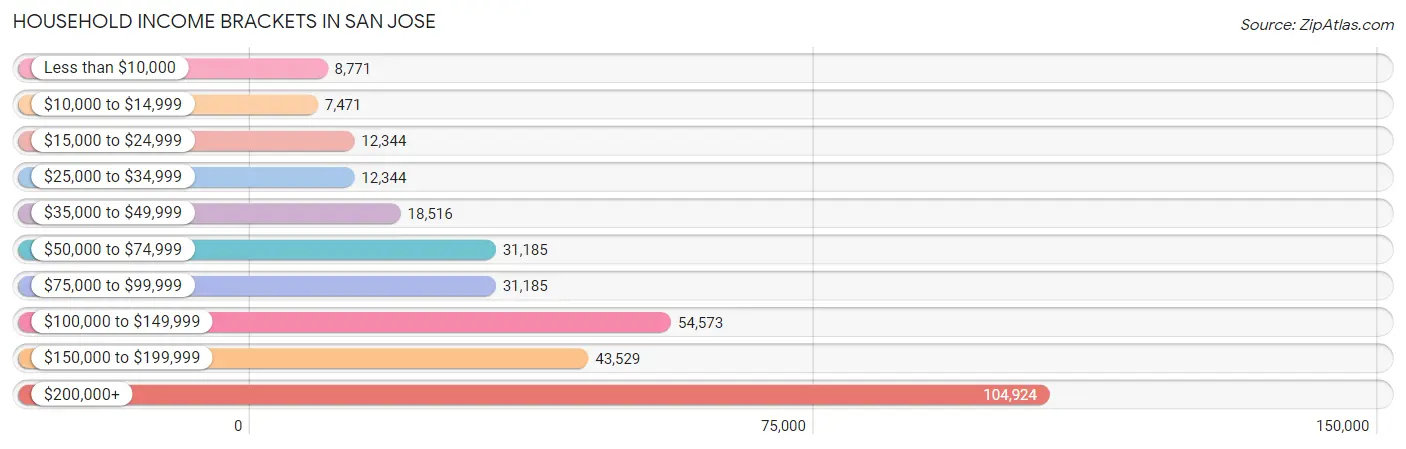
| Income Bracket | # Households | % Households |
| Less than $10,000 | 8,771 | 2.7% |
| $10,000 to $14,999 | 7,471 | 2.3% |
| $15,000 to $24,999 | 12,344 | 3.8% |
| $25,000 to $34,999 | 12,344 | 3.8% |
| $35,000 to $49,999 | 18,516 | 5.7% |
| $50,000 to $74,999 | 31,185 | 9.6% |
| $75,000 to $99,999 | 31,185 | 9.6% |
| $100,000 to $149,999 | 54,573 | 16.8% |
| $150,000 to $199,999 | 43,529 | 13.4% |
| $200,000+ | 104,924 | 32.3% |
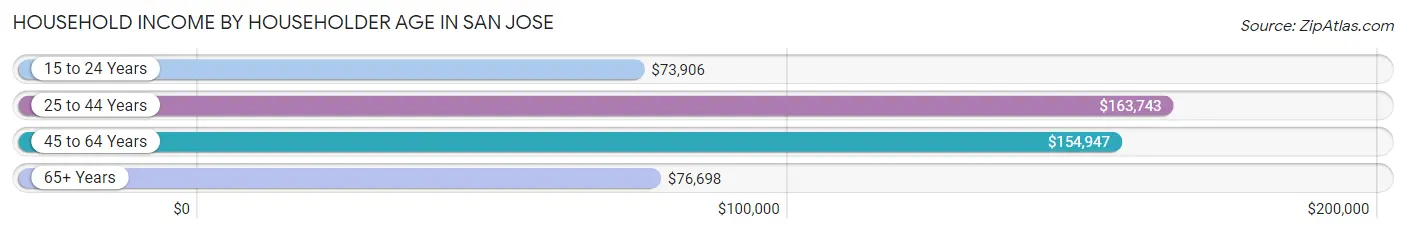
Household Income by Householder Age in San Jose
The median household income in San Jose is $136,010, with the highest median household income of $163,743 found in the 25 to 44 years age bracket for the primary householder. A total of 118,911 households (36.6%) fall into this category. Meanwhile, the 15 to 24 years age bracket for the primary householder has the lowest median household income of $73,906, with 7,808 households (2.4%) in this group.
| Income Bracket | # Households | Median Income |
| 15 to 24 Years | 7,808 (2.4%) | $73,906 |
| 25 to 44 Years | 118,911 (36.6%) | $163,743 |
| 45 to 64 Years | 128,104 (39.4%) | $154,947 |
| 65+ Years | 70,019 (21.5%) | $76,698 |
| Total | 324,842 (100.0%) | $136,010 |
Poverty in San Jose
Income Below Poverty by Sex and Age in San Jose
With 7.2% poverty level for males and 8.7% for females among the residents of San Jose, 18 to 24 year old males and 18 to 24 year old females are the most vulnerable to poverty, with 5,854 males (13.0%) and 6,721 females (15.4%) in their respective age groups living below the poverty level.
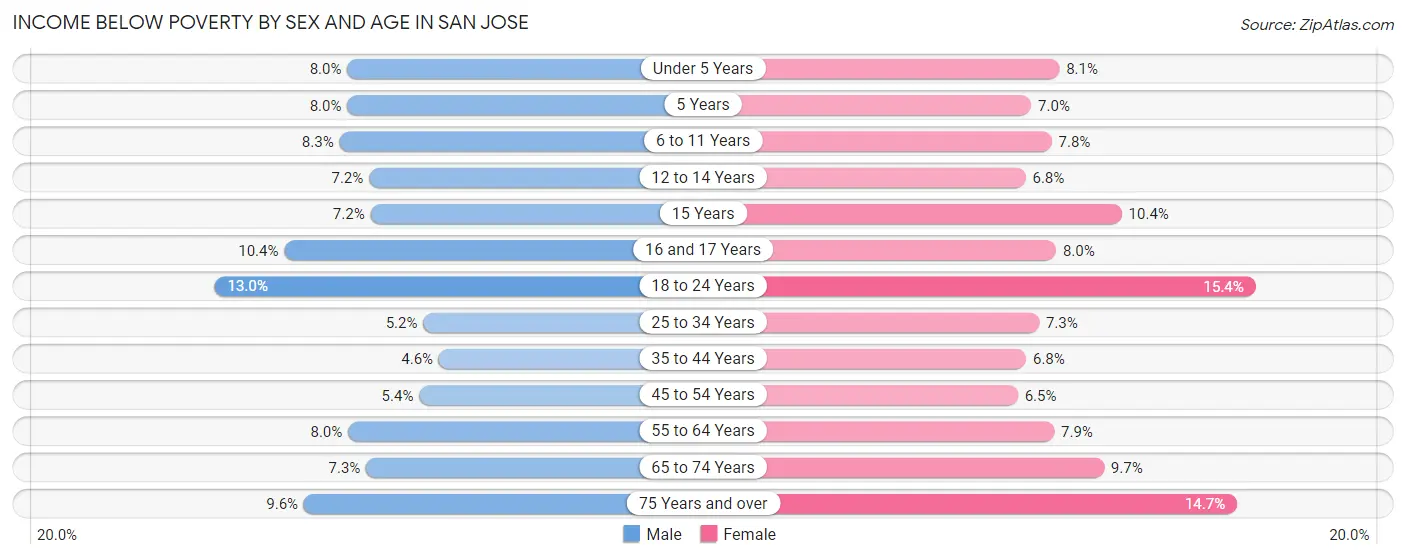
| Age Bracket | Male | Female |
| Under 5 Years | 2,180 (8.0%) | 2,047 (8.1%) |
| 5 Years | 436 (8.0%) | 335 (7.0%) |
| 6 to 11 Years | 2,978 (8.3%) | 2,653 (7.8%) |
| 12 to 14 Years | 1,438 (7.2%) | 1,275 (6.8%) |
| 15 Years | 463 (7.2%) | 672 (10.4%) |
| 16 and 17 Years | 1,354 (10.4%) | 936 (8.0%) |
| 18 to 24 Years | 5,854 (13.0%) | 6,721 (15.4%) |
| 25 to 34 Years | 4,345 (5.2%) | 5,163 (7.3%) |
| 35 to 44 Years | 3,506 (4.6%) | 4,761 (6.8%) |
| 45 to 54 Years | 3,805 (5.3%) | 4,409 (6.5%) |
| 55 to 64 Years | 4,926 (8.0%) | 4,598 (7.9%) |
| 65 to 74 Years | 2,721 (7.3%) | 4,099 (9.7%) |
| 75 Years and over | 2,241 (9.6%) | 4,783 (14.7%) |
| Total | 36,247 (7.2%) | 42,452 (8.7%) |
Income Above Poverty by Sex and Age in San Jose
According to the poverty statistics in San Jose, males aged 35 to 44 years and females aged 45 to 54 years are the age groups that are most secure financially, with 95.4% of males and 93.5% of females in these age groups living above the poverty line.
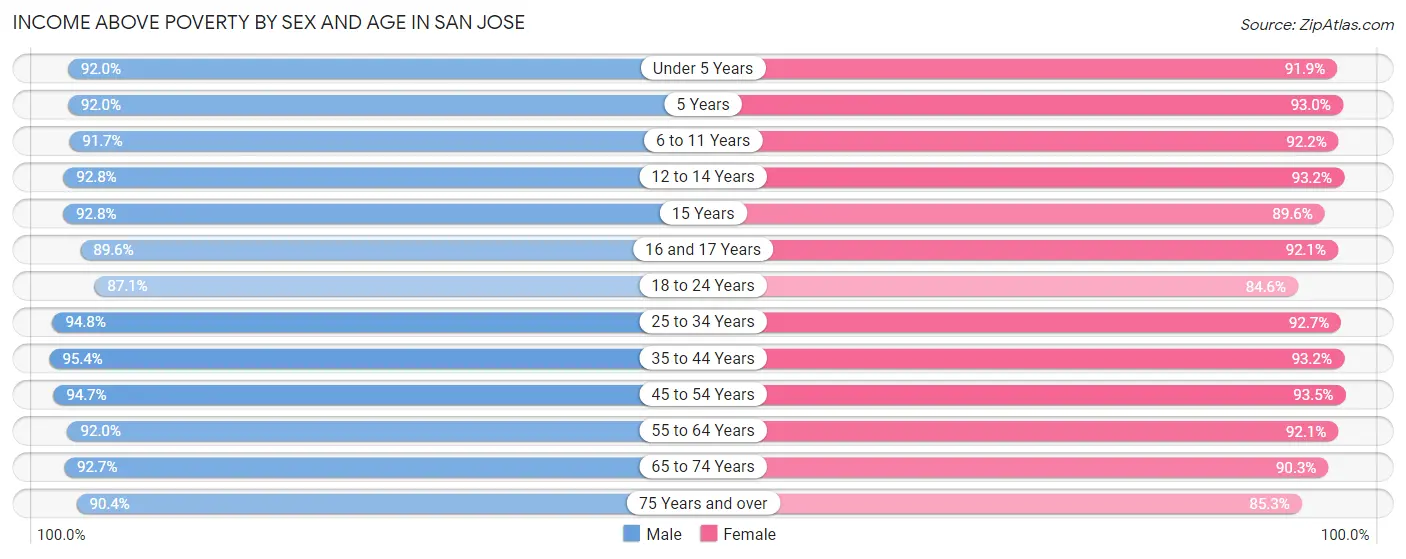
| Age Bracket | Male | Female |
| Under 5 Years | 25,010 (92.0%) | 23,331 (91.9%) |
| 5 Years | 4,998 (92.0%) | 4,428 (93.0%) |
| 6 to 11 Years | 32,879 (91.7%) | 31,391 (92.2%) |
| 12 to 14 Years | 18,519 (92.8%) | 17,429 (93.2%) |
| 15 Years | 6,001 (92.8%) | 5,797 (89.6%) |
| 16 and 17 Years | 11,717 (89.6%) | 10,844 (92.0%) |
| 18 to 24 Years | 39,364 (87.1%) | 37,034 (84.6%) |
| 25 to 34 Years | 79,190 (94.8%) | 65,362 (92.7%) |
| 35 to 44 Years | 72,365 (95.4%) | 64,808 (93.2%) |
| 45 to 54 Years | 67,379 (94.7%) | 63,102 (93.5%) |
| 55 to 64 Years | 56,691 (92.0%) | 53,757 (92.1%) |
| 65 to 74 Years | 34,472 (92.7%) | 38,030 (90.3%) |
| 75 Years and over | 21,040 (90.4%) | 27,823 (85.3%) |
| Total | 469,625 (92.8%) | 443,136 (91.3%) |
Income Below Poverty Among Married-Couple Families in San Jose
The poverty statistics for married-couple families in San Jose show that 3.3% or 5,711 of the total 175,166 families live below the poverty line. Families with 5 or more children have the highest poverty rate of 10.1%, comprising of 65 families. On the other hand, families with 1 or 2 children have the lowest poverty rate of 2.9%, which includes 2,139 families.
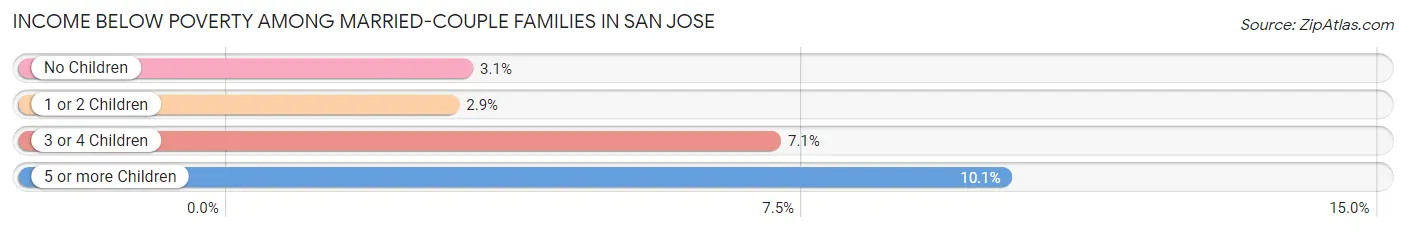
| Children | Above Poverty | Below Poverty |
| No Children | 87,435 (96.9%) | 2,768 (3.1%) |
| 1 or 2 Children | 71,764 (97.1%) | 2,139 (2.9%) |
| 3 or 4 Children | 9,678 (92.9%) | 739 (7.1%) |
| 5 or more Children | 578 (89.9%) | 65 (10.1%) |
| Total | 169,455 (96.7%) | 5,711 (3.3%) |
Income Below Poverty Among Single-Parent Households in San Jose
According to the poverty data in San Jose, 5.8% or 1,151 single-father households and 11.6% or 4,413 single-mother households are living below the poverty line. Among single-father households, those with 3 or 4 children have the highest poverty rate, with 248 households (22.1%) experiencing poverty. Likewise, among single-mother households, those with 5 or more children have the highest poverty rate, with 158 households (46.6%) falling below the poverty line.
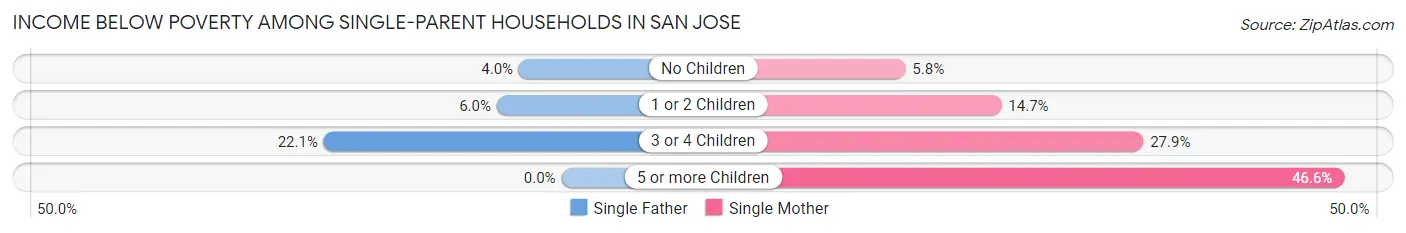
| Children | Single Father | Single Mother |
| No Children | 435 (4.0%) | 1,089 (5.8%) |
| 1 or 2 Children | 468 (6.0%) | 2,340 (14.7%) |
| 3 or 4 Children | 248 (22.1%) | 826 (27.9%) |
| 5 or more Children | 0 (0.0%) | 158 (46.6%) |
| Total | 1,151 (5.8%) | 4,413 (11.6%) |
Income Below Poverty Among Married-Couple vs Single-Parent Households in San Jose
The poverty data for San Jose shows that 5,711 of the married-couple family households (3.3%) and 5,564 of the single-parent households (9.6%) are living below the poverty level. Within the married-couple family households, those with 5 or more children have the highest poverty rate, with 65 households (10.1%) falling below the poverty line. Among the single-parent households, those with 5 or more children have the highest poverty rate, with 158 household (37.8%) living below poverty.
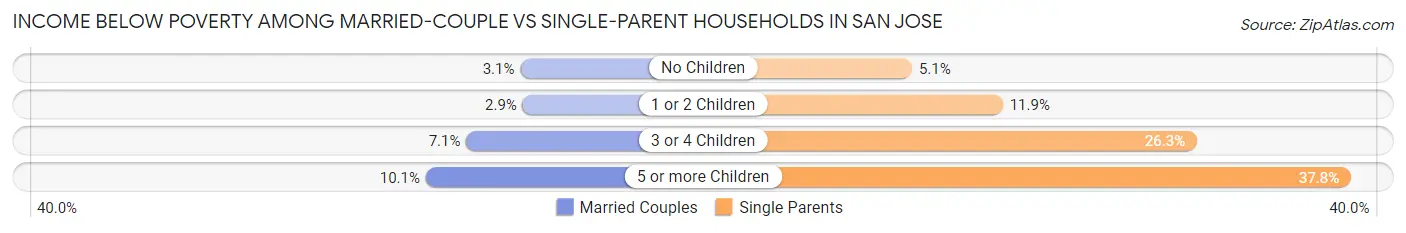
| Children | Married-Couple Families | Single-Parent Households |
| No Children | 2,768 (3.1%) | 1,524 (5.1%) |
| 1 or 2 Children | 2,139 (2.9%) | 2,808 (11.8%) |
| 3 or 4 Children | 739 (7.1%) | 1,074 (26.3%) |
| 5 or more Children | 65 (10.1%) | 158 (37.8%) |
| Total | 5,711 (3.3%) | 5,564 (9.6%) |
Race in San Jose
The most populous races in San Jose are Asian (381,796 | 38.1%), White / Caucasian (320,311 | 32.0%), and Hispanic or Latino (308,307 | 30.8%).
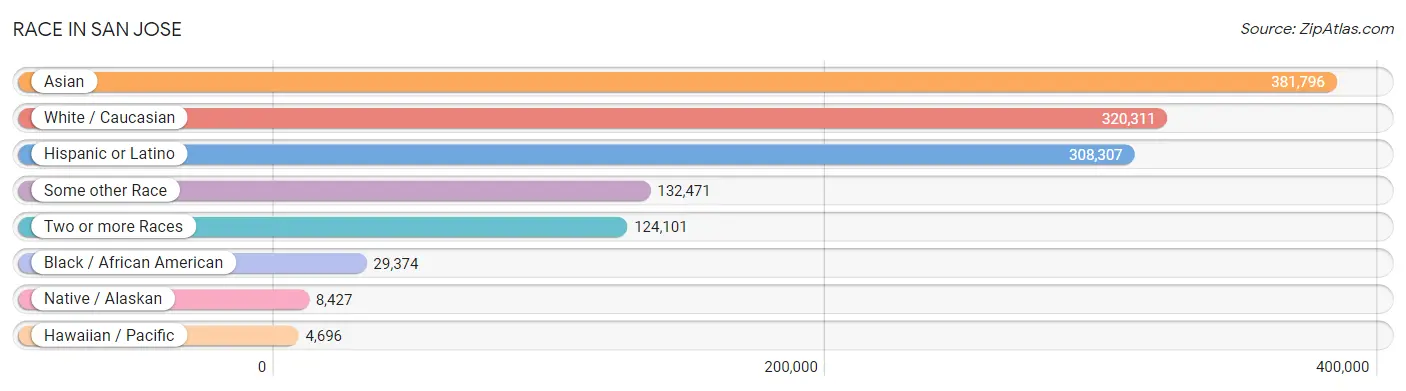
| Race | # Population | % Population |
| Asian | 381,796 | 38.1% |
| Black / African American | 29,374 | 2.9% |
| Hawaiian / Pacific | 4,696 | 0.5% |
| Hispanic or Latino | 308,307 | 30.8% |
| Native / Alaskan | 8,427 | 0.8% |
| White / Caucasian | 320,311 | 32.0% |
| Two or more Races | 124,101 | 12.4% |
| Some other Race | 132,471 | 13.2% |
| Total | 1,001,176 | 100.0% |
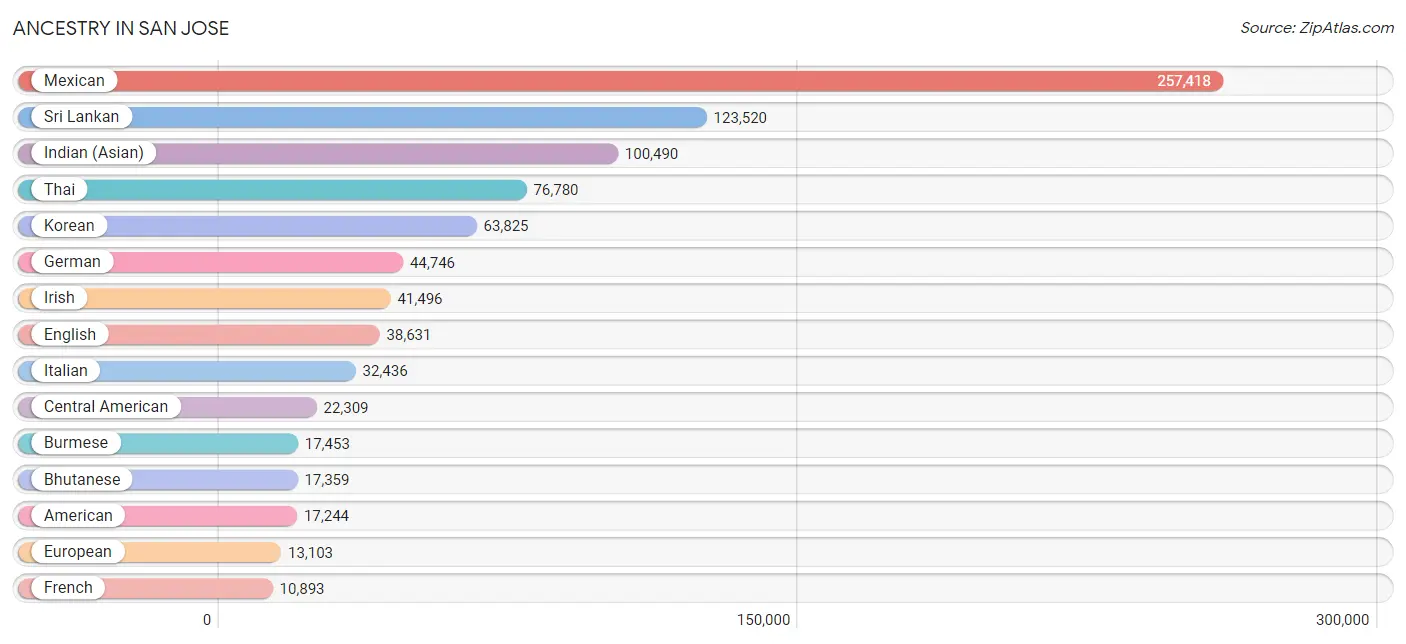
Ancestry in San Jose
The most populous ancestries reported in San Jose are Mexican (257,418 | 25.7%), Sri Lankan (123,520 | 12.3%), Indian (Asian) (100,490 | 10.0%), Thai (76,780 | 7.7%), and Korean (63,825 | 6.4%), together accounting for 62.1% of all San Jose residents.
| Ancestry | # Population | % Population |
| Afghan | 537 | 0.1% |
| African | 2,399 | 0.2% |
| Alaska Native | 16 | 0.0% |
| Albanian | 114 | 0.0% |
| Aleut | 2 | 0.0% |
| Alsatian | 24 | 0.0% |
| American | 17,244 | 1.7% |
| Apache | 1,250 | 0.1% |
| Arab | 7,533 | 0.7% |
| Argentinean | 1,052 | 0.1% |
| Armenian | 1,522 | 0.2% |
| Assyrian / Chaldean / Syriac | 3,018 | 0.3% |
| Australian | 293 | 0.0% |
| Austrian | 1,291 | 0.1% |
| Bangladeshi | 506 | 0.1% |
| Barbadian | 9 | 0.0% |
| Basque | 245 | 0.0% |
| Belgian | 371 | 0.0% |
| Belizean | 9 | 0.0% |
| Bhutanese | 17,359 | 1.7% |
| Blackfeet | 347 | 0.0% |
| Bolivian | 249 | 0.0% |
| Brazilian | 1,343 | 0.1% |
| British | 3,641 | 0.4% |
| British West Indian | 36 | 0.0% |
| Bulgarian | 253 | 0.0% |
| Burmese | 17,453 | 1.7% |
| Cajun | 168 | 0.0% |
| Cambodian | 507 | 0.1% |
| Canadian | 1,232 | 0.1% |
| Celtic | 52 | 0.0% |
| Central American | 22,309 | 2.2% |
| Central American Indian | 1,073 | 0.1% |
| Cherokee | 1,486 | 0.2% |
| Cheyenne | 10 | 0.0% |
| Chickasaw | 10 | 0.0% |
| Chilean | 1,161 | 0.1% |
| Chinese | 16 | 0.0% |
| Chippewa | 129 | 0.0% |
| Choctaw | 420 | 0.0% |
| Colombian | 3,163 | 0.3% |
| Comanche | 69 | 0.0% |
| Costa Rican | 806 | 0.1% |
| Cree | 8 | 0.0% |
| Creek | 183 | 0.0% |
| Croatian | 1,742 | 0.2% |
| Crow | 24 | 0.0% |
| Cuban | 1,513 | 0.2% |
| Czech | 1,382 | 0.1% |
| Czechoslovakian | 499 | 0.1% |
| Danish | 2,753 | 0.3% |
| Delaware | 29 | 0.0% |
| Dominican | 276 | 0.0% |
| Dutch | 4,826 | 0.5% |
| Dutch West Indian | 5 | 0.0% |
| Eastern European | 1,694 | 0.2% |
| Ecuadorian | 350 | 0.0% |
| Egyptian | 2,250 | 0.2% |
| English | 38,631 | 3.9% |
| Estonian | 73 | 0.0% |
| Ethiopian | 3,625 | 0.4% |
| European | 13,103 | 1.3% |
| Filipino | 7,790 | 0.8% |
| Finnish | 1,544 | 0.2% |
| French | 10,893 | 1.1% |
| French American Indian | 13 | 0.0% |
| French Canadian | 1,473 | 0.2% |
| German | 44,746 | 4.5% |
| German Russian | 19 | 0.0% |
| Ghanaian | 252 | 0.0% |
| Greek | 2,809 | 0.3% |
| Guamanian / Chamorro | 1,627 | 0.2% |
| Guatemalan | 3,759 | 0.4% |
| Guyanese | 117 | 0.0% |
| Haitian | 91 | 0.0% |
| Honduran | 3,301 | 0.3% |
| Houma | 53 | 0.0% |
| Hungarian | 1,623 | 0.2% |
| Icelander | 235 | 0.0% |
| Indian (Asian) | 100,490 | 10.0% |
| Indonesian | 1,066 | 0.1% |
| Inupiat | 237 | 0.0% |
| Iranian | 10,043 | 1.0% |
| Iraqi | 344 | 0.0% |
| Irish | 41,496 | 4.1% |
| Iroquois | 18 | 0.0% |
| Israeli | 764 | 0.1% |
| Italian | 32,436 | 3.2% |
| Jamaican | 566 | 0.1% |
| Japanese | 3,774 | 0.4% |
| Jordanian | 360 | 0.0% |
| Kenyan | 263 | 0.0% |
| Korean | 63,825 | 6.4% |
| Laotian | 985 | 0.1% |
| Latvian | 258 | 0.0% |
| Lebanese | 1,522 | 0.2% |
| Liberian | 17 | 0.0% |
| Lithuanian | 1,511 | 0.2% |
| Luxembourger | 44 | 0.0% |
| Macedonian | 95 | 0.0% |
| Malaysian | 1,891 | 0.2% |
| Maltese | 542 | 0.1% |
| Menominee | 5 | 0.0% |
| Mexican | 257,418 | 25.7% |
| Mexican American Indian | 5,024 | 0.5% |
| Mongolian | 381 | 0.0% |
| Moroccan | 143 | 0.0% |
| Native Hawaiian | 2,353 | 0.2% |
| Navajo | 752 | 0.1% |
| Nepalese | 37 | 0.0% |
| New Zealander | 37 | 0.0% |
| Nicaraguan | 3,471 | 0.4% |
| Nigerian | 719 | 0.1% |
| Northern European | 1,481 | 0.2% |
| Norwegian | 5,975 | 0.6% |
| Okinawan | 236 | 0.0% |
| Osage | 11 | 0.0% |
| Paiute | 109 | 0.0% |
| Pakistani | 1,282 | 0.1% |
| Palestinian | 939 | 0.1% |
| Panamanian | 613 | 0.1% |
| Paraguayan | 58 | 0.0% |
| Pennsylvania German | 29 | 0.0% |
| Peruvian | 2,767 | 0.3% |
| Pima | 75 | 0.0% |
| Polish | 7,723 | 0.8% |
| Portuguese | 10,501 | 1.1% |
| Potawatomi | 124 | 0.0% |
| Pueblo | 166 | 0.0% |
| Puerto Rican | 5,147 | 0.5% |
| Romanian | 988 | 0.1% |
| Russian | 7,561 | 0.8% |
| Salvadoran | 10,205 | 1.0% |
| Samoan | 1,709 | 0.2% |
| Scandinavian | 1,238 | 0.1% |
| Scotch-Irish | 2,659 | 0.3% |
| Scottish | 7,401 | 0.7% |
| Seminole | 17 | 0.0% |
| Serbian | 386 | 0.0% |
| Shoshone | 19 | 0.0% |
| Sierra Leonean | 289 | 0.0% |
| Sioux | 213 | 0.0% |
| Slavic | 382 | 0.0% |
| Slovak | 670 | 0.1% |
| Slovene | 183 | 0.0% |
| Somali | 66 | 0.0% |
| South African | 201 | 0.0% |
| South American | 9,424 | 0.9% |
| South American Indian | 235 | 0.0% |
| Spaniard | 3,916 | 0.4% |
| Spanish | 3,093 | 0.3% |
| Spanish American | 100 | 0.0% |
| Spanish American Indian | 45 | 0.0% |
| Sri Lankan | 123,520 | 12.3% |
| Subsaharan African | 8,279 | 0.8% |
| Sudanese | 56 | 0.0% |
| Swedish | 5,996 | 0.6% |
| Swiss | 1,810 | 0.2% |
| Syrian | 371 | 0.0% |
| Taiwanese | 245 | 0.0% |
| Thai | 76,780 | 7.7% |
| Tlingit-Haida | 13 | 0.0% |
| Tohono O'Odham | 189 | 0.0% |
| Tongan | 767 | 0.1% |
| Trinidadian and Tobagonian | 63 | 0.0% |
| Tsimshian | 150 | 0.0% |
| Turkish | 1,326 | 0.1% |
| Ugandan | 9 | 0.0% |
| Ukrainian | 2,697 | 0.3% |
| Uruguayan | 12 | 0.0% |
| Ute | 19 | 0.0% |
| Venezuelan | 556 | 0.1% |
| Vietnamese | 830 | 0.1% |
| Welsh | 2,276 | 0.2% |
| West Indian | 176 | 0.0% |
| Yaqui | 367 | 0.0% |
| Yugoslavian | 1,254 | 0.1% |
| Yuman | 31 | 0.0% |
| Yup'ik | 56 | 0.0% | View All 179 Rows |
Immigrants in San Jose
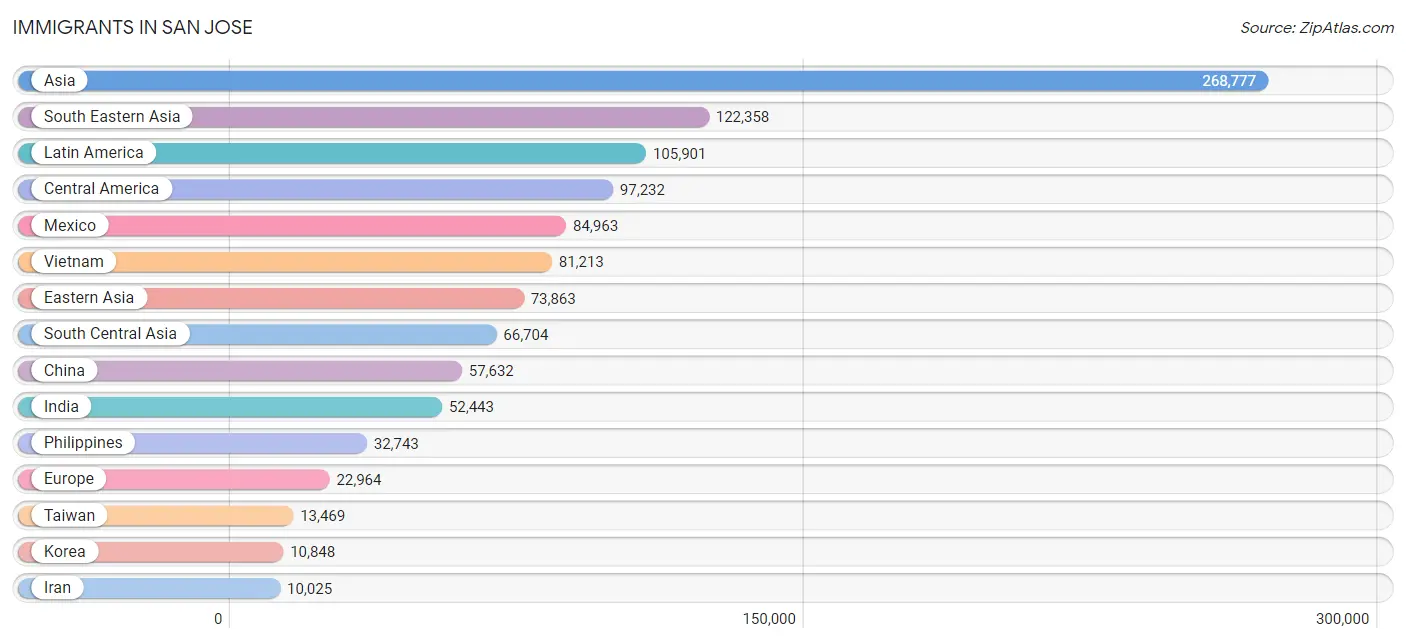
The most numerous immigrant groups reported in San Jose came from Asia (268,777 | 26.9%), South Eastern Asia (122,358 | 12.2%), Latin America (105,901 | 10.6%), Central America (97,232 | 9.7%), and Mexico (84,963 | 8.5%), together accounting for 67.8% of all San Jose residents.
| Immigration Origin | # Population | % Population |
| Afghanistan | 411 | 0.0% |
| Africa | 7,619 | 0.8% |
| Argentina | 701 | 0.1% |
| Armenia | 244 | 0.0% |
| Asia | 268,777 | 26.9% |
| Australia | 486 | 0.1% |
| Austria | 121 | 0.0% |
| Azores | 663 | 0.1% |
| Bangladesh | 583 | 0.1% |
| Barbados | 8 | 0.0% |
| Belarus | 505 | 0.1% |
| Belgium | 188 | 0.0% |
| Belize | 59 | 0.0% |
| Bolivia | 201 | 0.0% |
| Bosnia and Herzegovina | 816 | 0.1% |
| Brazil | 1,471 | 0.2% |
| Bulgaria | 209 | 0.0% |
| Cambodia | 1,795 | 0.2% |
| Cameroon | 162 | 0.0% |
| Canada | 3,299 | 0.3% |
| Caribbean | 797 | 0.1% |
| Central America | 97,232 | 9.7% |
| Chile | 905 | 0.1% |
| China | 57,632 | 5.8% |
| Colombia | 2,150 | 0.2% |
| Congo | 52 | 0.0% |
| Costa Rica | 161 | 0.0% |
| Croatia | 241 | 0.0% |
| Cuba | 376 | 0.0% |
| Czechoslovakia | 310 | 0.0% |
| Denmark | 90 | 0.0% |
| Dominica | 30 | 0.0% |
| Dominican Republic | 91 | 0.0% |
| Eastern Africa | 4,652 | 0.5% |
| Eastern Asia | 73,863 | 7.4% |
| Eastern Europe | 9,827 | 1.0% |
| Ecuador | 128 | 0.0% |
| Egypt | 927 | 0.1% |
| El Salvador | 5,245 | 0.5% |
| England | 1,178 | 0.1% |
| Eritrea | 802 | 0.1% |
| Ethiopia | 3,031 | 0.3% |
| Europe | 22,964 | 2.3% |
| Fiji | 740 | 0.1% |
| France | 1,808 | 0.2% |
| Germany | 1,864 | 0.2% |
| Ghana | 205 | 0.0% |
| Greece | 398 | 0.0% |
| Guatemala | 1,879 | 0.2% |
| Guyana | 65 | 0.0% |
| Haiti | 8 | 0.0% |
| Honduras | 2,454 | 0.3% |
| Hong Kong | 4,468 | 0.4% |
| Hungary | 235 | 0.0% |
| India | 52,443 | 5.2% |
| Indonesia | 1,080 | 0.1% |
| Iran | 10,025 | 1.0% |
| Iraq | 669 | 0.1% |
| Ireland | 373 | 0.0% |
| Israel | 1,004 | 0.1% |
| Italy | 787 | 0.1% |
| Jamaica | 185 | 0.0% |
| Japan | 4,972 | 0.5% |
| Jordan | 355 | 0.0% |
| Kazakhstan | 267 | 0.0% |
| Kenya | 393 | 0.0% |
| Korea | 10,848 | 1.1% |
| Kuwait | 205 | 0.0% |
| Laos | 1,453 | 0.2% |
| Latin America | 105,901 | 10.6% |
| Latvia | 112 | 0.0% |
| Lebanon | 730 | 0.1% |
| Liberia | 7 | 0.0% |
| Lithuania | 227 | 0.0% |
| Malaysia | 1,408 | 0.1% |
| Mexico | 84,963 | 8.5% |
| Middle Africa | 267 | 0.0% |
| Moldova | 138 | 0.0% |
| Morocco | 93 | 0.0% |
| Nepal | 211 | 0.0% |
| Netherlands | 417 | 0.0% |
| Nicaragua | 2,099 | 0.2% |
| Nigeria | 334 | 0.0% |
| North Macedonia | 27 | 0.0% |
| Northern Africa | 1,256 | 0.1% |
| Northern Europe | 4,482 | 0.4% |
| Norway | 68 | 0.0% |
| Oceania | 1,983 | 0.2% |
| Pakistan | 2,202 | 0.2% |
| Panama | 308 | 0.0% |
| Peru | 1,727 | 0.2% |
| Philippines | 32,743 | 3.3% |
| Poland | 659 | 0.1% |
| Portugal | 2,359 | 0.2% |
| Romania | 549 | 0.1% |
| Russia | 3,443 | 0.3% |
| Saudi Arabia | 403 | 0.0% |
| Scotland | 213 | 0.0% |
| Serbia | 166 | 0.0% |
| Sierra Leone | 306 | 0.0% |
| Singapore | 630 | 0.1% |
| Somalia | 92 | 0.0% |
| South Africa | 309 | 0.0% |
| South America | 7,872 | 0.8% |
| South Central Asia | 66,704 | 6.7% |
| South Eastern Asia | 122,358 | 12.2% |
| Southern Europe | 3,980 | 0.4% |
| Spain | 377 | 0.0% |
| Sri Lanka | 337 | 0.0% |
| Sudan | 95 | 0.0% |
| Sweden | 456 | 0.1% |
| Switzerland | 235 | 0.0% |
| Syria | 220 | 0.0% |
| Taiwan | 13,469 | 1.3% |
| Thailand | 1,091 | 0.1% |
| Trinidad and Tobago | 58 | 0.0% |
| Turkey | 803 | 0.1% |
| Uganda | 39 | 0.0% |
| Ukraine | 1,671 | 0.2% |
| Uruguay | 12 | 0.0% |
| Uzbekistan | 135 | 0.0% |
| Venezuela | 432 | 0.0% |
| Vietnam | 81,213 | 8.1% |
| Western Africa | 859 | 0.1% |
| Western Asia | 5,487 | 0.5% |
| Western Europe | 4,633 | 0.5% |
| Yemen | 23 | 0.0% |
| Zaire | 25 | 0.0% |
| Zimbabwe | 93 | 0.0% | View All 129 Rows |
Sex and Age in San Jose
Sex and Age in San Jose
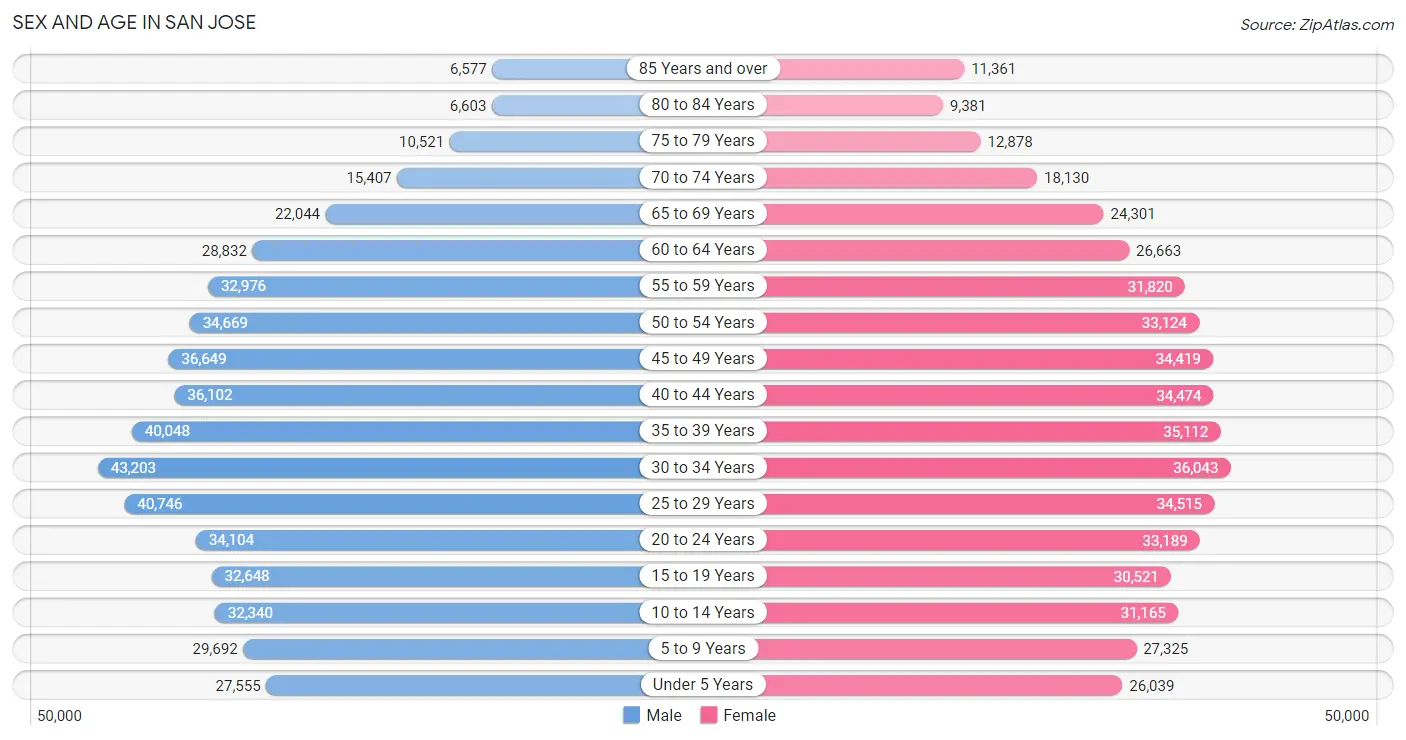
The most populous age groups in San Jose are 30 to 34 Years (43,203 | 8.5%) for men and 30 to 34 Years (36,043 | 7.3%) for women.
| Age Bracket | Male | Female |
| Under 5 Years | 27,555 (5.4%) | 26,039 (5.3%) |
| 5 to 9 Years | 29,692 (5.8%) | 27,325 (5.6%) |
| 10 to 14 Years | 32,340 (6.3%) | 31,165 (6.4%) |
| 15 to 19 Years | 32,648 (6.4%) | 30,521 (6.2%) |
| 20 to 24 Years | 34,104 (6.7%) | 33,189 (6.8%) |
| 25 to 29 Years | 40,746 (8.0%) | 34,515 (7.0%) |
| 30 to 34 Years | 43,203 (8.5%) | 36,043 (7.3%) |
| 35 to 39 Years | 40,048 (7.8%) | 35,112 (7.2%) |
| 40 to 44 Years | 36,102 (7.1%) | 34,474 (7.0%) |
| 45 to 49 Years | 36,649 (7.2%) | 34,419 (7.0%) |
| 50 to 54 Years | 34,669 (6.8%) | 33,124 (6.8%) |
| 55 to 59 Years | 32,976 (6.5%) | 31,820 (6.5%) |
| 60 to 64 Years | 28,832 (5.7%) | 26,663 (5.4%) |
| 65 to 69 Years | 22,044 (4.3%) | 24,301 (5.0%) |
| 70 to 74 Years | 15,407 (3.0%) | 18,130 (3.7%) |
| 75 to 79 Years | 10,521 (2.1%) | 12,878 (2.6%) |
| 80 to 84 Years | 6,603 (1.3%) | 9,381 (1.9%) |
| 85 Years and over | 6,577 (1.3%) | 11,361 (2.3%) |
| Total | 510,716 (100.0%) | 490,460 (100.0%) |
Families and Households in San Jose
Median Family Size in San Jose
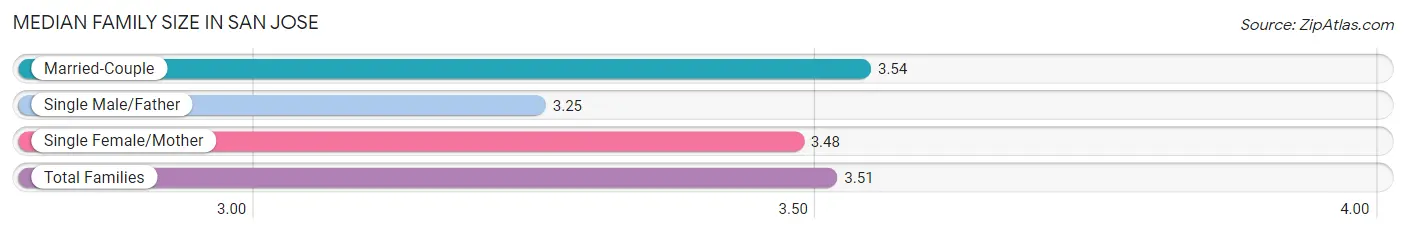
The median family size in San Jose is 3.51 persons per family, with married-couple families (175,166 | 75.1%) accounting for the largest median family size of 3.54 persons per family. On the other hand, single male/father families (19,951 | 8.6%) represent the smallest median family size with 3.25 persons per family.
| Family Type | # Families | Family Size |
| Married-Couple | 175,166 (75.1%) | 3.54 |
| Single Male/Father | 19,951 (8.6%) | 3.25 |
| Single Female/Mother | 38,172 (16.4%) | 3.48 |
| Total Families | 233,289 (100.0%) | 3.51 |
Median Household Size in San Jose
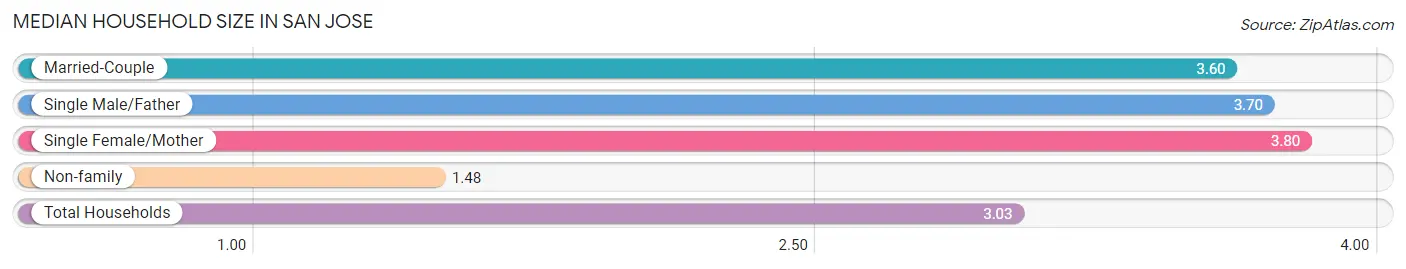
The median household size in San Jose is 3.03 persons per household, with single female/mother households (38,172 | 11.7%) accounting for the largest median household size of 3.8 persons per household. non-family households (91,553 | 28.2%) represent the smallest median household size with 1.48 persons per household.
| Household Type | # Households | Household Size |
| Married-Couple | 175,166 (53.9%) | 3.60 |
| Single Male/Father | 19,951 (6.1%) | 3.70 |
| Single Female/Mother | 38,172 (11.7%) | 3.80 |
| Non-family | 91,553 (28.2%) | 1.48 |
| Total Households | 324,842 (100.0%) | 3.03 |
Household Size by Marriage Status in San Jose
Out of a total of 324,842 households in San Jose, 233,289 (71.8%) are family households, while 91,553 (28.2%) are nonfamily households. The most numerous type of family households are 2-person households, comprising 75,831, and the most common type of nonfamily households are 1-person households, comprising 65,708.
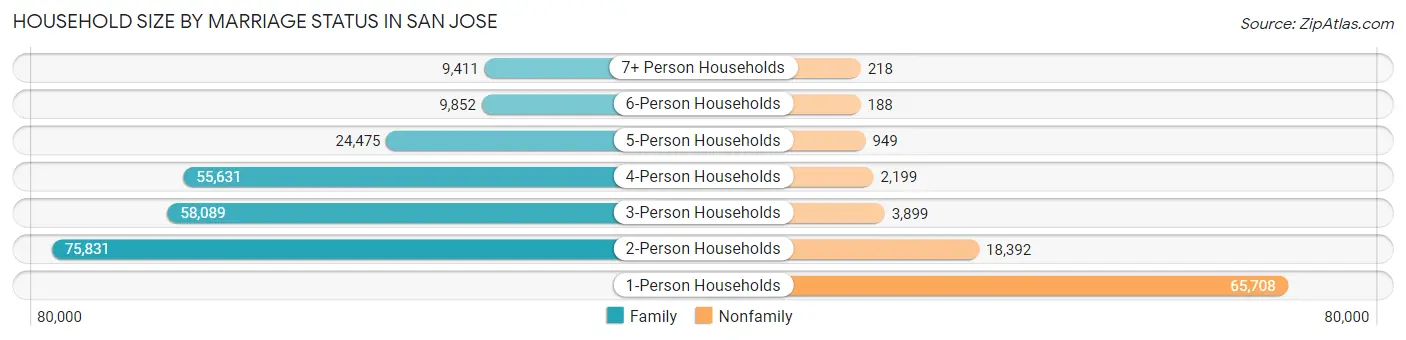
| Household Size | Family Households | Nonfamily Households |
| 1-Person Households | - | 65,708 (20.2%) |
| 2-Person Households | 75,831 (23.3%) | 18,392 (5.7%) |
| 3-Person Households | 58,089 (17.9%) | 3,899 (1.2%) |
| 4-Person Households | 55,631 (17.1%) | 2,199 (0.7%) |
| 5-Person Households | 24,475 (7.5%) | 949 (0.3%) |
| 6-Person Households | 9,852 (3.0%) | 188 (0.1%) |
| 7+ Person Households | 9,411 (2.9%) | 218 (0.1%) |
| Total | 233,289 (71.8%) | 91,553 (28.2%) |
Female Fertility in San Jose
Fertility by Age in San Jose
Average fertility rate in San Jose is 45.0 births per 1,000 women. Women in the age bracket of 20 to 34 years have the highest fertility rate with 59.0 births per 1,000 women. Women in the age bracket of 20 to 34 years acount for 55.5% of all women with births.
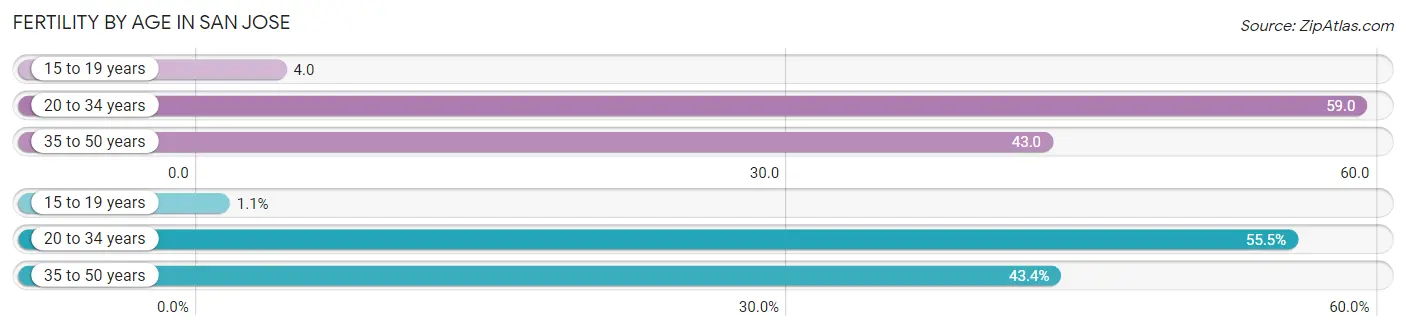
| Age Bracket | Women with Births | Births / 1,000 Women |
| 15 to 19 years | 123 (1.1%) | 4.0 |
| 20 to 34 years | 6,126 (55.5%) | 59.0 |
| 35 to 50 years | 4,795 (43.4%) | 43.0 |
| Total | 11,044 (100.0%) | 45.0 |
Fertility by Age by Marriage Status in San Jose
80.0% of women with births (11,044) in San Jose are married. The highest percentage of unmarried women with births falls into 15 to 19 years age bracket with 100.0% of them unmarried at the time of birth, while the lowest percentage of unmarried women with births belong to 35 to 50 years age bracket with 18.0% of them unmarried.
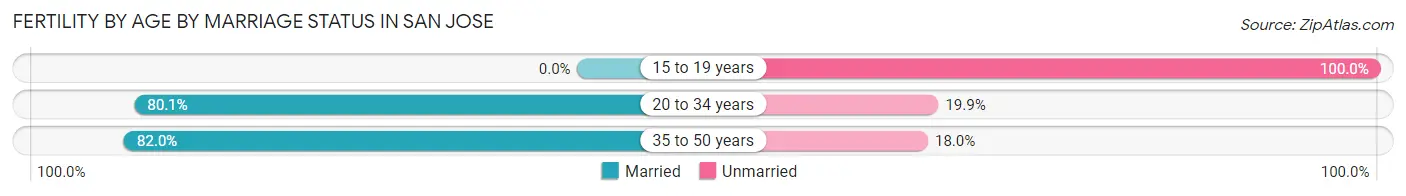
| Age Bracket | Married | Unmarried |
| 15 to 19 years | 0 (0.0%) | 123 (100.0%) |
| 20 to 34 years | 4,907 (80.1%) | 1,219 (19.9%) |
| 35 to 50 years | 3,932 (82.0%) | 863 (18.0%) |
| Total | 8,835 (80.0%) | 2,209 (20.0%) |
Fertility by Education in San Jose
Average fertility rate in San Jose is 45.0 births per 1,000 women. Women with the education attainment of graduate degree have the highest fertility rate of 72.0 births per 1,000 women, while women with the education attainment of less than high school have the lowest fertility at 26.0 births per 1,000 women. Women with the education attainment of bachelor's degree represent 28.5% of all women with births.
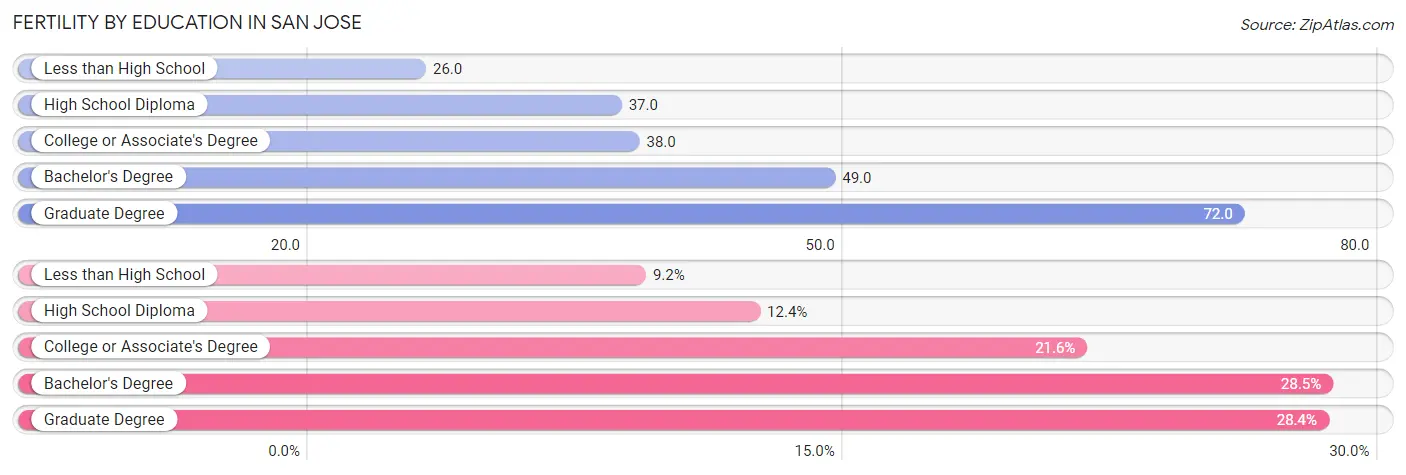
| Educational Attainment | Women with Births | Births / 1,000 Women |
| Less than High School | 1,014 (9.2%) | 26.0 |
| High School Diploma | 1,368 (12.4%) | 37.0 |
| College or Associate's Degree | 2,383 (21.6%) | 38.0 |
| Bachelor's Degree | 3,146 (28.5%) | 49.0 |
| Graduate Degree | 3,133 (28.4%) | 72.0 |
| Total | 11,044 (100.0%) | 45.0 |
Fertility by Education by Marriage Status in San Jose
20.0% of women with births in San Jose are unmarried. Women with the educational attainment of graduate degree are most likely to be married with 96.0% of them married at childbirth, while women with the educational attainment of high school diploma are least likely to be married with 48.5% of them unmarried at childbirth.
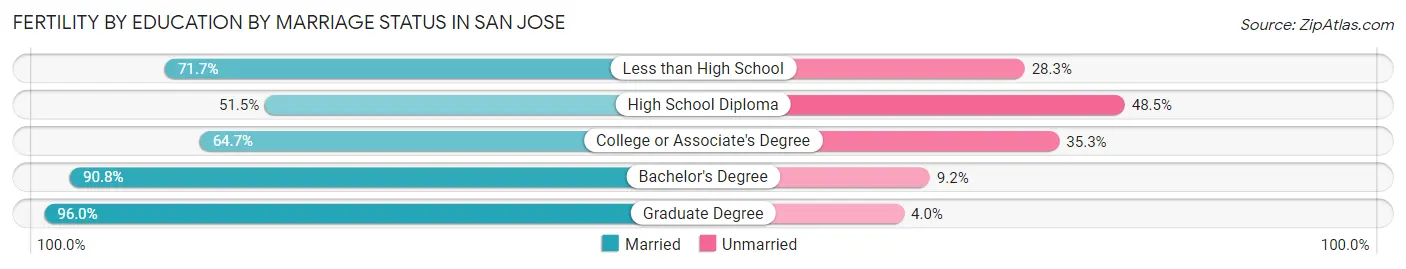
| Educational Attainment | Married | Unmarried |
| Less than High School | 727 (71.7%) | 287 (28.3%) |
| High School Diploma | 705 (51.5%) | 663 (48.5%) |
| College or Associate's Degree | 1,542 (64.7%) | 841 (35.3%) |
| Bachelor's Degree | 2,857 (90.8%) | 289 (9.2%) |
| Graduate Degree | 3,008 (96.0%) | 125 (4.0%) |
| Total | 8,835 (80.0%) | 2,209 (20.0%) |
Employment Characteristics in San Jose
Employment by Class of Employer in San Jose
Among the 509,270 employed individuals in San Jose, private company employees (384,752 | 75.5%), local government employees (37,239 | 7.3%), and not-for-profit organizations (30,804 | 6.0%) make up the most common classes of employment.
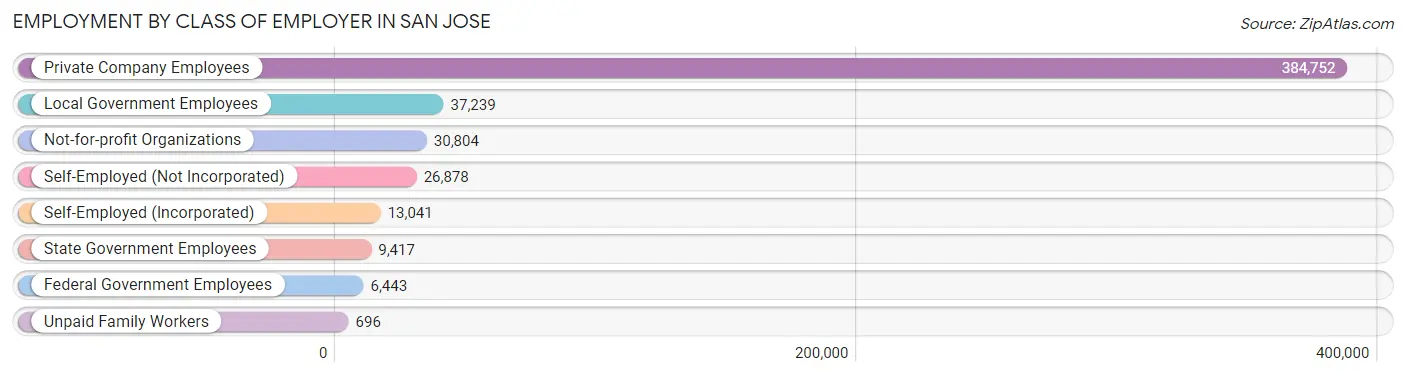
| Employer Class | # Employees | % Employees |
| Private Company Employees | 384,752 | 75.5% |
| Self-Employed (Incorporated) | 13,041 | 2.6% |
| Self-Employed (Not Incorporated) | 26,878 | 5.3% |
| Not-for-profit Organizations | 30,804 | 6.0% |
| Local Government Employees | 37,239 | 7.3% |
| State Government Employees | 9,417 | 1.8% |
| Federal Government Employees | 6,443 | 1.3% |
| Unpaid Family Workers | 696 | 0.1% |
| Total | 509,270 | 100.0% |
Employment Status by Age in San Jose
According to the labor force statistics for San Jose, out of the total population over 16 years of age (814,116), 67.9% or 552,785 individuals are in the labor force, with 4.7% or 25,981 of them unemployed. The age group with the highest labor force participation rate is 30 to 34 years, with 87.9% or 69,657 individuals in the labor force. Within the labor force, the 16 to 19 years age range has the highest percentage of unemployed individuals, with 11.0% or 1,602 of them being unemployed.
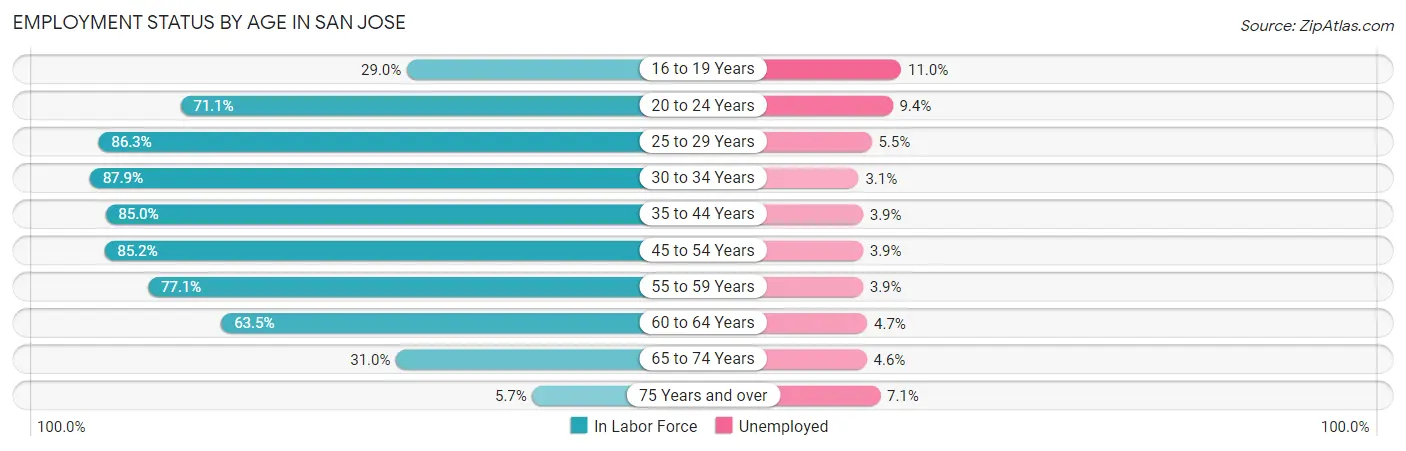
| Age Bracket | In Labor Force | Unemployed |
| 16 to 19 Years | 14,565 (29.0%) | 1,602 (11.0%) |
| 20 to 24 Years | 47,845 (71.1%) | 4,497 (9.4%) |
| 25 to 29 Years | 64,950 (86.3%) | 3,572 (5.5%) |
| 30 to 34 Years | 69,657 (87.9%) | 2,159 (3.1%) |
| 35 to 44 Years | 123,876 (85.0%) | 4,831 (3.9%) |
| 45 to 54 Years | 118,310 (85.2%) | 4,614 (3.9%) |
| 55 to 59 Years | 49,958 (77.1%) | 1,948 (3.9%) |
| 60 to 64 Years | 35,239 (63.5%) | 1,656 (4.7%) |
| 65 to 74 Years | 24,763 (31.0%) | 1,139 (4.6%) |
| 75 Years and over | 3,267 (5.7%) | 232 (7.1%) |
| Total | 552,785 (67.9%) | 25,981 (4.7%) |
Employment Status by Educational Attainment in San Jose
According to labor force statistics for San Jose, 82.6% of individuals (462,060) out of the total population between 25 and 64 years of age (559,395) are in the labor force, with 4.1% or 18,944 of them being unemployed. The group with the highest labor force participation rate are those with the educational attainment of bachelor's degree or higher, with 87.4% or 238,802 individuals in the labor force. Within the labor force, individuals with high school diploma education have the highest percentage of unemployment, with 5.5% or 3,727 of them being unemployed.
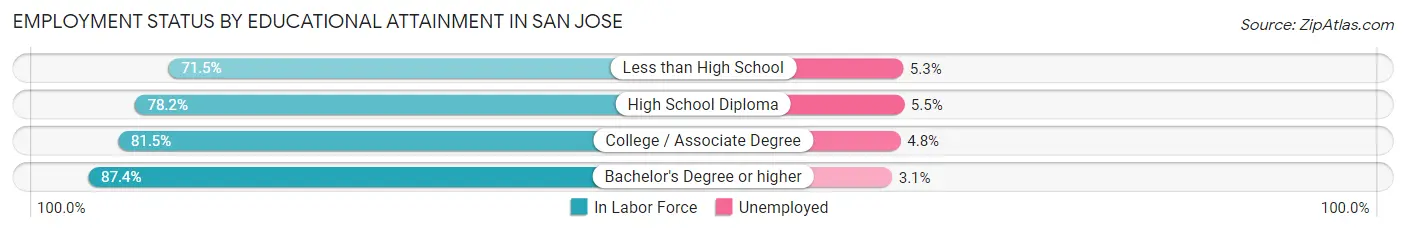
| Educational Attainment | In Labor Force | Unemployed |
| Less than High School | 51,053 (71.5%) | 3,784 (5.3%) |
| High School Diploma | 67,763 (78.2%) | 4,766 (5.5%) |
| College / Associate Degree | 104,409 (81.5%) | 6,149 (4.8%) |
| Bachelor's Degree or higher | 238,802 (87.4%) | 8,470 (3.1%) |
| Total | 462,060 (82.6%) | 22,935 (4.1%) |
Employment Occupations by Sex in San Jose
Management, Business, Science and Arts Occupations
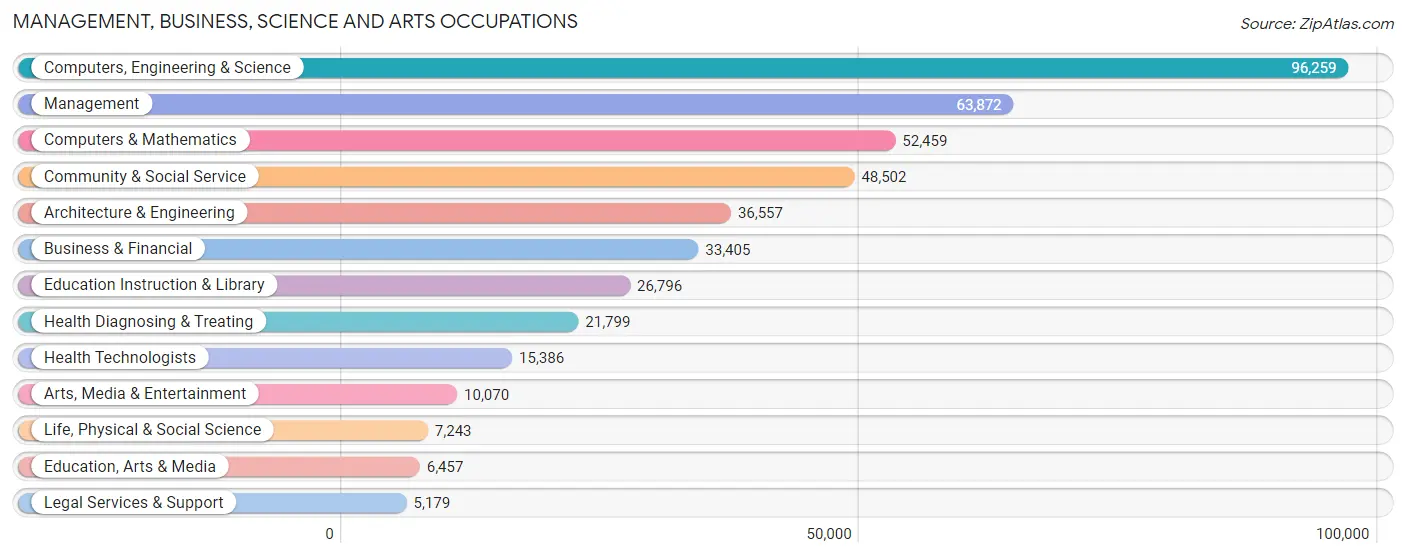
The most common Management, Business, Science and Arts occupations in San Jose are Computers, Engineering & Science (96,259 | 18.3%), Management (63,872 | 12.1%), Computers & Mathematics (52,459 | 10.0%), Community & Social Service (48,502 | 9.2%), and Architecture & Engineering (36,557 | 7.0%).
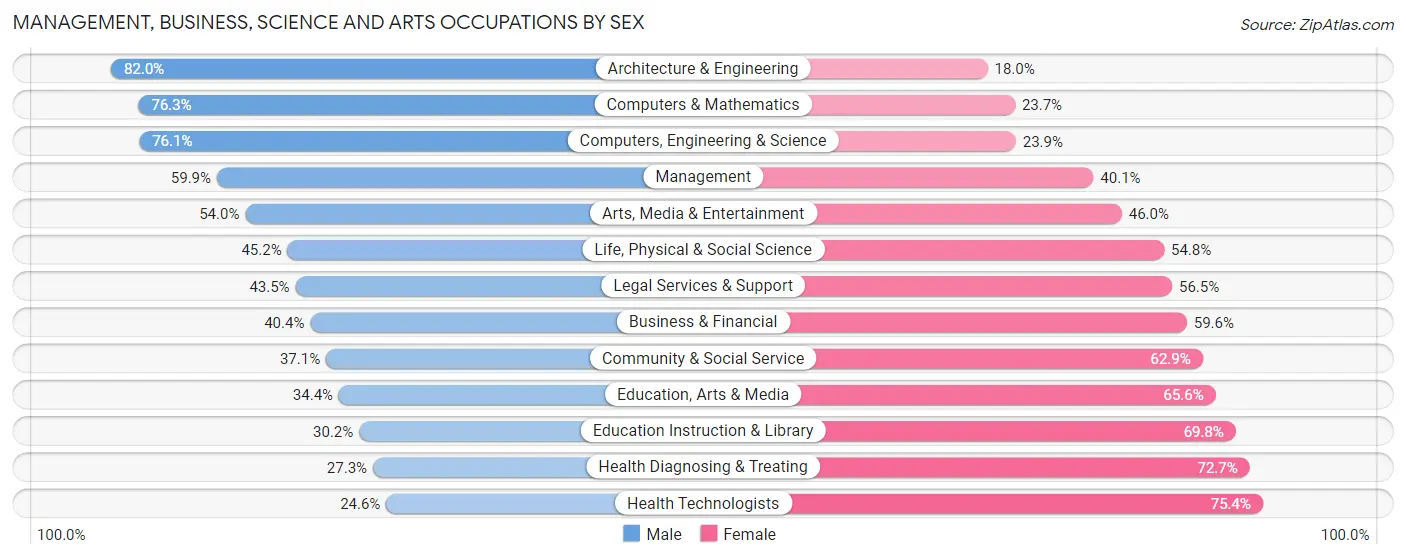
Management, Business, Science and Arts Occupations by Sex
Within the Management, Business, Science and Arts occupations in San Jose, the most male-oriented occupations are Architecture & Engineering (82.0%), Computers & Mathematics (76.3%), and Computers, Engineering & Science (76.1%), while the most female-oriented occupations are Health Technologists (75.4%), Health Diagnosing & Treating (72.7%), and Education Instruction & Library (69.8%).
| Occupation | Male | Female |
| Management | 38,262 (59.9%) | 25,610 (40.1%) |
| Business & Financial | 13,502 (40.4%) | 19,903 (59.6%) |
| Computers, Engineering & Science | 73,247 (76.1%) | 23,012 (23.9%) |
| Computers & Mathematics | 40,008 (76.3%) | 12,451 (23.7%) |
| Architecture & Engineering | 29,968 (82.0%) | 6,589 (18.0%) |
| Life, Physical & Social Science | 3,271 (45.2%) | 3,972 (54.8%) |
| Community & Social Service | 18,009 (37.1%) | 30,493 (62.9%) |
| Education, Arts & Media | 2,223 (34.4%) | 4,234 (65.6%) |
| Legal Services & Support | 2,253 (43.5%) | 2,926 (56.5%) |
| Education Instruction & Library | 8,098 (30.2%) | 18,698 (69.8%) |
| Arts, Media & Entertainment | 5,435 (54.0%) | 4,635 (46.0%) |
| Health Diagnosing & Treating | 5,959 (27.3%) | 15,840 (72.7%) |
| Health Technologists | 3,780 (24.6%) | 11,606 (75.4%) |
| Total (Category) | 148,979 (56.5%) | 114,858 (43.5%) |
| Total (Overall) | 293,810 (55.9%) | 232,134 (44.1%) |
Services Occupations
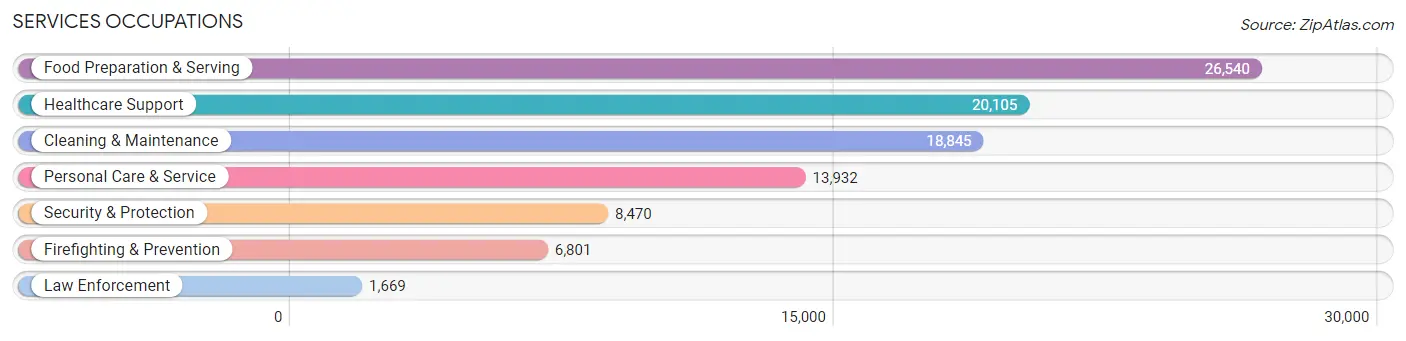
The most common Services occupations in San Jose are Food Preparation & Serving (26,540 | 5.1%), Healthcare Support (20,105 | 3.8%), Cleaning & Maintenance (18,845 | 3.6%), Personal Care & Service (13,932 | 2.6%), and Security & Protection (8,470 | 1.6%).
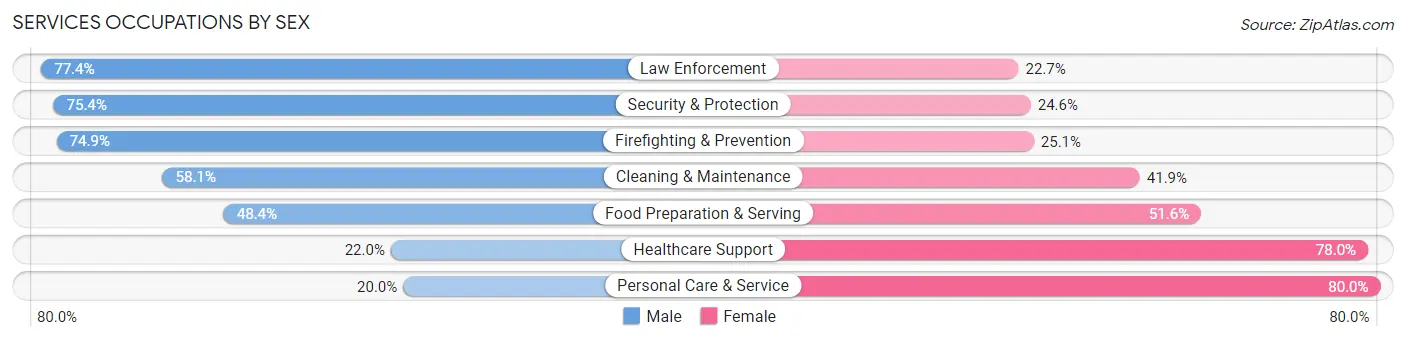
Services Occupations by Sex
Within the Services occupations in San Jose, the most male-oriented occupations are Law Enforcement (77.3%), Security & Protection (75.4%), and Firefighting & Prevention (74.9%), while the most female-oriented occupations are Personal Care & Service (80.0%), Healthcare Support (78.0%), and Food Preparation & Serving (51.6%).
| Occupation | Male | Female |
| Healthcare Support | 4,423 (22.0%) | 15,682 (78.0%) |
| Security & Protection | 6,386 (75.4%) | 2,084 (24.6%) |
| Firefighting & Prevention | 5,095 (74.9%) | 1,706 (25.1%) |
| Law Enforcement | 1,291 (77.3%) | 378 (22.7%) |
| Food Preparation & Serving | 12,855 (48.4%) | 13,685 (51.6%) |
| Cleaning & Maintenance | 10,954 (58.1%) | 7,891 (41.9%) |
| Personal Care & Service | 2,792 (20.0%) | 11,140 (80.0%) |
| Total (Category) | 37,410 (42.6%) | 50,482 (57.4%) |
| Total (Overall) | 293,810 (55.9%) | 232,134 (44.1%) |
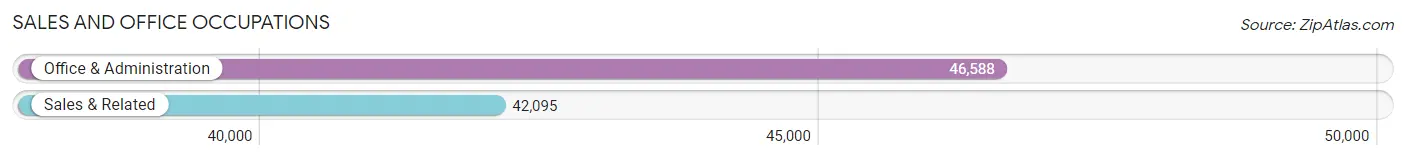
Sales and Office Occupations
The most common Sales and Office occupations in San Jose are Office & Administration (46,588 | 8.9%), and Sales & Related (42,095 | 8.0%).
Sales and Office Occupations by Sex
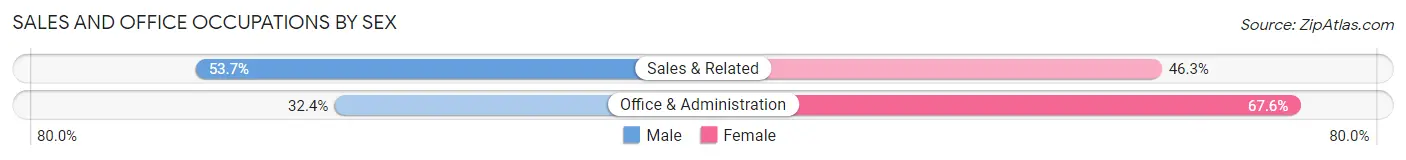
| Occupation | Male | Female |
| Sales & Related | 22,593 (53.7%) | 19,502 (46.3%) |
| Office & Administration | 15,086 (32.4%) | 31,502 (67.6%) |
| Total (Category) | 37,679 (42.5%) | 51,004 (57.5%) |
| Total (Overall) | 293,810 (55.9%) | 232,134 (44.1%) |
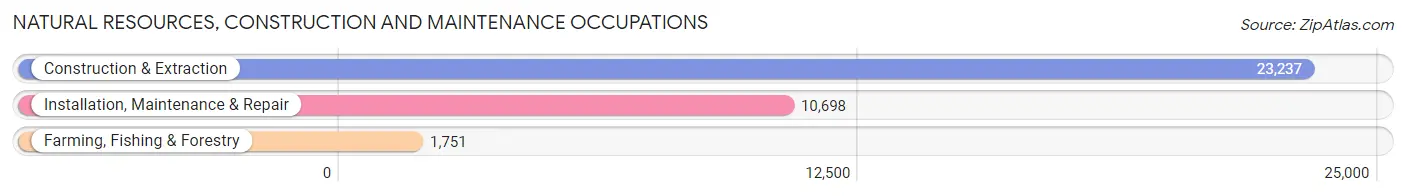
Natural Resources, Construction and Maintenance Occupations
The most common Natural Resources, Construction and Maintenance occupations in San Jose are Construction & Extraction (23,237 | 4.4%), Installation, Maintenance & Repair (10,698 | 2.0%), and Farming, Fishing & Forestry (1,751 | 0.3%).
Natural Resources, Construction and Maintenance Occupations by Sex
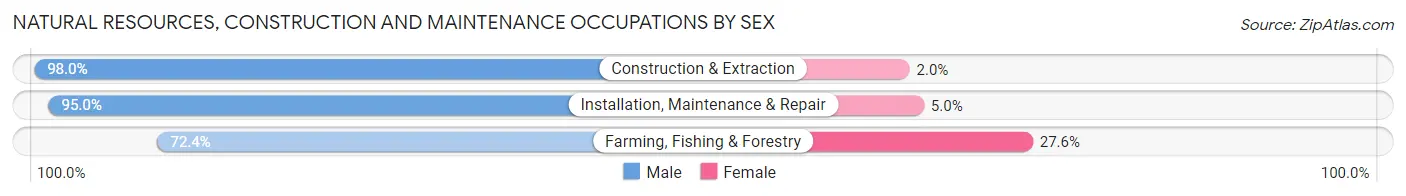
| Occupation | Male | Female |
| Farming, Fishing & Forestry | 1,267 (72.4%) | 484 (27.6%) |
| Construction & Extraction | 22,771 (98.0%) | 466 (2.0%) |
| Installation, Maintenance & Repair | 10,164 (95.0%) | 534 (5.0%) |
| Total (Category) | 34,202 (95.8%) | 1,484 (4.2%) |
| Total (Overall) | 293,810 (55.9%) | 232,134 (44.1%) |
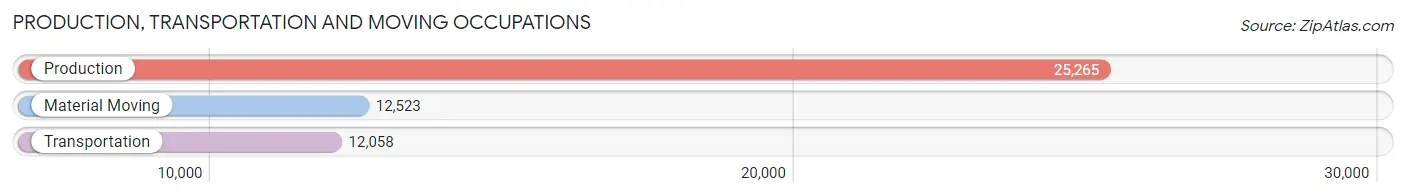
Production, Transportation and Moving Occupations
The most common Production, Transportation and Moving occupations in San Jose are Production (25,265 | 4.8%), Material Moving (12,523 | 2.4%), and Transportation (12,058 | 2.3%).
Production, Transportation and Moving Occupations by Sex
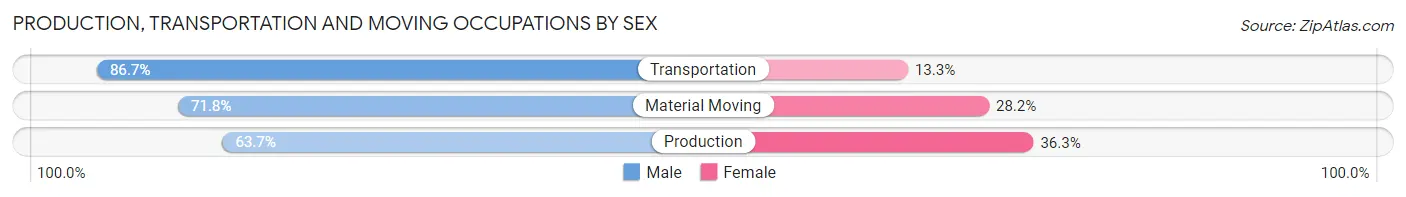
| Occupation | Male | Female |
| Production | 16,088 (63.7%) | 9,177 (36.3%) |
| Transportation | 10,456 (86.7%) | 1,602 (13.3%) |
| Material Moving | 8,996 (71.8%) | 3,527 (28.2%) |
| Total (Category) | 35,540 (71.3%) | 14,306 (28.7%) |
| Total (Overall) | 293,810 (55.9%) | 232,134 (44.1%) |
Employment Industries by Sex in San Jose
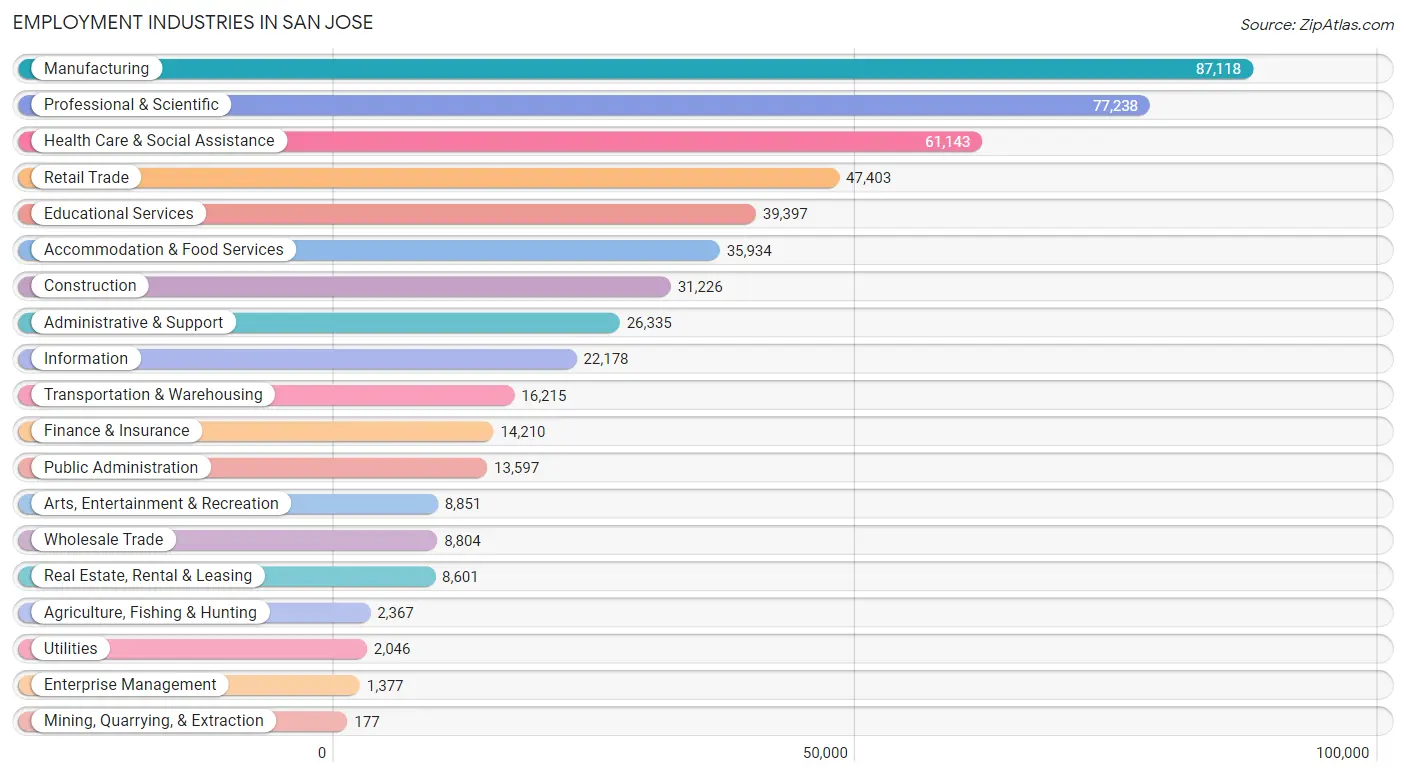
Employment Industries in San Jose
The major employment industries in San Jose include Manufacturing (87,118 | 16.6%), Professional & Scientific (77,238 | 14.7%), Health Care & Social Assistance (61,143 | 11.6%), Retail Trade (47,403 | 9.0%), and Educational Services (39,397 | 7.5%).
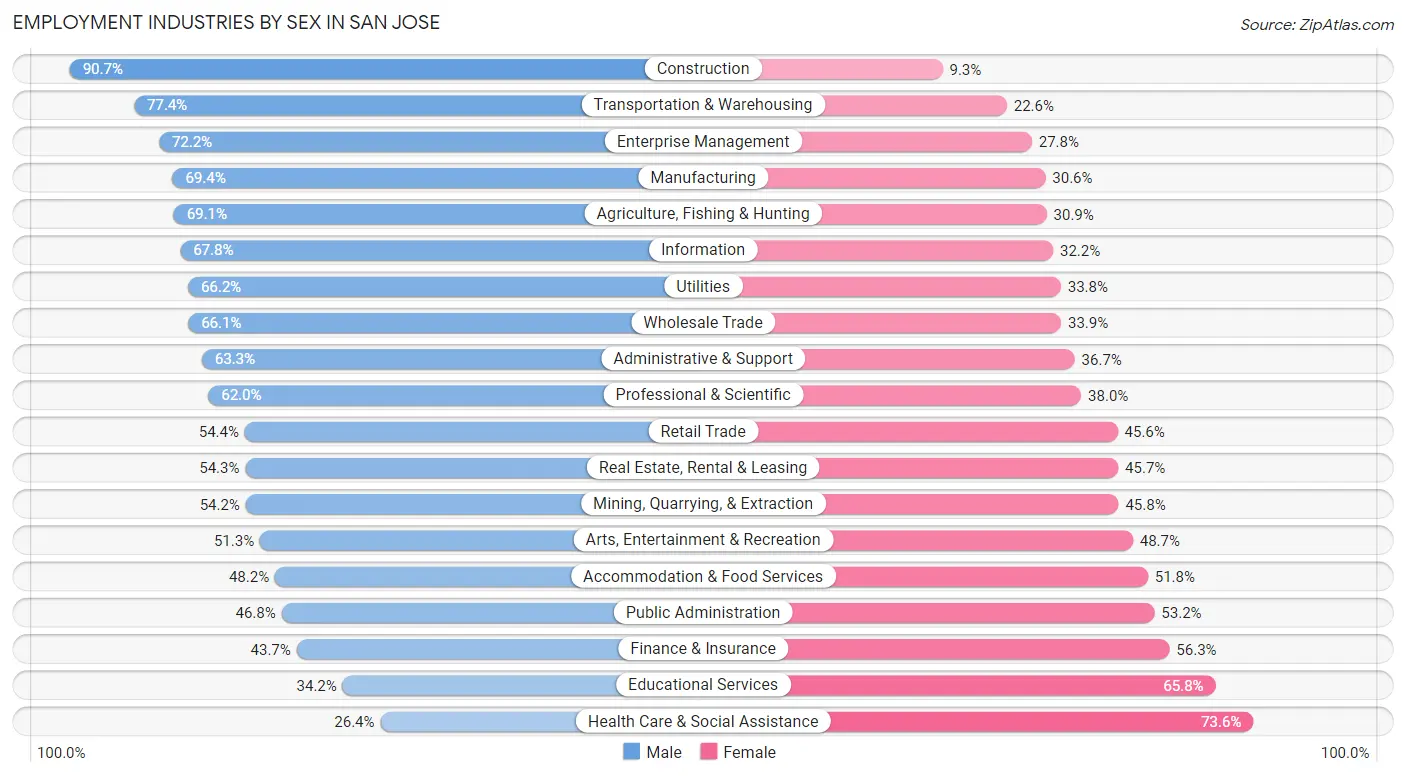
Employment Industries by Sex in San Jose
The San Jose industries that see more men than women are Construction (90.7%), Transportation & Warehousing (77.4%), and Enterprise Management (72.2%), whereas the industries that tend to have a higher number of women are Health Care & Social Assistance (73.6%), Educational Services (65.8%), and Finance & Insurance (56.3%).
| Industry | Male | Female |
| Agriculture, Fishing & Hunting | 1,636 (69.1%) | 731 (30.9%) |
| Mining, Quarrying, & Extraction | 96 (54.2%) | 81 (45.8%) |
| Construction | 28,310 (90.7%) | 2,916 (9.3%) |
| Manufacturing | 60,444 (69.4%) | 26,674 (30.6%) |
| Wholesale Trade | 5,822 (66.1%) | 2,982 (33.9%) |
| Retail Trade | 25,795 (54.4%) | 21,608 (45.6%) |
| Transportation & Warehousing | 12,544 (77.4%) | 3,671 (22.6%) |
| Utilities | 1,354 (66.2%) | 692 (33.8%) |
| Information | 15,033 (67.8%) | 7,145 (32.2%) |
| Finance & Insurance | 6,210 (43.7%) | 8,000 (56.3%) |
| Real Estate, Rental & Leasing | 4,671 (54.3%) | 3,930 (45.7%) |
| Professional & Scientific | 47,868 (62.0%) | 29,370 (38.0%) |
| Enterprise Management | 994 (72.2%) | 383 (27.8%) |
| Administrative & Support | 16,676 (63.3%) | 9,659 (36.7%) |
| Educational Services | 13,464 (34.2%) | 25,933 (65.8%) |
| Health Care & Social Assistance | 16,120 (26.4%) | 45,023 (73.6%) |
| Arts, Entertainment & Recreation | 4,539 (51.3%) | 4,312 (48.7%) |
| Accommodation & Food Services | 17,308 (48.2%) | 18,626 (51.8%) |
| Public Administration | 6,365 (46.8%) | 7,232 (53.2%) |
| Total | 293,810 (55.9%) | 232,134 (44.1%) |
Education in San Jose
School Enrollment in San Jose
The most common levels of schooling among the 259,627 students in San Jose are college / undergraduate (68,457 | 26.4%), high school (53,493 | 20.6%), and middle school (47,517 | 18.3%).
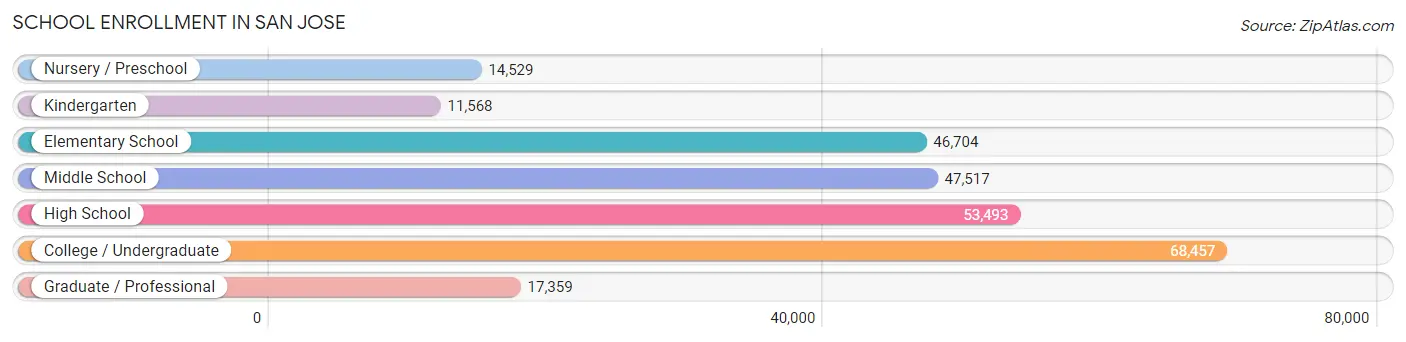
| School Level | # Students | % Students |
| Nursery / Preschool | 14,529 | 5.6% |
| Kindergarten | 11,568 | 4.5% |
| Elementary School | 46,704 | 18.0% |
| Middle School | 47,517 | 18.3% |
| High School | 53,493 | 20.6% |
| College / Undergraduate | 68,457 | 26.4% |
| Graduate / Professional | 17,359 | 6.7% |
| Total | 259,627 | 100.0% |
School Enrollment by Age by Funding Source in San Jose
Out of a total of 259,627 students who are enrolled in schools in San Jose, 43,877 (16.9%) attend a private institution, while the remaining 215,750 (83.1%) are enrolled in public schools. The age group of 3 to 4 year olds has the highest likelihood of being enrolled in private schools, with 7,319 (58.5% in the age bracket) enrolled. Conversely, the age group of 20 to 24 year olds has the lowest likelihood of being enrolled in a private school, with 31,542 (87.6% in the age bracket) attending a public institution.
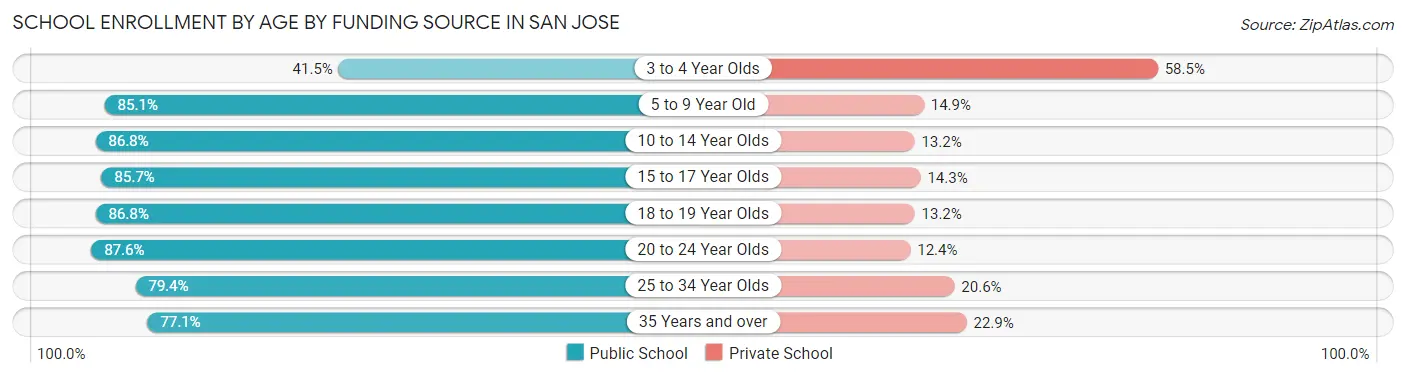
| Age Bracket | Public School | Private School |
| 3 to 4 Year Olds | 5,193 (41.5%) | 7,319 (58.5%) |
| 5 to 9 Year Old | 46,897 (85.1%) | 8,222 (14.9%) |
| 10 to 14 Year Olds | 54,211 (86.8%) | 8,240 (13.2%) |
| 15 to 17 Year Olds | 31,730 (85.7%) | 5,300 (14.3%) |
| 18 to 19 Year Olds | 18,795 (86.8%) | 2,861 (13.2%) |
| 20 to 24 Year Olds | 31,542 (87.6%) | 4,467 (12.4%) |
| 25 to 34 Year Olds | 16,521 (79.4%) | 4,295 (20.6%) |
| 35 Years and over | 10,823 (77.1%) | 3,211 (22.9%) |
| Total | 215,750 (83.1%) | 43,877 (16.9%) |
Educational Attainment by Field of Study in San Jose
Engineering (76,139 | 22.3%), business (55,277 | 16.2%), computers & mathematics (36,528 | 10.7%), science & technology (26,816 | 7.9%), and social sciences (24,516 | 7.2%) are the most common fields of study among 340,945 individuals in San Jose who have obtained a bachelor's degree or higher.
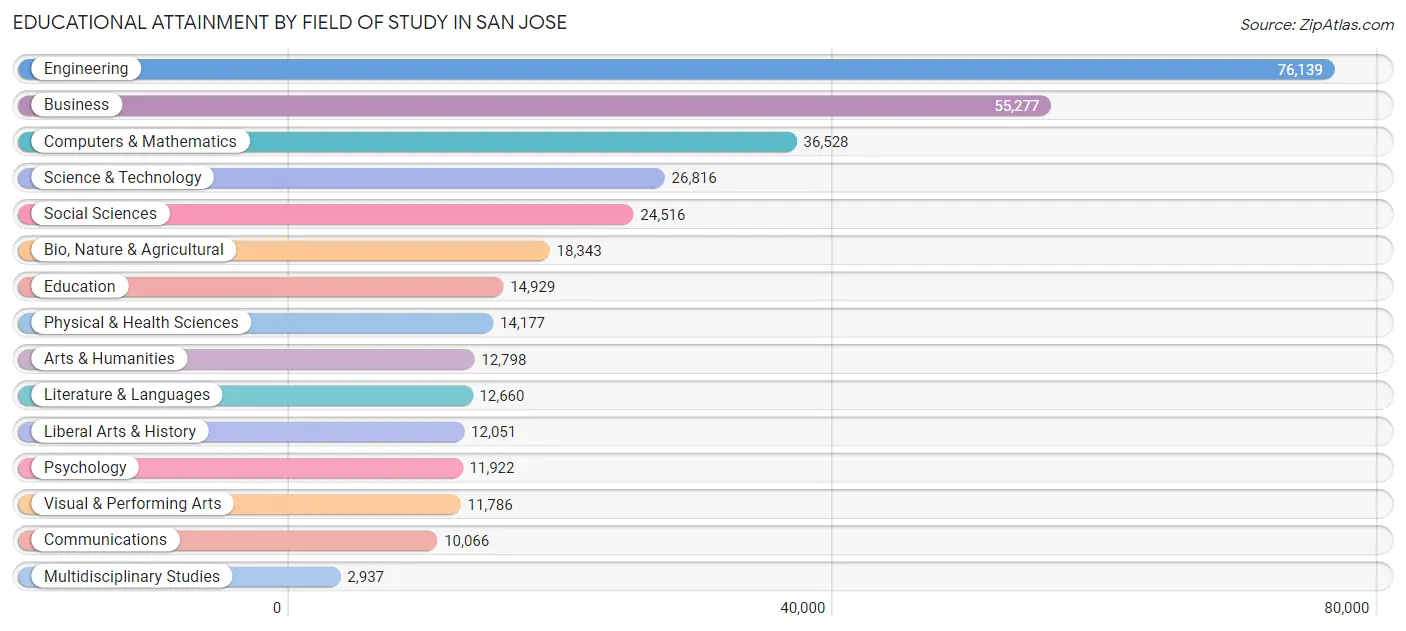
| Field of Study | # Graduates | % Graduates |
| Computers & Mathematics | 36,528 | 10.7% |
| Bio, Nature & Agricultural | 18,343 | 5.4% |
| Physical & Health Sciences | 14,177 | 4.2% |
| Psychology | 11,922 | 3.5% |
| Social Sciences | 24,516 | 7.2% |
| Engineering | 76,139 | 22.3% |
| Multidisciplinary Studies | 2,937 | 0.9% |
| Science & Technology | 26,816 | 7.9% |
| Business | 55,277 | 16.2% |
| Education | 14,929 | 4.4% |
| Literature & Languages | 12,660 | 3.7% |
| Liberal Arts & History | 12,051 | 3.5% |
| Visual & Performing Arts | 11,786 | 3.5% |
| Communications | 10,066 | 2.9% |
| Arts & Humanities | 12,798 | 3.7% |
| Total | 340,945 | 100.0% |
Transportation & Commute in San Jose
Vehicle Availability by Sex in San Jose
The most prevalent vehicle ownership categories in San Jose are males with 2 vehicles (107,122, accounting for 37.7%) and females with 2 vehicles (82,062, making up 48.4%).
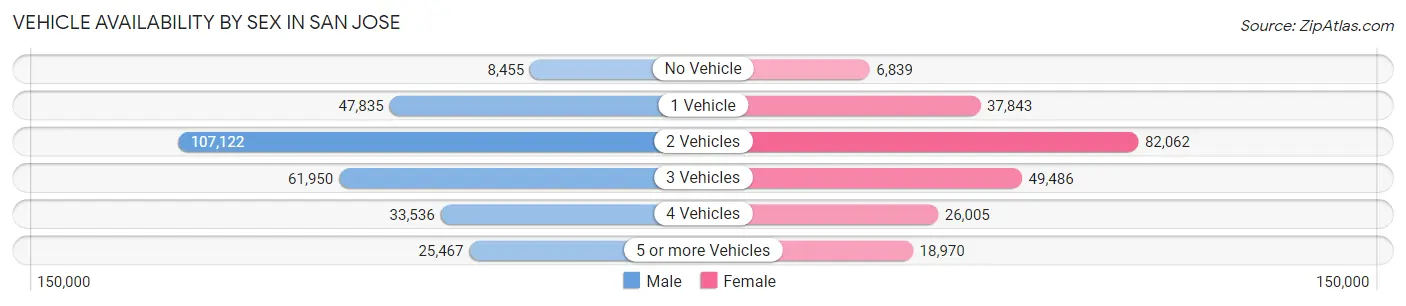
| Vehicles Available | Male | Female |
| No Vehicle | 8,455 (3.0%) | 6,839 (3.1%) |
| 1 Vehicle | 47,835 (16.8%) | 37,843 (17.1%) |
| 2 Vehicles | 107,122 (37.7%) | 82,062 (37.1%) |
| 3 Vehicles | 61,950 (21.8%) | 49,486 (22.4%) |
| 4 Vehicles | 33,536 (11.8%) | 26,005 (11.8%) |
| 5 or more Vehicles | 25,467 (9.0%) | 18,970 (8.6%) |
| Total | 284,365 (100.0%) | 221,205 (100.0%) |
Commute Time in San Jose
The most frequently occuring commute durations in San Jose are 30 to 34 minutes (76,150 commuters, 17.9%), 20 to 24 minutes (73,734 commuters, 17.3%), and 15 to 19 minutes (68,848 commuters, 16.2%).
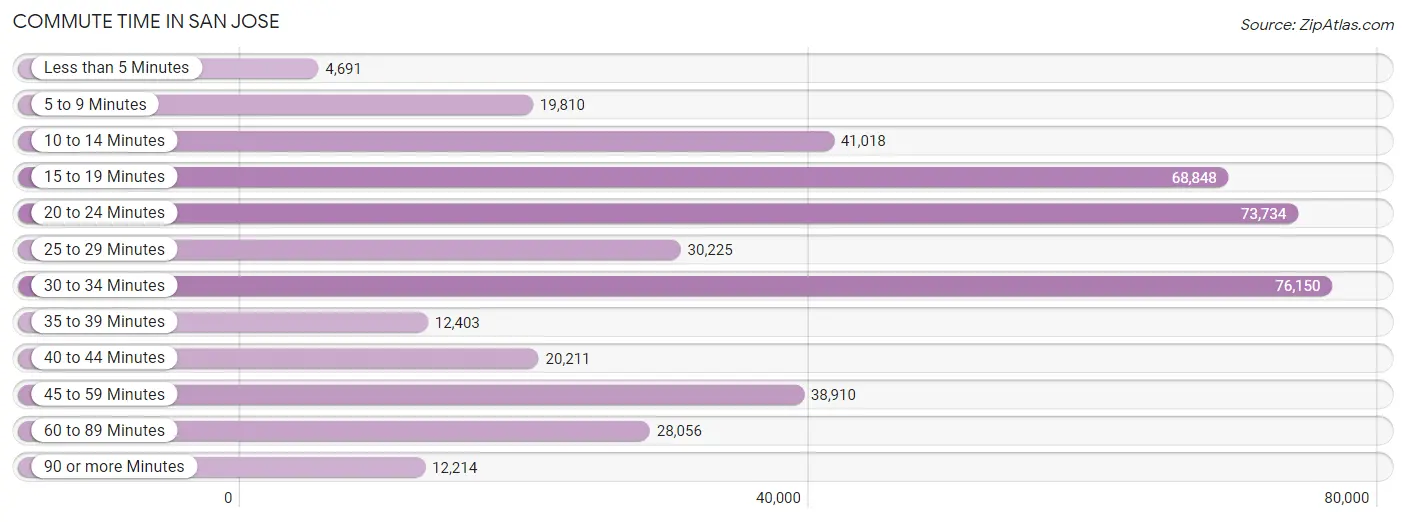
| Commute Time | # Commuters | % Commuters |
| Less than 5 Minutes | 4,691 | 1.1% |
| 5 to 9 Minutes | 19,810 | 4.6% |
| 10 to 14 Minutes | 41,018 | 9.6% |
| 15 to 19 Minutes | 68,848 | 16.2% |
| 20 to 24 Minutes | 73,734 | 17.3% |
| 25 to 29 Minutes | 30,225 | 7.1% |
| 30 to 34 Minutes | 76,150 | 17.9% |
| 35 to 39 Minutes | 12,403 | 2.9% |
| 40 to 44 Minutes | 20,211 | 4.7% |
| 45 to 59 Minutes | 38,910 | 9.1% |
| 60 to 89 Minutes | 28,056 | 6.6% |
| 90 or more Minutes | 12,214 | 2.9% |
Commute Time by Sex in San Jose
The most common commute times in San Jose are 30 to 34 minutes (44,889 commuters, 18.6%) for males and 20 to 24 minutes (32,128 commuters, 17.3%) for females.
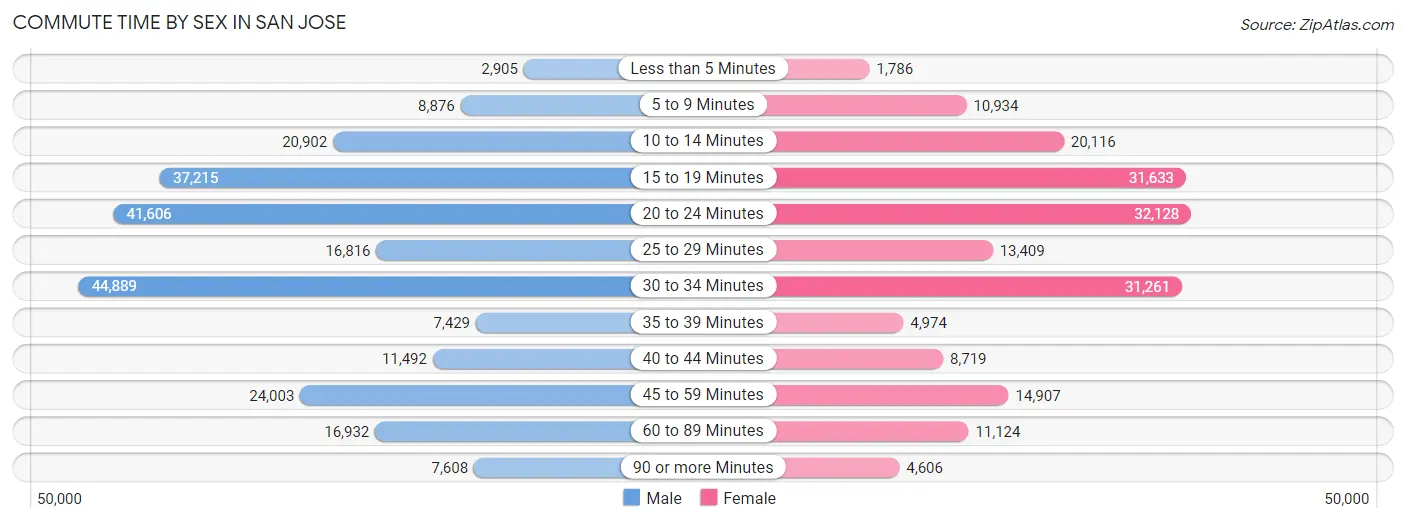
| Commute Time | Male | Female |
| Less than 5 Minutes | 2,905 (1.2%) | 1,786 (1.0%) |
| 5 to 9 Minutes | 8,876 (3.7%) | 10,934 (5.9%) |
| 10 to 14 Minutes | 20,902 (8.7%) | 20,116 (10.8%) |
| 15 to 19 Minutes | 37,215 (15.5%) | 31,633 (17.0%) |
| 20 to 24 Minutes | 41,606 (17.3%) | 32,128 (17.3%) |
| 25 to 29 Minutes | 16,816 (7.0%) | 13,409 (7.2%) |
| 30 to 34 Minutes | 44,889 (18.6%) | 31,261 (16.8%) |
| 35 to 39 Minutes | 7,429 (3.1%) | 4,974 (2.7%) |
| 40 to 44 Minutes | 11,492 (4.8%) | 8,719 (4.7%) |
| 45 to 59 Minutes | 24,003 (10.0%) | 14,907 (8.0%) |
| 60 to 89 Minutes | 16,932 (7.0%) | 11,124 (6.0%) |
| 90 or more Minutes | 7,608 (3.2%) | 4,606 (2.5%) |
Time of Departure to Work by Sex in San Jose
The most frequent times of departure to work in San Jose are 8:00 AM to 8:29 AM (31,720, 13.2%) for males and 8:00 AM to 8:29 AM (28,401, 15.3%) for females.
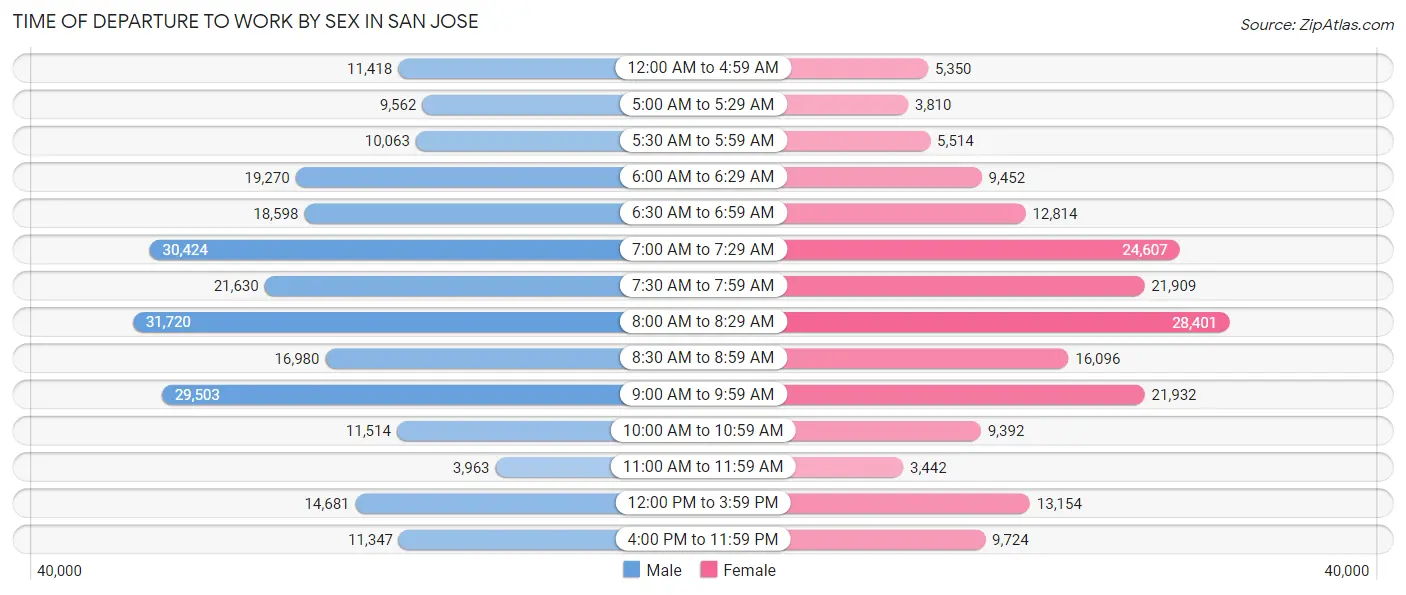
| Time of Departure | Male | Female |
| 12:00 AM to 4:59 AM | 11,418 (4.7%) | 5,350 (2.9%) |
| 5:00 AM to 5:29 AM | 9,562 (4.0%) | 3,810 (2.1%) |
| 5:30 AM to 5:59 AM | 10,063 (4.2%) | 5,514 (3.0%) |
| 6:00 AM to 6:29 AM | 19,270 (8.0%) | 9,452 (5.1%) |
| 6:30 AM to 6:59 AM | 18,598 (7.7%) | 12,814 (6.9%) |
| 7:00 AM to 7:29 AM | 30,424 (12.6%) | 24,607 (13.3%) |
| 7:30 AM to 7:59 AM | 21,630 (9.0%) | 21,909 (11.8%) |
| 8:00 AM to 8:29 AM | 31,720 (13.2%) | 28,401 (15.3%) |
| 8:30 AM to 8:59 AM | 16,980 (7.1%) | 16,096 (8.7%) |
| 9:00 AM to 9:59 AM | 29,503 (12.3%) | 21,932 (11.8%) |
| 10:00 AM to 10:59 AM | 11,514 (4.8%) | 9,392 (5.1%) |
| 11:00 AM to 11:59 AM | 3,963 (1.7%) | 3,442 (1.8%) |
| 12:00 PM to 3:59 PM | 14,681 (6.1%) | 13,154 (7.1%) |
| 4:00 PM to 11:59 PM | 11,347 (4.7%) | 9,724 (5.2%) |
| Total | 240,673 (100.0%) | 185,597 (100.0%) |
Housing Occupancy in San Jose
Occupancy by Ownership in San Jose
Of the total 324,842 dwellings in San Jose, owner-occupied units account for 181,299 (55.8%), while renter-occupied units make up 143,543 (44.2%).
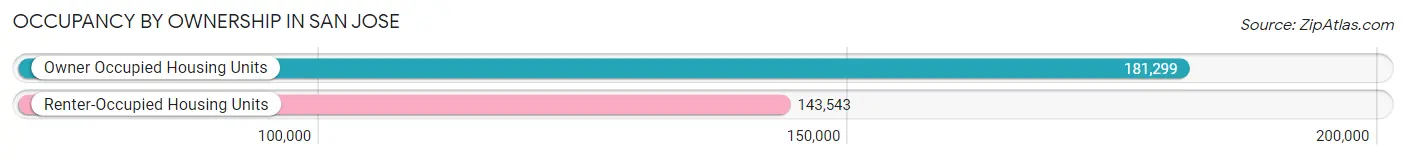
| Occupancy | # Housing Units | % Housing Units |
| Owner Occupied Housing Units | 181,299 | 55.8% |
| Renter-Occupied Housing Units | 143,543 | 44.2% |
| Total Occupied Housing Units | 324,842 | 100.0% |
Occupancy by Household Size in San Jose
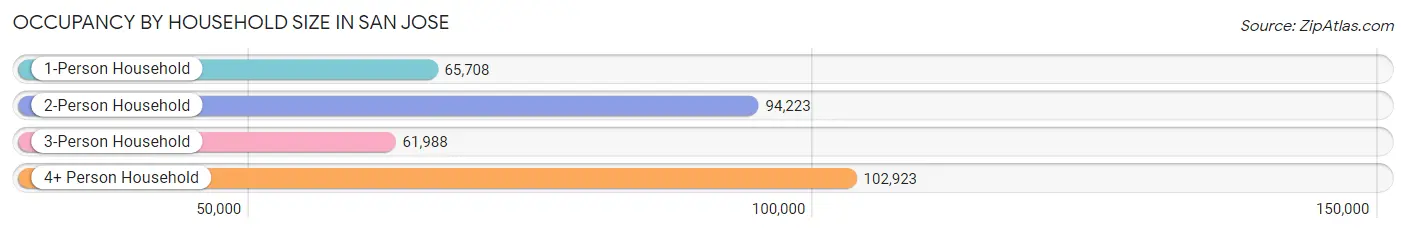
| Household Size | # Housing Units | % Housing Units |
| 1-Person Household | 65,708 | 20.2% |
| 2-Person Household | 94,223 | 29.0% |
| 3-Person Household | 61,988 | 19.1% |
| 4+ Person Household | 102,923 | 31.7% |
| Total Housing Units | 324,842 | 100.0% |
Occupancy by Ownership by Household Size in San Jose
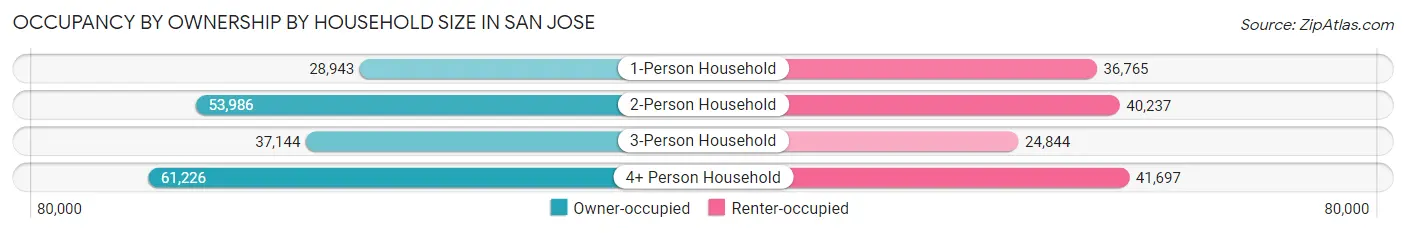
| Household Size | Owner-occupied | Renter-occupied |
| 1-Person Household | 28,943 (44.1%) | 36,765 (55.9%) |
| 2-Person Household | 53,986 (57.3%) | 40,237 (42.7%) |
| 3-Person Household | 37,144 (59.9%) | 24,844 (40.1%) |
| 4+ Person Household | 61,226 (59.5%) | 41,697 (40.5%) |
| Total Housing Units | 181,299 (55.8%) | 143,543 (44.2%) |
Occupancy by Educational Attainment in San Jose
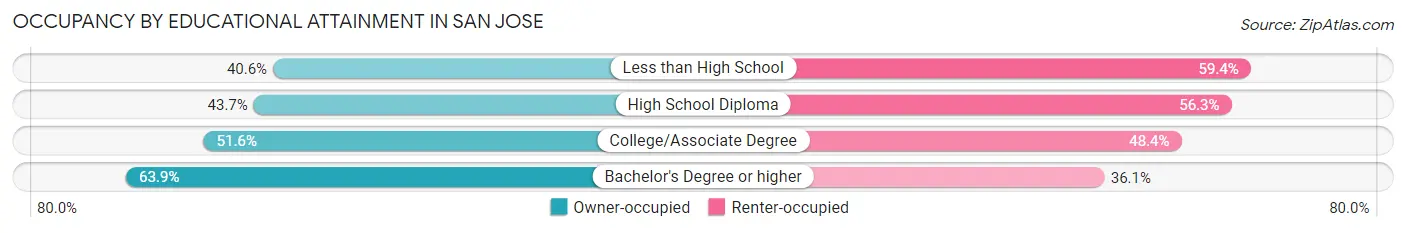
| Household Size | Owner-occupied | Renter-occupied |
| Less than High School | 14,273 (40.6%) | 20,876 (59.4%) |
| High School Diploma | 18,229 (43.7%) | 23,506 (56.3%) |
| College/Associate Degree | 40,440 (51.6%) | 37,939 (48.4%) |
| Bachelor's Degree or higher | 108,357 (63.9%) | 61,222 (36.1%) |
Occupancy by Age of Householder in San Jose
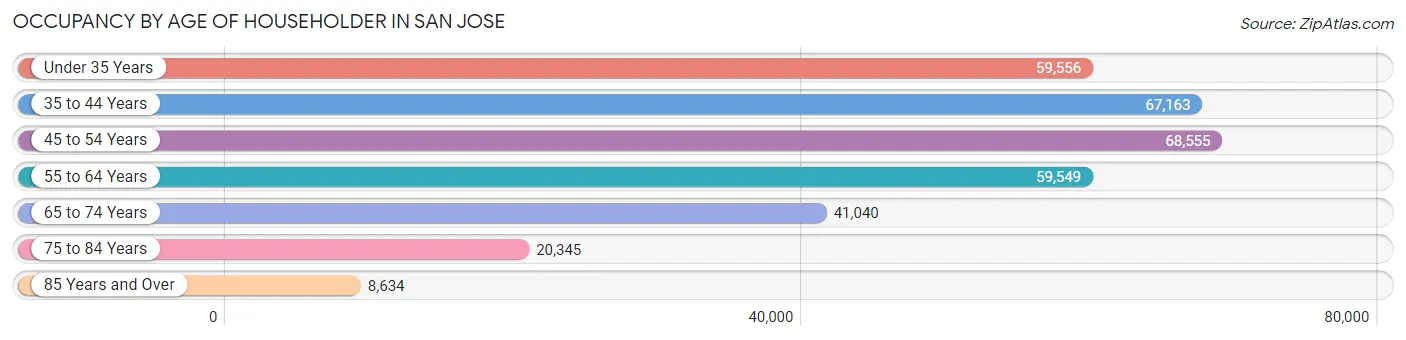
| Age Bracket | # Households | % Households |
| Under 35 Years | 59,556 | 18.3% |
| 35 to 44 Years | 67,163 | 20.7% |
| 45 to 54 Years | 68,555 | 21.1% |
| 55 to 64 Years | 59,549 | 18.3% |
| 65 to 74 Years | 41,040 | 12.6% |
| 75 to 84 Years | 20,345 | 6.3% |
| 85 Years and Over | 8,634 | 2.7% |
| Total | 324,842 | 100.0% |
Housing Finances in San Jose
Median Income by Occupancy in San Jose
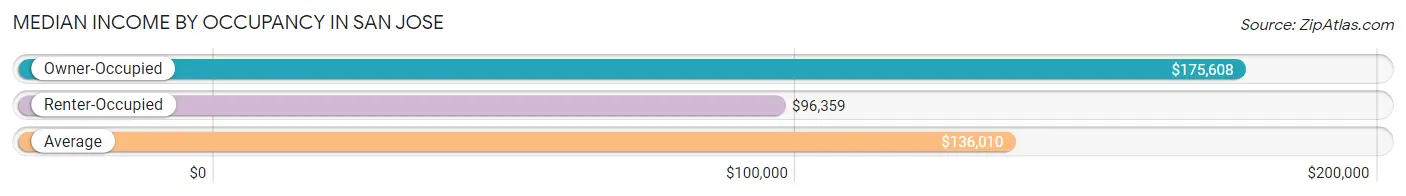
| Occupancy Type | # Households | Median Income |
| Owner-Occupied | 181,299 (55.8%) | $175,608 |
| Renter-Occupied | 143,543 (44.2%) | $96,359 |
| Average | 324,842 (100.0%) | $136,010 |
Occupancy by Householder Income Bracket in San Jose
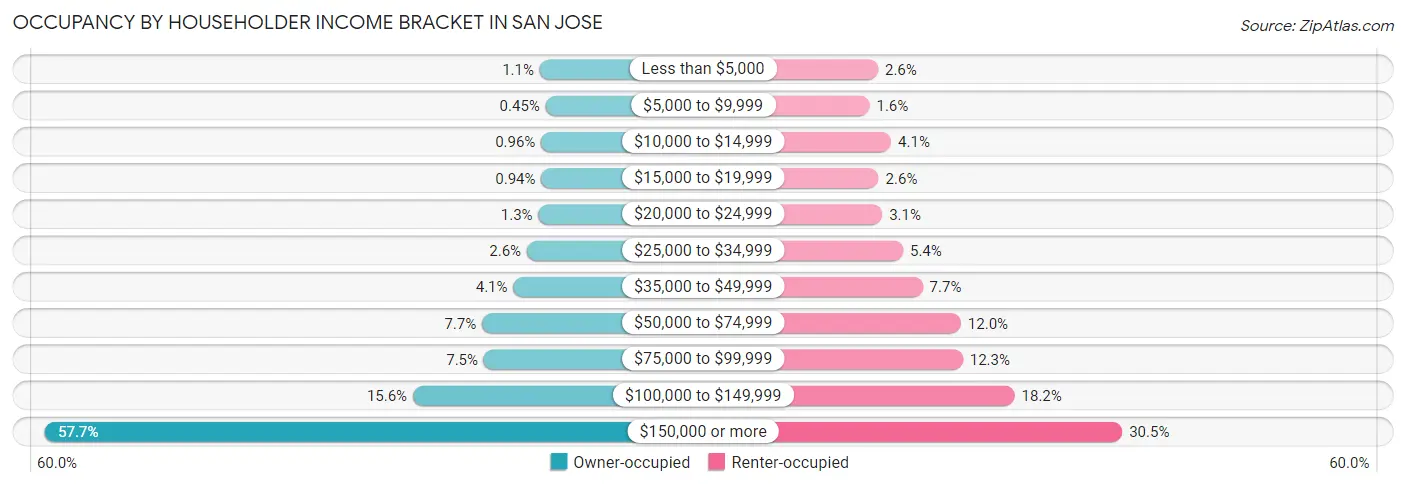
| Income Bracket | Owner-occupied | Renter-occupied |
| Less than $5,000 | 2,038 (1.1%) | 3,688 (2.6%) |
| $5,000 to $9,999 | 810 (0.4%) | 2,290 (1.6%) |
| $10,000 to $14,999 | 1,733 (1.0%) | 5,840 (4.1%) |
| $15,000 to $19,999 | 1,705 (0.9%) | 3,789 (2.6%) |
| $20,000 to $24,999 | 2,327 (1.3%) | 4,380 (3.0%) |
| $25,000 to $34,999 | 4,699 (2.6%) | 7,799 (5.4%) |
| $35,000 to $49,999 | 7,509 (4.1%) | 11,016 (7.7%) |
| $50,000 to $74,999 | 13,994 (7.7%) | 17,289 (12.0%) |
| $75,000 to $99,999 | 13,624 (7.5%) | 17,603 (12.3%) |
| $100,000 to $149,999 | 28,318 (15.6%) | 26,097 (18.2%) |
| $150,000 or more | 104,542 (57.7%) | 43,752 (30.5%) |
| Total | 181,299 (100.0%) | 143,543 (100.0%) |
Monthly Housing Cost Tiers in San Jose
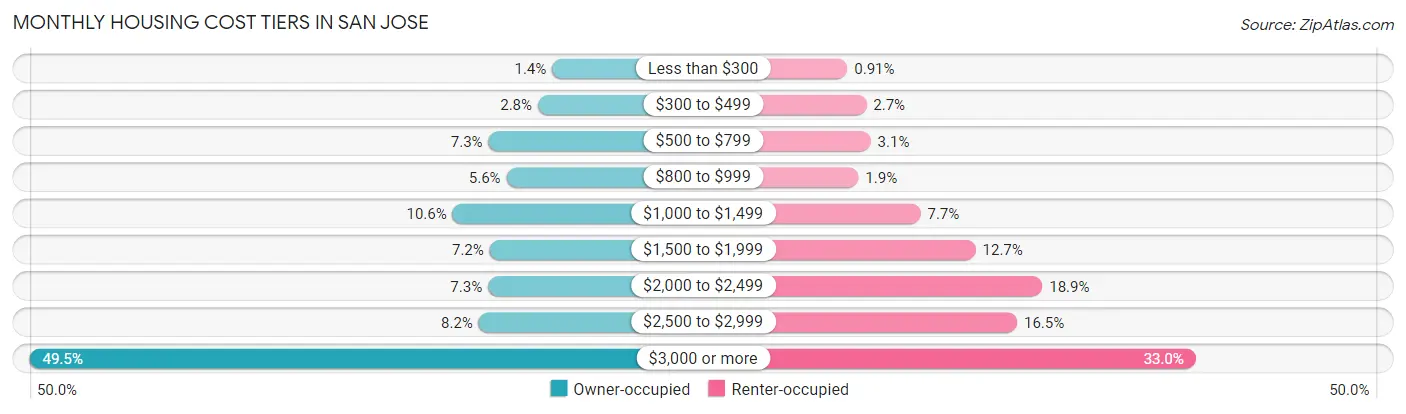
| Monthly Cost | Owner-occupied | Renter-occupied |
| Less than $300 | 2,611 (1.4%) | 1,310 (0.9%) |
| $300 to $499 | 4,989 (2.8%) | 3,822 (2.7%) |
| $500 to $799 | 13,232 (7.3%) | 4,389 (3.1%) |
| $800 to $999 | 10,231 (5.6%) | 2,777 (1.9%) |
| $1,000 to $1,499 | 19,225 (10.6%) | 10,987 (7.6%) |
| $1,500 to $1,999 | 13,037 (7.2%) | 18,260 (12.7%) |
| $2,000 to $2,499 | 13,299 (7.3%) | 27,071 (18.9%) |
| $2,500 to $2,999 | 14,859 (8.2%) | 23,739 (16.5%) |
| $3,000 or more | 89,816 (49.5%) | 47,343 (33.0%) |
| Total | 181,299 (100.0%) | 143,543 (100.0%) |
Physical Housing Characteristics in San Jose
Housing Structures in San Jose
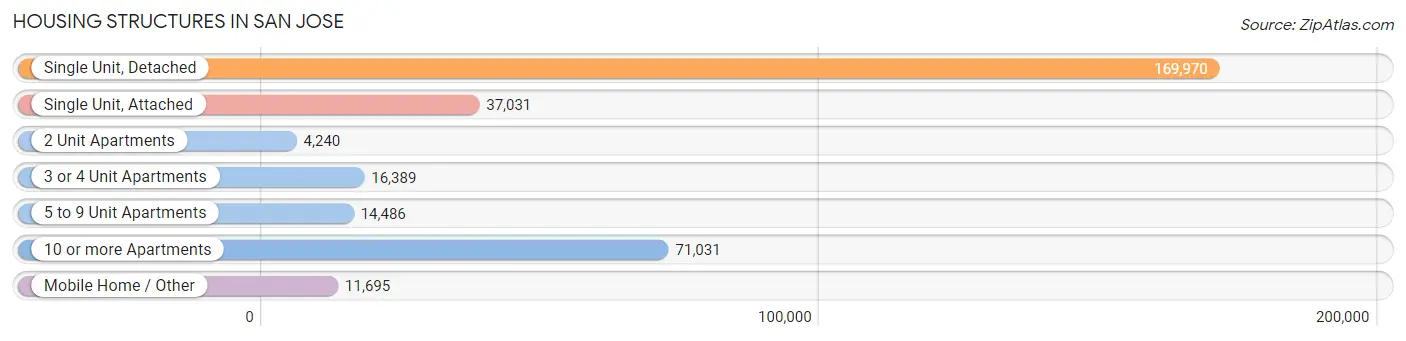
| Structure Type | # Housing Units | % Housing Units |
| Single Unit, Detached | 169,970 | 52.3% |
| Single Unit, Attached | 37,031 | 11.4% |
| 2 Unit Apartments | 4,240 | 1.3% |
| 3 or 4 Unit Apartments | 16,389 | 5.1% |
| 5 to 9 Unit Apartments | 14,486 | 4.5% |
| 10 or more Apartments | 71,031 | 21.9% |
| Mobile Home / Other | 11,695 | 3.6% |
| Total | 324,842 | 100.0% |
Housing Structures by Occupancy in San Jose
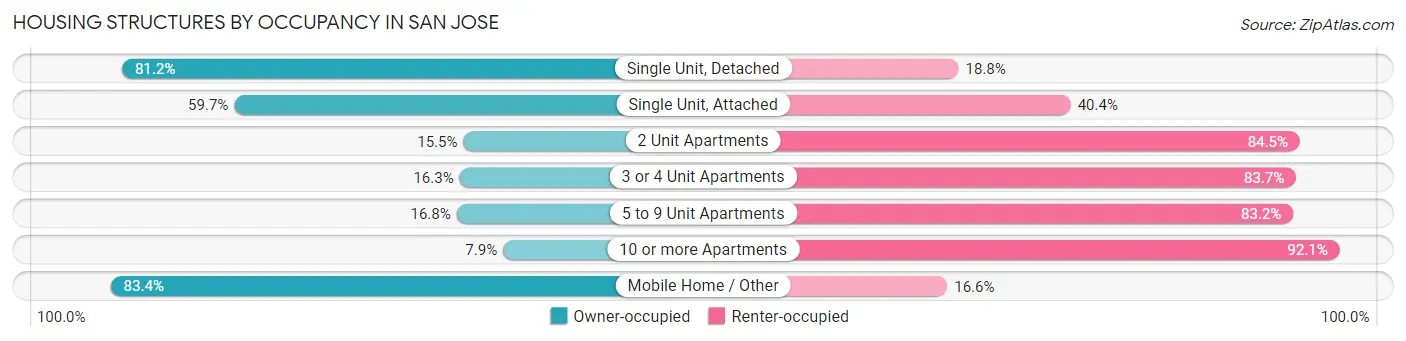
| Structure Type | Owner-occupied | Renter-occupied |
| Single Unit, Detached | 138,089 (81.2%) | 31,881 (18.8%) |
| Single Unit, Attached | 22,090 (59.7%) | 14,941 (40.4%) |
| 2 Unit Apartments | 659 (15.5%) | 3,581 (84.5%) |
| 3 or 4 Unit Apartments | 2,666 (16.3%) | 13,723 (83.7%) |
| 5 to 9 Unit Apartments | 2,438 (16.8%) | 12,048 (83.2%) |
| 10 or more Apartments | 5,601 (7.9%) | 65,430 (92.1%) |
| Mobile Home / Other | 9,756 (83.4%) | 1,939 (16.6%) |
| Total | 181,299 (55.8%) | 143,543 (44.2%) |
Housing Structures by Number of Rooms in San Jose
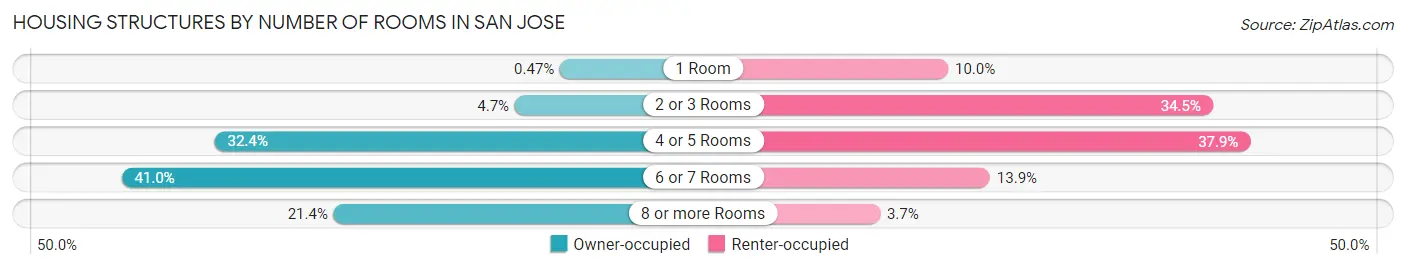
| Number of Rooms | Owner-occupied | Renter-occupied |
| 1 Room | 845 (0.5%) | 14,356 (10.0%) |
| 2 or 3 Rooms | 8,435 (4.6%) | 49,491 (34.5%) |
| 4 or 5 Rooms | 58,789 (32.4%) | 54,466 (37.9%) |
| 6 or 7 Rooms | 74,413 (41.0%) | 19,914 (13.9%) |
| 8 or more Rooms | 38,817 (21.4%) | 5,316 (3.7%) |
| Total | 181,299 (100.0%) | 143,543 (100.0%) |
Housing Structure by Heating Type in San Jose
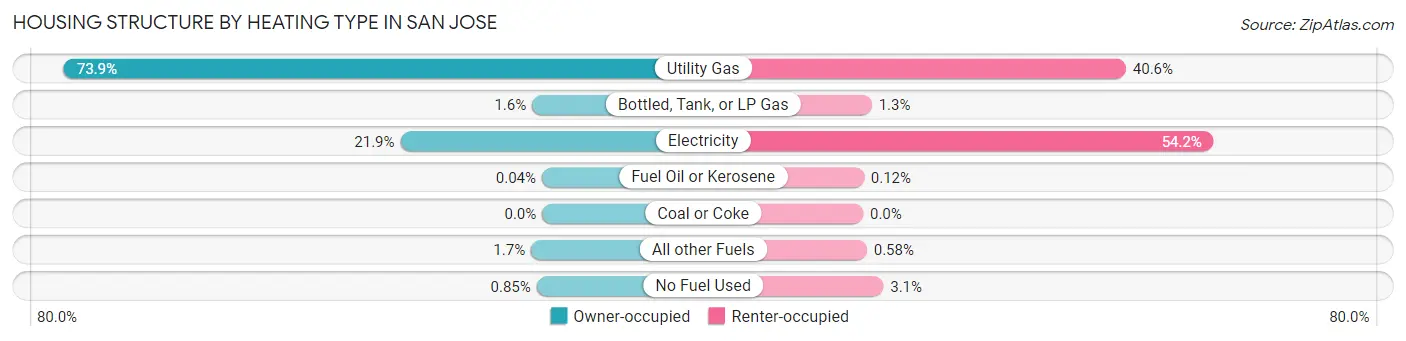
| Heating Type | Owner-occupied | Renter-occupied |
| Utility Gas | 134,028 (73.9%) | 58,315 (40.6%) |
| Bottled, Tank, or LP Gas | 2,811 (1.5%) | 1,923 (1.3%) |
| Electricity | 39,729 (21.9%) | 77,807 (54.2%) |
| Fuel Oil or Kerosene | 80 (0.0%) | 166 (0.1%) |
| Coal or Coke | 0 (0.0%) | 0 (0.0%) |
| All other Fuels | 3,116 (1.7%) | 834 (0.6%) |
| No Fuel Used | 1,535 (0.9%) | 4,498 (3.1%) |
| Total | 181,299 (100.0%) | 143,543 (100.0%) |
Household Vehicle Usage in San Jose
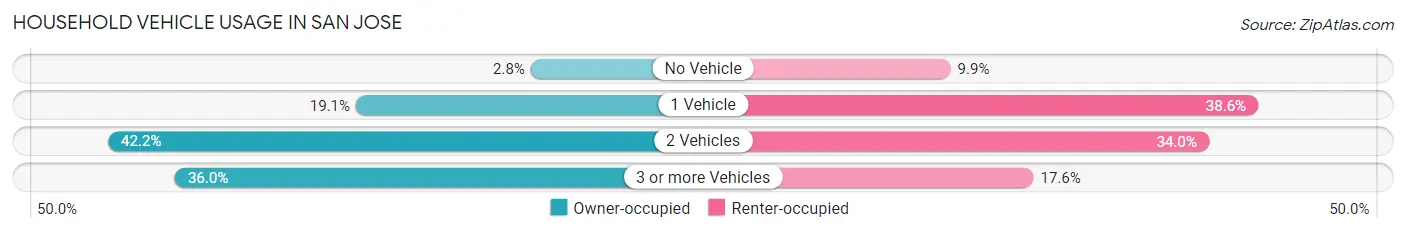
| Vehicles per Household | Owner-occupied | Renter-occupied |
| No Vehicle | 4,997 (2.8%) | 14,168 (9.9%) |
| 1 Vehicle | 34,586 (19.1%) | 55,339 (38.6%) |
| 2 Vehicles | 76,523 (42.2%) | 48,753 (34.0%) |
| 3 or more Vehicles | 65,193 (36.0%) | 25,283 (17.6%) |
| Total | 181,299 (100.0%) | 143,543 (100.0%) |
Real Estate & Mortgages in San Jose
Real Estate and Mortgage Overview in San Jose
| Characteristic | Without Mortgage | With Mortgage |
| Housing Units | 55,723 | 125,576 |
| Median Property Value | $1,072,300 | $1,179,900 |
| Median Household Income | $110,941 | $84,058 |
| Monthly Housing Costs | $965 | $89,253 |
| Real Estate Taxes | $5,684 | $1,356 |
Property Value by Mortgage Status in San Jose
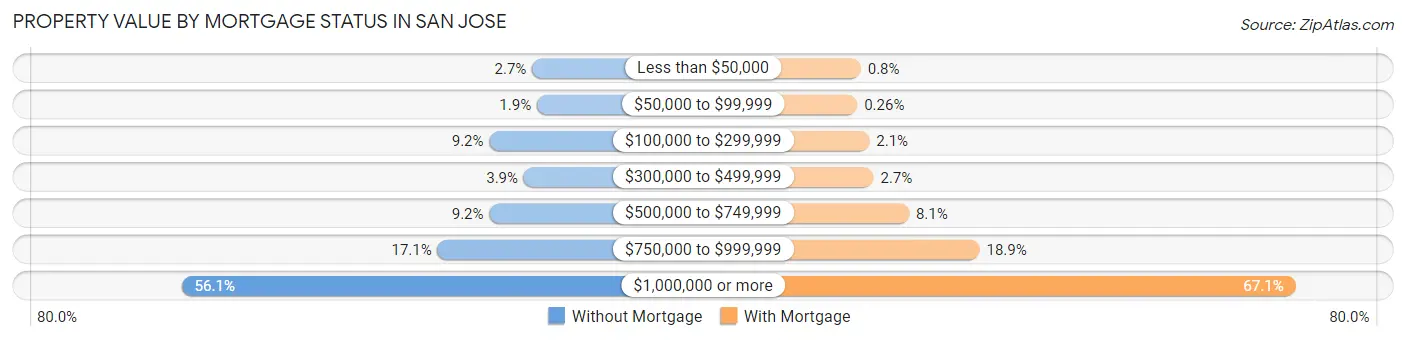
| Property Value | Without Mortgage | With Mortgage |
| Less than $50,000 | 1,481 (2.7%) | 1,007 (0.8%) |
| $50,000 to $99,999 | 1,068 (1.9%) | 327 (0.3%) |
| $100,000 to $299,999 | 5,118 (9.2%) | 2,631 (2.1%) |
| $300,000 to $499,999 | 2,185 (3.9%) | 3,442 (2.7%) |
| $500,000 to $749,999 | 5,116 (9.2%) | 10,226 (8.1%) |
| $750,000 to $999,999 | 9,519 (17.1%) | 23,738 (18.9%) |
| $1,000,000 or more | 31,236 (56.1%) | 84,205 (67.1%) |
| Total | 55,723 (100.0%) | 125,576 (100.0%) |
Household Income by Mortgage Status in San Jose
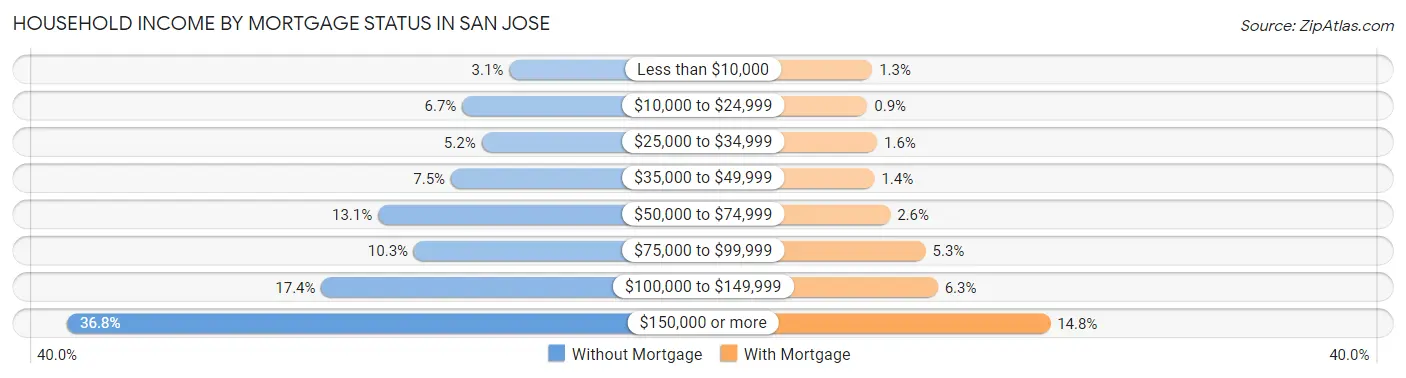
| Household Income | Without Mortgage | With Mortgage |
| Less than $10,000 | 1,717 (3.1%) | 1,596 (1.3%) |
| $10,000 to $24,999 | 3,711 (6.7%) | 1,131 (0.9%) |
| $25,000 to $34,999 | 2,891 (5.2%) | 2,054 (1.6%) |
| $35,000 to $49,999 | 4,188 (7.5%) | 1,808 (1.4%) |
| $50,000 to $74,999 | 7,282 (13.1%) | 3,321 (2.6%) |
| $75,000 to $99,999 | 5,759 (10.3%) | 6,712 (5.3%) |
| $100,000 to $149,999 | 9,691 (17.4%) | 7,865 (6.3%) |
| $150,000 or more | 20,484 (36.8%) | 18,627 (14.8%) |
| Total | 55,723 (100.0%) | 125,576 (100.0%) |
Property Value to Household Income Ratio in San Jose
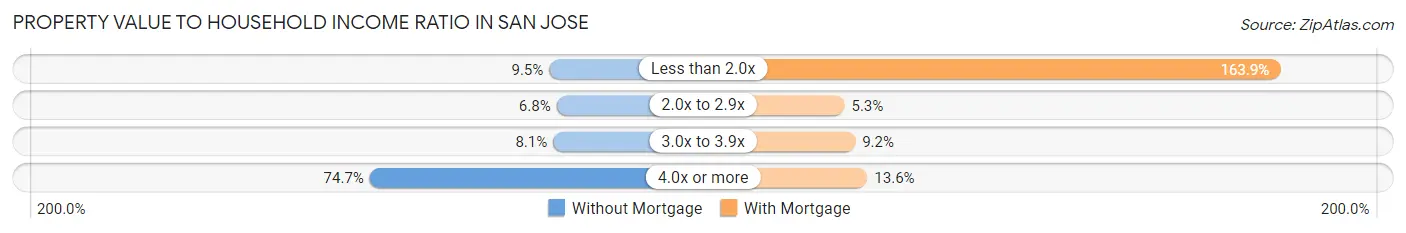
| Value-to-Income Ratio | Without Mortgage | With Mortgage |
| Less than 2.0x | 5,287 (9.5%) | 205,798 (163.9%) |
| 2.0x to 2.9x | 3,793 (6.8%) | 6,669 (5.3%) |
| 3.0x to 3.9x | 4,488 (8.1%) | 11,548 (9.2%) |
| 4.0x or more | 41,610 (74.7%) | 17,092 (13.6%) |
| Total | 55,723 (100.0%) | 125,576 (100.0%) |
Real Estate Taxes by Mortgage Status in San Jose
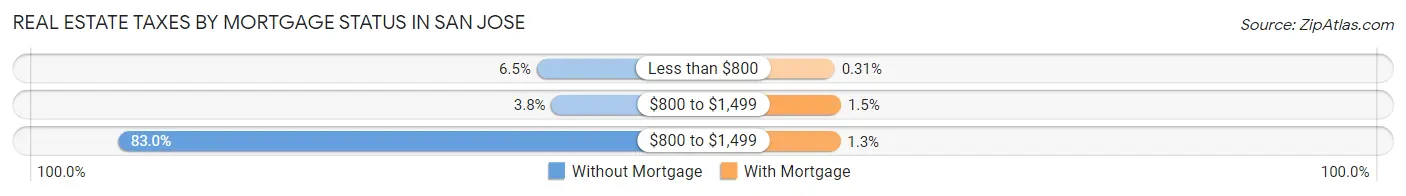
| Property Taxes | Without Mortgage | With Mortgage |
| Less than $800 | 3,599 (6.5%) | 386 (0.3%) |
| $800 to $1,499 | 2,109 (3.8%) | 1,827 (1.5%) |
| $800 to $1,499 | 46,232 (83.0%) | 1,674 (1.3%) |
| Total | 55,723 (100.0%) | 125,576 (100.0%) |
Health & Disability in San Jose
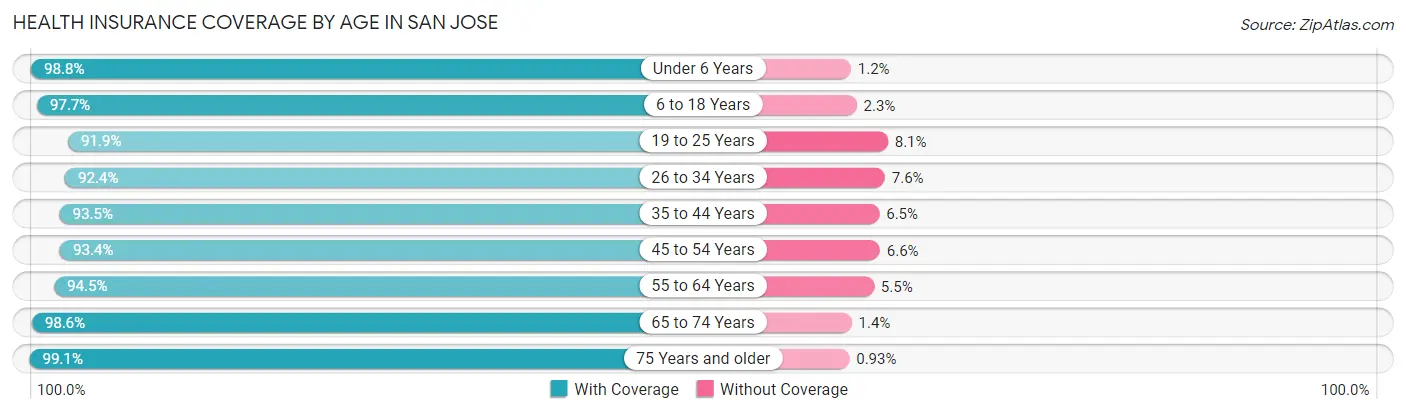
Health Insurance Coverage by Age in San Jose
| Age Bracket | With Coverage | Without Coverage |
| Under 6 Years | 63,155 (98.8%) | 780 (1.2%) |
| 6 to 18 Years | 158,388 (97.7%) | 3,728 (2.3%) |
| 19 to 25 Years | 85,478 (91.9%) | 7,541 (8.1%) |
| 26 to 34 Years | 128,594 (92.4%) | 10,514 (7.6%) |
| 35 to 44 Years | 135,867 (93.5%) | 9,491 (6.5%) |
| 45 to 54 Years | 129,508 (93.4%) | 9,193 (6.6%) |
| 55 to 64 Years | 113,353 (94.5%) | 6,619 (5.5%) |
| 65 to 74 Years | 78,245 (98.6%) | 1,077 (1.4%) |
| 75 Years and older | 55,365 (99.1%) | 522 (0.9%) |
| Total | 947,953 (95.0%) | 49,465 (5.0%) |
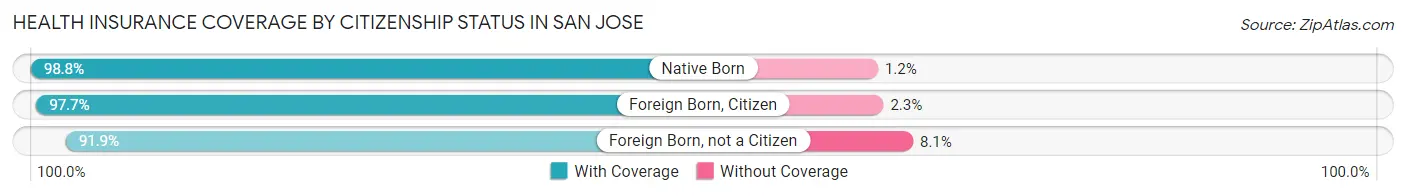
Health Insurance Coverage by Citizenship Status in San Jose
| Citizenship Status | With Coverage | Without Coverage |
| Native Born | 63,155 (98.8%) | 780 (1.2%) |
| Foreign Born, Citizen | 158,388 (97.7%) | 3,728 (2.3%) |
| Foreign Born, not a Citizen | 85,478 (91.9%) | 7,541 (8.1%) |
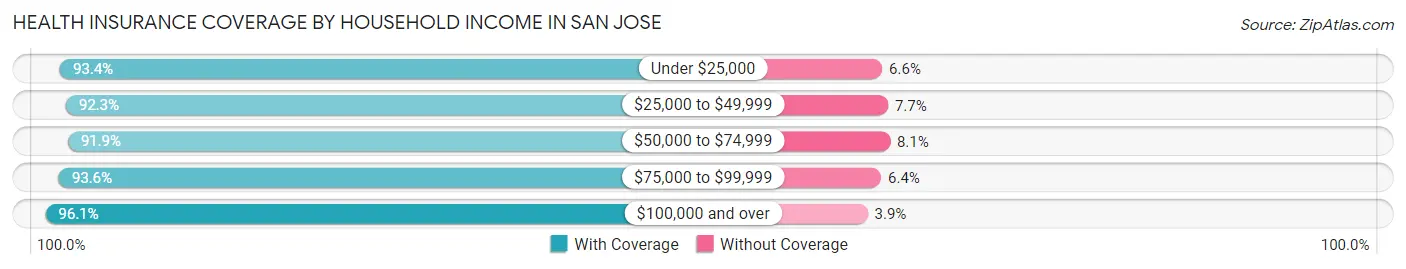
Health Insurance Coverage by Household Income in San Jose
| Household Income | With Coverage | Without Coverage |
| Under $25,000 | 48,662 (93.4%) | 3,454 (6.6%) |
| $25,000 to $49,999 | 70,159 (92.3%) | 5,871 (7.7%) |
| $50,000 to $74,999 | 78,054 (91.9%) | 6,865 (8.1%) |
| $75,000 to $99,999 | 87,244 (93.6%) | 5,983 (6.4%) |
| $100,000 and over | 652,423 (96.1%) | 26,433 (3.9%) |
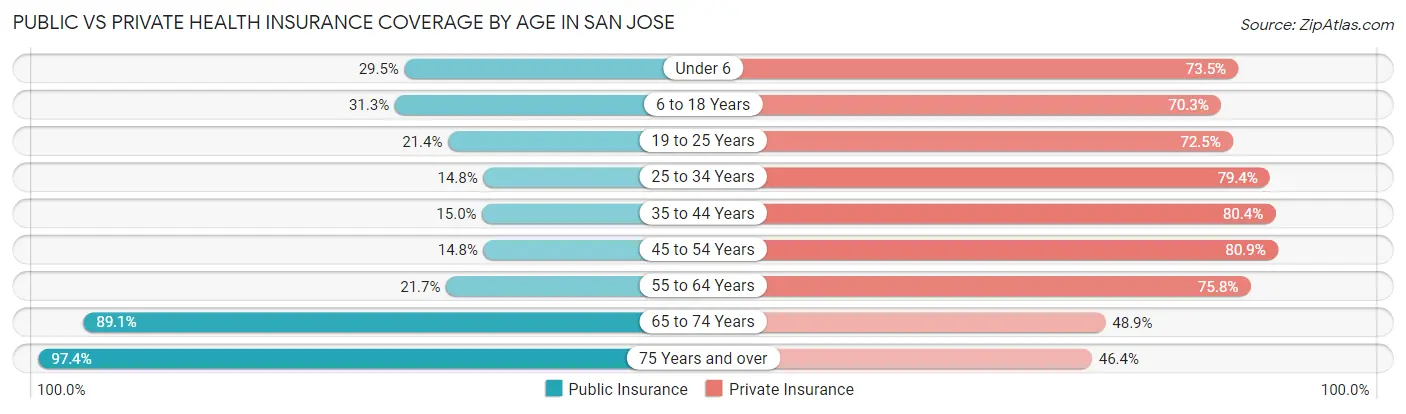
Public vs Private Health Insurance Coverage by Age in San Jose
| Age Bracket | Public Insurance | Private Insurance |
| Under 6 | 18,826 (29.4%) | 47,005 (73.5%) |
| 6 to 18 Years | 50,664 (31.2%) | 113,983 (70.3%) |
| 19 to 25 Years | 19,871 (21.4%) | 67,468 (72.5%) |
| 25 to 34 Years | 20,604 (14.8%) | 110,481 (79.4%) |
| 35 to 44 Years | 21,827 (15.0%) | 116,877 (80.4%) |
| 45 to 54 Years | 20,482 (14.8%) | 112,185 (80.9%) |
| 55 to 64 Years | 26,062 (21.7%) | 90,922 (75.8%) |
| 65 to 74 Years | 70,675 (89.1%) | 38,804 (48.9%) |
| 75 Years and over | 54,457 (97.4%) | 25,932 (46.4%) |
| Total | 303,468 (30.4%) | 723,657 (72.6%) |
Disability Status by Sex by Age in San Jose
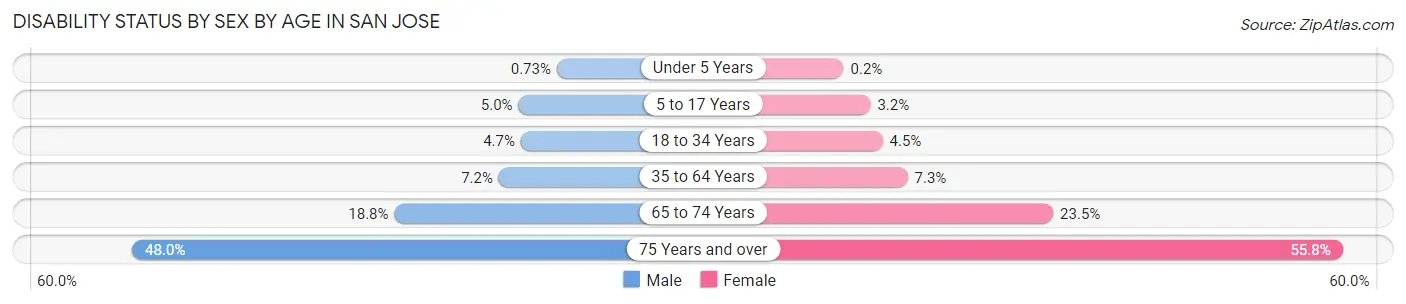
| Age Bracket | Male | Female |
| Under 5 Years | 201 (0.7%) | 52 (0.2%) |
| 5 to 17 Years | 4,082 (5.0%) | 2,446 (3.2%) |
| 18 to 34 Years | 6,180 (4.7%) | 5,260 (4.5%) |
| 35 to 64 Years | 15,004 (7.2%) | 14,333 (7.3%) |
| 65 to 74 Years | 6,998 (18.8%) | 9,916 (23.5%) |
| 75 Years and over | 11,180 (48.0%) | 18,181 (55.8%) |
Disability Class by Sex by Age in San Jose
Disability Class: Hearing Difficulty
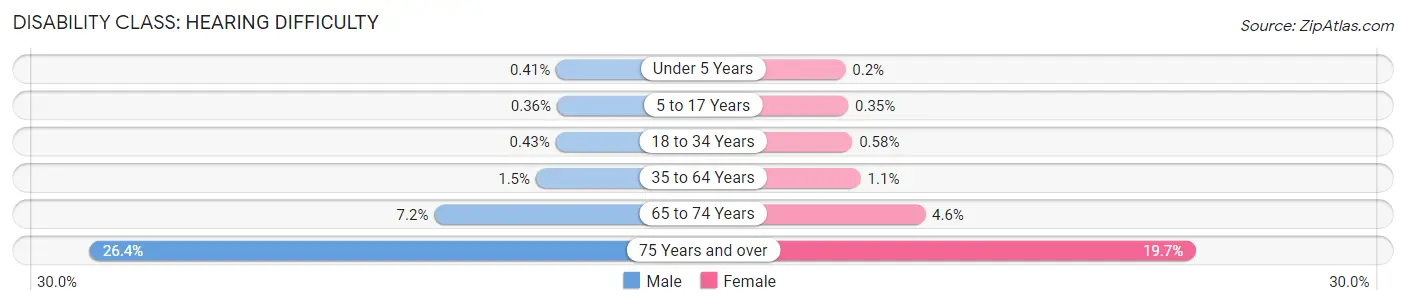
| Age Bracket | Male | Female |
| Under 5 Years | 113 (0.4%) | 52 (0.2%) |
| 5 to 17 Years | 290 (0.4%) | 267 (0.4%) |
| 18 to 34 Years | 565 (0.4%) | 669 (0.6%) |
| 35 to 64 Years | 3,195 (1.5%) | 2,050 (1.1%) |
| 65 to 74 Years | 2,674 (7.2%) | 1,955 (4.6%) |
| 75 Years and over | 6,136 (26.4%) | 6,415 (19.7%) |
Disability Class: Vision Difficulty
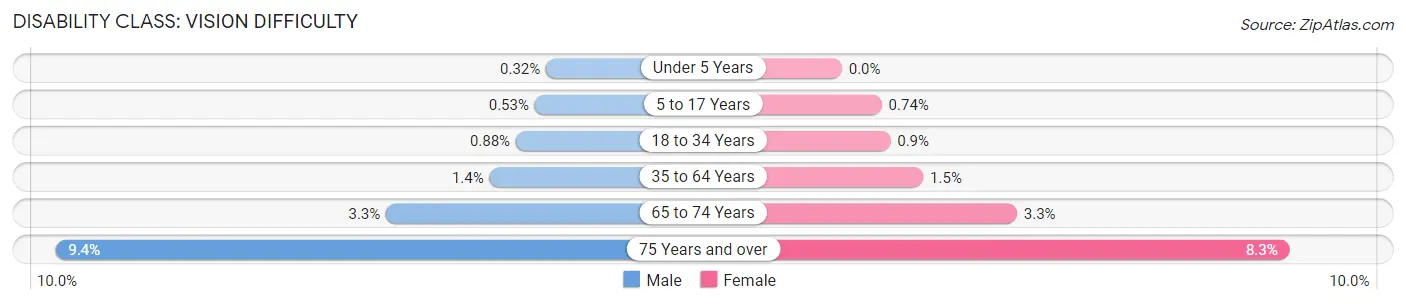
| Age Bracket | Male | Female |
| Under 5 Years | 88 (0.3%) | 0 (0.0%) |
| 5 to 17 Years | 434 (0.5%) | 571 (0.7%) |
| 18 to 34 Years | 1,146 (0.9%) | 1,045 (0.9%) |
| 35 to 64 Years | 2,853 (1.4%) | 2,954 (1.5%) |
| 65 to 74 Years | 1,225 (3.3%) | 1,368 (3.3%) |
| 75 Years and over | 2,196 (9.4%) | 2,708 (8.3%) |
Disability Class: Cognitive Difficulty
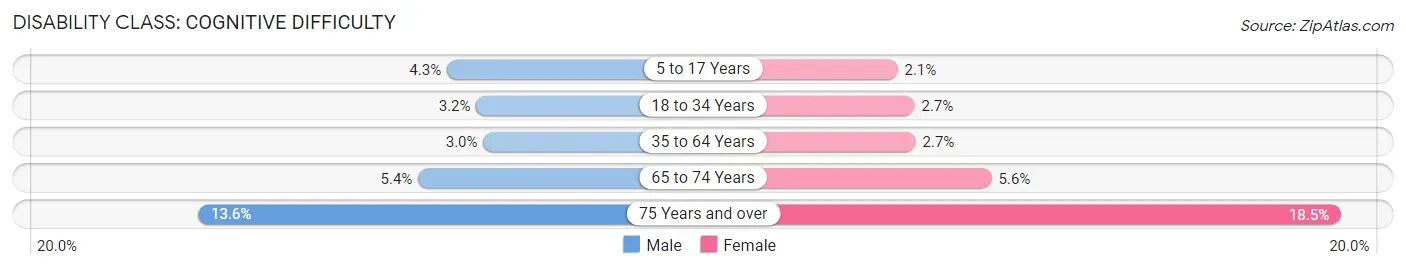
| Age Bracket | Male | Female |
| 5 to 17 Years | 3,521 (4.3%) | 1,590 (2.1%) |
| 18 to 34 Years | 4,213 (3.2%) | 3,123 (2.7%) |
| 35 to 64 Years | 6,194 (3.0%) | 5,348 (2.7%) |
| 65 to 74 Years | 2,004 (5.4%) | 2,344 (5.6%) |
| 75 Years and over | 3,157 (13.6%) | 6,043 (18.5%) |
Disability Class: Ambulatory Difficulty
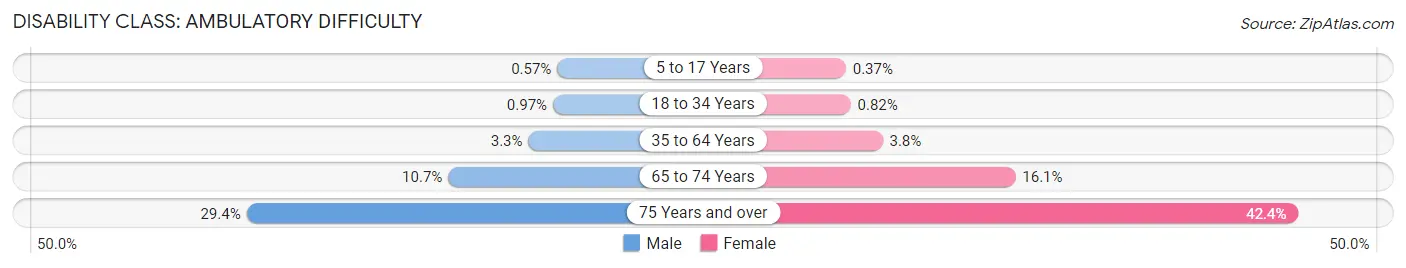
| Age Bracket | Male | Female |
| 5 to 17 Years | 466 (0.6%) | 283 (0.4%) |
| 18 to 34 Years | 1,270 (1.0%) | 944 (0.8%) |
| 35 to 64 Years | 6,774 (3.3%) | 7,388 (3.8%) |
| 65 to 74 Years | 3,975 (10.7%) | 6,787 (16.1%) |
| 75 Years and over | 6,846 (29.4%) | 13,813 (42.4%) |
Disability Class: Self-Care Difficulty
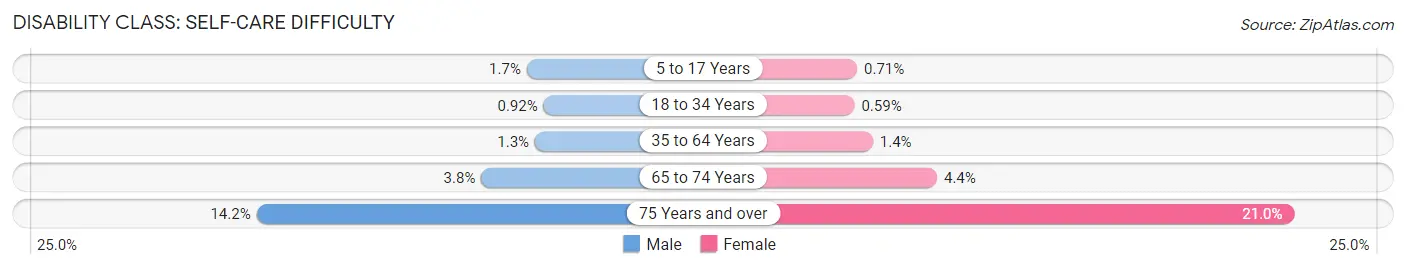
| Age Bracket | Male | Female |
| 5 to 17 Years | 1,389 (1.7%) | 546 (0.7%) |
| 18 to 34 Years | 1,206 (0.9%) | 684 (0.6%) |
| 35 to 64 Years | 2,749 (1.3%) | 2,813 (1.4%) |
| 65 to 74 Years | 1,416 (3.8%) | 1,861 (4.4%) |
| 75 Years and over | 3,316 (14.2%) | 6,847 (21.0%) |
Technology Access in San Jose
Computing Device Access in San Jose
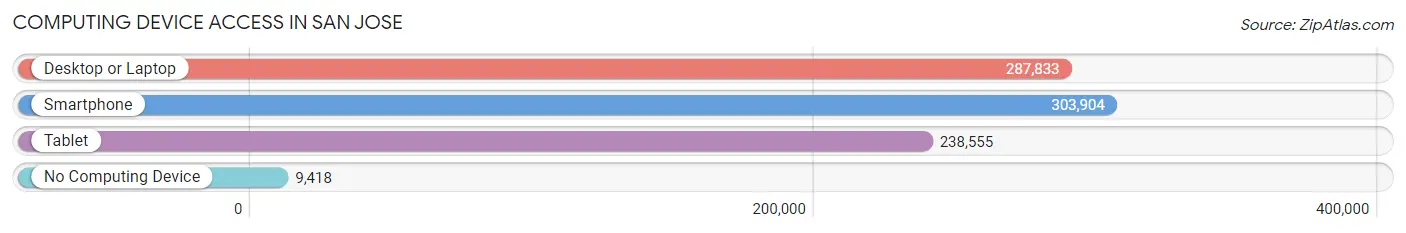
| Device Type | # Households | % Households |
| Desktop or Laptop | 287,833 | 88.6% |
| Smartphone | 303,904 | 93.5% |
| Tablet | 238,555 | 73.4% |
| No Computing Device | 9,418 | 2.9% |
| Total | 324,842 | 100.0% |
Internet Access in San Jose
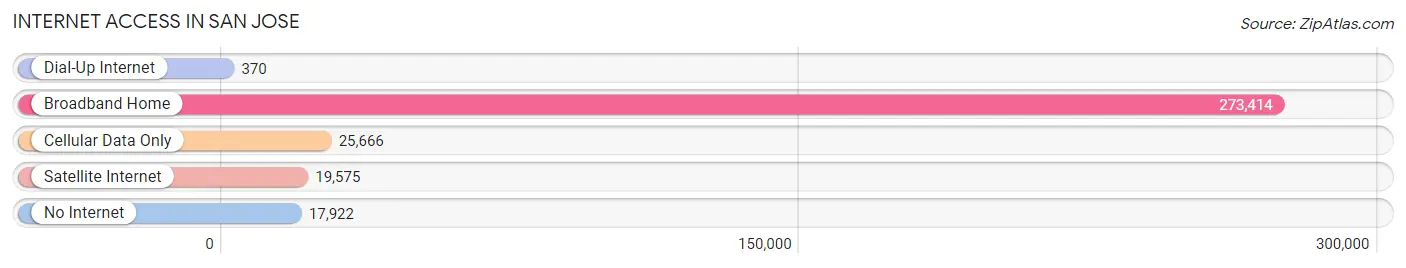
| Internet Type | # Households | % Households |
| Dial-Up Internet | 370 | 0.1% |
| Broadband Home | 273,414 | 84.2% |
| Cellular Data Only | 25,666 | 7.9% |
| Satellite Internet | 19,575 | 6.0% |
| No Internet | 17,922 | 5.5% |
| Total | 324,842 | 100.0% |
San Jose Summary
San Jose, California is the largest city in the San Francisco Bay Area and the 10th largest city in the United States. It is located in the heart of Silicon Valley, the world’s leading technology hub. San Jose is a vibrant and diverse city with a rich history, geography, economy, and demographics.
History
San Jose was founded in 1777 by Spanish colonists as El Pueblo de San Jose de Guadalupe. It was the first civilian settlement in the Spanish colony of Alta California. The city was named after Saint Joseph, the patron saint of the Spanish-Mexican settlers. San Jose was the first capital of the newly formed state of California in 1849.
The city experienced rapid growth in the late 19th and early 20th centuries due to the booming agricultural industry. The city was also a major hub for the railroad industry, which connected San Jose to the rest of the country.
In the 1950s, San Jose began to experience a population boom due to the influx of people from the Dust Bowl and the Great Migration. This population boom was further fueled by the growth of the technology industry in Silicon Valley.
Geography
San Jose is located in the southern part of the San Francisco Bay Area. It is situated at the southern end of the Santa Clara Valley, which is surrounded by the Santa Cruz Mountains to the west and the Diablo Range to the east. The city is bordered by the cities of Santa Clara, Sunnyvale, and Milpitas.
The city has a total area of 180.5 square miles, of which 177.2 square miles is land and 3.3 square miles is water. San Jose is located at an elevation of 82 feet above sea level.
Economy
San Jose is the economic center of Silicon Valley and the largest city in the Bay Area. The city is home to many of the world’s leading technology companies, including Apple, Google, and Facebook.
The city’s economy is also driven by the tourism industry, which is fueled by its many attractions, such as the Winchester Mystery House, the Tech Museum of Innovation, and the Rosicrucian Egyptian Museum.
San Jose is also home to several major universities, including San Jose State University, Santa Clara University, and Stanford University. These universities are major employers in the city and contribute to the city’s economy.
Demographics
As of 2019, San Jose had a population of 1,030,119. The city is ethnically diverse, with the largest ethnic groups being White (37.2%), Hispanic or Latino (31.2%), Asian (25.7%), and African American (3.7%).
The median household income in San Jose is $103,717, which is significantly higher than the national median of $61,937. The median home value in the city is $1,072,400, which is also significantly higher than the national median of $219,700.
San Jose is a vibrant and diverse city with a rich history, geography, economy, and demographics. The city is home to many of the world’s leading technology companies and is a major hub for the tourism industry. San Jose is also home to several major universities, which contribute to the city’s economy. The city’s population is ethnically diverse and has a higher median household income and home value than the national average.
Common Questions
What is Per Capita Income in San Jose?
Per Capita income in San Jose is $59,913.
What is the Median Family Income in San Jose?
Median Family Income in San Jose is $152,266.
What is the Median Household income in San Jose?
Median Household Income in San Jose is $136,010.
What is Income or Wage Gap in San Jose?
Income or Wage Gap in San Jose is 32.5%.
Women in San Jose earn 67.5 cents for every dollar earned by a man.
What is Family Income Deficit in San Jose?
Family Income Deficit in San Jose is $10,730.
Families that are below poverty line in San Jose earn $10,730 less on average than the poverty threshold level.
What is Inequality or Gini Index in San Jose?
Inequality or Gini Index in San Jose is 0.46.
What is the Total Population of San Jose?
Total Population of San Jose is 1,001,176.
What is the Total Male Population of San Jose?
Total Male Population of San Jose is 510,716.
What is the Total Female Population of San Jose?
Total Female Population of San Jose is 490,460.
What is the Ratio of Males per 100 Females in San Jose?
There are 104.13 Males per 100 Females in San Jose.
What is the Ratio of Females per 100 Males in San Jose?
There are 96.03 Females per 100 Males in San Jose.
What is the Median Population Age in San Jose?
Median Population Age in San Jose is 37.8 Years.
What is the Average Family Size in San Jose
Average Family Size in San Jose is 3.5 People.
What is the Average Household Size in San Jose
Average Household Size in San Jose is 3.0 People.
How Large is the Labor Force in San Jose?
There are 552,785 People in the Labor Forcein in San Jose.
What is the Percentage of People in the Labor Force in San Jose?
67.9% of People are in the Labor Force in San Jose.
What is the Unemployment Rate in San Jose?
Unemployment Rate in San Jose is 4.7%.