Irvine, CA Map & Demographics
Irvine Map
Irvine Overview
$59,354
PER CAPITA INCOME
$153,615
AVG FAMILY INCOME
$122,948
AVG HOUSEHOLD INCOME
40.2%
WAGE / INCOME GAP [ % ]
59.8¢/ $1
WAGE / INCOME GAP [ $ ]
$14,651
FAMILY INCOME DEFICIT
0.48
INEQUALITY / GINI INDEX
304,527
TOTAL POPULATION
150,761
MALE POPULATION
153,766
FEMALE POPULATION
98.05
MALES / 100 FEMALES
101.99
FEMALES / 100 MALES
33.8
MEDIAN AGE
3.2
AVG FAMILY SIZE
2.7
AVG HOUSEHOLD SIZE
160,914
LABOR FORCE [ PEOPLE ]
65.6%
PERCENT IN LABOR FORCE
5.5%
UNEMPLOYMENT RATE
Income in Irvine
Income Overview in Irvine
Per Capita Income in Irvine is $59,354, while median incomes of families and households are $153,615 and $122,948 respectively.
| Characteristic | Number | Measure |
| Per Capita Income | 304,527 | $59,354 |
| Median Family Income | 71,014 | $153,615 |
| Mean Family Income | 71,014 | $190,562 |
| Median Household Income | 110,465 | $122,948 |
| Mean Household Income | 110,465 | $160,291 |
| Income Deficit | 71,014 | $14,651 |
| Wage / Income Gap (%) | 304,527 | 40.20% |
| Wage / Income Gap ($) | 304,527 | 59.80¢ per $1 |
| Gini / Inequality Index | 304,527 | 0.48 |
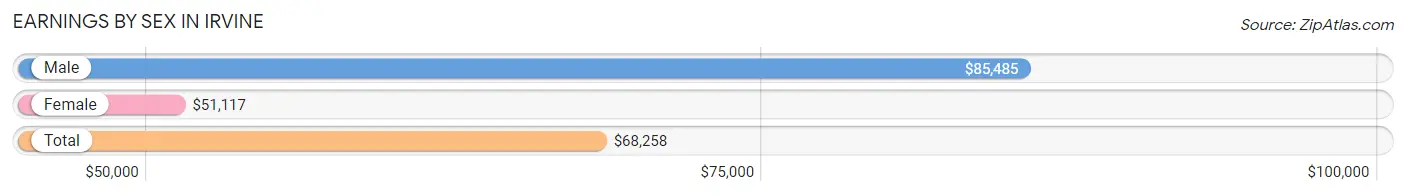
Earnings by Sex in Irvine
Average Earnings in Irvine are $68,258, $85,485 for men and $51,117 for women, a difference of 40.2%.
| Sex | Number | Average Earnings |
| Male | 89,276 (53.4%) | $85,485 |
| Female | 77,993 (46.6%) | $51,117 |
| Total | 167,269 (100.0%) | $68,258 |
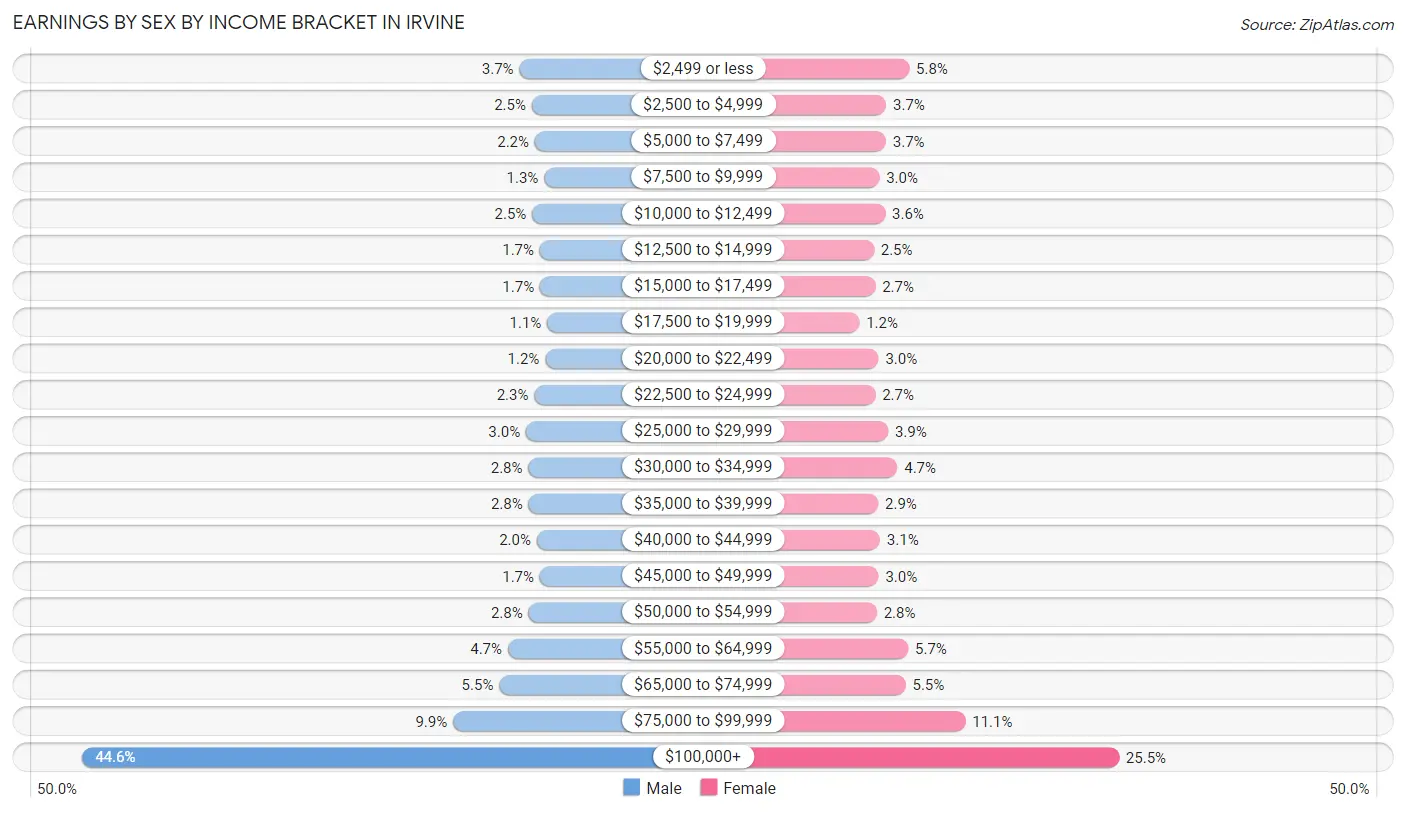
Earnings by Sex by Income Bracket in Irvine
The most common earnings brackets in Irvine are $100,000+ for men (39,821 | 44.6%) and $100,000+ for women (19,883 | 25.5%).
| Income | Male | Female |
| $2,499 or less | 3,261 (3.6%) | 4,558 (5.8%) |
| $2,500 to $4,999 | 2,223 (2.5%) | 2,870 (3.7%) |
| $5,000 to $7,499 | 1,961 (2.2%) | 2,852 (3.7%) |
| $7,500 to $9,999 | 1,189 (1.3%) | 2,372 (3.0%) |
| $10,000 to $12,499 | 2,184 (2.5%) | 2,797 (3.6%) |
| $12,500 to $14,999 | 1,545 (1.7%) | 1,976 (2.5%) |
| $15,000 to $17,499 | 1,538 (1.7%) | 2,074 (2.7%) |
| $17,500 to $19,999 | 933 (1.1%) | 907 (1.2%) |
| $20,000 to $22,499 | 1,094 (1.2%) | 2,314 (3.0%) |
| $22,500 to $24,999 | 2,011 (2.2%) | 2,072 (2.7%) |
| $25,000 to $29,999 | 2,704 (3.0%) | 3,012 (3.9%) |
| $30,000 to $34,999 | 2,513 (2.8%) | 3,688 (4.7%) |
| $35,000 to $39,999 | 2,493 (2.8%) | 2,283 (2.9%) |
| $40,000 to $44,999 | 1,799 (2.0%) | 2,418 (3.1%) |
| $45,000 to $49,999 | 1,545 (1.7%) | 2,314 (3.0%) |
| $50,000 to $54,999 | 2,490 (2.8%) | 2,182 (2.8%) |
| $55,000 to $64,999 | 4,219 (4.7%) | 4,478 (5.7%) |
| $65,000 to $74,999 | 4,946 (5.5%) | 4,289 (5.5%) |
| $75,000 to $99,999 | 8,807 (9.9%) | 8,654 (11.1%) |
| $100,000+ | 39,821 (44.6%) | 19,883 (25.5%) |
| Total | 89,276 (100.0%) | 77,993 (100.0%) |
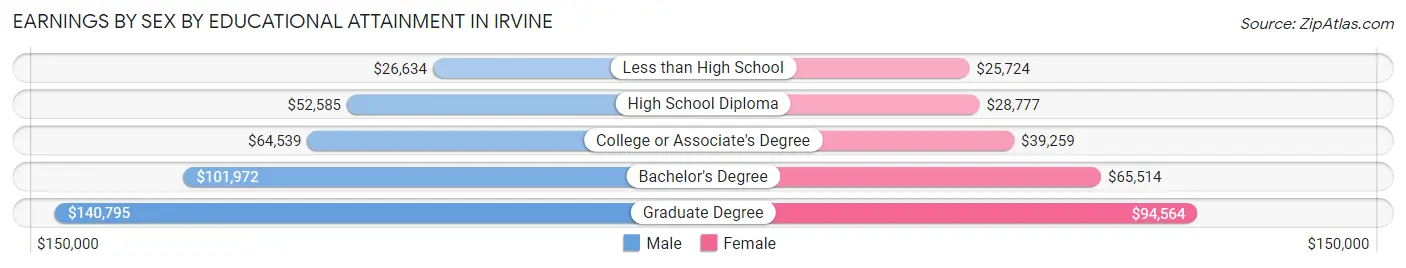
Earnings by Sex by Educational Attainment in Irvine
Average earnings in Irvine are $100,070 for men and $63,825 for women, a difference of 36.2%. Men with an educational attainment of graduate degree enjoy the highest average annual earnings of $140,795, while those with less than high school education earn the least with $26,634. Women with an educational attainment of graduate degree earn the most with the average annual earnings of $94,564, while those with less than high school education have the smallest earnings of $25,724.
| Educational Attainment | Male Income | Female Income |
| Less than High School | $26,634 | $25,724 |
| High School Diploma | $52,585 | $28,777 |
| College or Associate's Degree | $64,539 | $39,259 |
| Bachelor's Degree | $101,972 | $65,514 |
| Graduate Degree | $140,795 | $94,564 |
| Total | $100,070 | $63,825 |
Family Income in Irvine
Family Income Brackets in Irvine
According to the Irvine family income data, there are 25,494 families falling into the $200,000+ income range, which is the most common income bracket and makes up 35.9% of all families. Conversely, the $10,000 to $14,999 income bracket is the least frequent group with only 639 families (0.9%) belonging to this category.
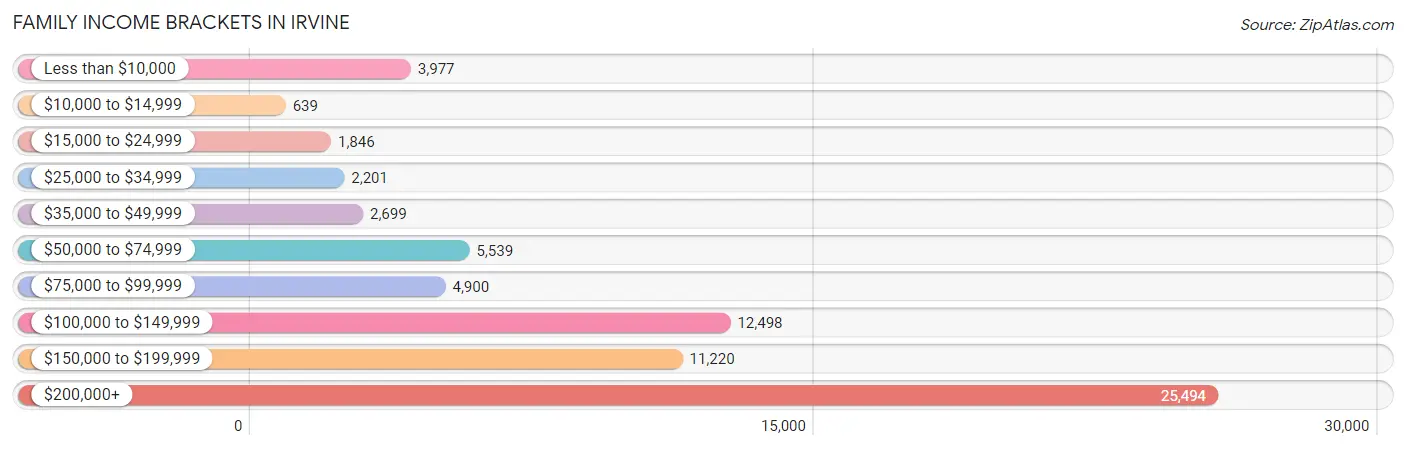
| Income Bracket | # Families | % Families |
| Less than $10,000 | 3,977 | 5.6% |
| $10,000 to $14,999 | 639 | 0.9% |
| $15,000 to $24,999 | 1,846 | 2.6% |
| $25,000 to $34,999 | 2,201 | 3.1% |
| $35,000 to $49,999 | 2,699 | 3.8% |
| $50,000 to $74,999 | 5,539 | 7.8% |
| $75,000 to $99,999 | 4,900 | 6.9% |
| $100,000 to $149,999 | 12,498 | 17.6% |
| $150,000 to $199,999 | 11,220 | 15.8% |
| $200,000+ | 25,494 | 35.9% |
Family Income by Famaliy Size in Irvine
6-person families (1,053 | 1.5%) account for the highest median family income in Irvine with $234,806 per family, while 2-person families (26,987 | 38.0%) have the highest median income of $60,892 per family member.
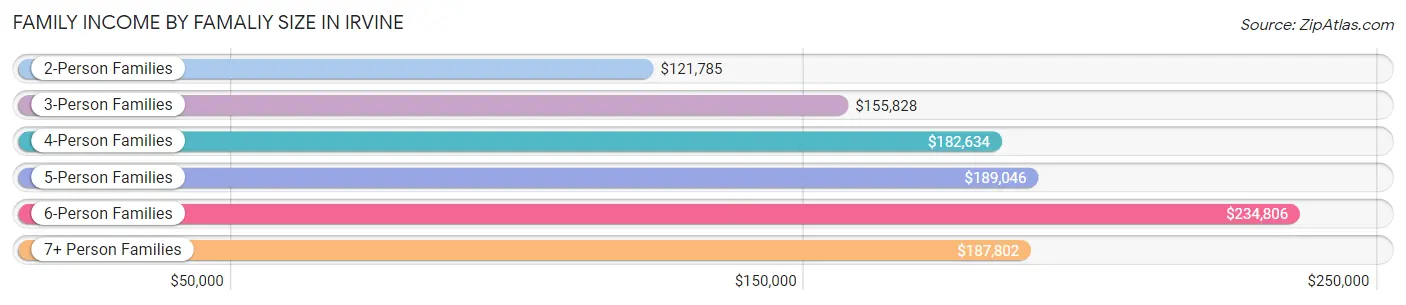
| Income Bracket | # Families | Median Income |
| 2-Person Families | 26,987 (38.0%) | $121,785 |
| 3-Person Families | 19,353 (27.3%) | $155,828 |
| 4-Person Families | 18,025 (25.4%) | $182,634 |
| 5-Person Families | 4,833 (6.8%) | $189,046 |
| 6-Person Families | 1,053 (1.5%) | $234,806 |
| 7+ Person Families | 763 (1.1%) | $187,802 |
| Total | 71,014 (100.0%) | $153,615 |
Family Income by Number of Earners in Irvine
The median family income in Irvine is $153,615, with families comprising 3+ earners (7,253) having the highest median family income of $208,791, while families with no earners (8,259) have the lowest median family income of $24,854, accounting for 10.2% and 11.6% of families, respectively.
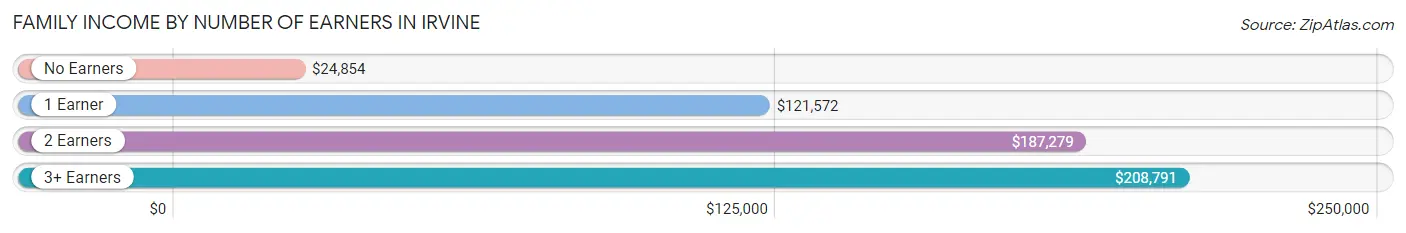
| Number of Earners | # Families | Median Income |
| No Earners | 8,259 (11.6%) | $24,854 |
| 1 Earner | 23,972 (33.8%) | $121,572 |
| 2 Earners | 31,530 (44.4%) | $187,279 |
| 3+ Earners | 7,253 (10.2%) | $208,791 |
| Total | 71,014 (100.0%) | $153,615 |
Household Income in Irvine
Household Income Brackets in Irvine
With 30,820 households falling in the category, the $200,000+ income range is the most frequent in Irvine, accounting for 27.9% of all households. In contrast, only 2,541 households (2.3%) fall into the $10,000 to $14,999 income bracket, making it the least populous group.
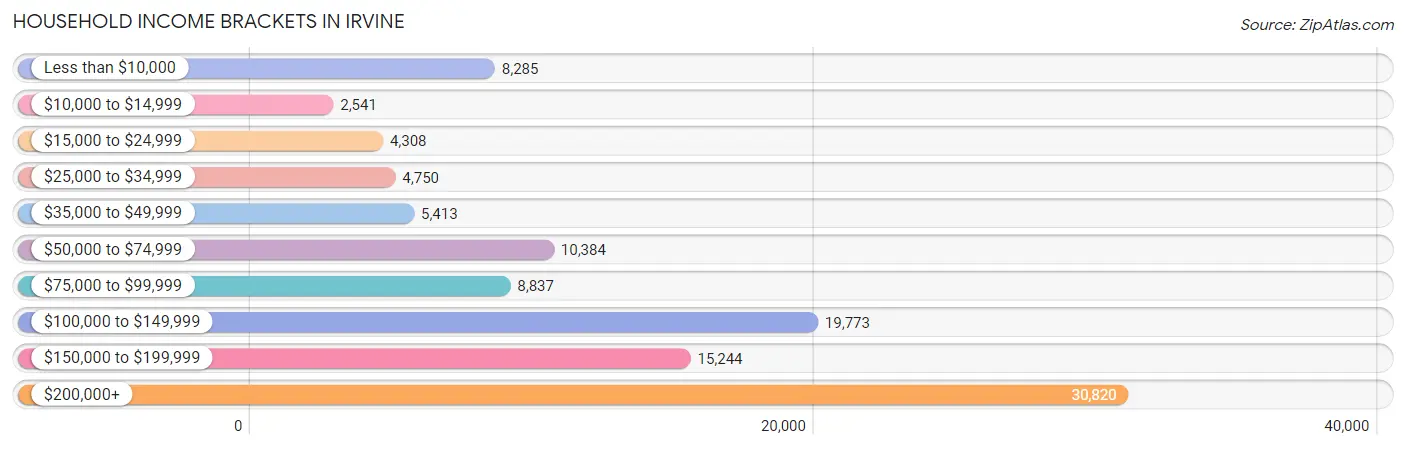
| Income Bracket | # Households | % Households |
| Less than $10,000 | 8,285 | 7.5% |
| $10,000 to $14,999 | 2,541 | 2.3% |
| $15,000 to $24,999 | 4,308 | 3.9% |
| $25,000 to $34,999 | 4,750 | 4.3% |
| $35,000 to $49,999 | 5,413 | 4.9% |
| $50,000 to $74,999 | 10,384 | 9.4% |
| $75,000 to $99,999 | 8,837 | 8.0% |
| $100,000 to $149,999 | 19,773 | 17.9% |
| $150,000 to $199,999 | 15,244 | 13.8% |
| $200,000+ | 30,820 | 27.9% |
Household Income by Householder Age in Irvine
The median household income in Irvine is $122,948, with the highest median household income of $150,774 found in the 45 to 64 years age bracket for the primary householder. A total of 39,091 households (35.4%) fall into this category. Meanwhile, the 15 to 24 years age bracket for the primary householder has the lowest median household income of $19,162, with 7,030 households (6.4%) in this group.
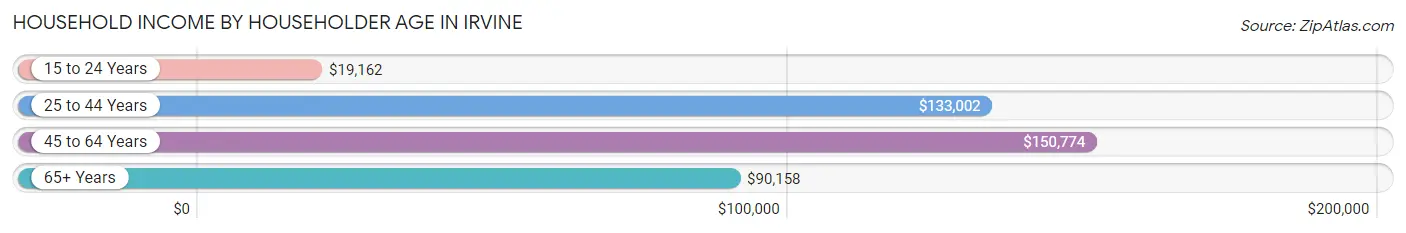
| Income Bracket | # Households | Median Income |
| 15 to 24 Years | 7,030 (6.4%) | $19,162 |
| 25 to 44 Years | 46,390 (42.0%) | $133,002 |
| 45 to 64 Years | 39,091 (35.4%) | $150,774 |
| 65+ Years | 17,954 (16.3%) | $90,158 |
| Total | 110,465 (100.0%) | $122,948 |
Poverty in Irvine
Income Below Poverty by Sex and Age in Irvine
With 11.9% poverty level for males and 13.1% for females among the residents of Irvine, 18 to 24 year old males and 18 to 24 year old females are the most vulnerable to poverty, with 7,239 males (43.9%) and 5,794 females (39.8%) in their respective age groups living below the poverty level.
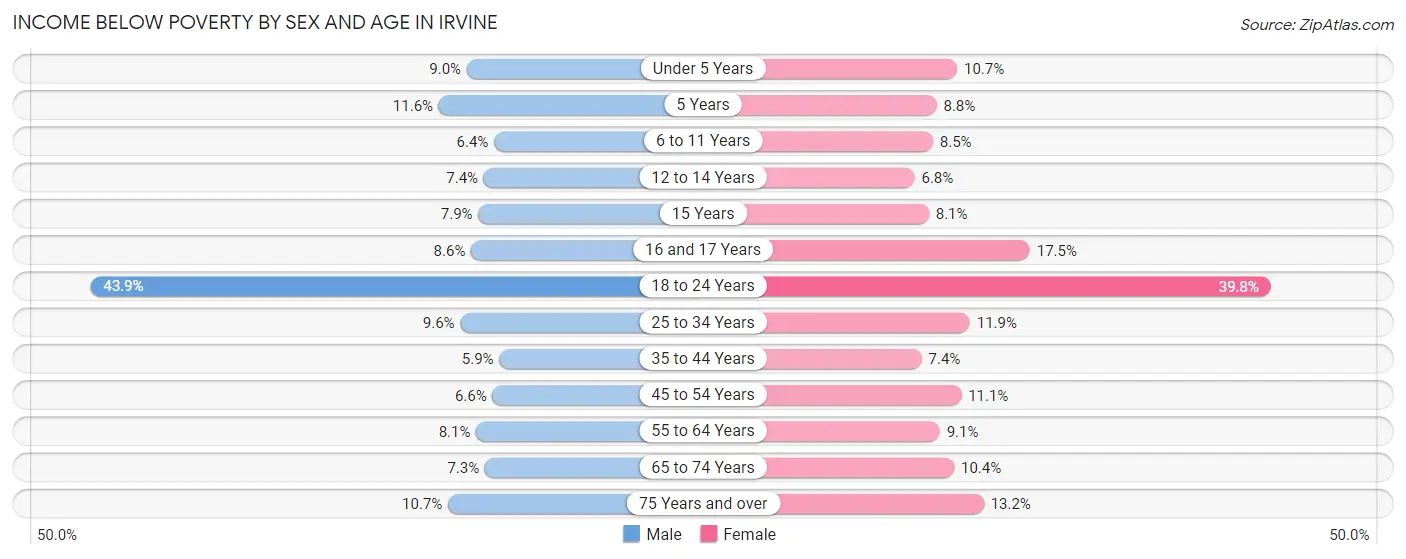
| Age Bracket | Male | Female |
| Under 5 Years | 1,005 (8.9%) | 949 (10.7%) |
| 5 Years | 182 (11.6%) | 126 (8.8%) |
| 6 to 11 Years | 651 (6.4%) | 873 (8.5%) |
| 12 to 14 Years | 400 (7.4%) | 383 (6.8%) |
| 15 Years | 156 (7.9%) | 159 (8.1%) |
| 16 and 17 Years | 284 (8.6%) | 616 (17.4%) |
| 18 to 24 Years | 7,239 (43.9%) | 5,794 (39.8%) |
| 25 to 34 Years | 2,476 (9.6%) | 3,103 (11.9%) |
| 35 to 44 Years | 1,257 (5.9%) | 1,658 (7.4%) |
| 45 to 54 Years | 1,313 (6.6%) | 2,321 (11.1%) |
| 55 to 64 Years | 1,170 (8.1%) | 1,355 (9.1%) |
| 65 to 74 Years | 632 (7.3%) | 1,067 (10.4%) |
| 75 Years and over | 623 (10.7%) | 913 (13.2%) |
| Total | 17,388 (11.9%) | 19,317 (13.1%) |
Income Above Poverty by Sex and Age in Irvine
According to the poverty statistics in Irvine, males aged 35 to 44 years and females aged 12 to 14 years are the age groups that are most secure financially, with 94.1% of males and 93.2% of females in these age groups living above the poverty line.
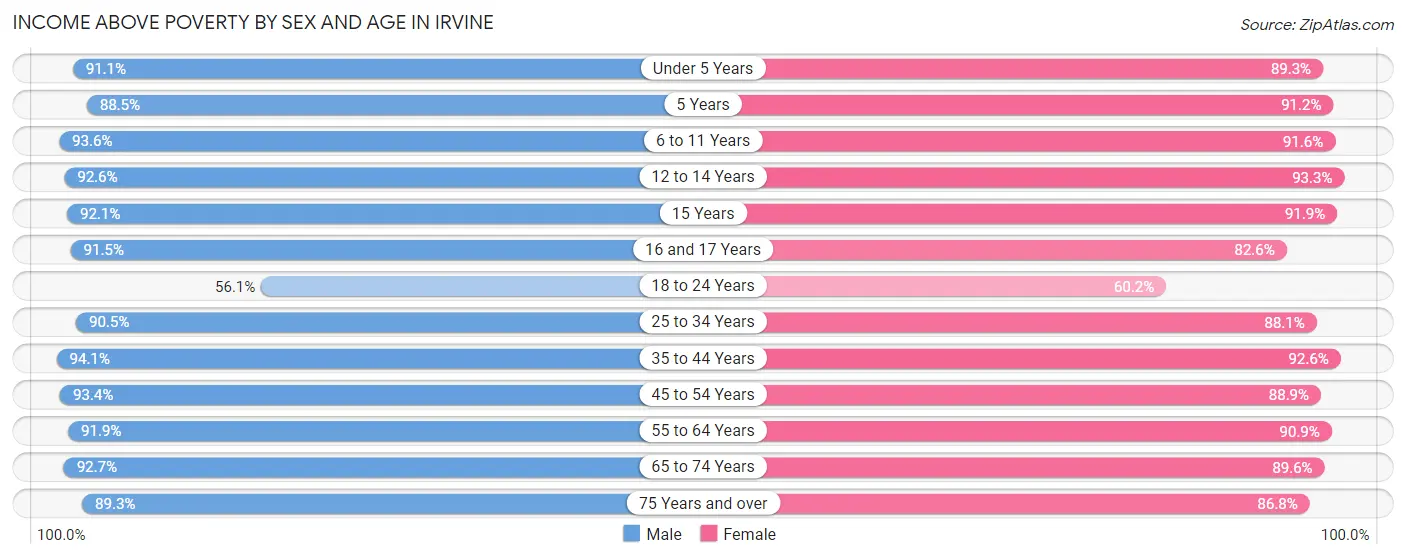
| Age Bracket | Male | Female |
| Under 5 Years | 10,224 (91.0%) | 7,922 (89.3%) |
| 5 Years | 1,394 (88.4%) | 1,307 (91.2%) |
| 6 to 11 Years | 9,497 (93.6%) | 9,453 (91.5%) |
| 12 to 14 Years | 5,027 (92.6%) | 5,291 (93.2%) |
| 15 Years | 1,824 (92.1%) | 1,812 (91.9%) |
| 16 and 17 Years | 3,037 (91.4%) | 2,915 (82.6%) |
| 18 to 24 Years | 9,252 (56.1%) | 8,759 (60.2%) |
| 25 to 34 Years | 23,464 (90.4%) | 23,010 (88.1%) |
| 35 to 44 Years | 19,957 (94.1%) | 20,707 (92.6%) |
| 45 to 54 Years | 18,669 (93.4%) | 18,629 (88.9%) |
| 55 to 64 Years | 13,310 (91.9%) | 13,558 (90.9%) |
| 65 to 74 Years | 8,057 (92.7%) | 9,171 (89.6%) |
| 75 Years and over | 5,203 (89.3%) | 6,020 (86.8%) |
| Total | 128,915 (88.1%) | 128,554 (86.9%) |
Income Below Poverty Among Married-Couple Families in Irvine
The poverty statistics for married-couple families in Irvine show that 4.8% or 2,681 of the total 55,716 families live below the poverty line. Families with 5 or more children have the highest poverty rate of 22.5%, comprising of 27 families. On the other hand, families with 1 or 2 children have the lowest poverty rate of 4.1%, which includes 1,095 families.
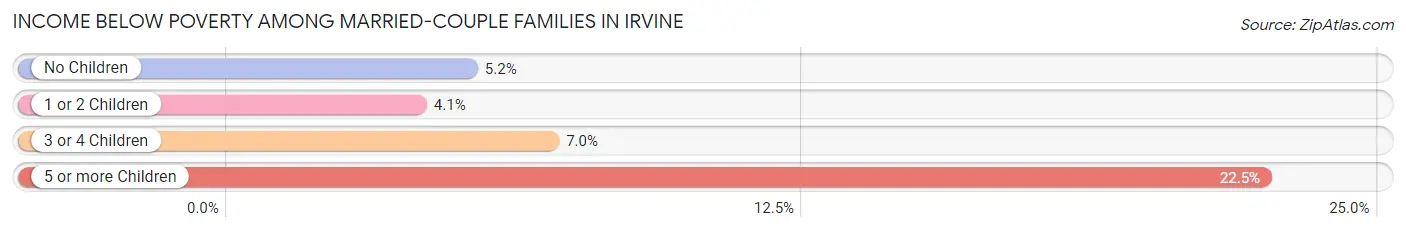
| Children | Above Poverty | Below Poverty |
| No Children | 24,962 (94.8%) | 1,374 (5.2%) |
| 1 or 2 Children | 25,517 (95.9%) | 1,095 (4.1%) |
| 3 or 4 Children | 2,463 (93.0%) | 185 (7.0%) |
| 5 or more Children | 93 (77.5%) | 27 (22.5%) |
| Total | 53,035 (95.2%) | 2,681 (4.8%) |
Income Below Poverty Among Single-Parent Households in Irvine
According to the poverty data in Irvine, 16.2% or 794 single-father households and 24.7% or 2,572 single-mother households are living below the poverty line. Among single-father households, those with 3 or 4 children have the highest poverty rate, with 30 households (21.9%) experiencing poverty. Likewise, among single-mother households, those with 3 or 4 children have the highest poverty rate, with 519 households (59.1%) falling below the poverty line.
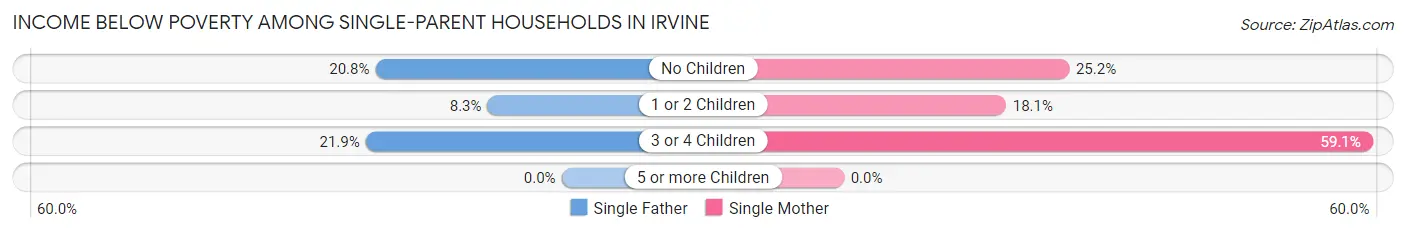
| Children | Single Father | Single Mother |
| No Children | 618 (20.8%) | 1,165 (25.2%) |
| 1 or 2 Children | 146 (8.3%) | 888 (18.1%) |
| 3 or 4 Children | 30 (21.9%) | 519 (59.1%) |
| 5 or more Children | 0 (0.0%) | 0 (0.0%) |
| Total | 794 (16.2%) | 2,572 (24.7%) |
Income Below Poverty Among Married-Couple vs Single-Parent Households in Irvine
The poverty data for Irvine shows that 2,681 of the married-couple family households (4.8%) and 3,366 of the single-parent households (22.0%) are living below the poverty level. Within the married-couple family households, those with 5 or more children have the highest poverty rate, with 27 households (22.5%) falling below the poverty line. Among the single-parent households, those with 3 or 4 children have the highest poverty rate, with 549 household (54.1%) living below poverty.
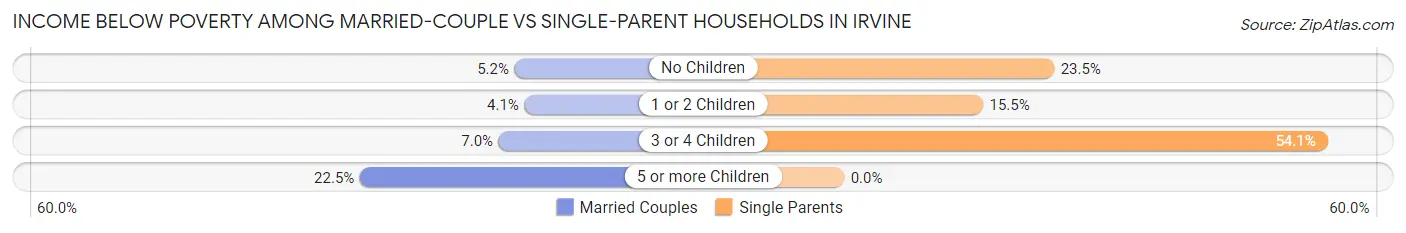
| Children | Married-Couple Families | Single-Parent Households |
| No Children | 1,374 (5.2%) | 1,783 (23.5%) |
| 1 or 2 Children | 1,095 (4.1%) | 1,034 (15.5%) |
| 3 or 4 Children | 185 (7.0%) | 549 (54.1%) |
| 5 or more Children | 27 (22.5%) | 0 (0.0%) |
| Total | 2,681 (4.8%) | 3,366 (22.0%) |
Race in Irvine
The most populous races in Irvine are Asian (134,995 | 44.3%), White / Caucasian (122,058 | 40.1%), and Hispanic or Latino (34,237 | 11.2%).
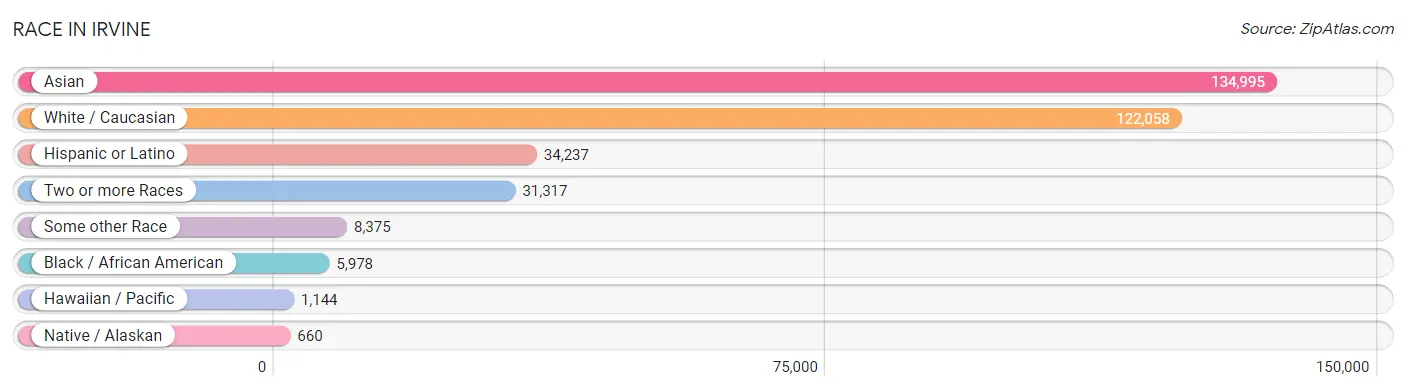
| Race | # Population | % Population |
| Asian | 134,995 | 44.3% |
| Black / African American | 5,978 | 2.0% |
| Hawaiian / Pacific | 1,144 | 0.4% |
| Hispanic or Latino | 34,237 | 11.2% |
| Native / Alaskan | 660 | 0.2% |
| White / Caucasian | 122,058 | 40.1% |
| Two or more Races | 31,317 | 10.3% |
| Some other Race | 8,375 | 2.8% |
| Total | 304,527 | 100.0% |
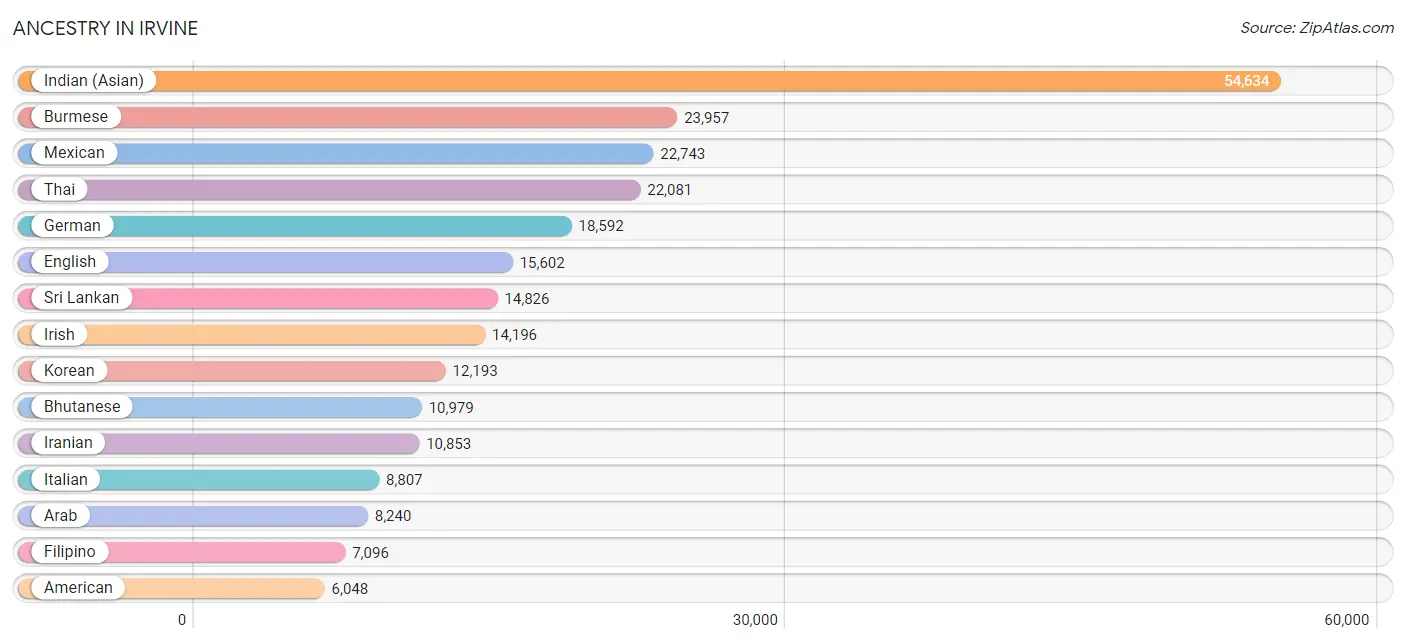
Ancestry in Irvine
The most populous ancestries reported in Irvine are Indian (Asian) (54,634 | 17.9%), Burmese (23,957 | 7.9%), Mexican (22,743 | 7.5%), Thai (22,081 | 7.2%), and German (18,592 | 6.1%), together accounting for 46.6% of all Irvine residents.
| Ancestry | # Population | % Population |
| Afghan | 1,827 | 0.6% |
| African | 272 | 0.1% |
| Albanian | 77 | 0.0% |
| American | 6,048 | 2.0% |
| Apache | 117 | 0.0% |
| Arab | 8,240 | 2.7% |
| Argentinean | 593 | 0.2% |
| Armenian | 1,204 | 0.4% |
| Assyrian / Chaldean / Syriac | 28 | 0.0% |
| Australian | 70 | 0.0% |
| Austrian | 419 | 0.1% |
| Bangladeshi | 154 | 0.1% |
| Barbadian | 1 | 0.0% |
| Basque | 116 | 0.0% |
| Belgian | 245 | 0.1% |
| Bhutanese | 10,979 | 3.6% |
| Blackfeet | 91 | 0.0% |
| Bolivian | 354 | 0.1% |
| Brazilian | 1,012 | 0.3% |
| British | 1,845 | 0.6% |
| Bulgarian | 118 | 0.0% |
| Burmese | 23,957 | 7.9% |
| Cambodian | 62 | 0.0% |
| Canadian | 1,184 | 0.4% |
| Carpatho Rusyn | 13 | 0.0% |
| Celtic | 11 | 0.0% |
| Central American | 3,817 | 1.3% |
| Central American Indian | 167 | 0.1% |
| Cherokee | 619 | 0.2% |
| Chilean | 390 | 0.1% |
| Chinese | 13 | 0.0% |
| Chippewa | 111 | 0.0% |
| Choctaw | 168 | 0.1% |
| Colombian | 903 | 0.3% |
| Costa Rican | 346 | 0.1% |
| Cree | 20 | 0.0% |
| Creek | 32 | 0.0% |
| Croatian | 208 | 0.1% |
| Cuban | 705 | 0.2% |
| Czech | 546 | 0.2% |
| Czechoslovakian | 79 | 0.0% |
| Danish | 931 | 0.3% |
| Dominican | 146 | 0.1% |
| Dutch | 2,024 | 0.7% |
| Eastern European | 830 | 0.3% |
| Ecuadorian | 135 | 0.0% |
| Egyptian | 1,457 | 0.5% |
| English | 15,602 | 5.1% |
| Estonian | 3 | 0.0% |
| Ethiopian | 132 | 0.0% |
| European | 5,003 | 1.6% |
| Filipino | 7,096 | 2.3% |
| Finnish | 197 | 0.1% |
| French | 3,713 | 1.2% |
| French American Indian | 21 | 0.0% |
| French Canadian | 614 | 0.2% |
| German | 18,592 | 6.1% |
| German Russian | 13 | 0.0% |
| Ghanaian | 9 | 0.0% |
| Greek | 1,071 | 0.4% |
| Guamanian / Chamorro | 252 | 0.1% |
| Guatemalan | 636 | 0.2% |
| Guyanese | 59 | 0.0% |
| Honduran | 58 | 0.0% |
| Hungarian | 618 | 0.2% |
| Icelander | 167 | 0.1% |
| Indian (Asian) | 54,634 | 17.9% |
| Indonesian | 159 | 0.1% |
| Iranian | 10,853 | 3.6% |
| Iraqi | 321 | 0.1% |
| Irish | 14,196 | 4.7% |
| Iroquois | 295 | 0.1% |
| Israeli | 711 | 0.2% |
| Italian | 8,807 | 2.9% |
| Jamaican | 117 | 0.0% |
| Japanese | 552 | 0.2% |
| Jordanian | 314 | 0.1% |
| Kenyan | 15 | 0.0% |
| Korean | 12,193 | 4.0% |
| Laotian | 995 | 0.3% |
| Latvian | 114 | 0.0% |
| Lebanese | 950 | 0.3% |
| Lithuanian | 270 | 0.1% |
| Macedonian | 22 | 0.0% |
| Malaysian | 120 | 0.0% |
| Mexican | 22,743 | 7.5% |
| Mexican American Indian | 265 | 0.1% |
| Mongolian | 163 | 0.1% |
| Moroccan | 376 | 0.1% |
| Native Hawaiian | 876 | 0.3% |
| Navajo | 89 | 0.0% |
| Nicaraguan | 145 | 0.1% |
| Nigerian | 264 | 0.1% |
| Northern European | 546 | 0.2% |
| Norwegian | 2,208 | 0.7% |
| Okinawan | 154 | 0.1% |
| Osage | 14 | 0.0% |
| Pakistani | 1,402 | 0.5% |
| Palestinian | 386 | 0.1% |
| Panamanian | 42 | 0.0% |
| Pennsylvania German | 9 | 0.0% |
| Peruvian | 520 | 0.2% |
| Polish | 4,498 | 1.5% |
| Portuguese | 1,244 | 0.4% |
| Potawatomi | 54 | 0.0% |
| Pueblo | 10 | 0.0% |
| Puerto Rican | 920 | 0.3% |
| Romanian | 761 | 0.3% |
| Russian | 4,469 | 1.5% |
| Salvadoran | 2,587 | 0.9% |
| Samoan | 565 | 0.2% |
| Scandinavian | 571 | 0.2% |
| Scotch-Irish | 939 | 0.3% |
| Scottish | 2,797 | 0.9% |
| Serbian | 137 | 0.0% |
| Sioux | 60 | 0.0% |
| Slavic | 13 | 0.0% |
| Slovak | 186 | 0.1% |
| Slovene | 132 | 0.0% |
| South African | 612 | 0.2% |
| South American | 3,114 | 1.0% |
| South American Indian | 67 | 0.0% |
| Spaniard | 926 | 0.3% |
| Spanish | 651 | 0.2% |
| Spanish American | 17 | 0.0% |
| Sri Lankan | 14,826 | 4.9% |
| Subsaharan African | 1,467 | 0.5% |
| Sudanese | 136 | 0.0% |
| Swedish | 3,312 | 1.1% |
| Swiss | 554 | 0.2% |
| Syrian | 1,432 | 0.5% |
| Thai | 22,081 | 7.2% |
| Tongan | 63 | 0.0% |
| Trinidadian and Tobagonian | 38 | 0.0% |
| Turkish | 1,413 | 0.5% |
| Ukrainian | 1,089 | 0.4% |
| Uruguayan | 61 | 0.0% |
| Venezuelan | 59 | 0.0% |
| Vietnamese | 282 | 0.1% |
| Welsh | 793 | 0.3% |
| West Indian | 30 | 0.0% |
| Yaqui | 78 | 0.0% |
| Yugoslavian | 209 | 0.1% | View All 143 Rows |
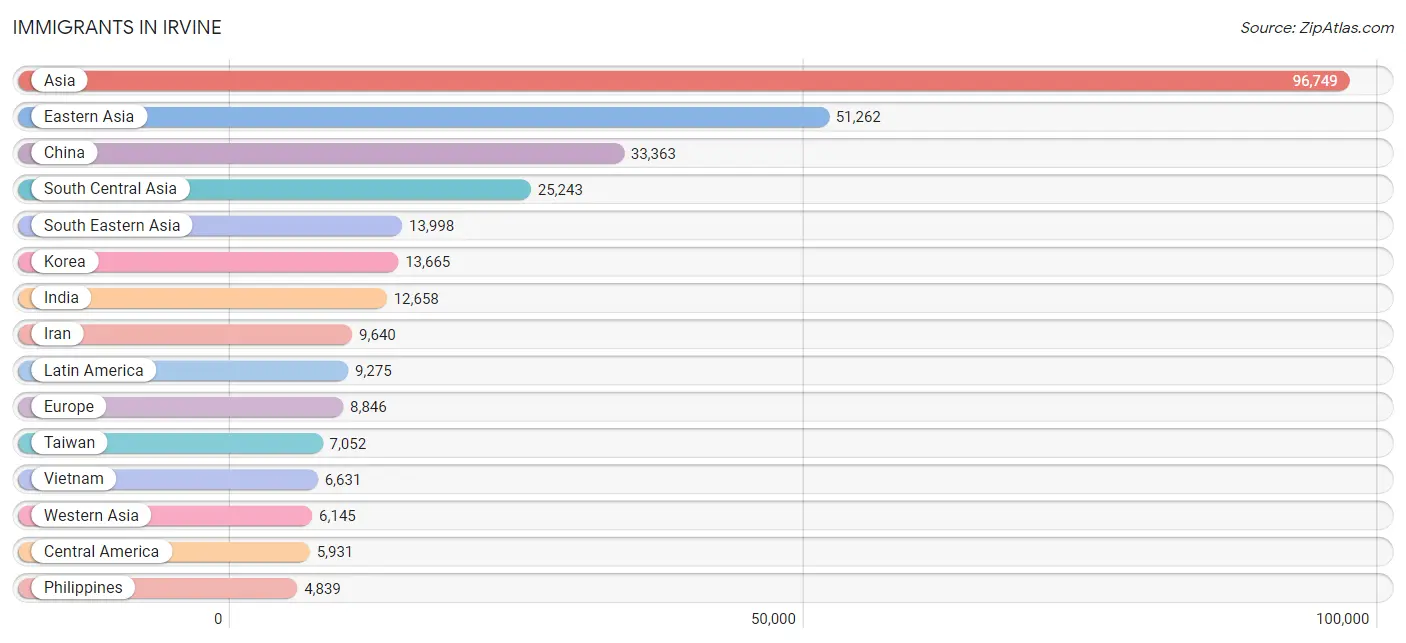
Immigrants in Irvine
The most numerous immigrant groups reported in Irvine came from Asia (96,749 | 31.8%), Eastern Asia (51,262 | 16.8%), China (33,363 | 11.0%), South Central Asia (25,243 | 8.3%), and South Eastern Asia (13,998 | 4.6%), together accounting for 72.5% of all Irvine residents.
| Immigration Origin | # Population | % Population |
| Afghanistan | 962 | 0.3% |
| Africa | 3,367 | 1.1% |
| Albania | 51 | 0.0% |
| Argentina | 292 | 0.1% |
| Armenia | 303 | 0.1% |
| Asia | 96,749 | 31.8% |
| Australia | 203 | 0.1% |
| Austria | 14 | 0.0% |
| Bangladesh | 261 | 0.1% |
| Belarus | 191 | 0.1% |
| Belgium | 182 | 0.1% |
| Bolivia | 150 | 0.1% |
| Bosnia and Herzegovina | 87 | 0.0% |
| Brazil | 932 | 0.3% |
| Bulgaria | 155 | 0.1% |
| Cambodia | 314 | 0.1% |
| Canada | 1,949 | 0.6% |
| Caribbean | 430 | 0.1% |
| Central America | 5,931 | 1.9% |
| Chile | 361 | 0.1% |
| China | 33,363 | 11.0% |
| Colombia | 486 | 0.2% |
| Costa Rica | 302 | 0.1% |
| Croatia | 6 | 0.0% |
| Cuba | 76 | 0.0% |
| Czechoslovakia | 47 | 0.0% |
| Denmark | 43 | 0.0% |
| Dominica | 24 | 0.0% |
| Dominican Republic | 72 | 0.0% |
| Eastern Africa | 391 | 0.1% |
| Eastern Asia | 51,262 | 16.8% |
| Eastern Europe | 4,157 | 1.4% |
| Ecuador | 70 | 0.0% |
| Egypt | 1,378 | 0.4% |
| El Salvador | 1,621 | 0.5% |
| England | 724 | 0.2% |
| Ethiopia | 112 | 0.0% |
| Europe | 8,846 | 2.9% |
| Fiji | 17 | 0.0% |
| France | 567 | 0.2% |
| Germany | 579 | 0.2% |
| Ghana | 12 | 0.0% |
| Greece | 63 | 0.0% |
| Guatemala | 146 | 0.1% |
| Guyana | 127 | 0.0% |
| Haiti | 93 | 0.0% |
| Hong Kong | 1,545 | 0.5% |
| Hungary | 116 | 0.0% |
| India | 12,658 | 4.2% |
| Indonesia | 976 | 0.3% |
| Iran | 9,640 | 3.2% |
| Iraq | 409 | 0.1% |
| Ireland | 53 | 0.0% |
| Israel | 749 | 0.3% |
| Italy | 387 | 0.1% |
| Jamaica | 63 | 0.0% |
| Japan | 4,201 | 1.4% |
| Jordan | 188 | 0.1% |
| Kazakhstan | 97 | 0.0% |
| Kenya | 115 | 0.0% |
| Korea | 13,665 | 4.5% |
| Kuwait | 333 | 0.1% |
| Laos | 49 | 0.0% |
| Latin America | 9,275 | 3.0% |
| Latvia | 20 | 0.0% |
| Lebanon | 508 | 0.2% |
| Liberia | 7 | 0.0% |
| Lithuania | 12 | 0.0% |
| Malaysia | 272 | 0.1% |
| Mexico | 3,773 | 1.2% |
| Moldova | 29 | 0.0% |
| Morocco | 230 | 0.1% |
| Nepal | 48 | 0.0% |
| Netherlands | 253 | 0.1% |
| Nicaragua | 61 | 0.0% |
| Nigeria | 128 | 0.0% |
| Northern Africa | 1,731 | 0.6% |
| Northern Europe | 2,364 | 0.8% |
| Norway | 48 | 0.0% |
| Oceania | 325 | 0.1% |
| Pakistan | 1,242 | 0.4% |
| Panama | 28 | 0.0% |
| Peru | 363 | 0.1% |
| Philippines | 4,839 | 1.6% |
| Poland | 233 | 0.1% |
| Portugal | 26 | 0.0% |
| Romania | 330 | 0.1% |
| Russia | 1,899 | 0.6% |
| Saudi Arabia | 805 | 0.3% |
| Scotland | 88 | 0.0% |
| Senegal | 233 | 0.1% |
| Serbia | 43 | 0.0% |
| Sierra Leone | 81 | 0.0% |
| Singapore | 261 | 0.1% |
| South Africa | 784 | 0.3% |
| South America | 2,914 | 1.0% |
| South Central Asia | 25,243 | 8.3% |
| South Eastern Asia | 13,998 | 4.6% |
| Southern Europe | 581 | 0.2% |
| Spain | 105 | 0.0% |
| Sri Lanka | 291 | 0.1% |
| Sudan | 117 | 0.0% |
| Sweden | 208 | 0.1% |
| Switzerland | 149 | 0.1% |
| Syria | 1,511 | 0.5% |
| Taiwan | 7,052 | 2.3% |
| Thailand | 481 | 0.2% |
| Trinidad and Tobago | 38 | 0.0% |
| Turkey | 1,042 | 0.3% |
| Uganda | 58 | 0.0% |
| Ukraine | 685 | 0.2% |
| Uruguay | 68 | 0.0% |
| Uzbekistan | 44 | 0.0% |
| Venezuela | 52 | 0.0% |
| Vietnam | 6,631 | 2.2% |
| Western Africa | 461 | 0.2% |
| Western Asia | 6,145 | 2.0% |
| Western Europe | 1,744 | 0.6% |
| Yemen | 44 | 0.0% |
| Zimbabwe | 12 | 0.0% | View All 120 Rows |
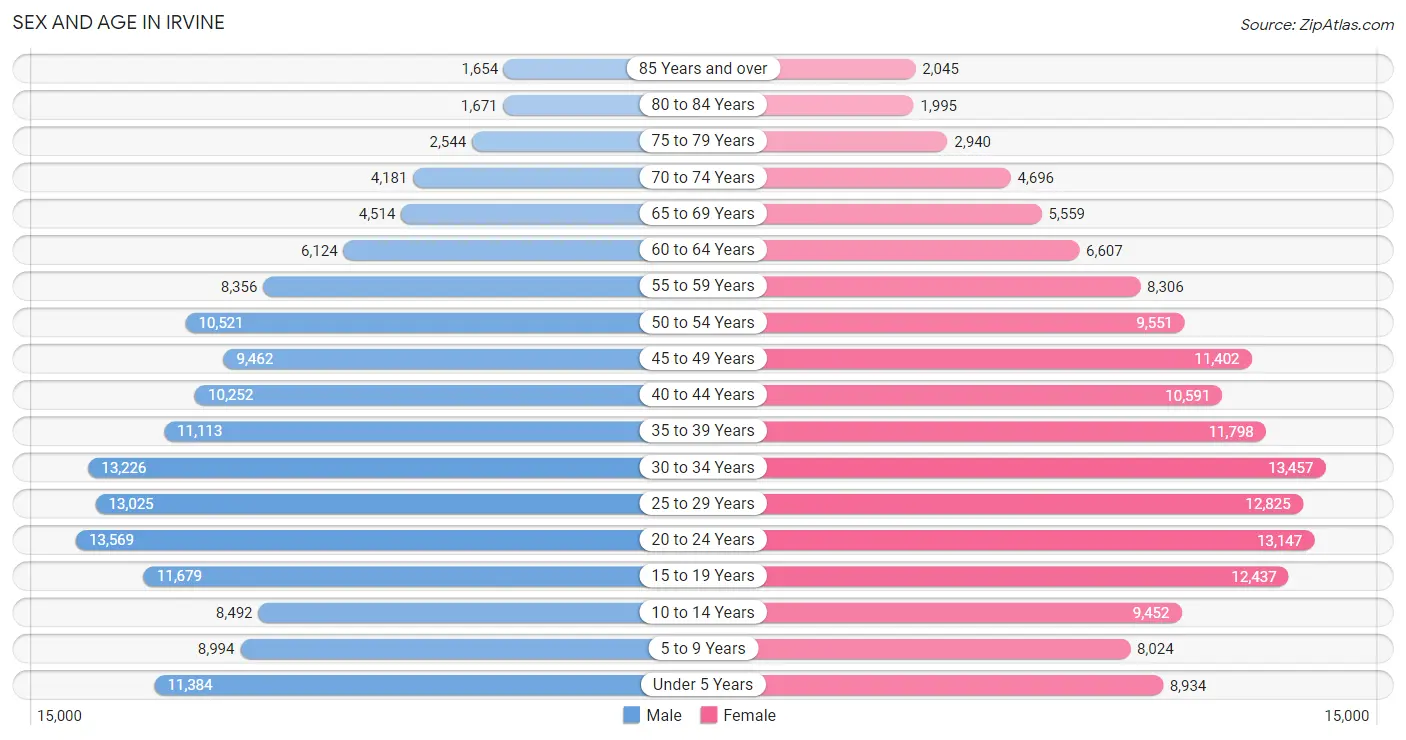
Sex and Age in Irvine
Sex and Age in Irvine
The most populous age groups in Irvine are 20 to 24 Years (13,569 | 9.0%) for men and 30 to 34 Years (13,457 | 8.7%) for women.
| Age Bracket | Male | Female |
| Under 5 Years | 11,384 (7.5%) | 8,934 (5.8%) |
| 5 to 9 Years | 8,994 (6.0%) | 8,024 (5.2%) |
| 10 to 14 Years | 8,492 (5.6%) | 9,452 (6.1%) |
| 15 to 19 Years | 11,679 (7.7%) | 12,437 (8.1%) |
| 20 to 24 Years | 13,569 (9.0%) | 13,147 (8.6%) |
| 25 to 29 Years | 13,025 (8.6%) | 12,825 (8.3%) |
| 30 to 34 Years | 13,226 (8.8%) | 13,457 (8.7%) |
| 35 to 39 Years | 11,113 (7.4%) | 11,798 (7.7%) |
| 40 to 44 Years | 10,252 (6.8%) | 10,591 (6.9%) |
| 45 to 49 Years | 9,462 (6.3%) | 11,402 (7.4%) |
| 50 to 54 Years | 10,521 (7.0%) | 9,551 (6.2%) |
| 55 to 59 Years | 8,356 (5.5%) | 8,306 (5.4%) |
| 60 to 64 Years | 6,124 (4.1%) | 6,607 (4.3%) |
| 65 to 69 Years | 4,514 (3.0%) | 5,559 (3.6%) |
| 70 to 74 Years | 4,181 (2.8%) | 4,696 (3.0%) |
| 75 to 79 Years | 2,544 (1.7%) | 2,940 (1.9%) |
| 80 to 84 Years | 1,671 (1.1%) | 1,995 (1.3%) |
| 85 Years and over | 1,654 (1.1%) | 2,045 (1.3%) |
| Total | 150,761 (100.0%) | 153,766 (100.0%) |
Families and Households in Irvine
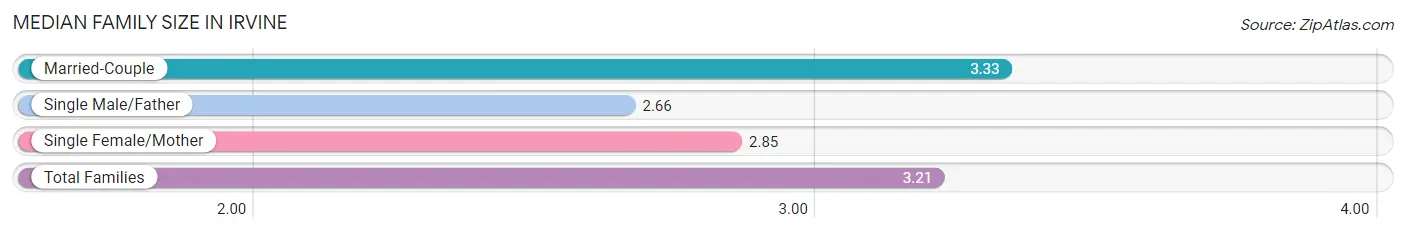
Median Family Size in Irvine
The median family size in Irvine is 3.21 persons per family, with married-couple families (55,716 | 78.5%) accounting for the largest median family size of 3.33 persons per family. On the other hand, single male/father families (4,889 | 6.9%) represent the smallest median family size with 2.66 persons per family.
| Family Type | # Families | Family Size |
| Married-Couple | 55,716 (78.5%) | 3.33 |
| Single Male/Father | 4,889 (6.9%) | 2.66 |
| Single Female/Mother | 10,409 (14.7%) | 2.85 |
| Total Families | 71,014 (100.0%) | 3.21 |
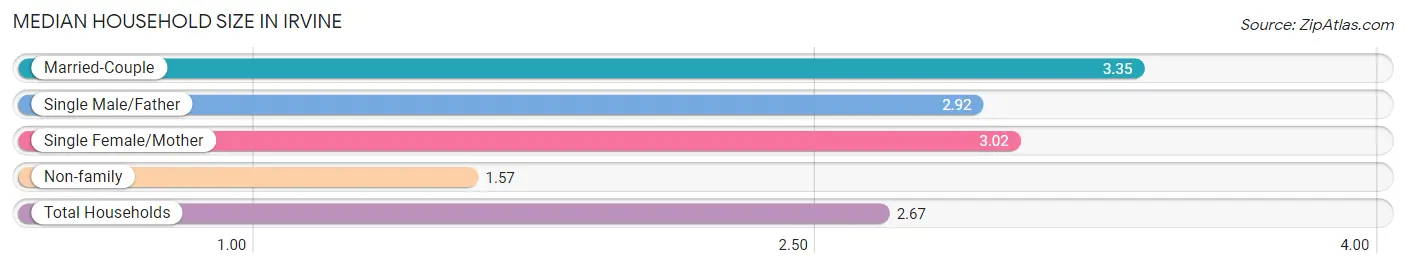
Median Household Size in Irvine
The median household size in Irvine is 2.67 persons per household, with married-couple households (55,716 | 50.4%) accounting for the largest median household size of 3.35 persons per household. non-family households (39,451 | 35.7%) represent the smallest median household size with 1.57 persons per household.
| Household Type | # Households | Household Size |
| Married-Couple | 55,716 (50.4%) | 3.35 |
| Single Male/Father | 4,889 (4.4%) | 2.92 |
| Single Female/Mother | 10,409 (9.4%) | 3.02 |
| Non-family | 39,451 (35.7%) | 1.57 |
| Total Households | 110,465 (100.0%) | 2.67 |
Household Size by Marriage Status in Irvine
Out of a total of 110,465 households in Irvine, 71,014 (64.3%) are family households, while 39,451 (35.7%) are nonfamily households. The most numerous type of family households are 2-person households, comprising 24,930, and the most common type of nonfamily households are 1-person households, comprising 25,993.
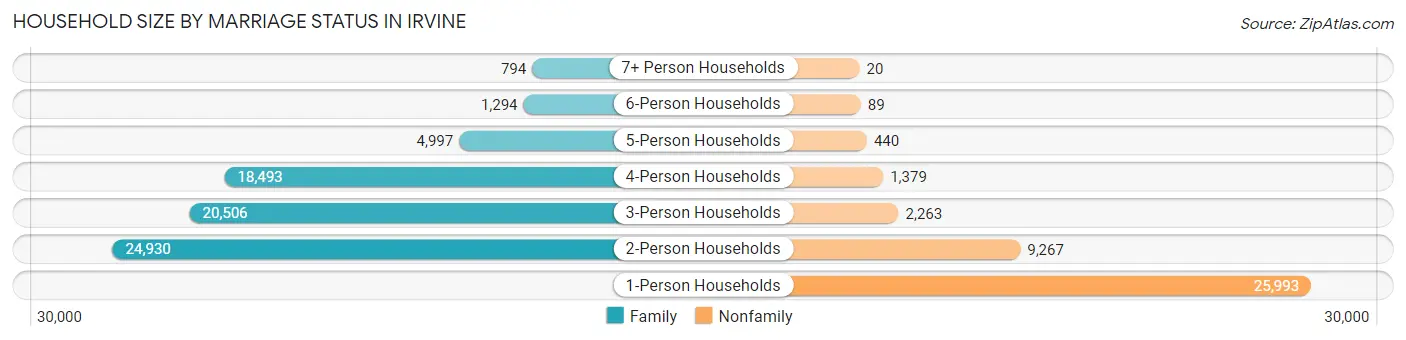
| Household Size | Family Households | Nonfamily Households |
| 1-Person Households | - | 25,993 (23.5%) |
| 2-Person Households | 24,930 (22.6%) | 9,267 (8.4%) |
| 3-Person Households | 20,506 (18.6%) | 2,263 (2.1%) |
| 4-Person Households | 18,493 (16.7%) | 1,379 (1.3%) |
| 5-Person Households | 4,997 (4.5%) | 440 (0.4%) |
| 6-Person Households | 1,294 (1.2%) | 89 (0.1%) |
| 7+ Person Households | 794 (0.7%) | 20 (0.0%) |
| Total | 71,014 (64.3%) | 39,451 (35.7%) |
Female Fertility in Irvine
Fertility by Age in Irvine
Average fertility rate in Irvine is 41.0 births per 1,000 women. Women in the age bracket of 20 to 34 years have the highest fertility rate with 50.0 births per 1,000 women. Women in the age bracket of 20 to 34 years acount for 54.1% of all women with births.
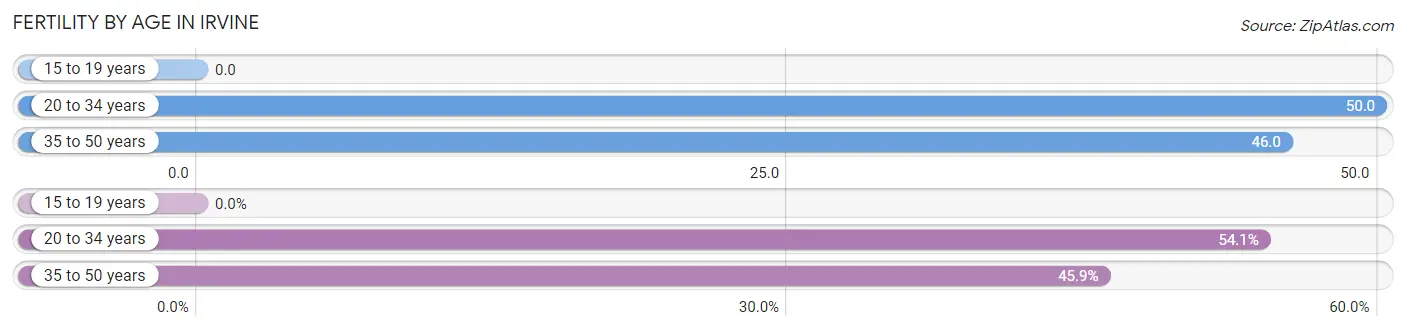
| Age Bracket | Women with Births | Births / 1,000 Women |
| 15 to 19 years | 0 (0.0%) | 0.0 |
| 20 to 34 years | 1,976 (54.1%) | 50.0 |
| 35 to 50 years | 1,678 (45.9%) | 46.0 |
| Total | 3,654 (100.0%) | 41.0 |
Fertility by Age by Marriage Status in Irvine
84.0% of women with births (3,654) in Irvine are married. The highest percentage of unmarried women with births falls into 20 to 34 years age bracket with 20.9% of them unmarried at the time of birth, while the lowest percentage of unmarried women with births belong to 35 to 50 years age bracket with 10.1% of them unmarried.
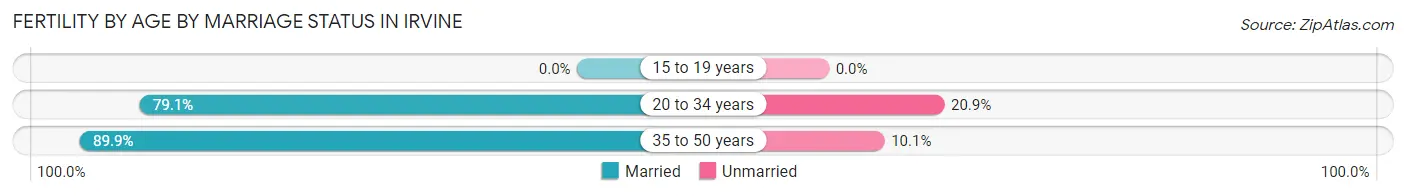
| Age Bracket | Married | Unmarried |
| 15 to 19 years | 0 (0.0%) | 0 (0.0%) |
| 20 to 34 years | 1,563 (79.1%) | 413 (20.9%) |
| 35 to 50 years | 1,509 (89.9%) | 169 (10.1%) |
| Total | 3,069 (84.0%) | 585 (16.0%) |
Fertility by Education in Irvine
Average fertility rate in Irvine is 41.0 births per 1,000 women. Women with the education attainment of bachelor's degree have the highest fertility rate of 57.0 births per 1,000 women, while women with the education attainment of high school diploma have the lowest fertility at 21.0 births per 1,000 women. Women with the education attainment of bachelor's degree represent 46.5% of all women with births.
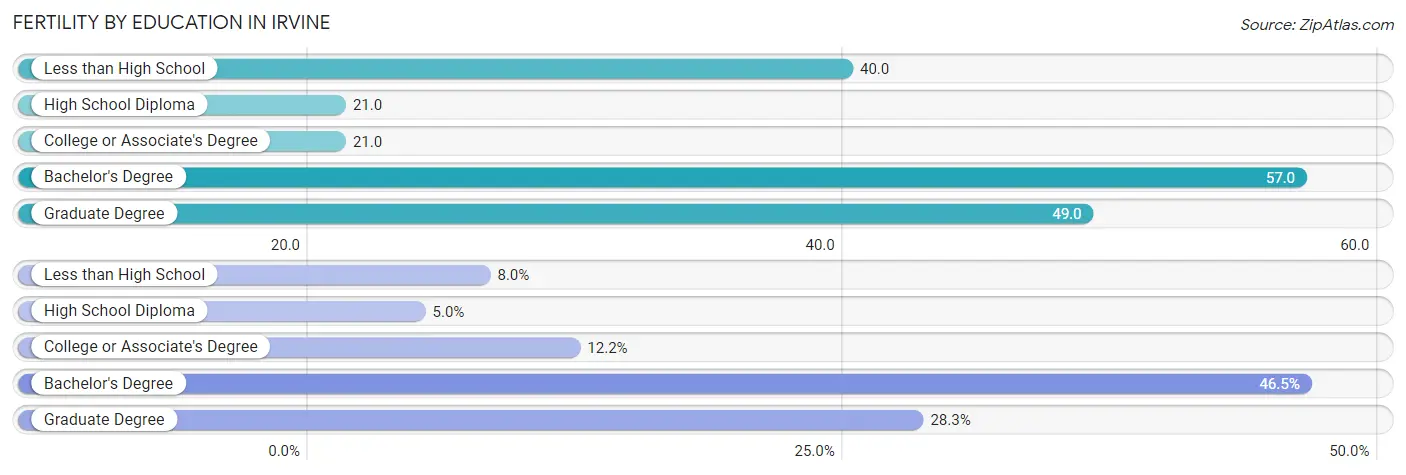
| Educational Attainment | Women with Births | Births / 1,000 Women |
| Less than High School | 293 (8.0%) | 40.0 |
| High School Diploma | 182 (5.0%) | 21.0 |
| College or Associate's Degree | 447 (12.2%) | 21.0 |
| Bachelor's Degree | 1,698 (46.5%) | 57.0 |
| Graduate Degree | 1,034 (28.3%) | 49.0 |
| Total | 3,654 (100.0%) | 41.0 |
Fertility by Education by Marriage Status in Irvine
16.0% of women with births in Irvine are unmarried. Women with the educational attainment of high school diploma are most likely to be married with 96.7% of them married at childbirth, while women with the educational attainment of less than high school are least likely to be married with 91.1% of them unmarried at childbirth.
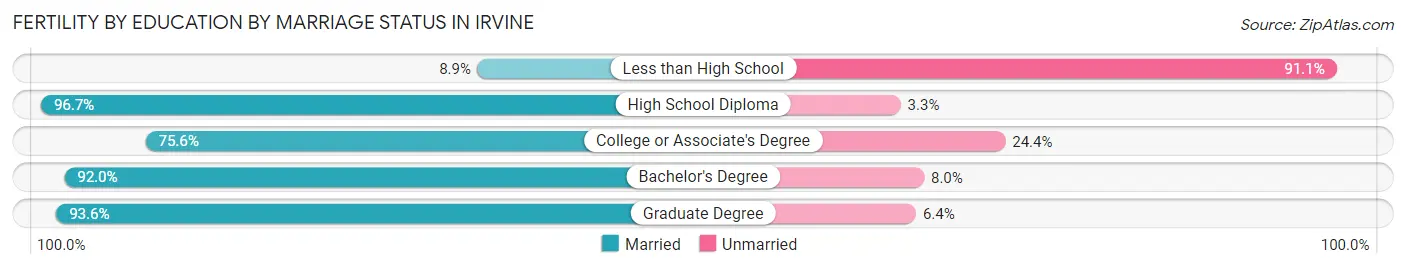
| Educational Attainment | Married | Unmarried |
| Less than High School | 26 (8.9%) | 267 (91.1%) |
| High School Diploma | 176 (96.7%) | 6 (3.3%) |
| College or Associate's Degree | 338 (75.6%) | 109 (24.4%) |
| Bachelor's Degree | 1,562 (92.0%) | 136 (8.0%) |
| Graduate Degree | 968 (93.6%) | 66 (6.4%) |
| Total | 3,069 (84.0%) | 585 (16.0%) |
Employment Characteristics in Irvine
Employment by Class of Employer in Irvine
Among the 148,227 employed individuals in Irvine, private company employees (103,032 | 69.5%), self-employed (not incorporated) (9,877 | 6.7%), and not-for-profit organizations (8,843 | 6.0%) make up the most common classes of employment.
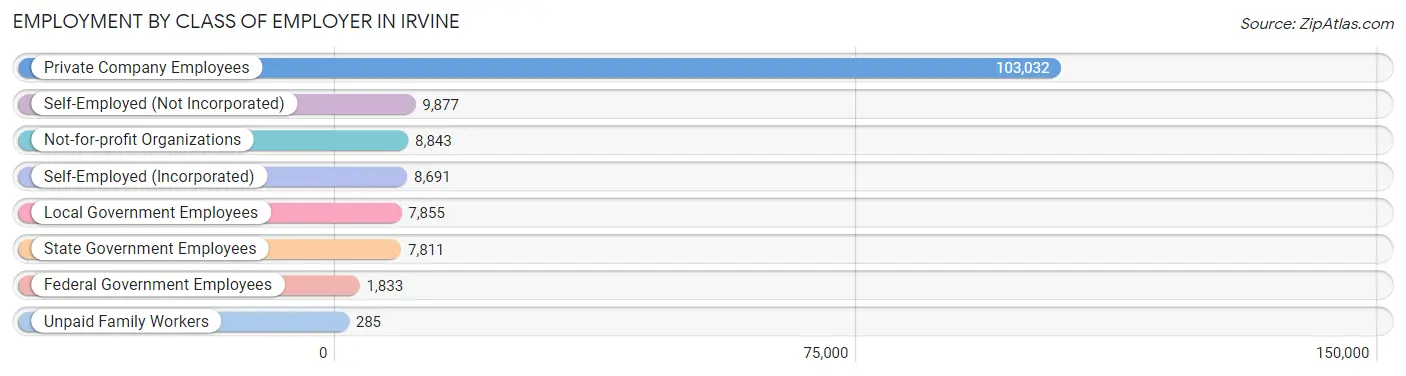
| Employer Class | # Employees | % Employees |
| Private Company Employees | 103,032 | 69.5% |
| Self-Employed (Incorporated) | 8,691 | 5.9% |
| Self-Employed (Not Incorporated) | 9,877 | 6.7% |
| Not-for-profit Organizations | 8,843 | 6.0% |
| Local Government Employees | 7,855 | 5.3% |
| State Government Employees | 7,811 | 5.3% |
| Federal Government Employees | 1,833 | 1.2% |
| Unpaid Family Workers | 285 | 0.2% |
| Total | 148,227 | 100.0% |
Employment Status by Age in Irvine
According to the labor force statistics for Irvine, out of the total population over 16 years of age (245,296), 65.6% or 160,914 individuals are in the labor force, with 5.5% or 8,850 of them unemployed. The age group with the highest labor force participation rate is 30 to 34 years, with 85.9% or 22,921 individuals in the labor force. Within the labor force, the 16 to 19 years age range has the highest percentage of unemployed individuals, with 15.4% or 708 of them being unemployed.
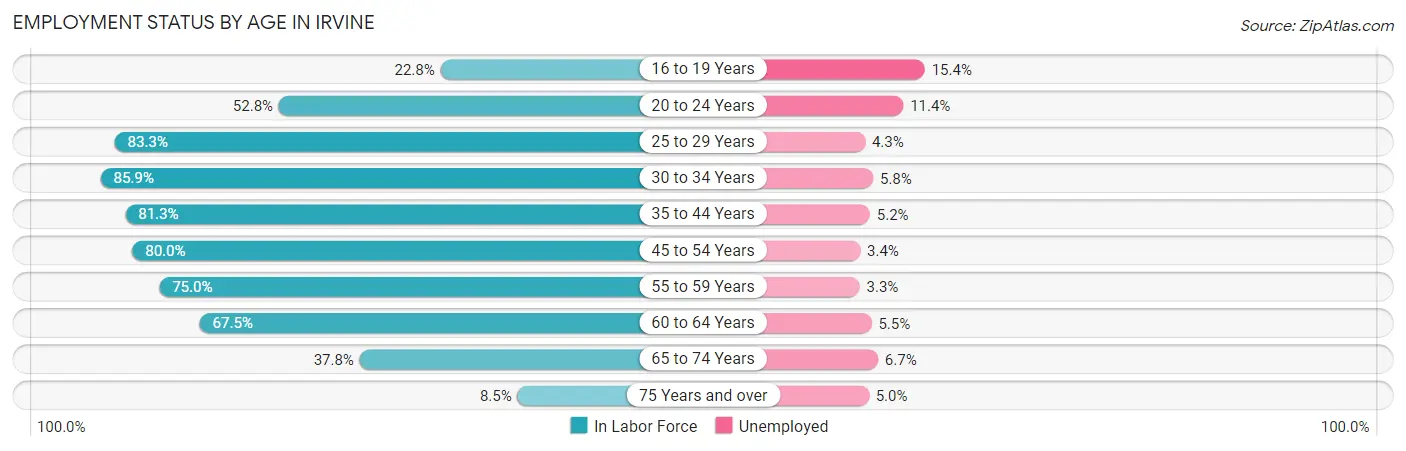
| Age Bracket | In Labor Force | Unemployed |
| 16 to 19 Years | 4,598 (22.8%) | 708 (15.4%) |
| 20 to 24 Years | 14,106 (52.8%) | 1,608 (11.4%) |
| 25 to 29 Years | 21,533 (83.3%) | 926 (4.3%) |
| 30 to 34 Years | 22,921 (85.9%) | 1,329 (5.8%) |
| 35 to 44 Years | 35,572 (81.3%) | 1,850 (5.2%) |
| 45 to 54 Years | 32,749 (80.0%) | 1,113 (3.4%) |
| 55 to 59 Years | 12,496 (75.0%) | 412 (3.3%) |
| 60 to 64 Years | 8,593 (67.5%) | 473 (5.5%) |
| 65 to 74 Years | 7,163 (37.8%) | 480 (6.7%) |
| 75 Years and over | 1,092 (8.5%) | 55 (5.0%) |
| Total | 160,914 (65.6%) | 8,850 (5.5%) |
Employment Status by Educational Attainment in Irvine
According to labor force statistics for Irvine, 80.3% of individuals (133,793) out of the total population between 25 and 64 years of age (166,616) are in the labor force, with 4.5% or 6,021 of them being unemployed. The group with the highest labor force participation rate are those with the educational attainment of bachelor's degree or higher, with 83.2% or 100,194 individuals in the labor force. Within the labor force, individuals with less than high school education have the highest percentage of unemployment, with 14.0% or 399 of them being unemployed.
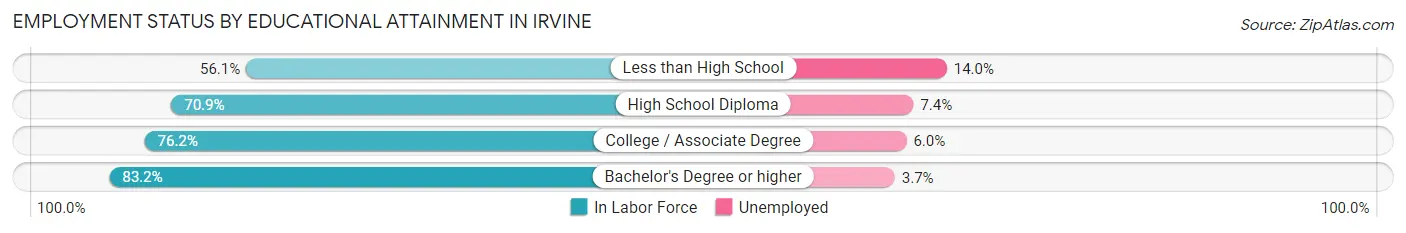
| Educational Attainment | In Labor Force | Unemployed |
| Less than High School | 2,849 (56.1%) | 711 (14.0%) |
| High School Diploma | 6,832 (70.9%) | 713 (7.4%) |
| College / Associate Degree | 23,984 (76.2%) | 1,888 (6.0%) |
| Bachelor's Degree or higher | 100,194 (83.2%) | 4,456 (3.7%) |
| Total | 133,793 (80.3%) | 7,498 (4.5%) |
Employment Occupations by Sex in Irvine
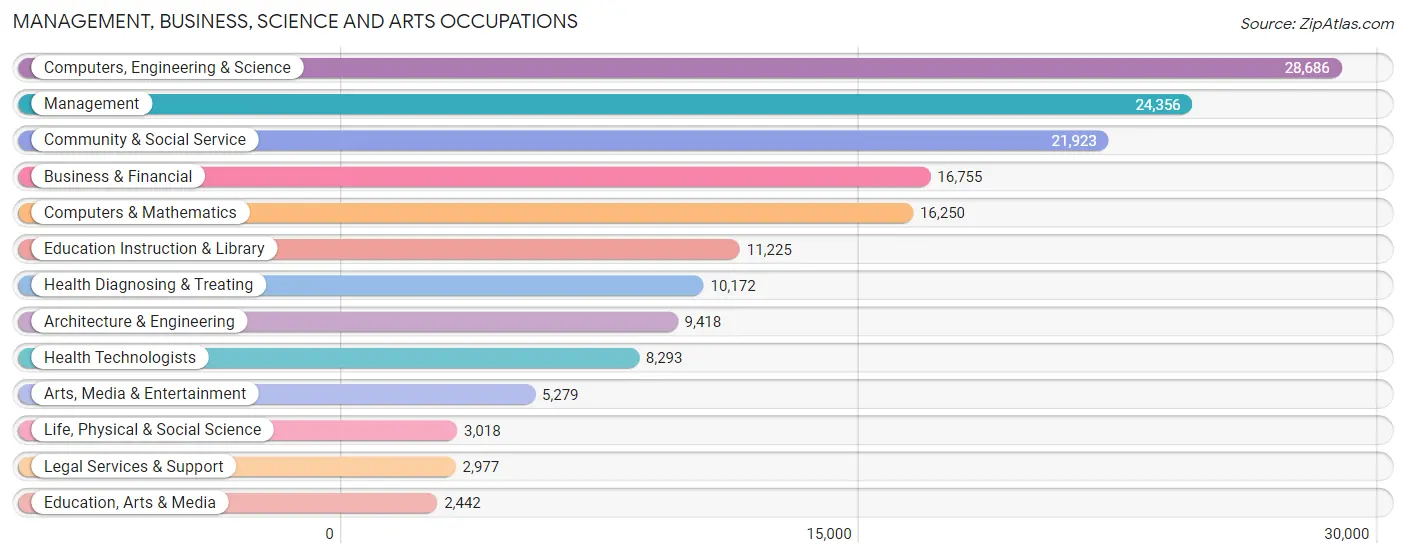
Management, Business, Science and Arts Occupations
The most common Management, Business, Science and Arts occupations in Irvine are Computers, Engineering & Science (28,686 | 18.9%), Management (24,356 | 16.1%), Community & Social Service (21,923 | 14.5%), Business & Financial (16,755 | 11.1%), and Computers & Mathematics (16,250 | 10.7%).
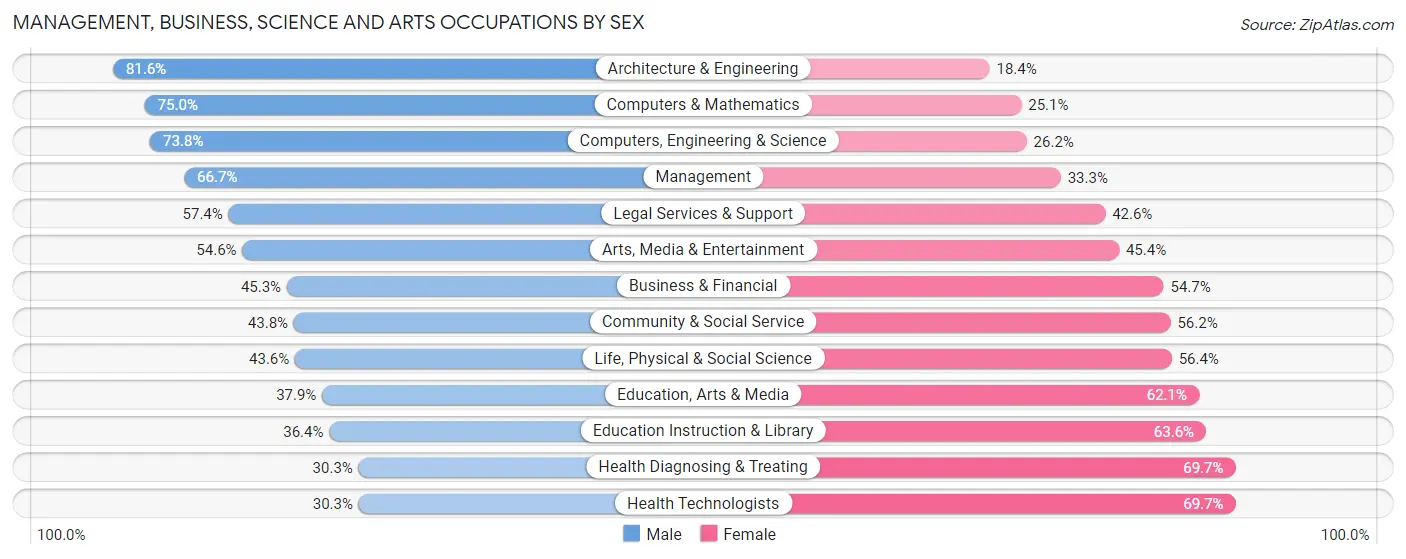
Management, Business, Science and Arts Occupations by Sex
Within the Management, Business, Science and Arts occupations in Irvine, the most male-oriented occupations are Architecture & Engineering (81.6%), Computers & Mathematics (75.0%), and Computers, Engineering & Science (73.8%), while the most female-oriented occupations are Health Technologists (69.7%), Health Diagnosing & Treating (69.7%), and Education Instruction & Library (63.6%).
| Occupation | Male | Female |
| Management | 16,249 (66.7%) | 8,107 (33.3%) |
| Business & Financial | 7,585 (45.3%) | 9,170 (54.7%) |
| Computers, Engineering & Science | 21,176 (73.8%) | 7,510 (26.2%) |
| Computers & Mathematics | 12,179 (75.0%) | 4,071 (25.1%) |
| Architecture & Engineering | 7,682 (81.6%) | 1,736 (18.4%) |
| Life, Physical & Social Science | 1,315 (43.6%) | 1,703 (56.4%) |
| Community & Social Service | 9,606 (43.8%) | 12,317 (56.2%) |
| Education, Arts & Media | 926 (37.9%) | 1,516 (62.1%) |
| Legal Services & Support | 1,710 (57.4%) | 1,267 (42.6%) |
| Education Instruction & Library | 4,090 (36.4%) | 7,135 (63.6%) |
| Arts, Media & Entertainment | 2,880 (54.6%) | 2,399 (45.4%) |
| Health Diagnosing & Treating | 3,083 (30.3%) | 7,089 (69.7%) |
| Health Technologists | 2,511 (30.3%) | 5,782 (69.7%) |
| Total (Category) | 57,699 (56.6%) | 44,193 (43.4%) |
| Total (Overall) | 82,574 (54.5%) | 68,939 (45.5%) |
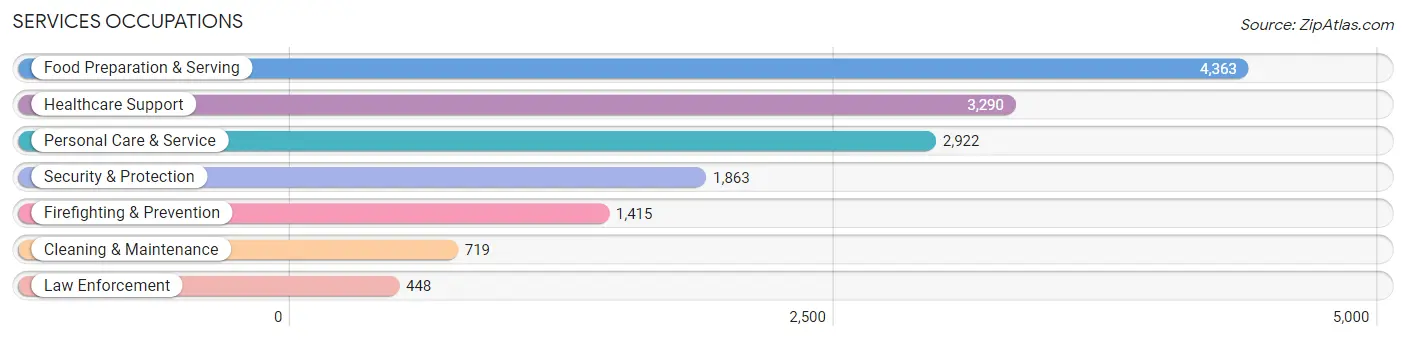
Services Occupations
The most common Services occupations in Irvine are Food Preparation & Serving (4,363 | 2.9%), Healthcare Support (3,290 | 2.2%), Personal Care & Service (2,922 | 1.9%), Security & Protection (1,863 | 1.2%), and Firefighting & Prevention (1,415 | 0.9%).
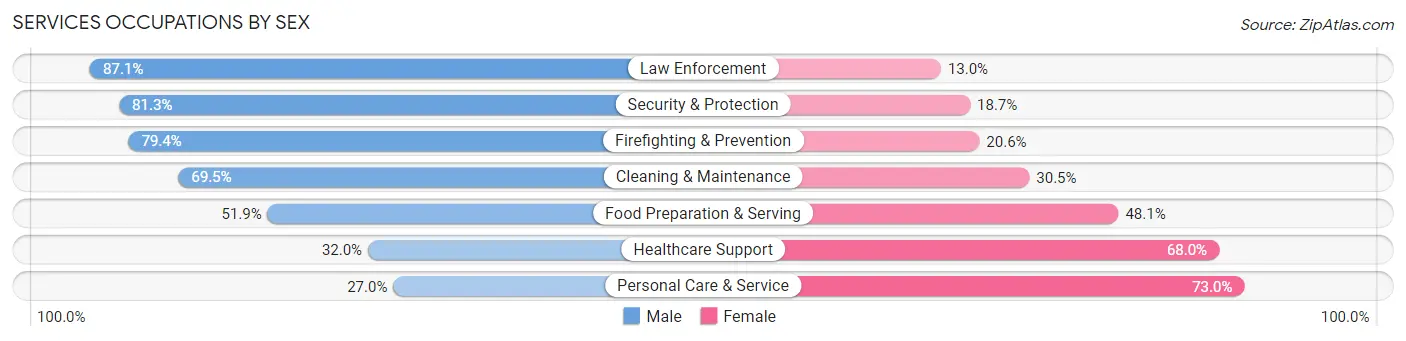
Services Occupations by Sex
Within the Services occupations in Irvine, the most male-oriented occupations are Law Enforcement (87.1%), Security & Protection (81.3%), and Firefighting & Prevention (79.4%), while the most female-oriented occupations are Personal Care & Service (73.0%), Healthcare Support (68.0%), and Food Preparation & Serving (48.1%).
| Occupation | Male | Female |
| Healthcare Support | 1,053 (32.0%) | 2,237 (68.0%) |
| Security & Protection | 1,514 (81.3%) | 349 (18.7%) |
| Firefighting & Prevention | 1,124 (79.4%) | 291 (20.6%) |
| Law Enforcement | 390 (87.1%) | 58 (13.0%) |
| Food Preparation & Serving | 2,264 (51.9%) | 2,099 (48.1%) |
| Cleaning & Maintenance | 500 (69.5%) | 219 (30.5%) |
| Personal Care & Service | 789 (27.0%) | 2,133 (73.0%) |
| Total (Category) | 6,120 (46.5%) | 7,037 (53.5%) |
| Total (Overall) | 82,574 (54.5%) | 68,939 (45.5%) |
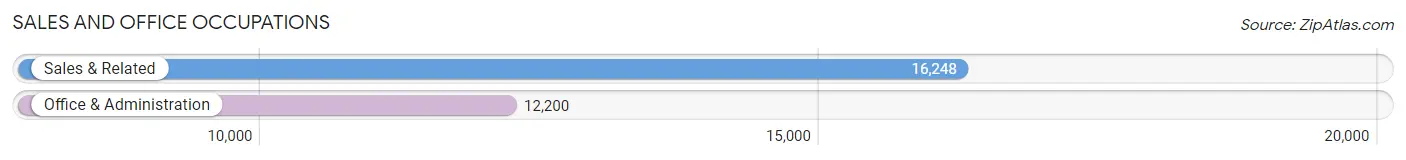
Sales and Office Occupations
The most common Sales and Office occupations in Irvine are Sales & Related (16,248 | 10.7%), and Office & Administration (12,200 | 8.1%).
Sales and Office Occupations by Sex
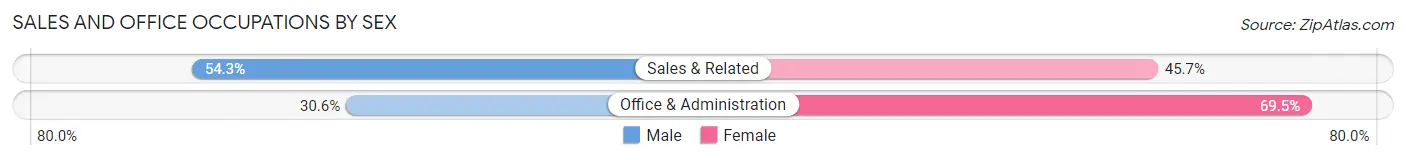
| Occupation | Male | Female |
| Sales & Related | 8,817 (54.3%) | 7,431 (45.7%) |
| Office & Administration | 3,727 (30.5%) | 8,473 (69.5%) |
| Total (Category) | 12,544 (44.1%) | 15,904 (55.9%) |
| Total (Overall) | 82,574 (54.5%) | 68,939 (45.5%) |
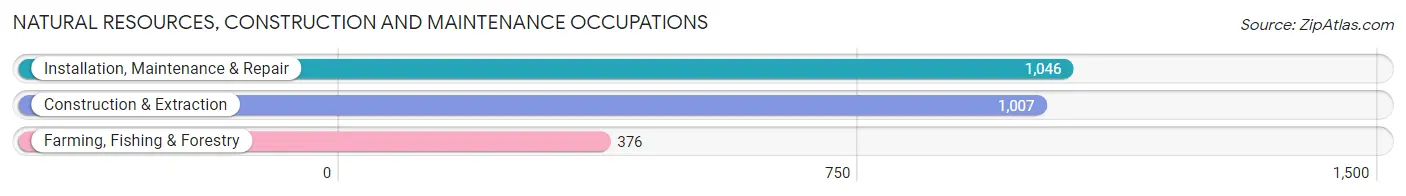
Natural Resources, Construction and Maintenance Occupations
The most common Natural Resources, Construction and Maintenance occupations in Irvine are Installation, Maintenance & Repair (1,046 | 0.7%), Construction & Extraction (1,007 | 0.7%), and Farming, Fishing & Forestry (376 | 0.3%).
Natural Resources, Construction and Maintenance Occupations by Sex
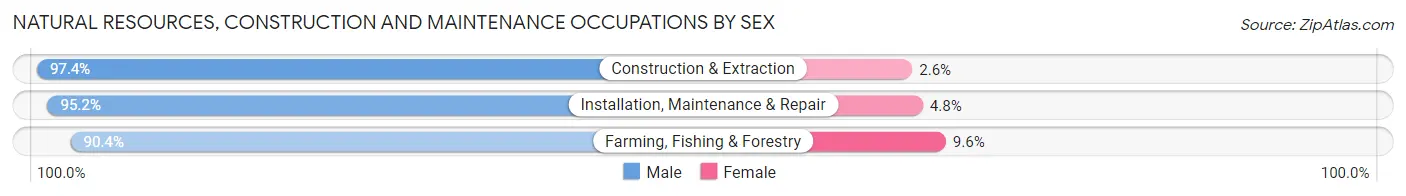
| Occupation | Male | Female |
| Farming, Fishing & Forestry | 340 (90.4%) | 36 (9.6%) |
| Construction & Extraction | 981 (97.4%) | 26 (2.6%) |
| Installation, Maintenance & Repair | 996 (95.2%) | 50 (4.8%) |
| Total (Category) | 2,317 (95.4%) | 112 (4.6%) |
| Total (Overall) | 82,574 (54.5%) | 68,939 (45.5%) |
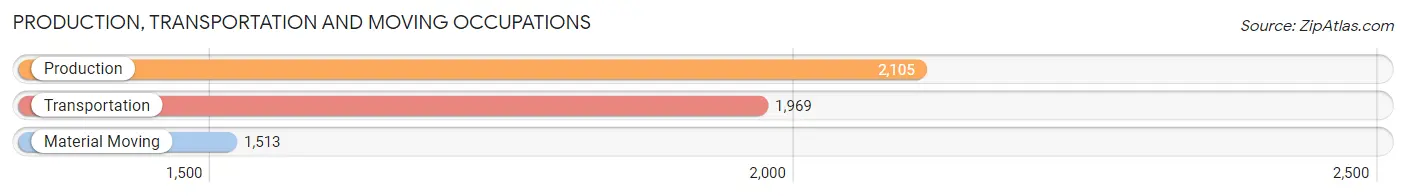
Production, Transportation and Moving Occupations
The most common Production, Transportation and Moving occupations in Irvine are Production (2,105 | 1.4%), Transportation (1,969 | 1.3%), and Material Moving (1,513 | 1.0%).
Production, Transportation and Moving Occupations by Sex
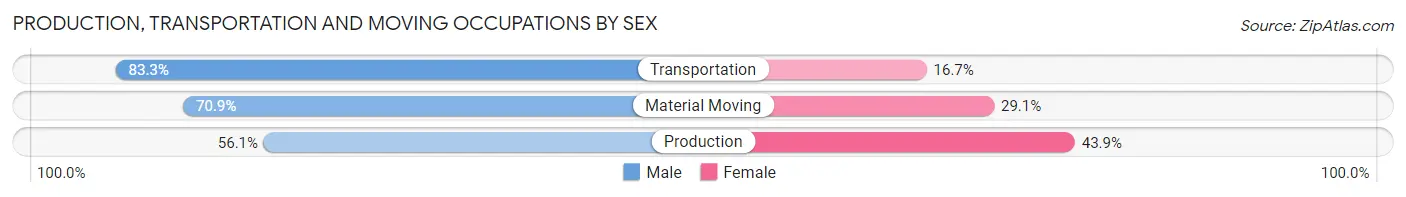
| Occupation | Male | Female |
| Production | 1,181 (56.1%) | 924 (43.9%) |
| Transportation | 1,640 (83.3%) | 329 (16.7%) |
| Material Moving | 1,073 (70.9%) | 440 (29.1%) |
| Total (Category) | 3,894 (69.7%) | 1,693 (30.3%) |
| Total (Overall) | 82,574 (54.5%) | 68,939 (45.5%) |
Employment Industries by Sex in Irvine
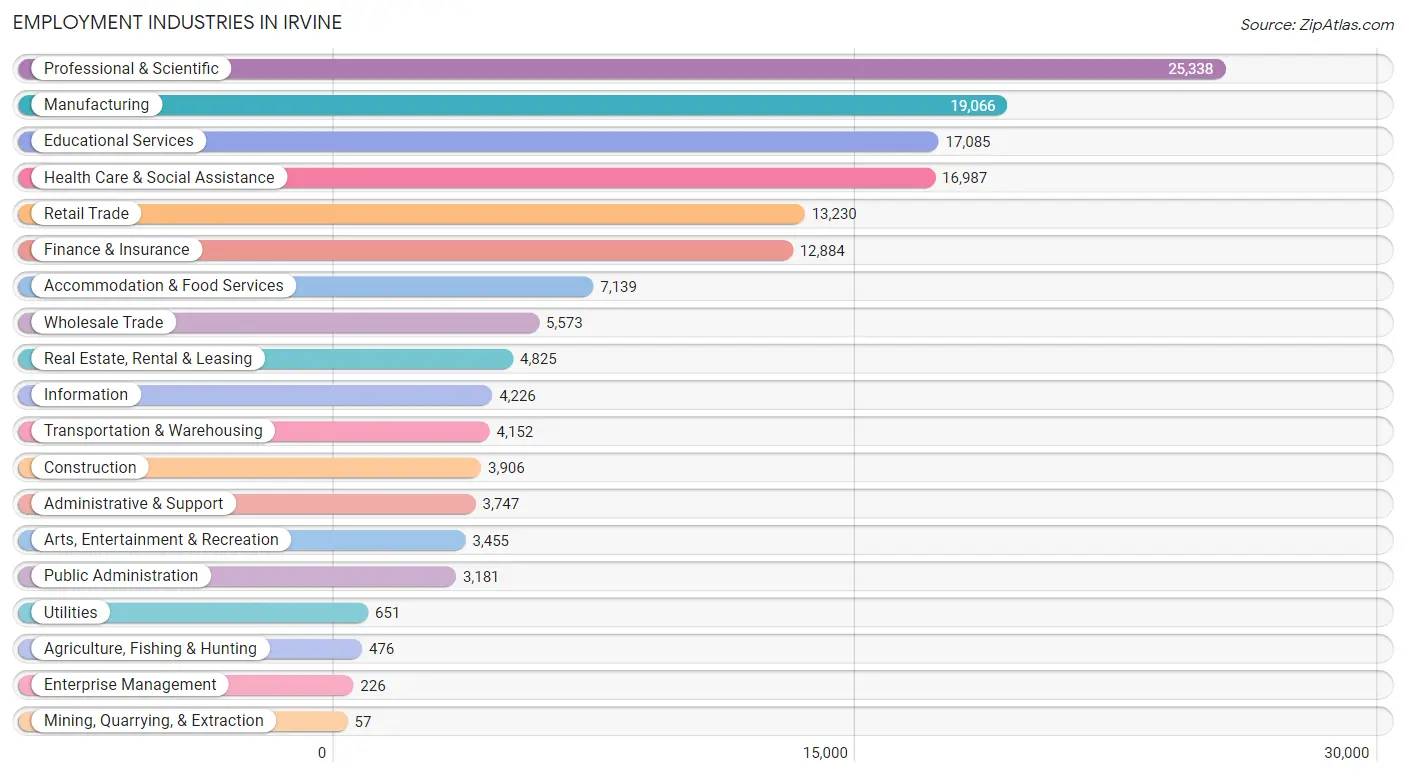
Employment Industries in Irvine
The major employment industries in Irvine include Professional & Scientific (25,338 | 16.7%), Manufacturing (19,066 | 12.6%), Educational Services (17,085 | 11.3%), Health Care & Social Assistance (16,987 | 11.2%), and Retail Trade (13,230 | 8.7%).
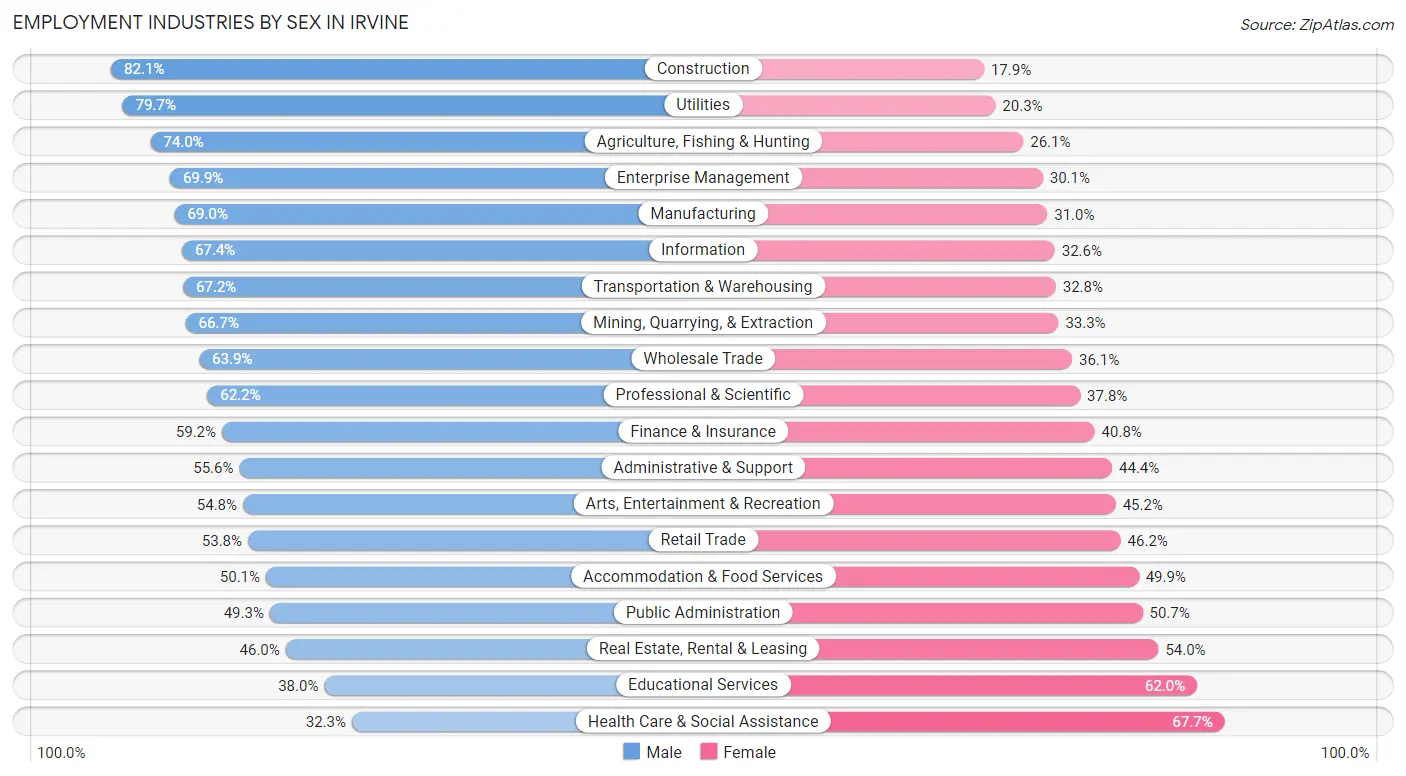
Employment Industries by Sex in Irvine
The Irvine industries that see more men than women are Construction (82.1%), Utilities (79.7%), and Agriculture, Fishing & Hunting (74.0%), whereas the industries that tend to have a higher number of women are Health Care & Social Assistance (67.7%), Educational Services (62.0%), and Real Estate, Rental & Leasing (54.0%).
| Industry | Male | Female |
| Agriculture, Fishing & Hunting | 352 (74.0%) | 124 (26.1%) |
| Mining, Quarrying, & Extraction | 38 (66.7%) | 19 (33.3%) |
| Construction | 3,206 (82.1%) | 700 (17.9%) |
| Manufacturing | 13,150 (69.0%) | 5,916 (31.0%) |
| Wholesale Trade | 3,559 (63.9%) | 2,014 (36.1%) |
| Retail Trade | 7,117 (53.8%) | 6,113 (46.2%) |
| Transportation & Warehousing | 2,791 (67.2%) | 1,361 (32.8%) |
| Utilities | 519 (79.7%) | 132 (20.3%) |
| Information | 2,849 (67.4%) | 1,377 (32.6%) |
| Finance & Insurance | 7,624 (59.2%) | 5,260 (40.8%) |
| Real Estate, Rental & Leasing | 2,218 (46.0%) | 2,607 (54.0%) |
| Professional & Scientific | 15,754 (62.2%) | 9,584 (37.8%) |
| Enterprise Management | 158 (69.9%) | 68 (30.1%) |
| Administrative & Support | 2,082 (55.6%) | 1,665 (44.4%) |
| Educational Services | 6,489 (38.0%) | 10,596 (62.0%) |
| Health Care & Social Assistance | 5,484 (32.3%) | 11,503 (67.7%) |
| Arts, Entertainment & Recreation | 1,894 (54.8%) | 1,561 (45.2%) |
| Accommodation & Food Services | 3,574 (50.1%) | 3,565 (49.9%) |
| Public Administration | 1,567 (49.3%) | 1,614 (50.7%) |
| Total | 82,574 (54.5%) | 68,939 (45.5%) |
Education in Irvine
School Enrollment in Irvine
The most common levels of schooling among the 100,294 students in Irvine are college / undergraduate (36,737 | 36.6%), middle school (14,481 | 14.4%), and high school (14,073 | 14.0%).
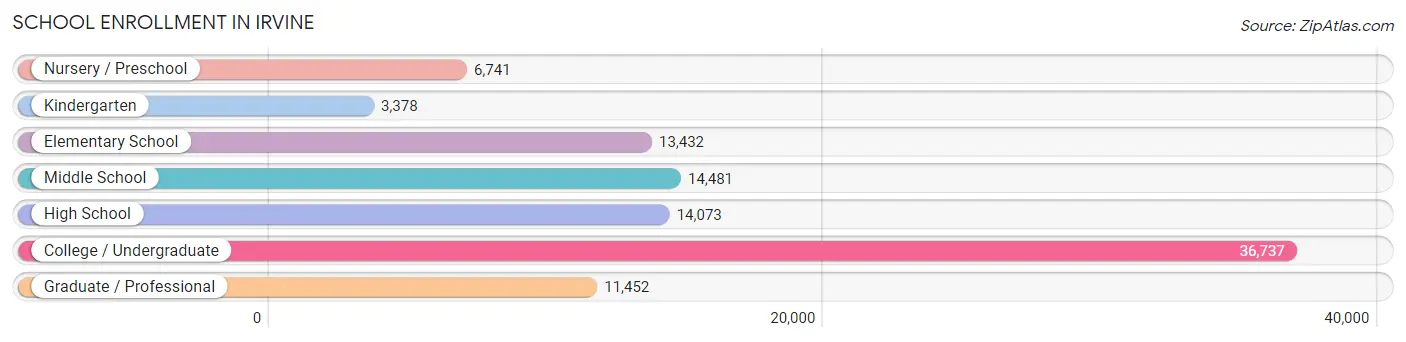
| School Level | # Students | % Students |
| Nursery / Preschool | 6,741 | 6.7% |
| Kindergarten | 3,378 | 3.4% |
| Elementary School | 13,432 | 13.4% |
| Middle School | 14,481 | 14.4% |
| High School | 14,073 | 14.0% |
| College / Undergraduate | 36,737 | 36.6% |
| Graduate / Professional | 11,452 | 11.4% |
| Total | 100,294 | 100.0% |
School Enrollment by Age by Funding Source in Irvine
Out of a total of 100,294 students who are enrolled in schools in Irvine, 17,150 (17.1%) attend a private institution, while the remaining 83,144 (82.9%) are enrolled in public schools. The age group of 3 to 4 year olds has the highest likelihood of being enrolled in private schools, with 4,308 (73.0% in the age bracket) enrolled. Conversely, the age group of 10 to 14 year olds has the lowest likelihood of being enrolled in a private school, with 16,240 (92.1% in the age bracket) attending a public institution.
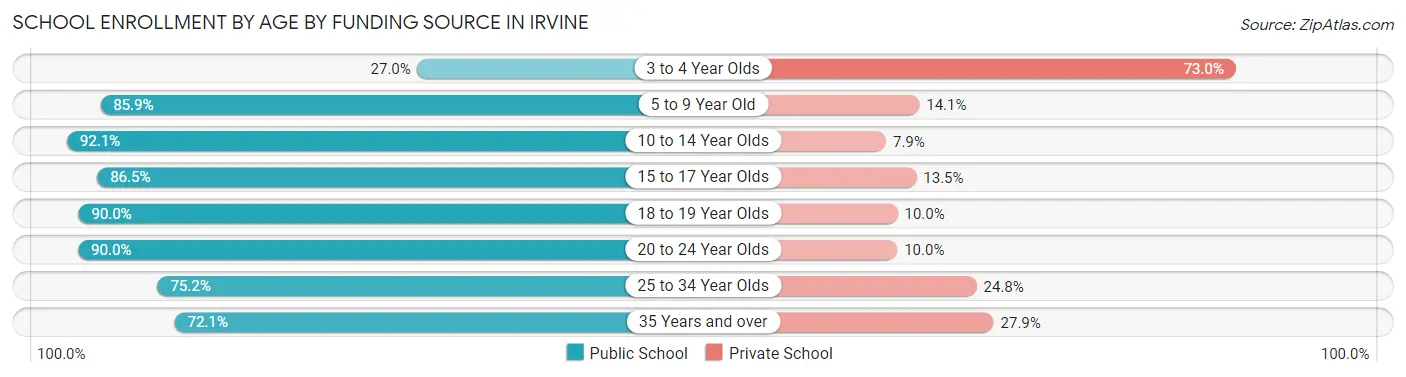
| Age Bracket | Public School | Private School |
| 3 to 4 Year Olds | 1,592 (27.0%) | 4,308 (73.0%) |
| 5 to 9 Year Old | 13,964 (85.9%) | 2,291 (14.1%) |
| 10 to 14 Year Olds | 16,240 (92.1%) | 1,391 (7.9%) |
| 15 to 17 Year Olds | 9,384 (86.5%) | 1,470 (13.5%) |
| 18 to 19 Year Olds | 11,150 (90.0%) | 1,245 (10.0%) |
| 20 to 24 Year Olds | 18,079 (90.0%) | 2,005 (10.0%) |
| 25 to 34 Year Olds | 8,171 (75.2%) | 2,689 (24.8%) |
| 35 Years and over | 4,551 (72.1%) | 1,764 (27.9%) |
| Total | 83,144 (82.9%) | 17,150 (17.1%) |
Educational Attainment by Field of Study in Irvine
Business (26,912 | 18.1%), engineering (23,037 | 15.5%), social sciences (14,785 | 10.0%), computers & mathematics (11,691 | 7.9%), and bio, nature & agricultural (11,682 | 7.9%) are the most common fields of study among 148,275 individuals in Irvine who have obtained a bachelor's degree or higher.
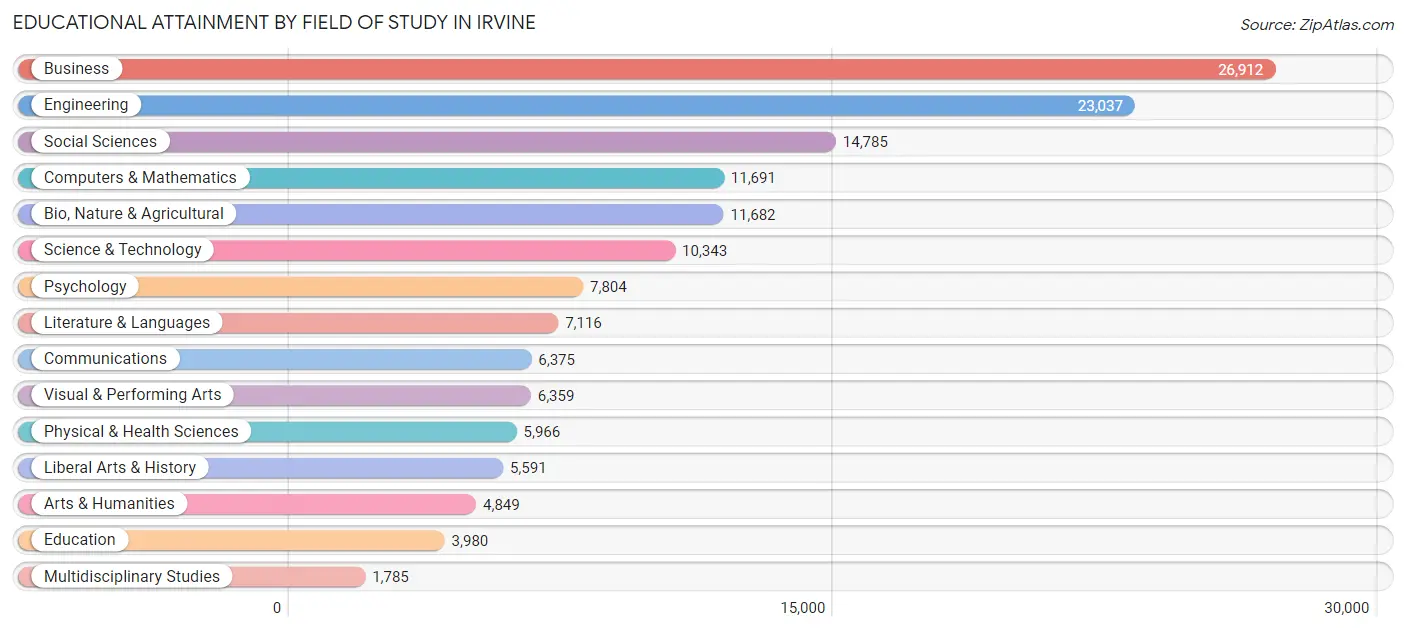
| Field of Study | # Graduates | % Graduates |
| Computers & Mathematics | 11,691 | 7.9% |
| Bio, Nature & Agricultural | 11,682 | 7.9% |
| Physical & Health Sciences | 5,966 | 4.0% |
| Psychology | 7,804 | 5.3% |
| Social Sciences | 14,785 | 10.0% |
| Engineering | 23,037 | 15.5% |
| Multidisciplinary Studies | 1,785 | 1.2% |
| Science & Technology | 10,343 | 7.0% |
| Business | 26,912 | 18.1% |
| Education | 3,980 | 2.7% |
| Literature & Languages | 7,116 | 4.8% |
| Liberal Arts & History | 5,591 | 3.8% |
| Visual & Performing Arts | 6,359 | 4.3% |
| Communications | 6,375 | 4.3% |
| Arts & Humanities | 4,849 | 3.3% |
| Total | 148,275 | 100.0% |
Transportation & Commute in Irvine
Vehicle Availability by Sex in Irvine
The most prevalent vehicle ownership categories in Irvine are males with 2 vehicles (39,457, accounting for 49.3%) and females with 2 vehicles (29,158, making up 60.2%).
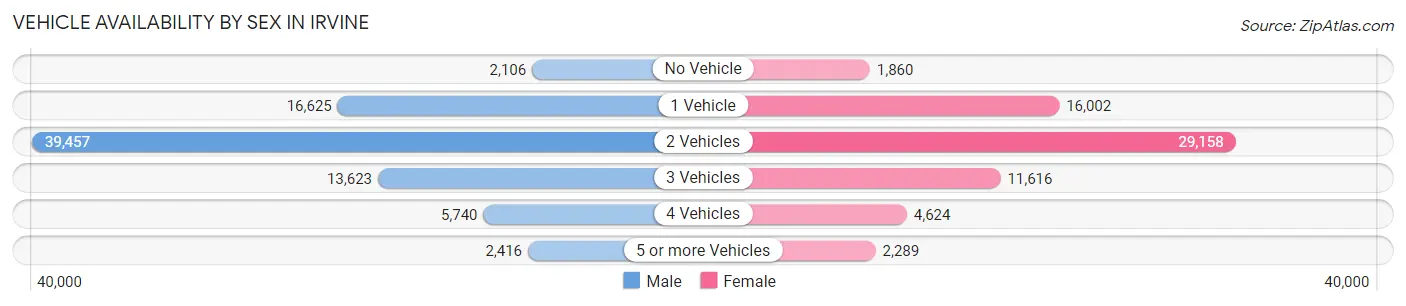
| Vehicles Available | Male | Female |
| No Vehicle | 2,106 (2.6%) | 1,860 (2.8%) |
| 1 Vehicle | 16,625 (20.8%) | 16,002 (24.4%) |
| 2 Vehicles | 39,457 (49.3%) | 29,158 (44.5%) |
| 3 Vehicles | 13,623 (17.0%) | 11,616 (17.7%) |
| 4 Vehicles | 5,740 (7.2%) | 4,624 (7.0%) |
| 5 or more Vehicles | 2,416 (3.0%) | 2,289 (3.5%) |
| Total | 79,967 (100.0%) | 65,549 (100.0%) |
Commute Time in Irvine
The most frequently occuring commute durations in Irvine are 15 to 19 minutes (23,005 commuters, 20.2%), 20 to 24 minutes (22,273 commuters, 19.6%), and 10 to 14 minutes (16,803 commuters, 14.7%).
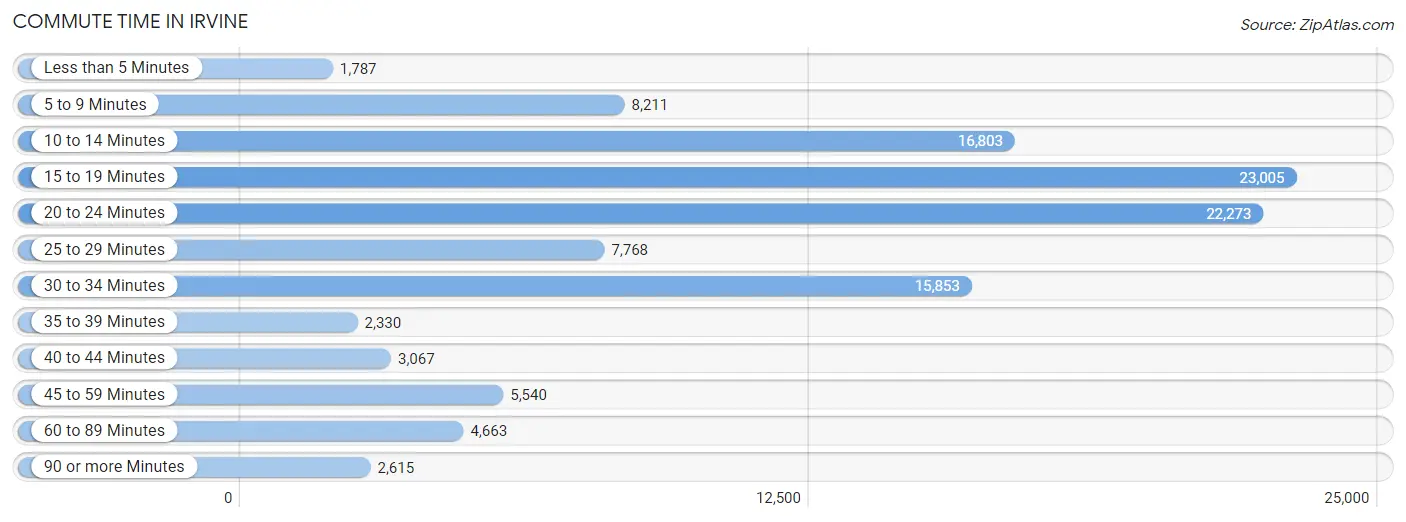
| Commute Time | # Commuters | % Commuters |
| Less than 5 Minutes | 1,787 | 1.6% |
| 5 to 9 Minutes | 8,211 | 7.2% |
| 10 to 14 Minutes | 16,803 | 14.7% |
| 15 to 19 Minutes | 23,005 | 20.2% |
| 20 to 24 Minutes | 22,273 | 19.6% |
| 25 to 29 Minutes | 7,768 | 6.8% |
| 30 to 34 Minutes | 15,853 | 13.9% |
| 35 to 39 Minutes | 2,330 | 2.1% |
| 40 to 44 Minutes | 3,067 | 2.7% |
| 45 to 59 Minutes | 5,540 | 4.9% |
| 60 to 89 Minutes | 4,663 | 4.1% |
| 90 or more Minutes | 2,615 | 2.3% |
Commute Time by Sex in Irvine
The most common commute times in Irvine are 15 to 19 minutes (12,425 commuters, 19.9%) for males and 15 to 19 minutes (10,580 commuters, 20.5%) for females.
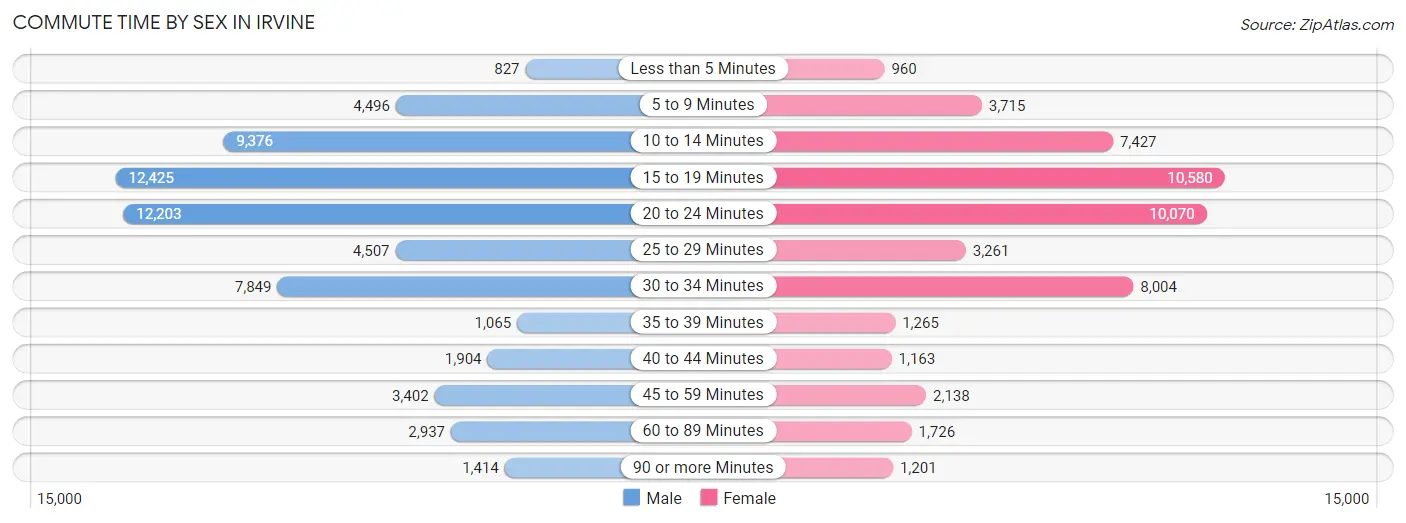
| Commute Time | Male | Female |
| Less than 5 Minutes | 827 (1.3%) | 960 (1.9%) |
| 5 to 9 Minutes | 4,496 (7.2%) | 3,715 (7.2%) |
| 10 to 14 Minutes | 9,376 (15.0%) | 7,427 (14.4%) |
| 15 to 19 Minutes | 12,425 (19.9%) | 10,580 (20.5%) |
| 20 to 24 Minutes | 12,203 (19.6%) | 10,070 (19.6%) |
| 25 to 29 Minutes | 4,507 (7.2%) | 3,261 (6.3%) |
| 30 to 34 Minutes | 7,849 (12.6%) | 8,004 (15.5%) |
| 35 to 39 Minutes | 1,065 (1.7%) | 1,265 (2.5%) |
| 40 to 44 Minutes | 1,904 (3.0%) | 1,163 (2.3%) |
| 45 to 59 Minutes | 3,402 (5.4%) | 2,138 (4.2%) |
| 60 to 89 Minutes | 2,937 (4.7%) | 1,726 (3.4%) |
| 90 or more Minutes | 1,414 (2.3%) | 1,201 (2.3%) |
Time of Departure to Work by Sex in Irvine
The most frequent times of departure to work in Irvine are 8:00 AM to 8:29 AM (11,548, 18.5%) for males and 8:00 AM to 8:29 AM (9,644, 18.7%) for females.
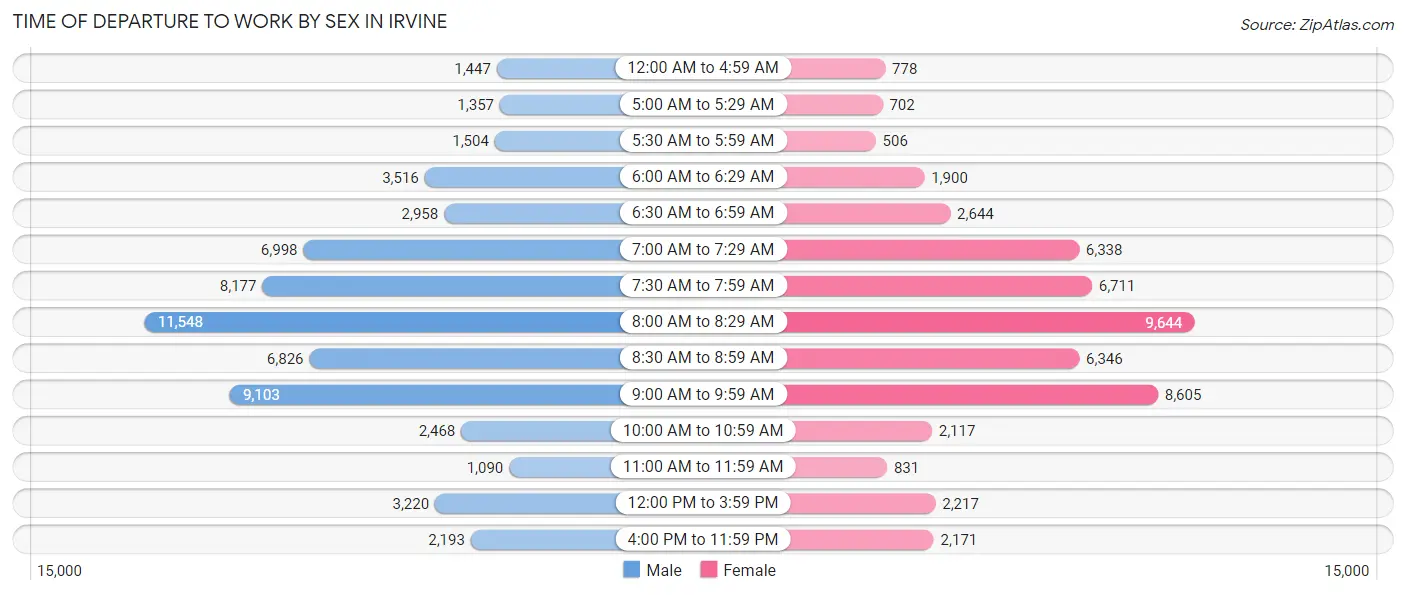
| Time of Departure | Male | Female |
| 12:00 AM to 4:59 AM | 1,447 (2.3%) | 778 (1.5%) |
| 5:00 AM to 5:29 AM | 1,357 (2.2%) | 702 (1.4%) |
| 5:30 AM to 5:59 AM | 1,504 (2.4%) | 506 (1.0%) |
| 6:00 AM to 6:29 AM | 3,516 (5.6%) | 1,900 (3.7%) |
| 6:30 AM to 6:59 AM | 2,958 (4.7%) | 2,644 (5.1%) |
| 7:00 AM to 7:29 AM | 6,998 (11.2%) | 6,338 (12.3%) |
| 7:30 AM to 7:59 AM | 8,177 (13.1%) | 6,711 (13.0%) |
| 8:00 AM to 8:29 AM | 11,548 (18.5%) | 9,644 (18.7%) |
| 8:30 AM to 8:59 AM | 6,826 (10.9%) | 6,346 (12.3%) |
| 9:00 AM to 9:59 AM | 9,103 (14.6%) | 8,605 (16.7%) |
| 10:00 AM to 10:59 AM | 2,468 (4.0%) | 2,117 (4.1%) |
| 11:00 AM to 11:59 AM | 1,090 (1.8%) | 831 (1.6%) |
| 12:00 PM to 3:59 PM | 3,220 (5.2%) | 2,217 (4.3%) |
| 4:00 PM to 11:59 PM | 2,193 (3.5%) | 2,171 (4.2%) |
| Total | 62,405 (100.0%) | 51,510 (100.0%) |
Housing Occupancy in Irvine
Occupancy by Ownership in Irvine
Of the total 110,465 dwellings in Irvine, owner-occupied units account for 48,451 (43.9%), while renter-occupied units make up 62,014 (56.1%).
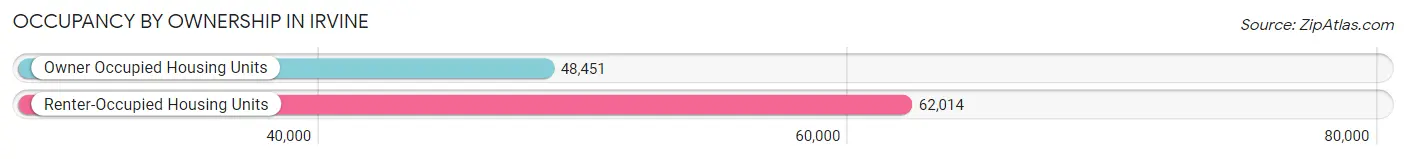
| Occupancy | # Housing Units | % Housing Units |
| Owner Occupied Housing Units | 48,451 | 43.9% |
| Renter-Occupied Housing Units | 62,014 | 56.1% |
| Total Occupied Housing Units | 110,465 | 100.0% |
Occupancy by Household Size in Irvine
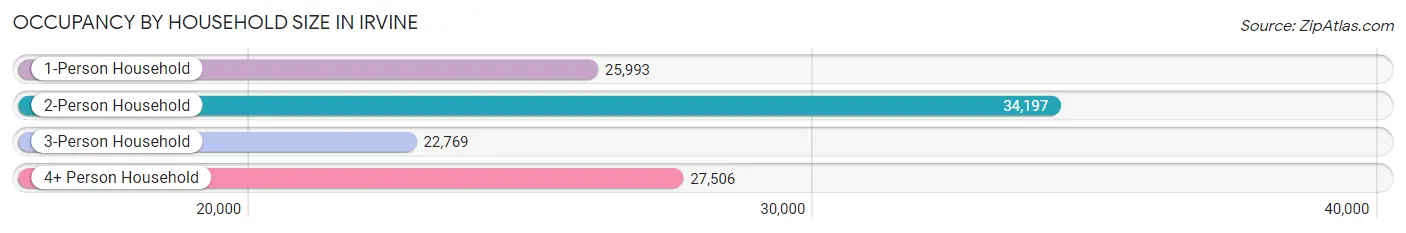
| Household Size | # Housing Units | % Housing Units |
| 1-Person Household | 25,993 | 23.5% |
| 2-Person Household | 34,197 | 31.0% |
| 3-Person Household | 22,769 | 20.6% |
| 4+ Person Household | 27,506 | 24.9% |
| Total Housing Units | 110,465 | 100.0% |
Occupancy by Ownership by Household Size in Irvine
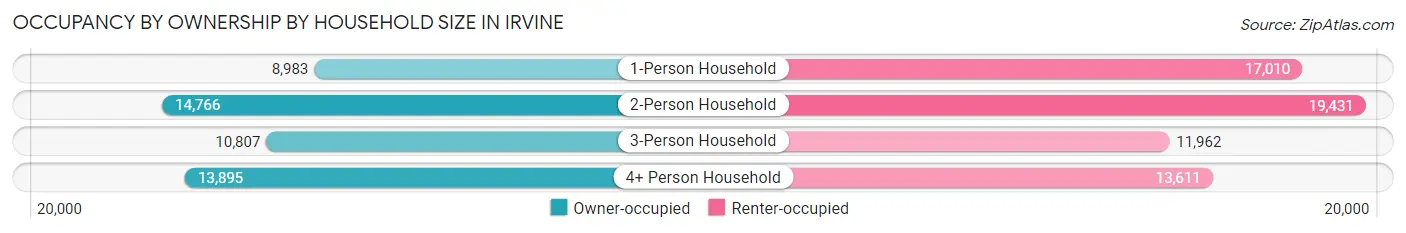
| Household Size | Owner-occupied | Renter-occupied |
| 1-Person Household | 8,983 (34.6%) | 17,010 (65.4%) |
| 2-Person Household | 14,766 (43.2%) | 19,431 (56.8%) |
| 3-Person Household | 10,807 (47.5%) | 11,962 (52.5%) |
| 4+ Person Household | 13,895 (50.5%) | 13,611 (49.5%) |
| Total Housing Units | 48,451 (43.9%) | 62,014 (56.1%) |
Occupancy by Educational Attainment in Irvine
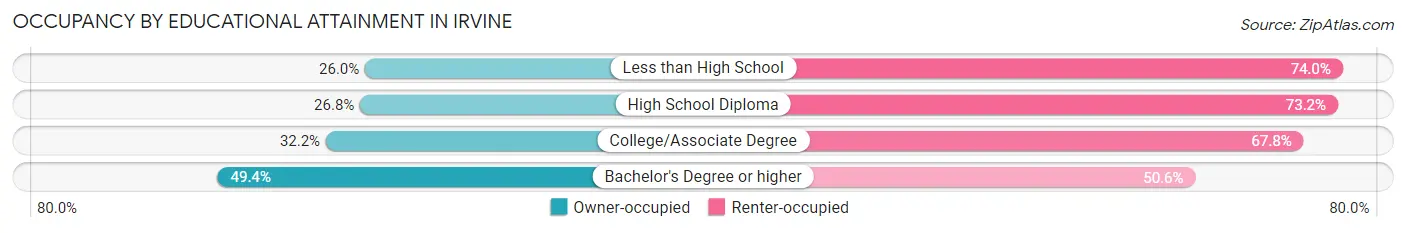
| Household Size | Owner-occupied | Renter-occupied |
| Less than High School | 727 (26.0%) | 2,070 (74.0%) |
| High School Diploma | 1,797 (26.8%) | 4,913 (73.2%) |
| College/Associate Degree | 7,358 (32.2%) | 15,495 (67.8%) |
| Bachelor's Degree or higher | 38,569 (49.4%) | 39,536 (50.6%) |
Occupancy by Age of Householder in Irvine
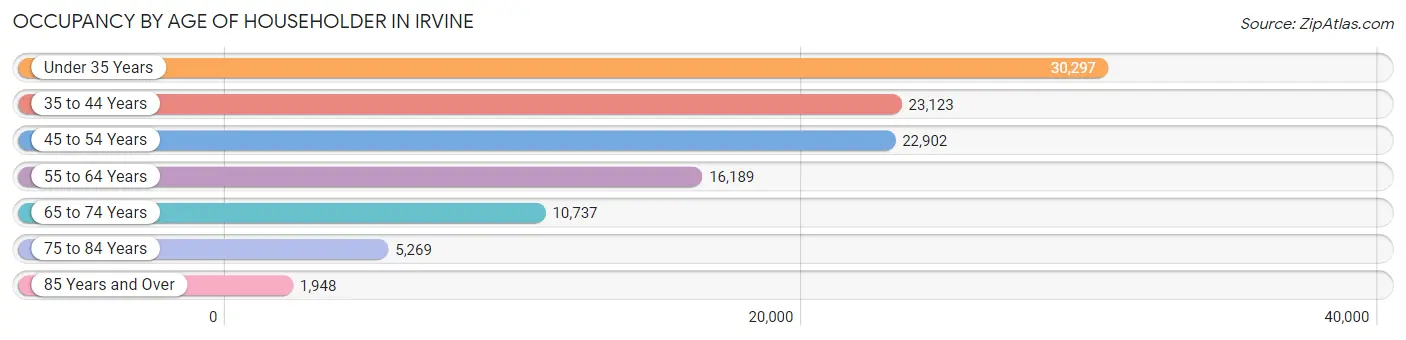
| Age Bracket | # Households | % Households |
| Under 35 Years | 30,297 | 27.4% |
| 35 to 44 Years | 23,123 | 20.9% |
| 45 to 54 Years | 22,902 | 20.7% |
| 55 to 64 Years | 16,189 | 14.7% |
| 65 to 74 Years | 10,737 | 9.7% |
| 75 to 84 Years | 5,269 | 4.8% |
| 85 Years and Over | 1,948 | 1.8% |
| Total | 110,465 | 100.0% |
Housing Finances in Irvine
Median Income by Occupancy in Irvine
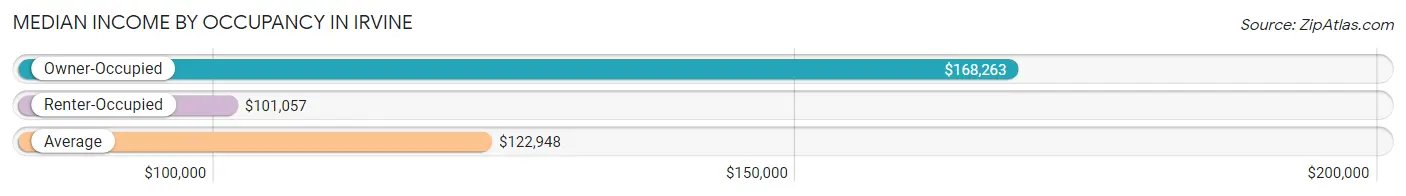
| Occupancy Type | # Households | Median Income |
| Owner-Occupied | 48,451 (43.9%) | $168,263 |
| Renter-Occupied | 62,014 (56.1%) | $101,057 |
| Average | 110,465 (100.0%) | $122,948 |
Occupancy by Householder Income Bracket in Irvine
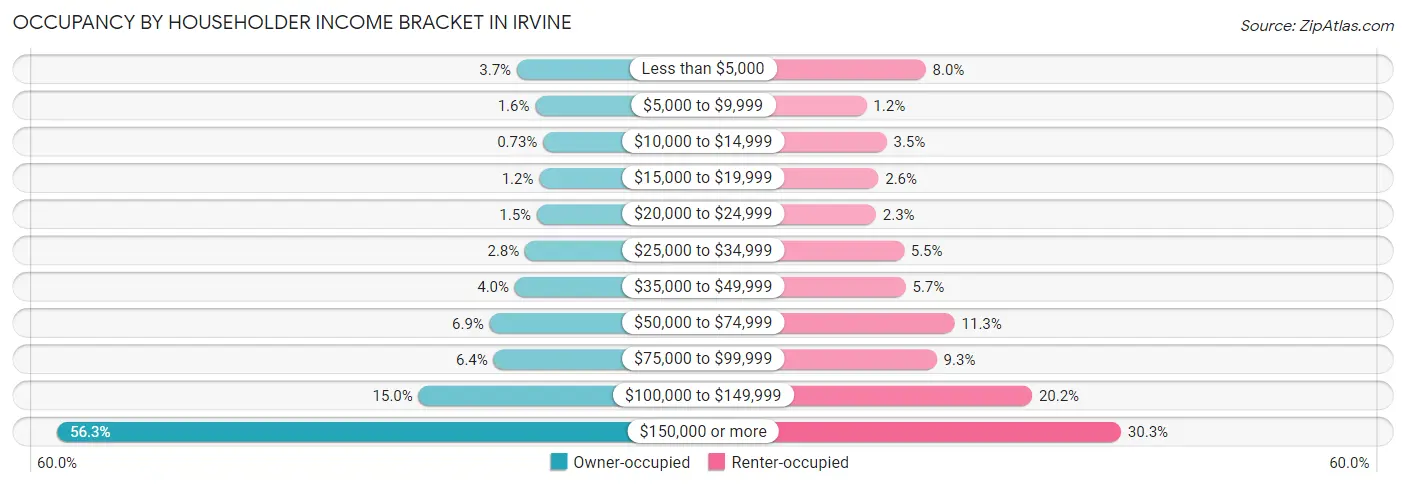
| Income Bracket | Owner-occupied | Renter-occupied |
| Less than $5,000 | 1,808 (3.7%) | 4,969 (8.0%) |
| $5,000 to $9,999 | 790 (1.6%) | 768 (1.2%) |
| $10,000 to $14,999 | 356 (0.7%) | 2,195 (3.5%) |
| $15,000 to $19,999 | 570 (1.2%) | 1,614 (2.6%) |
| $20,000 to $24,999 | 704 (1.5%) | 1,439 (2.3%) |
| $25,000 to $34,999 | 1,356 (2.8%) | 3,415 (5.5%) |
| $35,000 to $49,999 | 1,924 (4.0%) | 3,540 (5.7%) |
| $50,000 to $74,999 | 3,319 (6.9%) | 7,018 (11.3%) |
| $75,000 to $99,999 | 3,103 (6.4%) | 5,747 (9.3%) |
| $100,000 to $149,999 | 7,251 (15.0%) | 12,500 (20.2%) |
| $150,000 or more | 27,270 (56.3%) | 18,809 (30.3%) |
| Total | 48,451 (100.0%) | 62,014 (100.0%) |
Monthly Housing Cost Tiers in Irvine
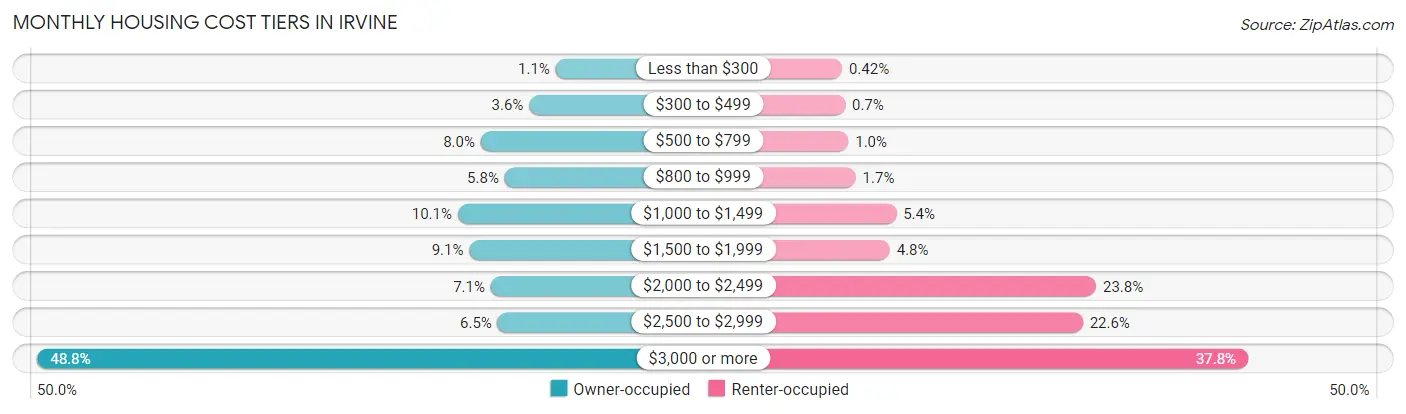
| Monthly Cost | Owner-occupied | Renter-occupied |
| Less than $300 | 540 (1.1%) | 259 (0.4%) |
| $300 to $499 | 1,720 (3.5%) | 434 (0.7%) |
| $500 to $799 | 3,874 (8.0%) | 622 (1.0%) |
| $800 to $999 | 2,812 (5.8%) | 1,044 (1.7%) |
| $1,000 to $1,499 | 4,904 (10.1%) | 3,352 (5.4%) |
| $1,500 to $1,999 | 4,389 (9.1%) | 2,992 (4.8%) |
| $2,000 to $2,499 | 3,432 (7.1%) | 14,768 (23.8%) |
| $2,500 to $2,999 | 3,123 (6.5%) | 14,005 (22.6%) |
| $3,000 or more | 23,657 (48.8%) | 23,435 (37.8%) |
| Total | 48,451 (100.0%) | 62,014 (100.0%) |
Physical Housing Characteristics in Irvine
Housing Structures in Irvine
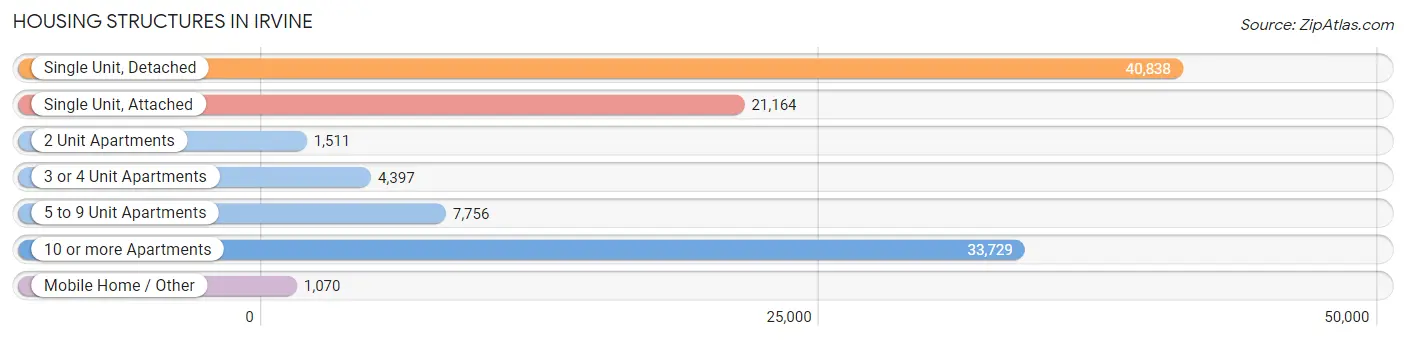
| Structure Type | # Housing Units | % Housing Units |
| Single Unit, Detached | 40,838 | 37.0% |
| Single Unit, Attached | 21,164 | 19.2% |
| 2 Unit Apartments | 1,511 | 1.4% |
| 3 or 4 Unit Apartments | 4,397 | 4.0% |
| 5 to 9 Unit Apartments | 7,756 | 7.0% |
| 10 or more Apartments | 33,729 | 30.5% |
| Mobile Home / Other | 1,070 | 1.0% |
| Total | 110,465 | 100.0% |
Housing Structures by Occupancy in Irvine
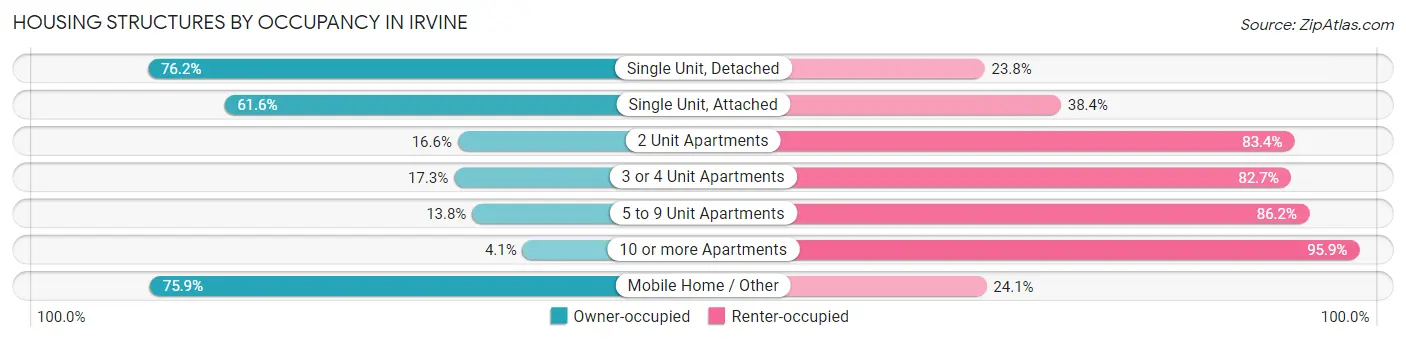
| Structure Type | Owner-occupied | Renter-occupied |
| Single Unit, Detached | 31,134 (76.2%) | 9,704 (23.8%) |
| Single Unit, Attached | 13,029 (61.6%) | 8,135 (38.4%) |
| 2 Unit Apartments | 251 (16.6%) | 1,260 (83.4%) |
| 3 or 4 Unit Apartments | 762 (17.3%) | 3,635 (82.7%) |
| 5 to 9 Unit Apartments | 1,072 (13.8%) | 6,684 (86.2%) |
| 10 or more Apartments | 1,391 (4.1%) | 32,338 (95.9%) |
| Mobile Home / Other | 812 (75.9%) | 258 (24.1%) |
| Total | 48,451 (43.9%) | 62,014 (56.1%) |
Housing Structures by Number of Rooms in Irvine
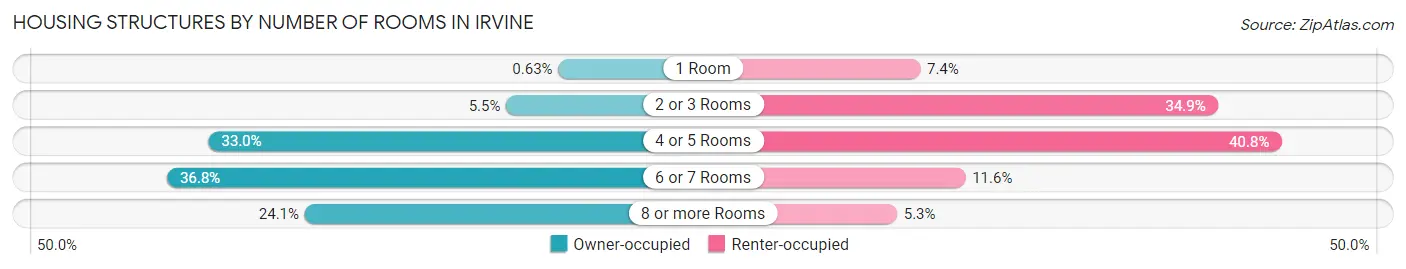
| Number of Rooms | Owner-occupied | Renter-occupied |
| 1 Room | 307 (0.6%) | 4,595 (7.4%) |
| 2 or 3 Rooms | 2,643 (5.4%) | 21,653 (34.9%) |
| 4 or 5 Rooms | 15,989 (33.0%) | 25,311 (40.8%) |
| 6 or 7 Rooms | 17,844 (36.8%) | 7,190 (11.6%) |
| 8 or more Rooms | 11,668 (24.1%) | 3,265 (5.3%) |
| Total | 48,451 (100.0%) | 62,014 (100.0%) |
Housing Structure by Heating Type in Irvine
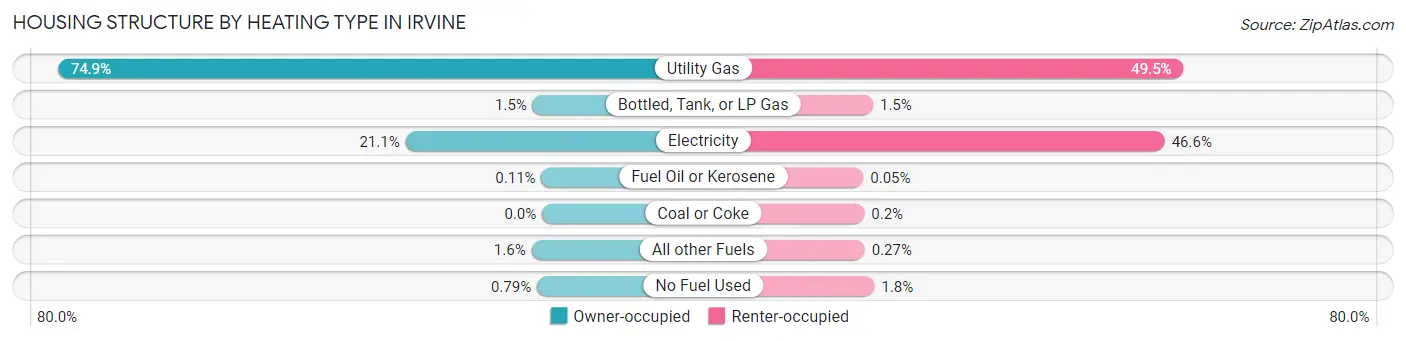
| Heating Type | Owner-occupied | Renter-occupied |
| Utility Gas | 36,276 (74.9%) | 30,708 (49.5%) |
| Bottled, Tank, or LP Gas | 706 (1.5%) | 952 (1.5%) |
| Electricity | 10,233 (21.1%) | 28,926 (46.6%) |
| Fuel Oil or Kerosene | 55 (0.1%) | 28 (0.1%) |
| Coal or Coke | 0 (0.0%) | 127 (0.2%) |
| All other Fuels | 797 (1.6%) | 168 (0.3%) |
| No Fuel Used | 384 (0.8%) | 1,105 (1.8%) |
| Total | 48,451 (100.0%) | 62,014 (100.0%) |
Household Vehicle Usage in Irvine
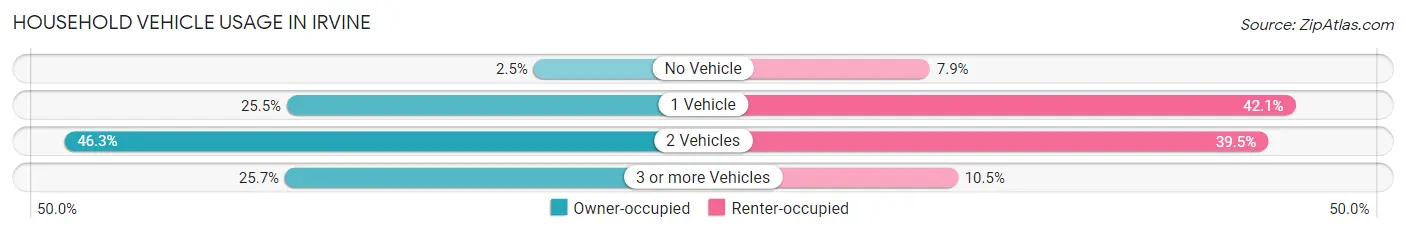
| Vehicles per Household | Owner-occupied | Renter-occupied |
| No Vehicle | 1,202 (2.5%) | 4,915 (7.9%) |
| 1 Vehicle | 12,362 (25.5%) | 26,078 (42.0%) |
| 2 Vehicles | 22,435 (46.3%) | 24,490 (39.5%) |
| 3 or more Vehicles | 12,452 (25.7%) | 6,531 (10.5%) |
| Total | 48,451 (100.0%) | 62,014 (100.0%) |
Real Estate & Mortgages in Irvine
Real Estate and Mortgage Overview in Irvine
| Characteristic | Without Mortgage | With Mortgage |
| Housing Units | 16,557 | 31,894 |
| Median Property Value | $994,400 | $1,043,800 |
| Median Household Income | $114,662 | $20,648 |
| Monthly Housing Costs | $1,005 | $22,812 |
| Real Estate Taxes | $7,131 | $176 |
Property Value by Mortgage Status in Irvine
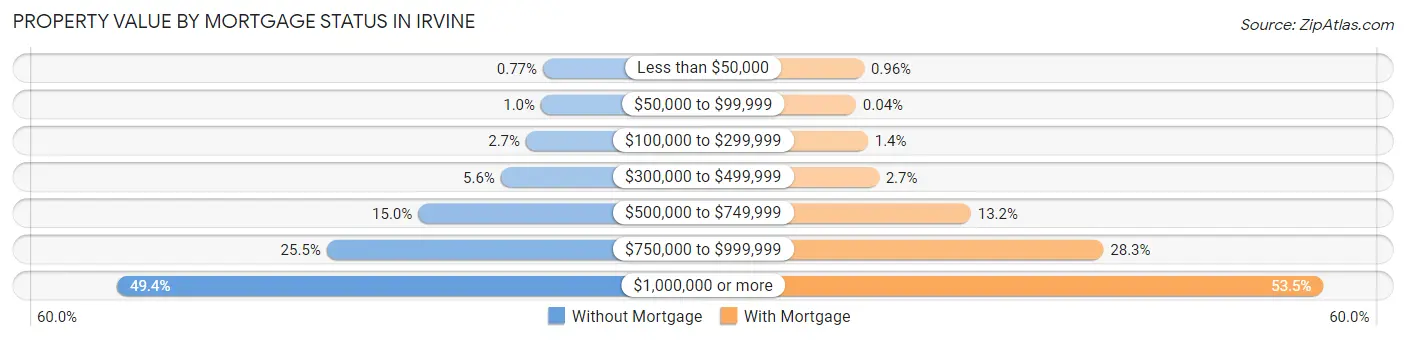
| Property Value | Without Mortgage | With Mortgage |
| Less than $50,000 | 127 (0.8%) | 306 (1.0%) |
| $50,000 to $99,999 | 166 (1.0%) | 14 (0.0%) |
| $100,000 to $299,999 | 449 (2.7%) | 445 (1.4%) |
| $300,000 to $499,999 | 925 (5.6%) | 844 (2.6%) |
| $500,000 to $749,999 | 2,488 (15.0%) | 4,202 (13.2%) |
| $750,000 to $999,999 | 4,218 (25.5%) | 9,031 (28.3%) |
| $1,000,000 or more | 8,184 (49.4%) | 17,052 (53.5%) |
| Total | 16,557 (100.0%) | 31,894 (100.0%) |
Household Income by Mortgage Status in Irvine
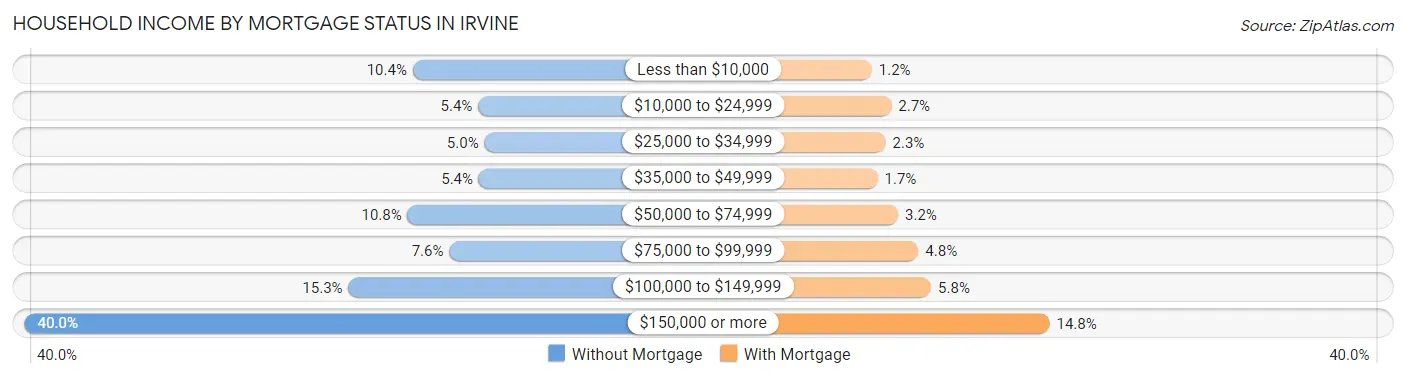
| Household Income | Without Mortgage | With Mortgage |
| Less than $10,000 | 1,727 (10.4%) | 397 (1.2%) |
| $10,000 to $24,999 | 901 (5.4%) | 871 (2.7%) |
| $25,000 to $34,999 | 821 (5.0%) | 729 (2.3%) |
| $35,000 to $49,999 | 892 (5.4%) | 535 (1.7%) |
| $50,000 to $74,999 | 1,791 (10.8%) | 1,032 (3.2%) |
| $75,000 to $99,999 | 1,265 (7.6%) | 1,528 (4.8%) |
| $100,000 to $149,999 | 2,538 (15.3%) | 1,838 (5.8%) |
| $150,000 or more | 6,622 (40.0%) | 4,713 (14.8%) |
| Total | 16,557 (100.0%) | 31,894 (100.0%) |
Property Value to Household Income Ratio in Irvine
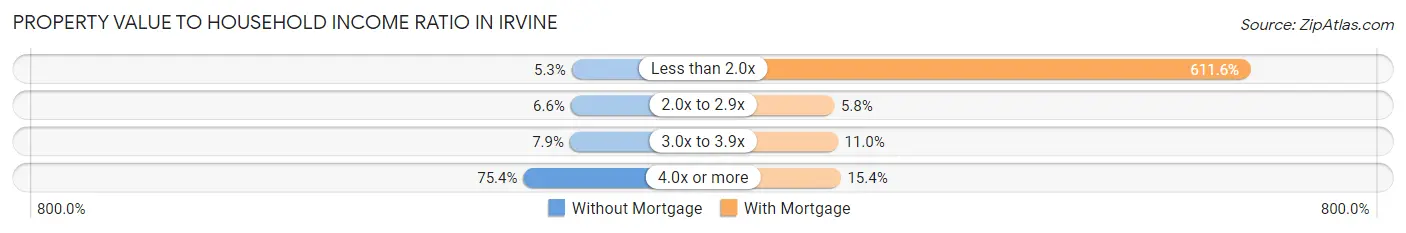
| Value-to-Income Ratio | Without Mortgage | With Mortgage |
| Less than 2.0x | 869 (5.2%) | 195,078 (611.6%) |
| 2.0x to 2.9x | 1,090 (6.6%) | 1,861 (5.8%) |
| 3.0x to 3.9x | 1,299 (7.9%) | 3,518 (11.0%) |
| 4.0x or more | 12,491 (75.4%) | 4,896 (15.3%) |
| Total | 16,557 (100.0%) | 31,894 (100.0%) |
Real Estate Taxes by Mortgage Status in Irvine
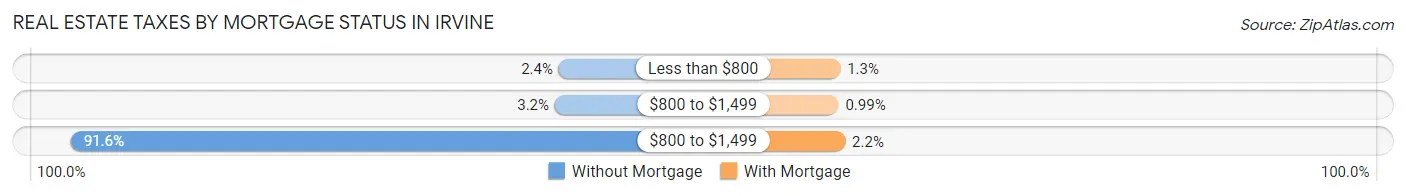
| Property Taxes | Without Mortgage | With Mortgage |
| Less than $800 | 402 (2.4%) | 418 (1.3%) |
| $800 to $1,499 | 521 (3.2%) | 316 (1.0%) |
| $800 to $1,499 | 15,158 (91.5%) | 706 (2.2%) |
| Total | 16,557 (100.0%) | 31,894 (100.0%) |
Health & Disability in Irvine
Health Insurance Coverage by Age in Irvine
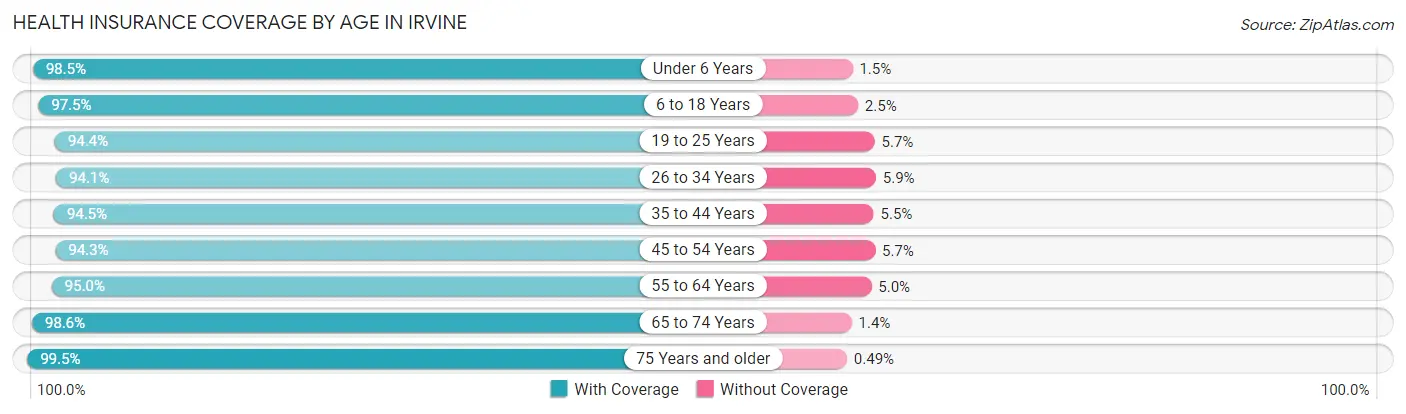
| Age Bracket | With Coverage | Without Coverage |
| Under 6 Years | 22,972 (98.5%) | 355 (1.5%) |
| 6 to 18 Years | 47,461 (97.5%) | 1,238 (2.5%) |
| 19 to 25 Years | 37,762 (94.4%) | 2,263 (5.7%) |
| 26 to 34 Years | 43,598 (94.1%) | 2,726 (5.9%) |
| 35 to 44 Years | 41,254 (94.5%) | 2,383 (5.5%) |
| 45 to 54 Years | 38,566 (94.3%) | 2,344 (5.7%) |
| 55 to 64 Years | 27,913 (95.0%) | 1,480 (5.0%) |
| 65 to 74 Years | 18,669 (98.6%) | 258 (1.4%) |
| 75 Years and older | 12,696 (99.5%) | 63 (0.5%) |
| Total | 290,891 (95.7%) | 13,110 (4.3%) |
Health Insurance Coverage by Citizenship Status in Irvine
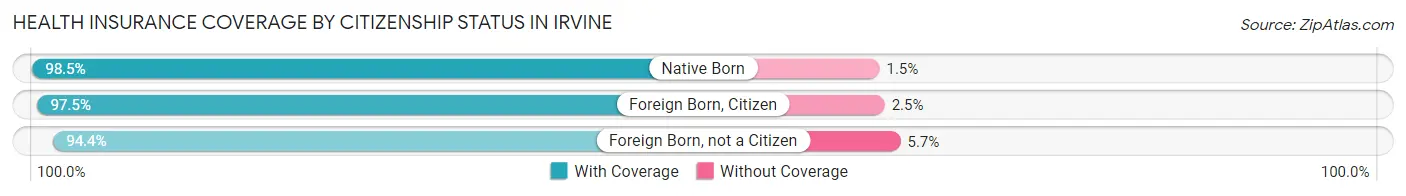
| Citizenship Status | With Coverage | Without Coverage |
| Native Born | 22,972 (98.5%) | 355 (1.5%) |
| Foreign Born, Citizen | 47,461 (97.5%) | 1,238 (2.5%) |
| Foreign Born, not a Citizen | 37,762 (94.4%) | 2,263 (5.7%) |
Health Insurance Coverage by Household Income in Irvine
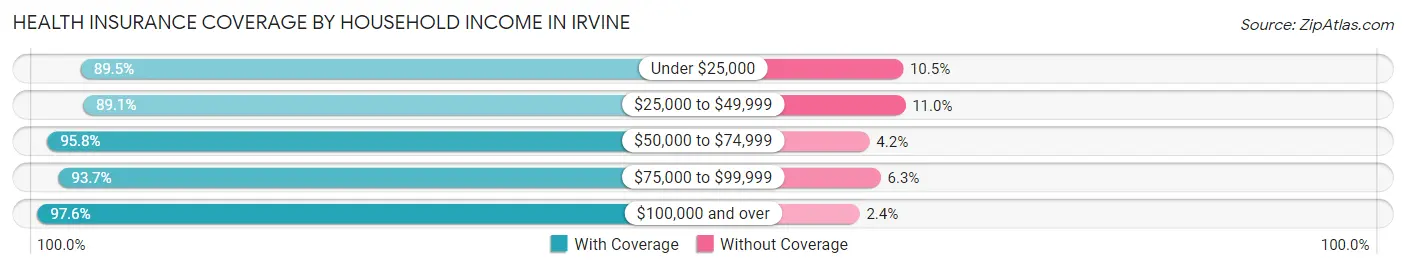
| Household Income | With Coverage | Without Coverage |
| Under $25,000 | 27,803 (89.5%) | 3,272 (10.5%) |
| $25,000 to $49,999 | 20,921 (89.0%) | 2,573 (11.0%) |
| $50,000 to $74,999 | 21,998 (95.8%) | 973 (4.2%) |
| $75,000 to $99,999 | 19,803 (93.7%) | 1,338 (6.3%) |
| $100,000 and over | 190,773 (97.6%) | 4,658 (2.4%) |
Public vs Private Health Insurance Coverage by Age in Irvine
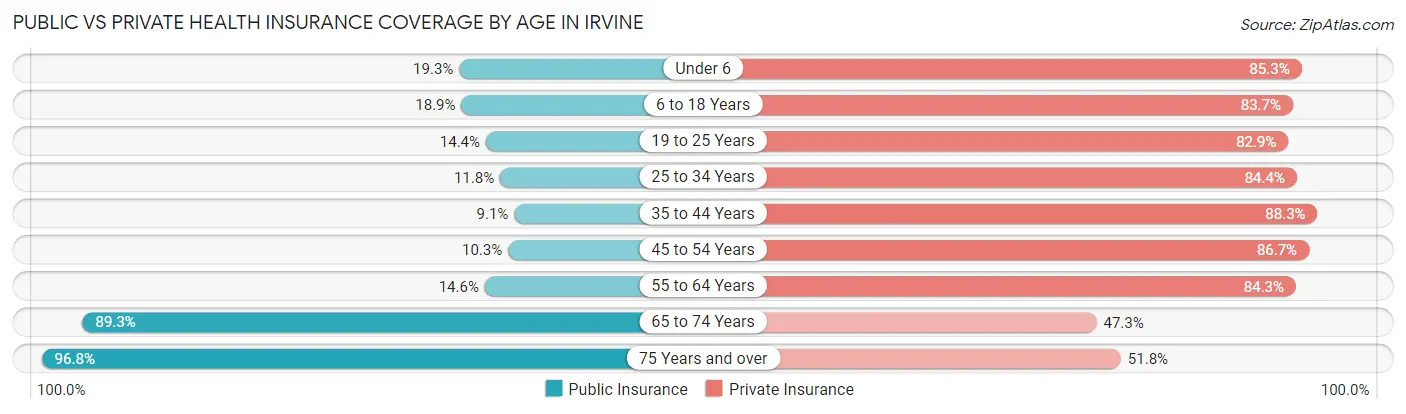
| Age Bracket | Public Insurance | Private Insurance |
| Under 6 | 4,512 (19.3%) | 19,903 (85.3%) |
| 6 to 18 Years | 9,219 (18.9%) | 40,765 (83.7%) |
| 19 to 25 Years | 5,755 (14.4%) | 33,162 (82.9%) |
| 25 to 34 Years | 5,450 (11.8%) | 39,118 (84.4%) |
| 35 to 44 Years | 3,984 (9.1%) | 38,518 (88.3%) |
| 45 to 54 Years | 4,196 (10.3%) | 35,470 (86.7%) |
| 55 to 64 Years | 4,288 (14.6%) | 24,772 (84.3%) |
| 65 to 74 Years | 16,895 (89.3%) | 8,949 (47.3%) |
| 75 Years and over | 12,354 (96.8%) | 6,611 (51.8%) |
| Total | 66,653 (21.9%) | 247,268 (81.3%) |
Disability Status by Sex by Age in Irvine
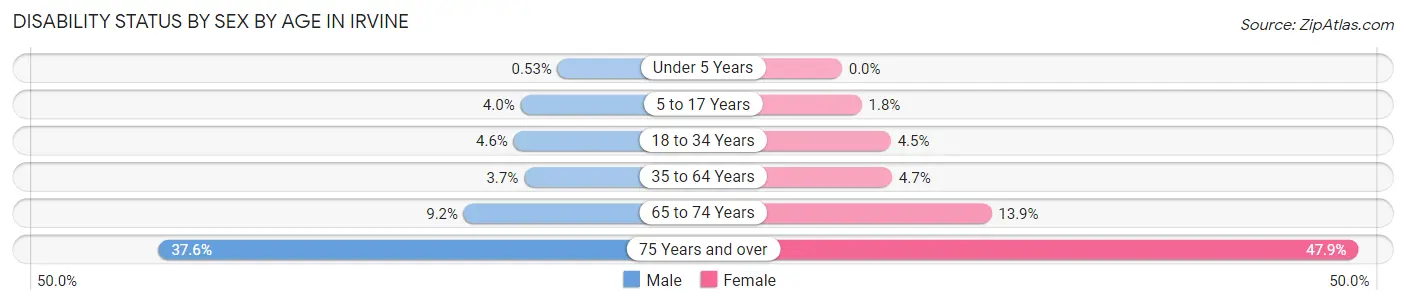
| Age Bracket | Male | Female |
| Under 5 Years | 60 (0.5%) | 0 (0.0%) |
| 5 to 17 Years | 909 (4.0%) | 426 (1.8%) |
| 18 to 34 Years | 2,115 (4.6%) | 2,094 (4.5%) |
| 35 to 64 Years | 2,031 (3.6%) | 2,708 (4.6%) |
| 65 to 74 Years | 802 (9.2%) | 1,421 (13.9%) |
| 75 Years and over | 2,189 (37.6%) | 3,323 (47.9%) |
Disability Class by Sex by Age in Irvine
Disability Class: Hearing Difficulty
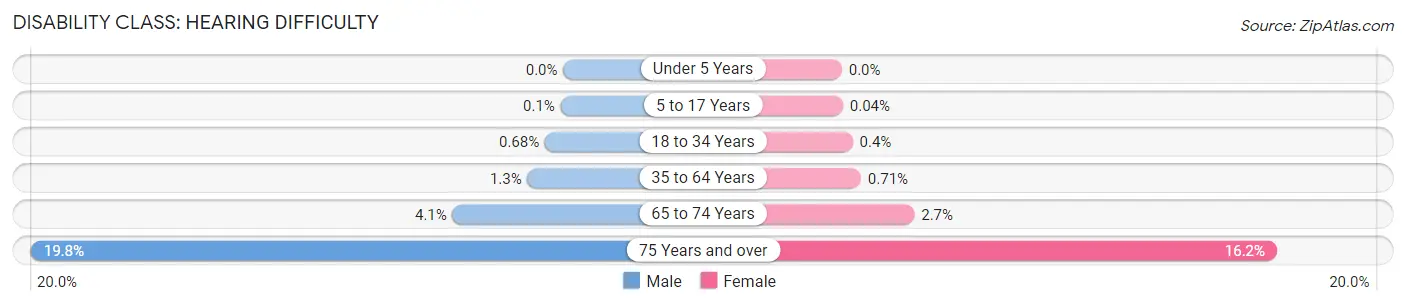
| Age Bracket | Male | Female |
| Under 5 Years | 0 (0.0%) | 0 (0.0%) |
| 5 to 17 Years | 22 (0.1%) | 10 (0.0%) |
| 18 to 34 Years | 311 (0.7%) | 183 (0.4%) |
| 35 to 64 Years | 741 (1.3%) | 416 (0.7%) |
| 65 to 74 Years | 357 (4.1%) | 275 (2.7%) |
| 75 Years and over | 1,152 (19.8%) | 1,120 (16.2%) |
Disability Class: Vision Difficulty
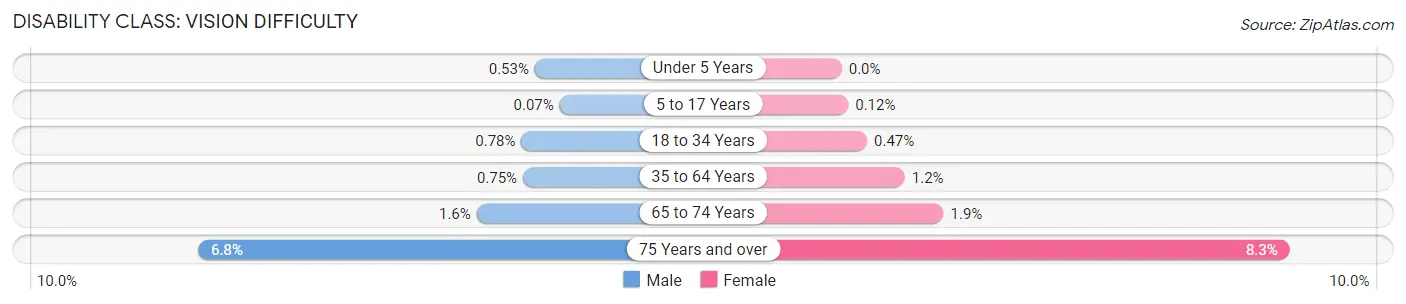
| Age Bracket | Male | Female |
| Under 5 Years | 60 (0.5%) | 0 (0.0%) |
| 5 to 17 Years | 15 (0.1%) | 27 (0.1%) |
| 18 to 34 Years | 357 (0.8%) | 219 (0.5%) |
| 35 to 64 Years | 419 (0.7%) | 679 (1.2%) |
| 65 to 74 Years | 140 (1.6%) | 194 (1.9%) |
| 75 Years and over | 395 (6.8%) | 576 (8.3%) |
Disability Class: Cognitive Difficulty
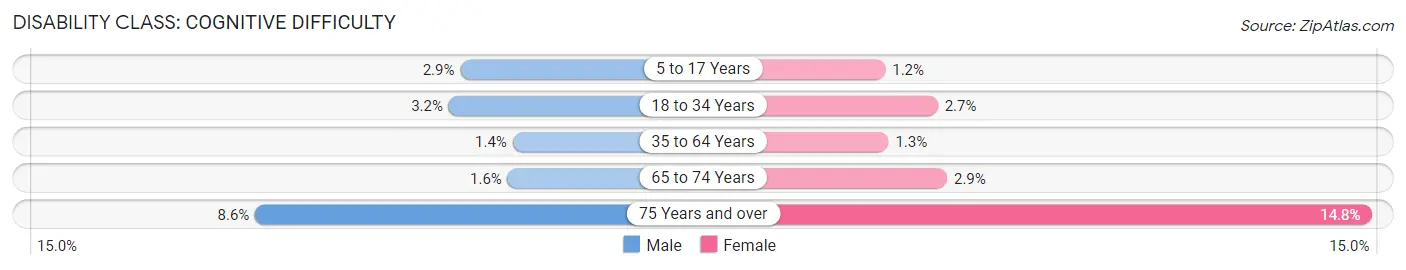
| Age Bracket | Male | Female |
| 5 to 17 Years | 655 (2.9%) | 280 (1.2%) |
| 18 to 34 Years | 1,463 (3.2%) | 1,231 (2.7%) |
| 35 to 64 Years | 785 (1.4%) | 757 (1.3%) |
| 65 to 74 Years | 135 (1.5%) | 300 (2.9%) |
| 75 Years and over | 500 (8.6%) | 1,024 (14.8%) |
Disability Class: Ambulatory Difficulty
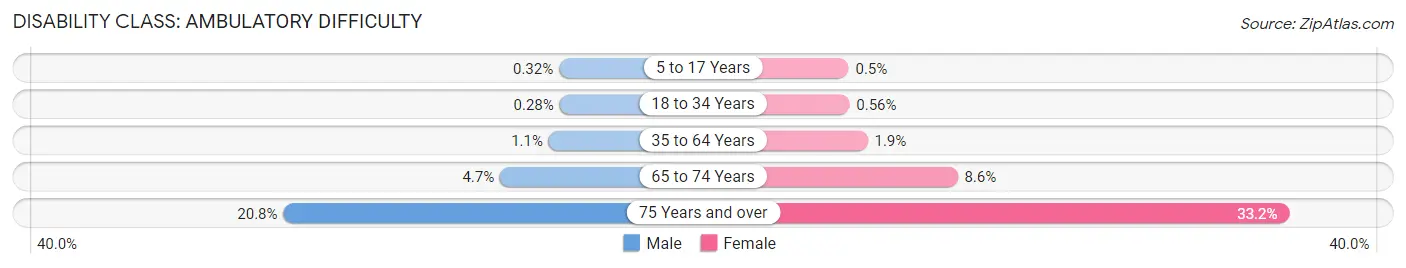
| Age Bracket | Male | Female |
| 5 to 17 Years | 74 (0.3%) | 115 (0.5%) |
| 18 to 34 Years | 129 (0.3%) | 260 (0.6%) |
| 35 to 64 Years | 603 (1.1%) | 1,110 (1.9%) |
| 65 to 74 Years | 408 (4.7%) | 879 (8.6%) |
| 75 Years and over | 1,211 (20.8%) | 2,303 (33.2%) |
Disability Class: Self-Care Difficulty
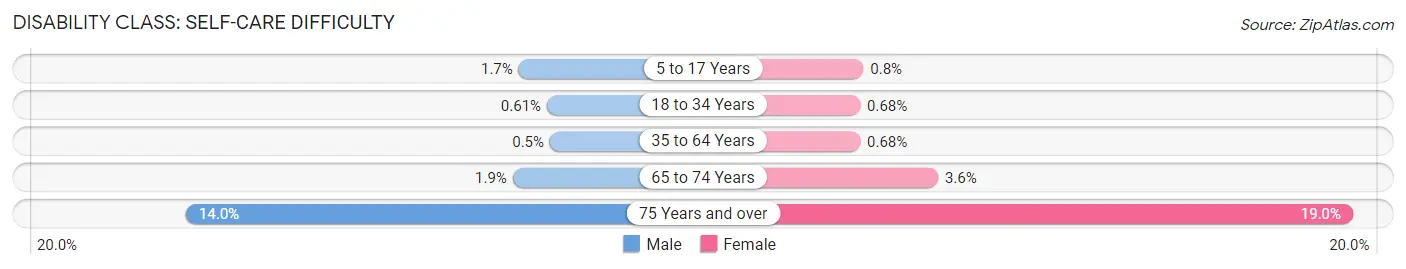
| Age Bracket | Male | Female |
| 5 to 17 Years | 379 (1.7%) | 185 (0.8%) |
| 18 to 34 Years | 280 (0.6%) | 312 (0.7%) |
| 35 to 64 Years | 277 (0.5%) | 396 (0.7%) |
| 65 to 74 Years | 163 (1.9%) | 366 (3.6%) |
| 75 Years and over | 816 (14.0%) | 1,315 (19.0%) |
Technology Access in Irvine
Computing Device Access in Irvine
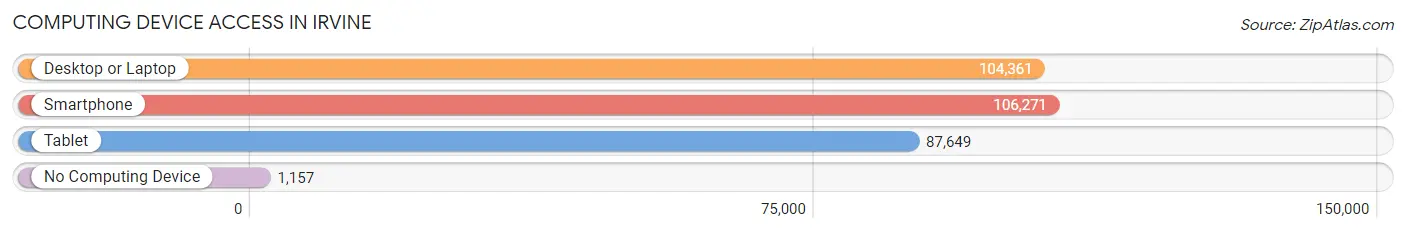
| Device Type | # Households | % Households |
| Desktop or Laptop | 104,361 | 94.5% |
| Smartphone | 106,271 | 96.2% |
| Tablet | 87,649 | 79.3% |
| No Computing Device | 1,157 | 1.1% |
| Total | 110,465 | 100.0% |
Internet Access in Irvine
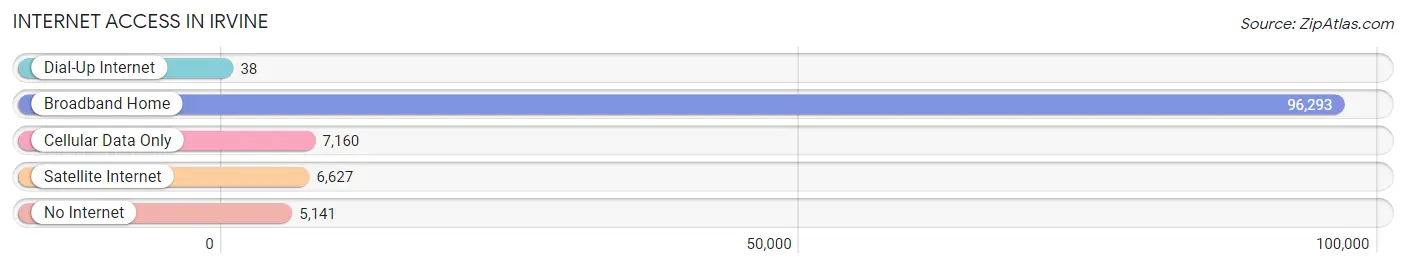
| Internet Type | # Households | % Households |
| Dial-Up Internet | 38 | 0.0% |
| Broadband Home | 96,293 | 87.2% |
| Cellular Data Only | 7,160 | 6.5% |
| Satellite Internet | 6,627 | 6.0% |
| No Internet | 5,141 | 4.6% |
| Total | 110,465 | 100.0% |
Irvine Summary
Irvine, California is a city located in Orange County, California. It is the most populous city in the county and the fifth most populous city in the state. The city is bordered by the cities of Santa Ana, Tustin, Lake Forest, and Laguna Beach. Irvine is home to the University of California, Irvine, and the Irvine Spectrum Center, a large shopping center.
History
The area that is now Irvine was originally inhabited by the Tongva people. In 1769, the Spanish explorer Gaspar de Portola and his expedition passed through the area, and the land was later granted to the family of Jose Antonio Yorba. In 1864, James Irvine purchased the land and established the Irvine Ranch. The ranch was used for cattle grazing and farming, and the area was known as the Irvine Ranch.
In the 1950s, the Irvine Company began to develop the area for residential and commercial use. The first planned community was developed in 1959, and the city of Irvine was incorporated in 1971. The city was named after James Irvine, the founder of the Irvine Ranch.
Geography
Irvine is located in the San Joaquin Hills of Orange County, California. It is bordered by the cities of Santa Ana, Tustin, Lake Forest, and Laguna Beach. The city covers an area of 65.3 square miles, and it has a population of over 250,000 people.
The city is divided into several distinct neighborhoods, including Northwood, Woodbridge, University Park, and Turtle Rock. The city is also home to several parks, including William R. Mason Regional Park, San Joaquin Marsh, and Irvine Regional Park.
Economy
Irvine is a major economic center in Orange County. The city is home to several major corporations, including Allergan, Broadcom, Blizzard Entertainment, and Western Digital. The city is also home to the University of California, Irvine, which is one of the largest employers in the city.
The city is also home to several shopping centers, including the Irvine Spectrum Center, which is one of the largest shopping centers in the state. The city is also home to several museums, including the Irvine Museum, the Orange County Museum of Art, and the Irvine Historical Museum.
Demographics
As of the 2010 census, Irvine had a population of 212,375 people. The racial makeup of the city was 57.2% White, 14.5% Asian, 11.2% Hispanic or Latino, 8.2% African American, 0.7% Native American, and 0.2% Pacific Islander.
The median household income in Irvine was $93,717, and the median family income was $106,717. The per capita income in the city was $45,890. The city has a high rate of educational attainment, with over 80% of the population having a bachelor's degree or higher.
Common Questions
What is Per Capita Income in Irvine?
Per Capita income in Irvine is $59,354.
What is the Median Family Income in Irvine?
Median Family Income in Irvine is $153,615.
What is the Median Household income in Irvine?
Median Household Income in Irvine is $122,948.
What is Income or Wage Gap in Irvine?
Income or Wage Gap in Irvine is 40.2%.
Women in Irvine earn 59.8 cents for every dollar earned by a man.
What is Family Income Deficit in Irvine?
Family Income Deficit in Irvine is $14,651.
Families that are below poverty line in Irvine earn $14,651 less on average than the poverty threshold level.
What is Inequality or Gini Index in Irvine?
Inequality or Gini Index in Irvine is 0.48.
What is the Total Population of Irvine?
Total Population of Irvine is 304,527.
What is the Total Male Population of Irvine?
Total Male Population of Irvine is 150,761.
What is the Total Female Population of Irvine?
Total Female Population of Irvine is 153,766.
What is the Ratio of Males per 100 Females in Irvine?
There are 98.05 Males per 100 Females in Irvine.
What is the Ratio of Females per 100 Males in Irvine?
There are 101.99 Females per 100 Males in Irvine.
What is the Median Population Age in Irvine?
Median Population Age in Irvine is 33.8 Years.
What is the Average Family Size in Irvine
Average Family Size in Irvine is 3.2 People.
What is the Average Household Size in Irvine
Average Household Size in Irvine is 2.7 People.
How Large is the Labor Force in Irvine?
There are 160,914 People in the Labor Forcein in Irvine.
What is the Percentage of People in the Labor Force in Irvine?
65.6% of People are in the Labor Force in Irvine.
What is the Unemployment Rate in Irvine?
Unemployment Rate in Irvine is 5.5%.