Zip Codes with the Highest Percentage of Population Employed in Architecture & Engineering in Lake Elsinore, CA
RELATED REPORTS & OPTIONS
Architecture & Engineering
Lake Elsinore
Compare Zip Codes
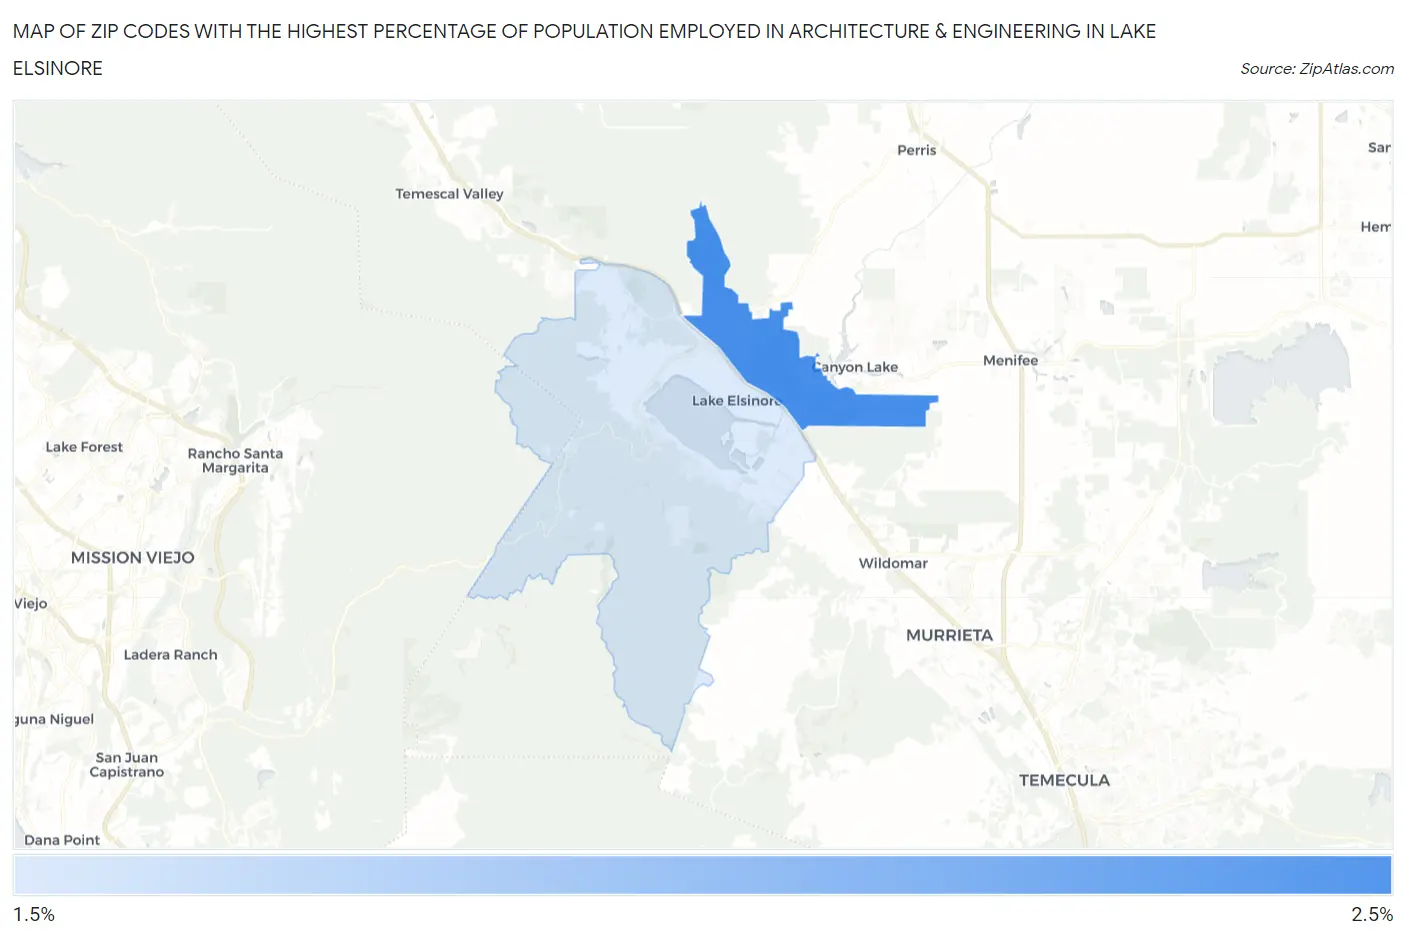
Map of Zip Codes with the Highest Percentage of Population Employed in Architecture & Engineering in Lake Elsinore
1.6%
2.1%
Zip Codes with the Highest Percentage of Population Employed in Architecture & Engineering in Lake Elsinore, CA
| Zip Code | % Employed | vs State | vs National | |
| 1. | 92532 | 2.1% | 2.6%(-0.480)#664 | 2.1%(-0.075)#9,181 |
| 2. | 92530 | 1.6% | 2.6%(-0.952)#829 | 2.1%(-0.547)#12,174 |
1
Common Questions
What are the Top Zip Codes with the Highest Percentage of Population Employed in Architecture & Engineering in Lake Elsinore, CA?
Top Zip Codes with the Highest Percentage of Population Employed in Architecture & Engineering in Lake Elsinore, CA are:
What zip code has the Highest Percentage of Population Employed in Architecture & Engineering in Lake Elsinore, CA?
92532 has the Highest Percentage of Population Employed in Architecture & Engineering in Lake Elsinore, CA with 2.1%.
What is the Percentage of Population Employed in Architecture & Engineering in Lake Elsinore, CA?
Percentage of Population Employed in Architecture & Engineering in Lake Elsinore is 2.0%.
What is the Percentage of Population Employed in Architecture & Engineering in California?
Percentage of Population Employed in Architecture & Engineering in California is 2.6%.
What is the Percentage of Population Employed in Architecture & Engineering in the United States?
Percentage of Population Employed in Architecture & Engineering in the United States is 2.1%.