Cities with the Highest Percentage of Population Employed in Architecture & Engineering in Louisiana
RELATED REPORTS & OPTIONS
Architecture & Engineering
Louisiana
Compare Cities
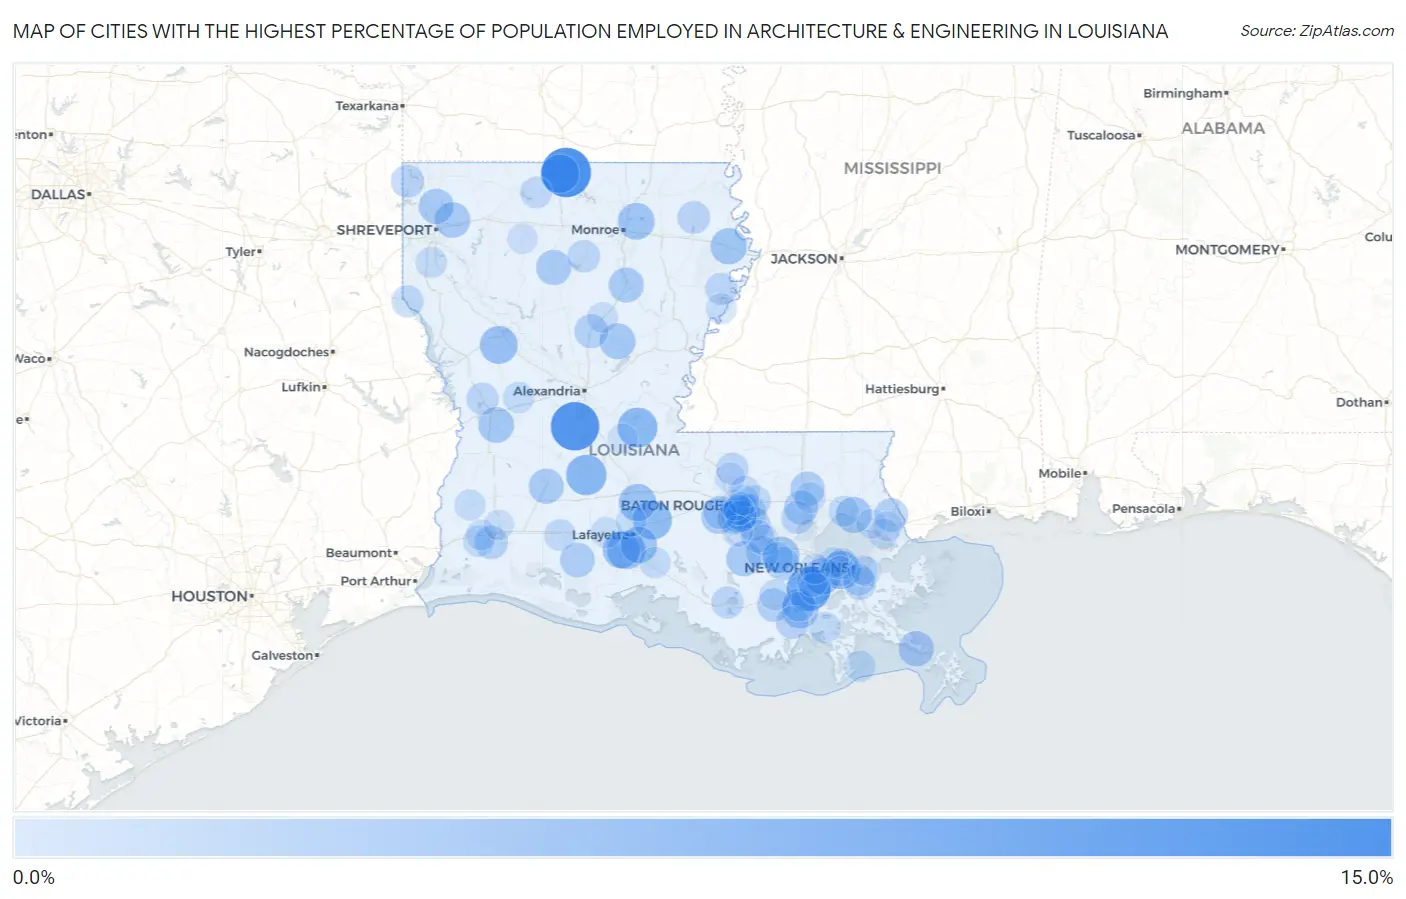
Map of Cities with the Highest Percentage of Population Employed in Architecture & Engineering in Louisiana
0.0%
15.0%
Cities with the Highest Percentage of Population Employed in Architecture & Engineering in Louisiana
| City | % Employed | vs State | vs National | |
| 1. | Spearsville | 14.6% | 1.9%(+12.6)#1 | 2.1%(+12.4)#243 |
| 2. | Forest Hill | 13.8% | 1.9%(+11.9)#2 | 2.1%(+11.7)#271 |
| 3. | Des Allemands | 11.1% | 1.9%(+9.12)#3 | 2.1%(+8.91)#418 |
| 4. | Reddell | 8.6% | 1.9%(+6.67)#4 | 2.1%(+6.46)#623 |
| 5. | Moreauville | 8.3% | 1.9%(+6.32)#5 | 2.1%(+6.11)#671 |
| 6. | Cecilia | 7.6% | 1.9%(+5.70)#6 | 2.1%(+5.49)#784 |
| 7. | Centerville | 7.6% | 1.9%(+5.62)#7 | 2.1%(+5.41)#799 |
| 8. | Lillie | 7.5% | 1.9%(+5.52)#8 | 2.1%(+5.31)#816 |
| 9. | Milton | 7.3% | 1.9%(+5.41)#9 | 2.1%(+5.20)#838 |
| 10. | Elmwood | 7.3% | 1.9%(+5.37)#10 | 2.1%(+5.16)#845 |
| 11. | Provencal | 6.9% | 1.9%(+4.96)#11 | 2.1%(+4.75)#960 |
| 12. | Leonville | 6.6% | 1.9%(+4.69)#12 | 2.1%(+4.48)#1,009 |
| 13. | Maurice | 6.4% | 1.9%(+4.49)#13 | 2.1%(+4.29)#1,073 |
| 14. | Luling | 6.3% | 1.9%(+4.39)#14 | 2.1%(+4.18)#1,109 |
| 15. | Lockport Heights | 6.2% | 1.9%(+4.29)#15 | 2.1%(+4.08)#1,148 |
| 16. | Inniswold | 6.2% | 1.9%(+4.28)#16 | 2.1%(+4.07)#1,150 |
| 17. | Swartz | 6.2% | 1.9%(+4.26)#17 | 2.1%(+4.05)#1,163 |
| 18. | Broussard | 6.1% | 1.9%(+4.19)#18 | 2.1%(+3.99)#1,182 |
| 19. | Lutcher | 6.0% | 1.9%(+4.10)#19 | 2.1%(+3.89)#1,216 |
| 20. | Richmond | 6.0% | 1.9%(+4.10)#20 | 2.1%(+3.89)#1,220 |
| 21. | Mandeville | 5.8% | 1.9%(+3.89)#21 | 2.1%(+3.69)#1,323 |
| 22. | Midway | 5.7% | 1.9%(+3.80)#22 | 2.1%(+3.59)#1,369 |
| 23. | Fort Polk South | 5.6% | 1.9%(+3.66)#23 | 2.1%(+3.45)#1,443 |
| 24. | Oak Hills Place | 5.6% | 1.9%(+3.63)#24 | 2.1%(+3.42)#1,463 |
| 25. | Red Chute | 5.5% | 1.9%(+3.55)#25 | 2.1%(+3.35)#1,510 |
| 26. | Buras | 5.4% | 1.9%(+3.46)#26 | 2.1%(+3.26)#1,560 |
| 27. | Jonesboro | 5.3% | 1.9%(+3.39)#27 | 2.1%(+3.18)#1,608 |
| 28. | Oberlin | 5.2% | 1.9%(+3.28)#28 | 2.1%(+3.07)#1,684 |
| 29. | Addis | 5.2% | 1.9%(+3.27)#29 | 2.1%(+3.06)#1,686 |
| 30. | Benton | 5.2% | 1.9%(+3.25)#30 | 2.1%(+3.05)#1,695 |
| 31. | Columbia | 5.2% | 1.9%(+3.23)#31 | 2.1%(+3.02)#1,713 |
| 32. | Belle Rose | 5.2% | 1.9%(+3.22)#32 | 2.1%(+3.01)#1,727 |
| 33. | Gueydan | 4.9% | 1.9%(+3.00)#33 | 2.1%(+2.79)#1,876 |
| 34. | Tickfaw | 4.8% | 1.9%(+2.81)#34 | 2.1%(+2.60)#2,017 |
| 35. | Springfield | 4.7% | 1.9%(+2.71)#35 | 2.1%(+2.50)#2,097 |
| 36. | Shenandoah | 4.6% | 1.9%(+2.61)#36 | 2.1%(+2.40)#2,179 |
| 37. | Georgetown | 4.4% | 1.9%(+2.50)#37 | 2.1%(+2.30)#2,271 |
| 38. | North Vacherie | 4.4% | 1.9%(+2.41)#38 | 2.1%(+2.20)#2,360 |
| 39. | Pearl River | 4.2% | 1.9%(+2.31)#39 | 2.1%(+2.10)#2,459 |
| 40. | Prien | 4.2% | 1.9%(+2.24)#40 | 2.1%(+2.03)#2,549 |
| 41. | Gray | 4.2% | 1.9%(+2.23)#41 | 2.1%(+2.03)#2,555 |
| 42. | Prairieville | 4.2% | 1.9%(+2.23)#42 | 2.1%(+2.02)#2,572 |
| 43. | Gardere | 4.1% | 1.9%(+2.19)#43 | 2.1%(+1.98)#2,617 |
| 44. | Vivian | 4.0% | 1.9%(+2.09)#44 | 2.1%(+1.88)#2,744 |
| 45. | Bourg | 4.0% | 1.9%(+2.05)#45 | 2.1%(+1.84)#2,789 |
| 46. | Union | 3.9% | 1.9%(+1.98)#46 | 2.1%(+1.77)#2,866 |
| 47. | Brusly | 3.9% | 1.9%(+1.97)#47 | 2.1%(+1.76)#2,886 |
| 48. | Mathews | 3.9% | 1.9%(+1.96)#48 | 2.1%(+1.75)#2,893 |
| 49. | Epps | 3.8% | 1.9%(+1.87)#49 | 2.1%(+1.66)#3,008 |
| 50. | Gonzales | 3.8% | 1.9%(+1.81)#50 | 2.1%(+1.60)#3,089 |
| 51. | Killian | 3.7% | 1.9%(+1.79)#51 | 2.1%(+1.59)#3,115 |
| 52. | Chatham | 3.7% | 1.9%(+1.73)#52 | 2.1%(+1.52)#3,225 |
| 53. | Belle Chasse | 3.5% | 1.9%(+1.60)#53 | 2.1%(+1.39)#3,454 |
| 54. | Anacoco | 3.5% | 1.9%(+1.52)#54 | 2.1%(+1.31)#3,589 |
| 55. | Morgan City | 3.4% | 1.9%(+1.47)#55 | 2.1%(+1.26)#3,696 |
| 56. | Slaughter | 3.4% | 1.9%(+1.45)#56 | 2.1%(+1.24)#3,726 |
| 57. | Newellton | 3.4% | 1.9%(+1.43)#57 | 2.1%(+1.23)#3,771 |
| 58. | Logansport | 3.3% | 1.9%(+1.39)#58 | 2.1%(+1.18)#3,862 |
| 59. | Bayou Gauche | 3.2% | 1.9%(+1.24)#59 | 2.1%(+1.03)#4,137 |
| 60. | Jennings | 3.2% | 1.9%(+1.23)#60 | 2.1%(+1.02)#4,182 |
| 61. | Denham Springs | 3.2% | 1.9%(+1.22)#61 | 2.1%(+1.01)#4,201 |
| 62. | Timberlane | 3.1% | 1.9%(+1.19)#62 | 2.1%(+0.980)#4,262 |
| 63. | Lisbon | 3.1% | 1.9%(+1.18)#63 | 2.1%(+0.976)#4,280 |
| 64. | Carlyss | 3.0% | 1.9%(+1.11)#64 | 2.1%(+0.900)#4,455 |
| 65. | Cut Off | 3.0% | 1.9%(+1.02)#65 | 2.1%(+0.813)#4,679 |
| 66. | Stonewall | 3.0% | 1.9%(+1.02)#66 | 2.1%(+0.809)#4,688 |
| 67. | Grand Isle | 2.9% | 1.9%(+0.992)#67 | 2.1%(+0.784)#4,751 |
| 68. | Simpson | 2.9% | 1.9%(+0.966)#68 | 2.1%(+0.758)#4,821 |
| 69. | New Iberia | 2.9% | 1.9%(+0.941)#69 | 2.1%(+0.733)#4,896 |
| 70. | Dequincy | 2.8% | 1.9%(+0.895)#70 | 2.1%(+0.687)#5,017 |
| 71. | Lafourche Crossing | 2.8% | 1.9%(+0.876)#71 | 2.1%(+0.668)#5,060 |
| 72. | Rayne | 2.8% | 1.9%(+0.872)#72 | 2.1%(+0.664)#5,081 |
| 73. | Metairie | 2.8% | 1.9%(+0.842)#73 | 2.1%(+0.634)#5,158 |
| 74. | Sorrento | 2.8% | 1.9%(+0.817)#74 | 2.1%(+0.609)#5,241 |
| 75. | Grand Point | 2.7% | 1.9%(+0.767)#75 | 2.1%(+0.559)#5,402 |
| 76. | Paradis | 2.7% | 1.9%(+0.749)#76 | 2.1%(+0.541)#5,464 |
| 77. | Madisonville | 2.7% | 1.9%(+0.745)#77 | 2.1%(+0.537)#5,479 |
| 78. | Central | 2.7% | 1.9%(+0.722)#78 | 2.1%(+0.514)#5,543 |
| 79. | Village St George | 2.7% | 1.9%(+0.719)#79 | 2.1%(+0.511)#5,550 |
| 80. | Kenner | 2.6% | 1.9%(+0.695)#80 | 2.1%(+0.487)#5,624 |
| 81. | Eden Isle | 2.6% | 1.9%(+0.682)#81 | 2.1%(+0.474)#5,666 |
| 82. | Hammond | 2.6% | 1.9%(+0.655)#82 | 2.1%(+0.447)#5,736 |
| 83. | St Gabriel | 2.6% | 1.9%(+0.651)#83 | 2.1%(+0.443)#5,751 |
| 84. | Urania | 2.6% | 1.9%(+0.650)#84 | 2.1%(+0.441)#5,759 |
| 85. | Baton Rouge | 2.6% | 1.9%(+0.635)#85 | 2.1%(+0.427)#5,802 |
| 86. | Sulphur | 2.6% | 1.9%(+0.615)#86 | 2.1%(+0.407)#5,868 |
| 87. | Carencro | 2.5% | 1.9%(+0.602)#87 | 2.1%(+0.394)#5,908 |
| 88. | St Joseph | 2.5% | 1.9%(+0.601)#88 | 2.1%(+0.393)#5,911 |
| 89. | Hahnville | 2.5% | 1.9%(+0.569)#89 | 2.1%(+0.361)#6,014 |
| 90. | Bryceland | 2.4% | 1.9%(+0.478)#90 | 2.1%(+0.270)#6,306 |
| 91. | Harahan | 2.4% | 1.9%(+0.475)#91 | 2.1%(+0.267)#6,319 |
| 92. | Moss Bluff | 2.4% | 1.9%(+0.452)#92 | 2.1%(+0.244)#6,407 |
| 93. | Monticello | 2.4% | 1.9%(+0.439)#93 | 2.1%(+0.231)#6,457 |
| 94. | Zachary | 2.2% | 1.9%(+0.302)#94 | 2.1%(+0.094)#6,959 |
| 95. | Westminster | 2.2% | 1.9%(+0.295)#95 | 2.1%(+0.087)#6,984 |
| 96. | Evergreen | 2.2% | 1.9%(+0.281)#96 | 2.1%(+0.073)#7,040 |
| 97. | Lacombe | 2.2% | 1.9%(+0.274)#97 | 2.1%(+0.066)#7,060 |
| 98. | Slidell | 2.2% | 1.9%(+0.232)#98 | 2.1%(+0.024)#7,248 |
| 99. | Arabi | 2.2% | 1.9%(+0.227)#99 | 2.1%(+0.019)#7,264 |
| 100. | Chalmette | 2.1% | 1.9%(+0.197)#100 | 2.1%(-0.011)#7,375 |
Common Questions
What are the Top 10 Cities with the Highest Percentage of Population Employed in Architecture & Engineering in Louisiana?
Top 10 Cities with the Highest Percentage of Population Employed in Architecture & Engineering in Louisiana are:
#1
14.6%
#2
13.8%
#3
11.1%
#4
8.6%
#5
8.3%
#6
7.6%
#7
7.5%
#8
7.3%
#9
7.3%
#10
6.9%
What city has the Highest Percentage of Population Employed in Architecture & Engineering in Louisiana?
Spearsville has the Highest Percentage of Population Employed in Architecture & Engineering in Louisiana with 14.6%.
What is the Percentage of Population Employed in Architecture & Engineering in the State of Louisiana?
Percentage of Population Employed in Architecture & Engineering in Louisiana is 1.9%.
What is the Percentage of Population Employed in Architecture & Engineering in the United States?
Percentage of Population Employed in Architecture & Engineering in the United States is 2.1%.