Cities with the Highest Percentage of Population Employed in Architecture & Engineering in West Virginia
RELATED REPORTS & OPTIONS
Architecture & Engineering
West Virginia
Compare Cities
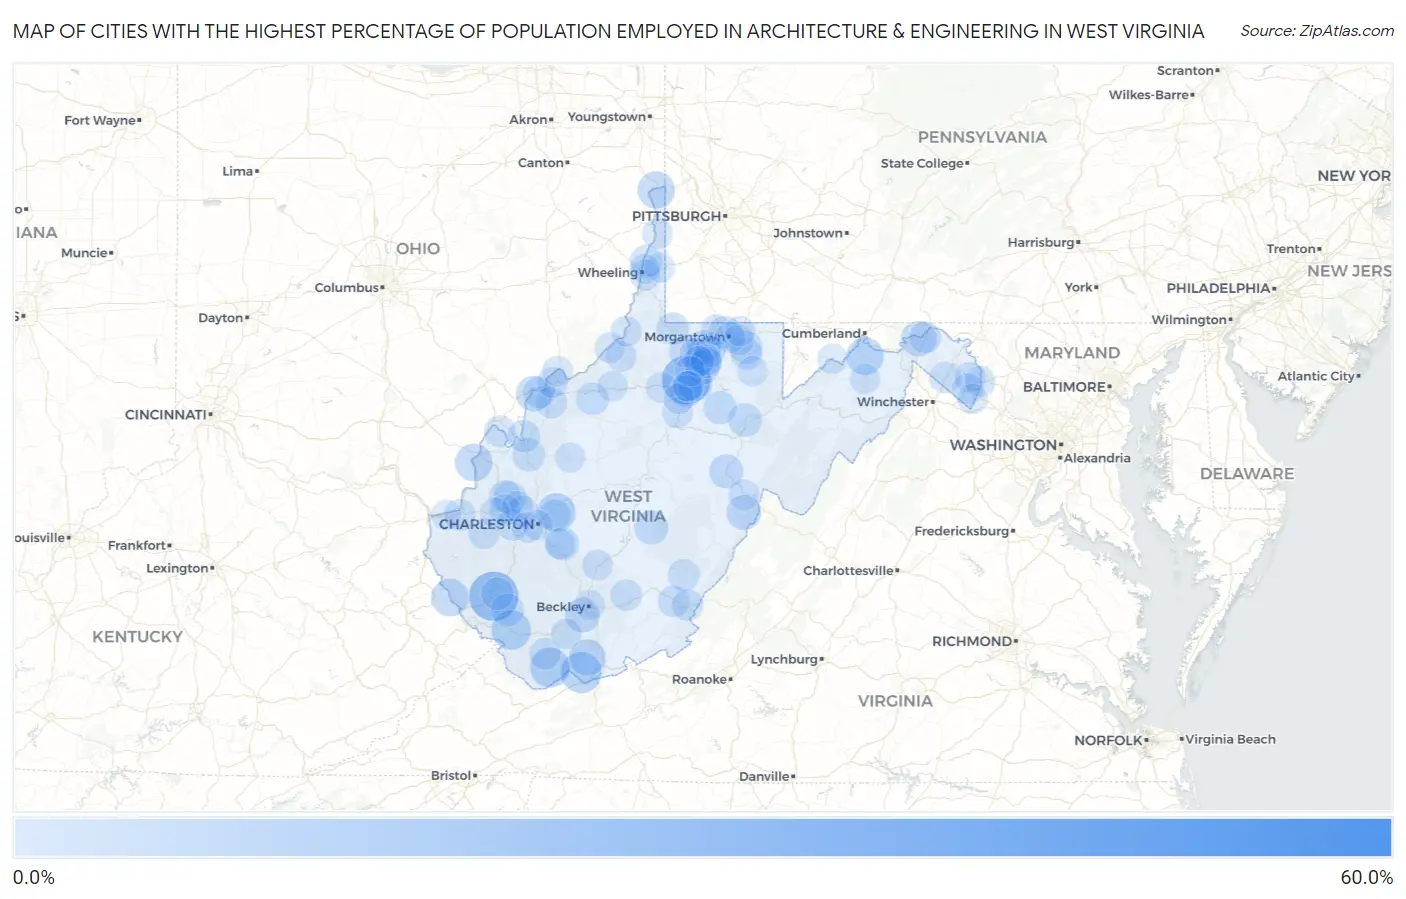
Map of Cities with the Highest Percentage of Population Employed in Architecture & Engineering in West Virginia
0.0%
60.0%
Cities with the Highest Percentage of Population Employed in Architecture & Engineering in West Virginia
| City | % Employed | vs State | vs National | |
| 1. | Garten | 55.8% | 1.6%(+54.3)#1 | 2.1%(+53.7)#21 |
| 2. | Mount Gay Shamrock | 22.9% | 1.6%(+21.4)#2 | 2.1%(+20.8)#102 |
| 3. | Hepzibah | 22.3% | 1.6%(+20.7)#3 | 2.1%(+20.1)#107 |
| 4. | Bluewell | 13.4% | 1.6%(+11.8)#4 | 2.1%(+11.2)#292 |
| 5. | Gary | 12.2% | 1.6%(+10.7)#5 | 2.1%(+10.1)#343 |
| 6. | Gilbert | 11.6% | 1.6%(+10.1)#6 | 2.1%(+9.48)#379 |
| 7. | Elkview | 10.9% | 1.6%(+9.32)#7 | 2.1%(+8.73)#432 |
| 8. | Fort Ashby | 9.5% | 1.6%(+7.99)#8 | 2.1%(+7.40)#532 |
| 9. | Kermit | 9.5% | 1.6%(+7.96)#9 | 2.1%(+7.37)#537 |
| 10. | Gallipolis Ferry | 9.3% | 1.6%(+7.74)#10 | 2.1%(+7.15)#549 |
| 11. | Newell | 9.1% | 1.6%(+7.50)#11 | 2.1%(+6.92)#570 |
| 12. | Lashmeet | 8.1% | 1.6%(+6.58)#12 | 2.1%(+5.99)#698 |
| 13. | Washington | 7.1% | 1.6%(+5.58)#13 | 2.1%(+4.99)#891 |
| 14. | Great Cacapon | 6.9% | 1.6%(+5.37)#14 | 2.1%(+4.78)#948 |
| 15. | Barrackville | 6.6% | 1.6%(+5.08)#15 | 2.1%(+4.49)#1,006 |
| 16. | Sophia | 6.2% | 1.6%(+4.69)#16 | 2.1%(+4.10)#1,135 |
| 17. | Green Bank | 6.2% | 1.6%(+4.69)#17 | 2.1%(+4.10)#1,143 |
| 18. | Bridgeport | 6.2% | 1.6%(+4.65)#18 | 2.1%(+4.06)#1,155 |
| 19. | Grant Town | 5.9% | 1.6%(+4.32)#19 | 2.1%(+3.73)#1,296 |
| 20. | White Hall | 5.6% | 1.6%(+4.07)#20 | 2.1%(+3.48)#1,428 |
| 21. | Craigsville | 5.5% | 1.6%(+3.99)#21 | 2.1%(+3.40)#1,483 |
| 22. | Huttonsville | 5.5% | 1.6%(+3.93)#22 | 2.1%(+3.35)#1,513 |
| 23. | Montrose | 5.1% | 1.6%(+3.53)#23 | 2.1%(+2.94)#1,775 |
| 24. | Philippi | 4.9% | 1.6%(+3.30)#24 | 2.1%(+2.71)#1,931 |
| 25. | Glasgow | 4.6% | 1.6%(+3.04)#25 | 2.1%(+2.45)#2,143 |
| 26. | Ripley | 4.3% | 1.6%(+2.76)#26 | 2.1%(+2.17)#2,386 |
| 27. | Winfield | 4.2% | 1.6%(+2.68)#27 | 2.1%(+2.09)#2,467 |
| 28. | Man | 4.2% | 1.6%(+2.63)#28 | 2.1%(+2.04)#2,535 |
| 29. | Masontown | 4.1% | 1.6%(+2.53)#29 | 2.1%(+1.94)#2,648 |
| 30. | Star City | 4.0% | 1.6%(+2.47)#30 | 2.1%(+1.88)#2,745 |
| 31. | Cairo | 4.0% | 1.6%(+2.44)#31 | 2.1%(+1.85)#2,771 |
| 32. | West Logan | 4.0% | 1.6%(+2.41)#32 | 2.1%(+1.82)#2,805 |
| 33. | Hundred | 3.9% | 1.6%(+2.32)#33 | 2.1%(+1.73)#2,928 |
| 34. | Clearview | 3.7% | 1.6%(+2.11)#34 | 2.1%(+1.52)#3,234 |
| 35. | Nutter Fort | 3.6% | 1.6%(+2.06)#35 | 2.1%(+1.47)#3,306 |
| 36. | Eleanor | 3.6% | 1.6%(+2.06)#36 | 2.1%(+1.47)#3,309 |
| 37. | Ravenswood | 3.6% | 1.6%(+2.05)#37 | 2.1%(+1.46)#3,337 |
| 38. | Falling Spring | 3.3% | 1.6%(+1.77)#38 | 2.1%(+1.18)#3,855 |
| 39. | Reedsville | 3.3% | 1.6%(+1.74)#39 | 2.1%(+1.15)#3,902 |
| 40. | Pea Ridge | 3.1% | 1.6%(+1.54)#40 | 2.1%(+0.949)#4,338 |
| 41. | Blennerhassett | 2.9% | 1.6%(+1.38)#41 | 2.1%(+0.794)#4,721 |
| 42. | Mineralwells | 2.9% | 1.6%(+1.32)#42 | 2.1%(+0.735)#4,888 |
| 43. | New Haven | 2.9% | 1.6%(+1.30)#43 | 2.1%(+0.715)#4,938 |
| 44. | Bath Berkeley Springs | 2.9% | 1.6%(+1.30)#44 | 2.1%(+0.708)#4,959 |
| 45. | Tornado | 2.8% | 1.6%(+1.27)#45 | 2.1%(+0.677)#5,036 |
| 46. | Cross Lanes | 2.8% | 1.6%(+1.25)#46 | 2.1%(+0.659)#5,097 |
| 47. | Welch | 2.8% | 1.6%(+1.24)#47 | 2.1%(+0.653)#5,116 |
| 48. | Teays Valley | 2.8% | 1.6%(+1.22)#48 | 2.1%(+0.629)#5,167 |
| 49. | Lewisburg | 2.7% | 1.6%(+1.17)#49 | 2.1%(+0.581)#5,319 |
| 50. | Pinch | 2.7% | 1.6%(+1.16)#50 | 2.1%(+0.574)#5,353 |
| 51. | Inwood | 2.7% | 1.6%(+1.16)#51 | 2.1%(+0.570)#5,367 |
| 52. | Meadow Bridge | 2.7% | 1.6%(+1.14)#52 | 2.1%(+0.553)#5,417 |
| 53. | Mannington | 2.7% | 1.6%(+1.14)#53 | 2.1%(+0.549)#5,437 |
| 54. | White Sulphur Springs | 2.7% | 1.6%(+1.13)#54 | 2.1%(+0.536)#5,481 |
| 55. | Clifton | 2.5% | 1.6%(+0.976)#55 | 2.1%(+0.387)#5,932 |
| 56. | Salem | 2.5% | 1.6%(+0.970)#56 | 2.1%(+0.381)#5,957 |
| 57. | Jane Lew | 2.5% | 1.6%(+0.909)#57 | 2.1%(+0.320)#6,132 |
| 58. | Farmington | 2.4% | 1.6%(+0.856)#58 | 2.1%(+0.266)#6,322 |
| 59. | Cassville | 2.3% | 1.6%(+0.766)#59 | 2.1%(+0.176)#6,638 |
| 60. | Shenandoah Junction | 2.3% | 1.6%(+0.742)#60 | 2.1%(+0.153)#6,735 |
| 61. | Durbin | 2.3% | 1.6%(+0.730)#61 | 2.1%(+0.141)#6,778 |
| 62. | Rivesville | 2.3% | 1.6%(+0.713)#62 | 2.1%(+0.124)#6,846 |
| 63. | Fairmont | 2.2% | 1.6%(+0.677)#63 | 2.1%(+0.088)#6,981 |
| 64. | Charles Town | 2.2% | 1.6%(+0.677)#64 | 2.1%(+0.087)#6,982 |
| 65. | Pleasant Valley | 2.2% | 1.6%(+0.676)#65 | 2.1%(+0.086)#6,988 |
| 66. | East Bank | 2.2% | 1.6%(+0.626)#66 | 2.1%(+0.037)#7,181 |
| 67. | Ranson Corporation | 2.2% | 1.6%(+0.612)#67 | 2.1%(+0.022)#7,252 |
| 68. | North Hills | 2.2% | 1.6%(+0.608)#68 | 2.1%(+0.019)#7,265 |
| 69. | Bethlehem | 2.1% | 1.6%(+0.514)#69 | 2.1%(-0.076)#7,639 |
| 70. | Monongah | 2.1% | 1.6%(+0.512)#70 | 2.1%(-0.078)#7,645 |
| 71. | Bolivar | 1.9% | 1.6%(+0.386)#71 | 2.1%(-0.204)#8,122 |
| 72. | Despard | 1.9% | 1.6%(+0.382)#72 | 2.1%(-0.207)#8,130 |
| 73. | Brookhaven | 1.9% | 1.6%(+0.356)#73 | 2.1%(-0.234)#8,240 |
| 74. | Morgantown | 1.9% | 1.6%(+0.314)#74 | 2.1%(-0.276)#8,421 |
| 75. | Mullens | 1.8% | 1.6%(+0.278)#75 | 2.1%(-0.311)#8,588 |
| 76. | Hamlin | 1.8% | 1.6%(+0.277)#76 | 2.1%(-0.312)#8,593 |
| 77. | Williamstown | 1.8% | 1.6%(+0.255)#77 | 2.1%(-0.335)#8,689 |
| 78. | Middlebourne | 1.8% | 1.6%(+0.245)#78 | 2.1%(-0.344)#8,730 |
| 79. | West Milford | 1.8% | 1.6%(+0.245)#79 | 2.1%(-0.344)#8,732 |
| 80. | Poca | 1.8% | 1.6%(+0.239)#80 | 2.1%(-0.351)#8,766 |
| 81. | Sistersville | 1.8% | 1.6%(+0.231)#81 | 2.1%(-0.359)#8,803 |
| 82. | South Charleston | 1.7% | 1.6%(+0.187)#82 | 2.1%(-0.403)#9,000 |
| 83. | New Martinsville | 1.7% | 1.6%(+0.163)#83 | 2.1%(-0.427)#9,128 |
| 84. | Fayetteville | 1.7% | 1.6%(+0.119)#84 | 2.1%(-0.470)#9,332 |
| 85. | Pennsboro | 1.6% | 1.6%(+0.066)#85 | 2.1%(-0.523)#9,581 |
| 86. | Hurricane | 1.6% | 1.6%(+0.031)#86 | 2.1%(-0.558)#9,756 |
| 87. | Tunnelton | 1.6% | 1.6%(-0.005)#87 | 2.1%(-0.595)#9,929 |
| 88. | Hooverson Heights | 1.5% | 1.6%(-0.038)#88 | 2.1%(-0.628)#10,116 |
| 89. | Romney | 1.5% | 1.6%(-0.053)#89 | 2.1%(-0.643)#10,173 |
| 90. | Piedmont | 1.5% | 1.6%(-0.056)#90 | 2.1%(-0.645)#10,183 |
| 91. | Beckley | 1.5% | 1.6%(-0.079)#91 | 2.1%(-0.668)#10,312 |
| 92. | Charleston | 1.4% | 1.6%(-0.140)#92 | 2.1%(-0.729)#10,618 |
| 93. | Shinnston | 1.4% | 1.6%(-0.163)#93 | 2.1%(-0.752)#10,746 |
| 94. | Shannondale | 1.4% | 1.6%(-0.166)#94 | 2.1%(-0.755)#10,762 |
| 95. | Cheat Lake | 1.4% | 1.6%(-0.200)#95 | 2.1%(-0.790)#10,931 |
| 96. | Spencer | 1.3% | 1.6%(-0.226)#96 | 2.1%(-0.816)#11,078 |
| 97. | Valley Grove | 1.3% | 1.6%(-0.250)#97 | 2.1%(-0.839)#11,221 |
| 98. | Clarksburg | 1.3% | 1.6%(-0.282)#98 | 2.1%(-0.871)#11,360 |
| 99. | Huntington | 1.3% | 1.6%(-0.302)#99 | 2.1%(-0.892)#11,474 |
| 100. | Wheeling | 1.2% | 1.6%(-0.375)#100 | 2.1%(-0.965)#11,861 |
Common Questions
What are the Top 10 Cities with the Highest Percentage of Population Employed in Architecture & Engineering in West Virginia?
Top 10 Cities with the Highest Percentage of Population Employed in Architecture & Engineering in West Virginia are:
#1
22.9%
#2
22.3%
#3
13.4%
#4
12.2%
#5
11.6%
#6
10.9%
#7
9.5%
#8
9.5%
#9
9.3%
#10
9.1%
What city has the Highest Percentage of Population Employed in Architecture & Engineering in West Virginia?
Mount Gay Shamrock has the Highest Percentage of Population Employed in Architecture & Engineering in West Virginia with 22.9%.
What is the Percentage of Population Employed in Architecture & Engineering in the State of West Virginia?
Percentage of Population Employed in Architecture & Engineering in West Virginia is 1.6%.
What is the Percentage of Population Employed in Architecture & Engineering in the United States?
Percentage of Population Employed in Architecture & Engineering in the United States is 2.1%.