Cities with the Highest Percentage of Population Employed in Architecture & Engineering in Vermont
RELATED REPORTS & OPTIONS
Architecture & Engineering
Vermont
Compare Cities
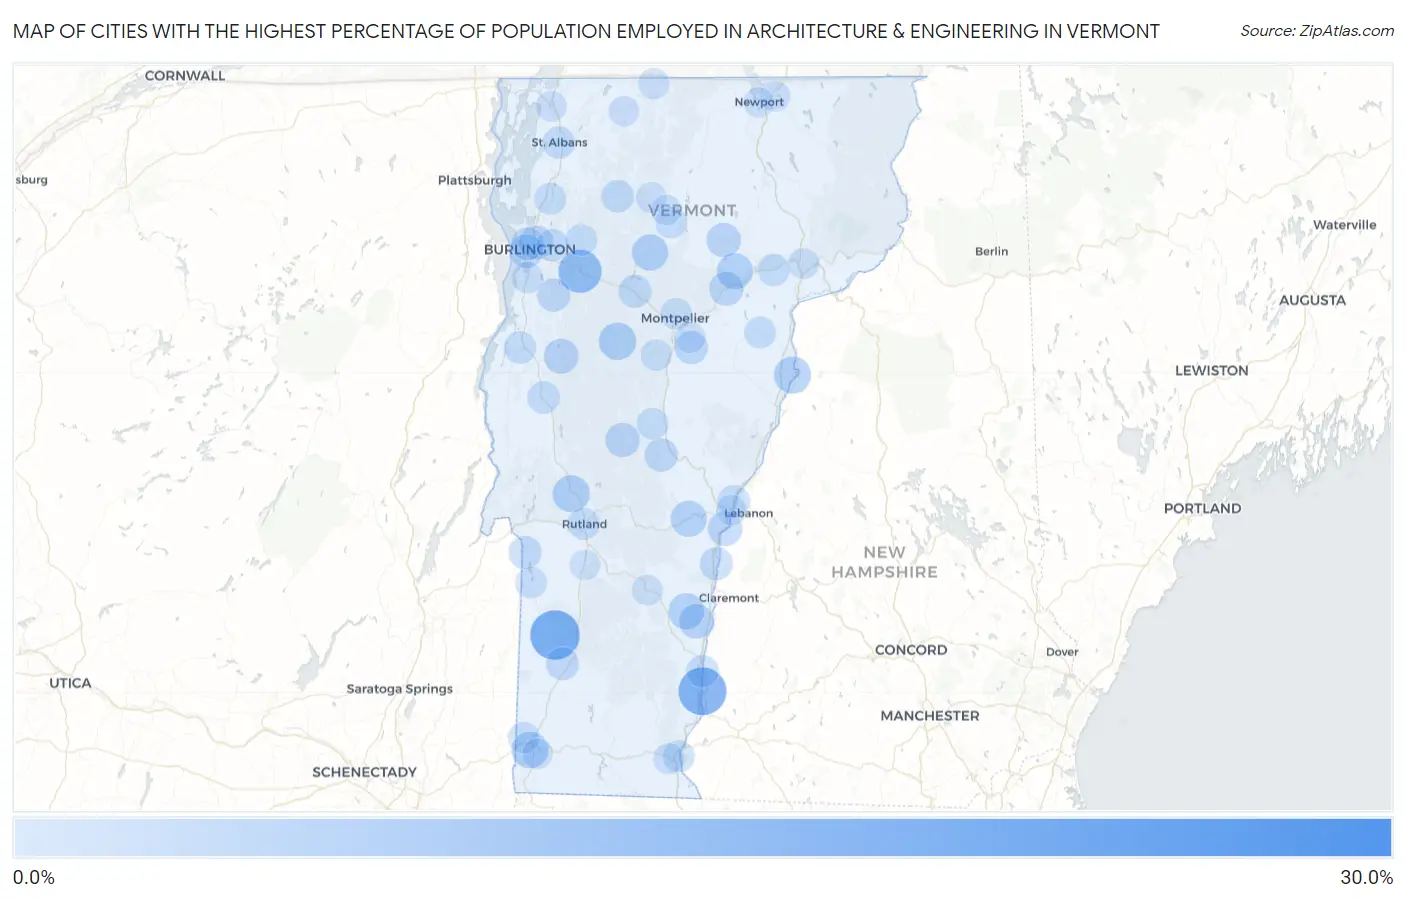
Map of Cities with the Highest Percentage of Population Employed in Architecture & Engineering in Vermont
0.0%
30.0%
Cities with the Highest Percentage of Population Employed in Architecture & Engineering in Vermont
| City | % Employed | vs State | vs National | |
| 1. | Hanksville | 29.2% | 2.0%(+27.2)#1 | 2.1%(+27.0)#61 |
| 2. | Waterbury Center | 25.5% | 2.0%(+23.5)#2 | 2.1%(+23.3)#84 |
| 3. | Dorset | 18.7% | 2.0%(+16.7)#3 | 2.1%(+16.6)#152 |
| 4. | Westminster | 17.1% | 2.0%(+15.1)#4 | 2.1%(+15.0)#175 |
| 5. | East Charlotte | 13.8% | 2.0%(+11.8)#5 | 2.1%(+11.7)#272 |
| 6. | Algiers | 13.5% | 2.0%(+11.5)#6 | 2.1%(+11.3)#287 |
| 7. | Richmond | 12.6% | 2.0%(+10.6)#7 | 2.1%(+10.4)#328 |
| 8. | Waitsfield | 6.9% | 2.0%(+4.89)#8 | 2.1%(+4.75)#961 |
| 9. | Pittsford | 6.6% | 2.0%(+4.61)#9 | 2.1%(+4.46)#1,015 |
| 10. | Newbury | 6.5% | 2.0%(+4.48)#10 | 2.1%(+4.34)#1,051 |
| 11. | Huntington | 6.3% | 2.0%(+4.27)#11 | 2.1%(+4.12)#1,128 |
| 12. | Old Bennington | 6.0% | 2.0%(+4.02)#12 | 2.1%(+3.87)#1,228 |
| 13. | Bolton Valley | 6.0% | 2.0%(+4.01)#13 | 2.1%(+3.87)#1,232 |
| 14. | Stowe | 5.8% | 2.0%(+3.82)#14 | 2.1%(+3.67)#1,334 |
| 15. | Woodstock | 5.6% | 2.0%(+3.55)#15 | 2.1%(+3.41)#1,468 |
| 16. | North Springfield | 5.5% | 2.0%(+3.52)#16 | 2.1%(+3.37)#1,495 |
| 17. | Cabot | 5.5% | 2.0%(+3.50)#17 | 2.1%(+3.36)#1,504 |
| 18. | Killington | 5.3% | 2.0%(+3.33)#18 | 2.1%(+3.18)#1,610 |
| 19. | Bristol | 4.5% | 2.0%(+2.53)#19 | 2.1%(+2.38)#2,202 |
| 20. | Springfield | 4.4% | 2.0%(+2.36)#20 | 2.1%(+2.22)#2,347 |
| 21. | Pownal Center | 4.2% | 2.0%(+2.22)#21 | 2.1%(+2.07)#2,495 |
| 22. | Pawlet | 4.2% | 2.0%(+2.20)#22 | 2.1%(+2.05)#2,521 |
| 23. | North Hartland | 4.2% | 2.0%(+2.19)#23 | 2.1%(+2.04)#2,541 |
| 24. | Danby | 4.0% | 2.0%(+2.04)#24 | 2.1%(+1.89)#2,731 |
| 25. | Hardwick | 4.0% | 2.0%(+1.98)#25 | 2.1%(+1.83)#2,799 |
| 26. | Middletown Springs | 3.9% | 2.0%(+1.95)#26 | 2.1%(+1.80)#2,832 |
| 27. | Rochester | 3.9% | 2.0%(+1.88)#27 | 2.1%(+1.73)#2,921 |
| 28. | Bakersfield | 3.9% | 2.0%(+1.88)#28 | 2.1%(+1.73)#2,926 |
| 29. | Marshfield | 3.8% | 2.0%(+1.78)#29 | 2.1%(+1.63)#3,044 |
| 30. | Winooski | 3.6% | 2.0%(+1.55)#30 | 2.1%(+1.40)#3,428 |
| 31. | Lincoln | 3.3% | 2.0%(+1.25)#31 | 2.1%(+1.10)#3,989 |
| 32. | South Burlington | 3.2% | 2.0%(+1.18)#32 | 2.1%(+1.04)#4,130 |
| 33. | Peacham | 3.2% | 2.0%(+1.17)#33 | 2.1%(+1.03)#4,164 |
| 34. | Hinesburg | 3.0% | 2.0%(+1.03)#34 | 2.1%(+0.881)#4,496 |
| 35. | Bethel | 3.0% | 2.0%(+1.03)#35 | 2.1%(+0.881)#4,497 |
| 36. | Underhill Flats | 3.0% | 2.0%(+0.975)#36 | 2.1%(+0.828)#4,642 |
| 37. | South Barre | 2.9% | 2.0%(+0.895)#37 | 2.1%(+0.748)#4,857 |
| 38. | Burlington | 2.8% | 2.0%(+0.827)#38 | 2.1%(+0.680)#5,029 |
| 39. | Poultney | 2.8% | 2.0%(+0.787)#39 | 2.1%(+0.640)#5,148 |
| 40. | Waterbury | 2.8% | 2.0%(+0.785)#40 | 2.1%(+0.638)#5,154 |
| 41. | Manchester | 2.7% | 2.0%(+0.725)#41 | 2.1%(+0.578)#5,335 |
| 42. | Windsor | 2.7% | 2.0%(+0.688)#42 | 2.1%(+0.541)#5,465 |
| 43. | Jeffersonville | 2.6% | 2.0%(+0.556)#43 | 2.1%(+0.409)#5,860 |
| 44. | Lunenburg | 2.4% | 2.0%(+0.360)#44 | 2.1%(+0.213)#6,504 |
| 45. | Middlebury | 2.4% | 2.0%(+0.357)#45 | 2.1%(+0.210)#6,513 |
| 46. | Bellows Falls | 2.3% | 2.0%(+0.342)#46 | 2.1%(+0.195)#6,575 |
| 47. | Vergennes | 2.2% | 2.0%(+0.217)#47 | 2.1%(+0.070)#7,048 |
| 48. | St Albans | 2.1% | 2.0%(+0.093)#48 | 2.1%(-0.054)#7,540 |
| 49. | Essex Junction | 2.0% | 2.0%(+0.007)#49 | 2.1%(-0.139)#7,895 |
| 50. | Wilder | 2.0% | 2.0%(-0.010)#50 | 2.1%(-0.157)#7,952 |
| 51. | Danville | 2.0% | 2.0%(-0.049)#51 | 2.1%(-0.196)#8,096 |
| 52. | St. George | 1.9% | 2.0%(-0.088)#52 | 2.1%(-0.235)#8,251 |
| 53. | Rutland | 1.8% | 2.0%(-0.208)#53 | 2.1%(-0.355)#8,787 |
| 54. | Randolph | 1.7% | 2.0%(-0.284)#54 | 2.1%(-0.431)#9,141 |
| 55. | Milton | 1.7% | 2.0%(-0.306)#55 | 2.1%(-0.452)#9,245 |
| 56. | Morrisville | 1.6% | 2.0%(-0.372)#56 | 2.1%(-0.519)#9,558 |
| 57. | Groton | 1.6% | 2.0%(-0.409)#57 | 2.1%(-0.556)#9,747 |
| 58. | Brattleboro | 1.6% | 2.0%(-0.450)#58 | 2.1%(-0.596)#9,943 |
| 59. | Proctor | 1.5% | 2.0%(-0.487)#59 | 2.1%(-0.634)#10,139 |
| 60. | Jericho | 1.5% | 2.0%(-0.521)#60 | 2.1%(-0.668)#10,301 |
| 61. | North Bennington | 1.4% | 2.0%(-0.630)#61 | 2.1%(-0.777)#10,859 |
| 62. | Wells | 1.3% | 2.0%(-0.663)#62 | 2.1%(-0.810)#11,045 |
| 63. | Stamford | 1.3% | 2.0%(-0.731)#63 | 2.1%(-0.878)#11,400 |
| 64. | Montpelier | 1.3% | 2.0%(-0.735)#64 | 2.1%(-0.882)#11,423 |
| 65. | Shelburne | 1.3% | 2.0%(-0.738)#65 | 2.1%(-0.885)#11,448 |
| 66. | Northfield | 1.3% | 2.0%(-0.745)#66 | 2.1%(-0.892)#11,475 |
| 67. | Barre | 0.86% | 2.0%(-1.15)#67 | 2.1%(-1.29)#13,648 |
| 68. | Richford | 0.83% | 2.0%(-1.17)#68 | 2.1%(-1.32)#13,803 |
| 69. | West Brattleboro | 0.76% | 2.0%(-1.24)#69 | 2.1%(-1.39)#14,217 |
| 70. | St Johnsbury | 0.68% | 2.0%(-1.32)#70 | 2.1%(-1.47)#14,682 |
| 71. | Enosburg Falls | 0.60% | 2.0%(-1.40)#71 | 2.1%(-1.55)#15,094 |
| 72. | Swanton | 0.57% | 2.0%(-1.43)#72 | 2.1%(-1.58)#15,227 |
| 73. | Johnson | 0.57% | 2.0%(-1.43)#73 | 2.1%(-1.58)#15,252 |
| 74. | Ludlow | 0.52% | 2.0%(-1.48)#74 | 2.1%(-1.63)#15,490 |
| 75. | Derby Center | 0.50% | 2.0%(-1.50)#75 | 2.1%(-1.65)#15,619 |
| 76. | Hyde Park | 0.47% | 2.0%(-1.53)#76 | 2.1%(-1.68)#15,778 |
| 77. | Newport | 0.38% | 2.0%(-1.62)#77 | 2.1%(-1.77)#16,176 |
| 78. | White River Junction | 0.29% | 2.0%(-1.71)#78 | 2.1%(-1.86)#16,501 |
| 79. | Wallingford | 0.26% | 2.0%(-1.74)#79 | 2.1%(-1.89)#16,588 |
| 80. | Bennington | 0.24% | 2.0%(-1.76)#80 | 2.1%(-1.91)#16,628 |
1
2Common Questions
What are the Top 10 Cities with the Highest Percentage of Population Employed in Architecture & Engineering in Vermont?
Top 10 Cities with the Highest Percentage of Population Employed in Architecture & Engineering in Vermont are:
#1
18.7%
#2
17.1%
#3
12.6%
#4
6.9%
#5
6.6%
#6
6.5%
#7
6.0%
#8
5.8%
#9
5.6%
#10
5.5%
What city has the Highest Percentage of Population Employed in Architecture & Engineering in Vermont?
Dorset has the Highest Percentage of Population Employed in Architecture & Engineering in Vermont with 18.7%.
What is the Percentage of Population Employed in Architecture & Engineering in the State of Vermont?
Percentage of Population Employed in Architecture & Engineering in Vermont is 2.0%.
What is the Percentage of Population Employed in Architecture & Engineering in the United States?
Percentage of Population Employed in Architecture & Engineering in the United States is 2.1%.