Markleeville, CA Map & Demographics
Markleeville Map
Markleeville Overview
$40,204
PER CAPITA INCOME
$112,875
AVG FAMILY INCOME
$93,333
AVG HOUSEHOLD INCOME
0.36
INEQUALITY / GINI INDEX
163
TOTAL POPULATION
89
MALE POPULATION
74
FEMALE POPULATION
120.27
MALES / 100 FEMALES
83.15
FEMALES / 100 MALES
64.6
MEDIAN AGE
2.9
AVG FAMILY SIZE
2.5
AVG HOUSEHOLD SIZE
48
LABOR FORCE [ PEOPLE ]
35.8%
PERCENT IN LABOR FORCE
Markleeville Zip Codes
Markleeville Area Codes
Income in Markleeville
Income Overview in Markleeville
Per Capita Income in Markleeville is $40,204, while median incomes of families and households are $112,875 and $93,333 respectively.
| Characteristic | Number | Measure |
| Per Capita Income | 163 | $40,204 |
| Median Family Income | 53 | $112,875 |
| Mean Family Income | 53 | $102,102 |
| Median Household Income | 64 | $93,333 |
| Mean Household Income | 64 | $93,763 |
| Income Deficit | 53 | $0 |
| Wage / Income Gap (%) | 163 | 0.00% |
| Wage / Income Gap ($) | 163 | 100.00¢ per $1 |
| Gini / Inequality Index | 163 | 0.36 |
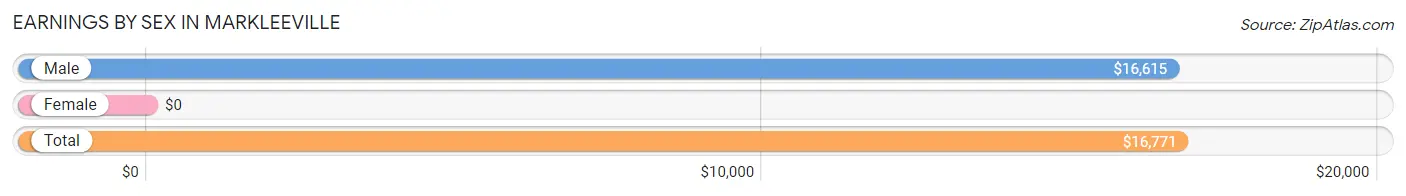
Earnings by Sex in Markleeville
| Sex | Number | Average Earnings |
| Male | 35 (60.3%) | $16,615 |
| Female | 23 (39.7%) | $0 |
| Total | 58 (100.0%) | $16,771 |
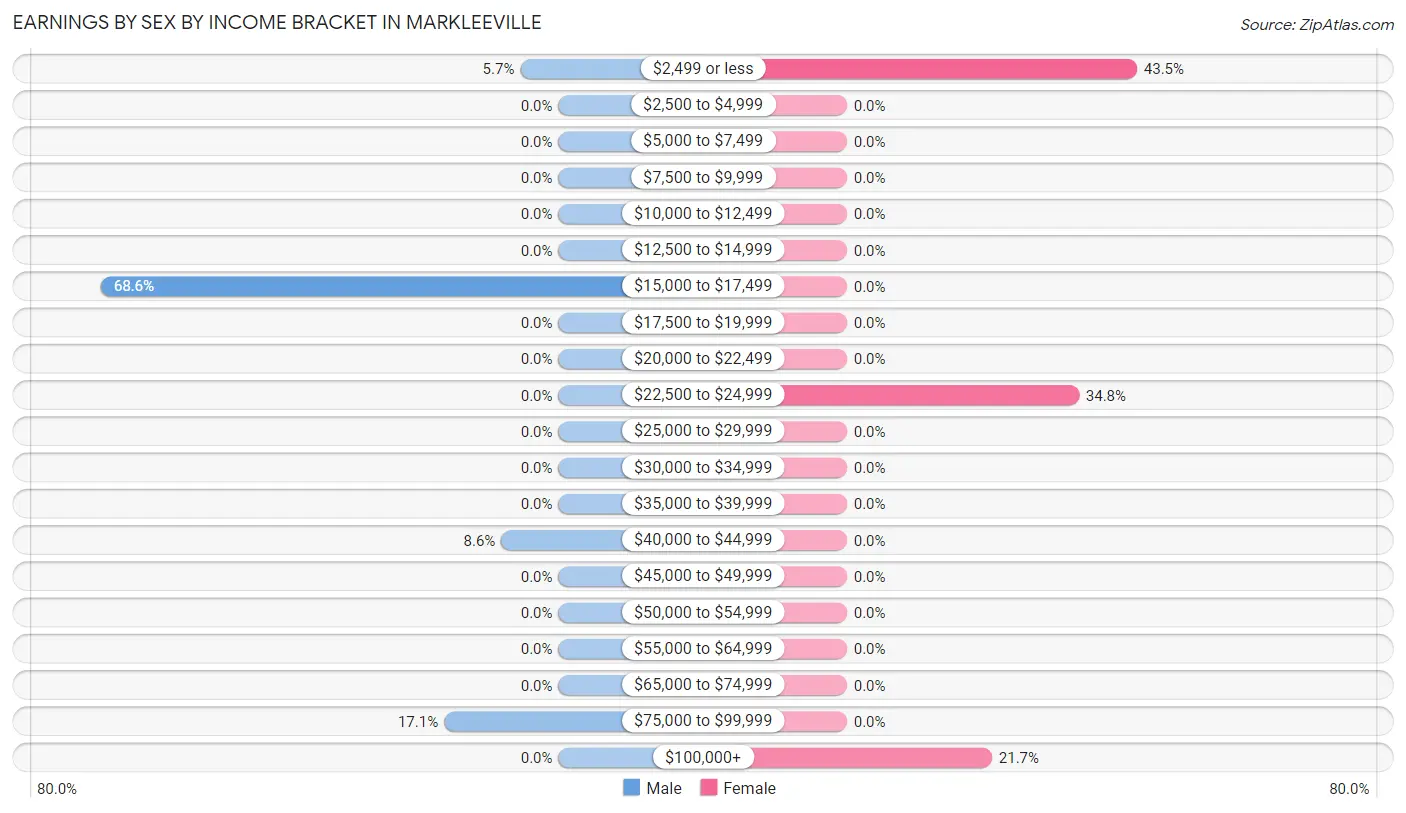
Earnings by Sex by Income Bracket in Markleeville
The most common earnings brackets in Markleeville are $15,000 to $17,499 for men (24 | 68.6%) and $2,499 or less for women (10 | 43.5%).
| Income | Male | Female |
| $2,499 or less | 2 (5.7%) | 10 (43.5%) |
| $2,500 to $4,999 | 0 (0.0%) | 0 (0.0%) |
| $5,000 to $7,499 | 0 (0.0%) | 0 (0.0%) |
| $7,500 to $9,999 | 0 (0.0%) | 0 (0.0%) |
| $10,000 to $12,499 | 0 (0.0%) | 0 (0.0%) |
| $12,500 to $14,999 | 0 (0.0%) | 0 (0.0%) |
| $15,000 to $17,499 | 24 (68.6%) | 0 (0.0%) |
| $17,500 to $19,999 | 0 (0.0%) | 0 (0.0%) |
| $20,000 to $22,499 | 0 (0.0%) | 0 (0.0%) |
| $22,500 to $24,999 | 0 (0.0%) | 8 (34.8%) |
| $25,000 to $29,999 | 0 (0.0%) | 0 (0.0%) |
| $30,000 to $34,999 | 0 (0.0%) | 0 (0.0%) |
| $35,000 to $39,999 | 0 (0.0%) | 0 (0.0%) |
| $40,000 to $44,999 | 3 (8.6%) | 0 (0.0%) |
| $45,000 to $49,999 | 0 (0.0%) | 0 (0.0%) |
| $50,000 to $54,999 | 0 (0.0%) | 0 (0.0%) |
| $55,000 to $64,999 | 0 (0.0%) | 0 (0.0%) |
| $65,000 to $74,999 | 0 (0.0%) | 0 (0.0%) |
| $75,000 to $99,999 | 6 (17.1%) | 0 (0.0%) |
| $100,000+ | 0 (0.0%) | 5 (21.7%) |
| Total | 35 (100.0%) | 23 (100.0%) |
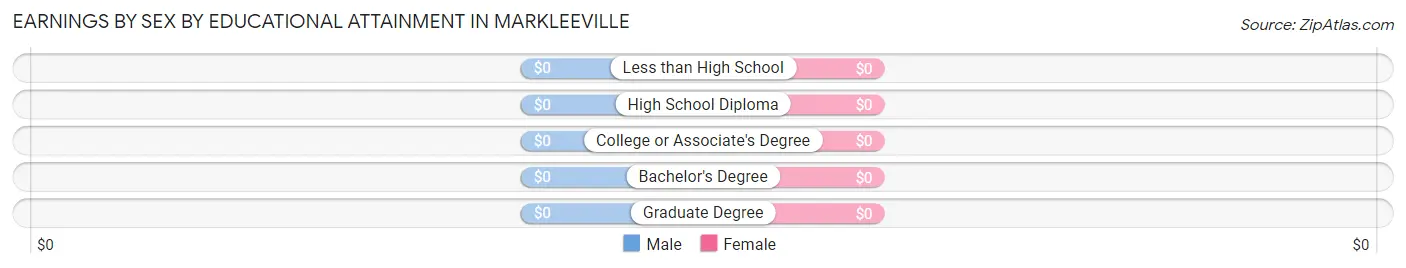
Earnings by Sex by Educational Attainment in Markleeville
| Educational Attainment | Male Income | Female Income |
| Less than High School | - | - |
| High School Diploma | - | - |
| College or Associate's Degree | - | - |
| Bachelor's Degree | - | - |
| Graduate Degree | - | - |
| Total | $16,615 | $0 |
Family Income in Markleeville
Family Income Brackets in Markleeville
According to the Markleeville family income data, there are 13 families falling into the $100,000 to $149,999 income range, which is the most common income bracket and makes up 24.5% of all families.
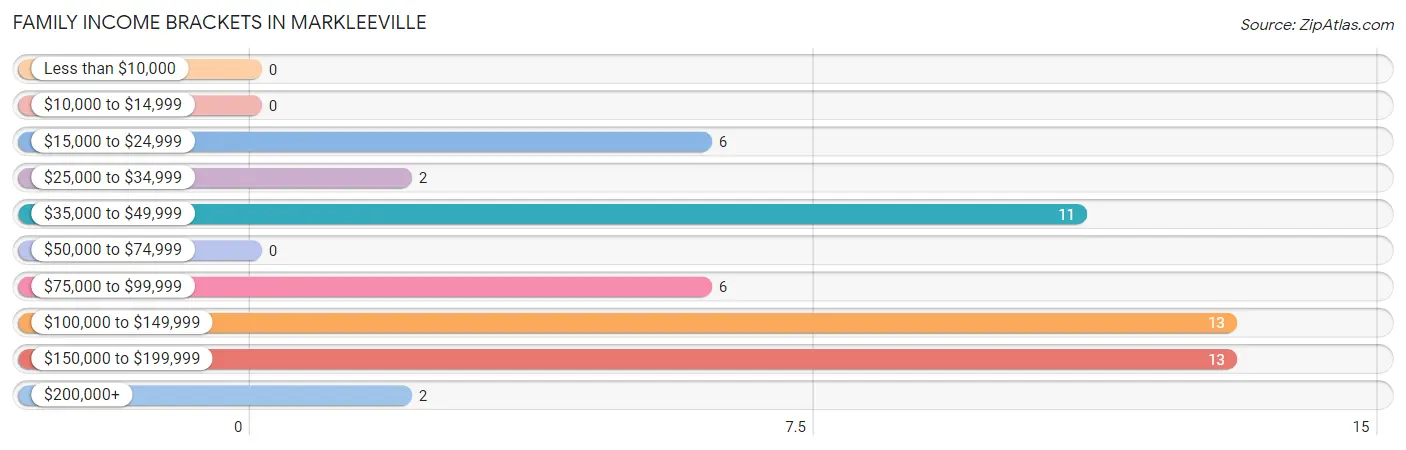
| Income Bracket | # Families | % Families |
| Less than $10,000 | 0 | 0.0% |
| $10,000 to $14,999 | 0 | 0.0% |
| $15,000 to $24,999 | 6 | 11.3% |
| $25,000 to $34,999 | 2 | 3.8% |
| $35,000 to $49,999 | 11 | 20.8% |
| $50,000 to $74,999 | 0 | 0.0% |
| $75,000 to $99,999 | 6 | 11.3% |
| $100,000 to $149,999 | 13 | 24.5% |
| $150,000 to $199,999 | 13 | 24.5% |
| $200,000+ | 2 | 3.8% |
Family Income by Famaliy Size in Markleeville
2-person families (47 | 88.7%) account for the highest median family income in Markleeville with $113,625 per family, while 2-person families (47 | 88.7%) have the highest median income of $56,812 per family member.
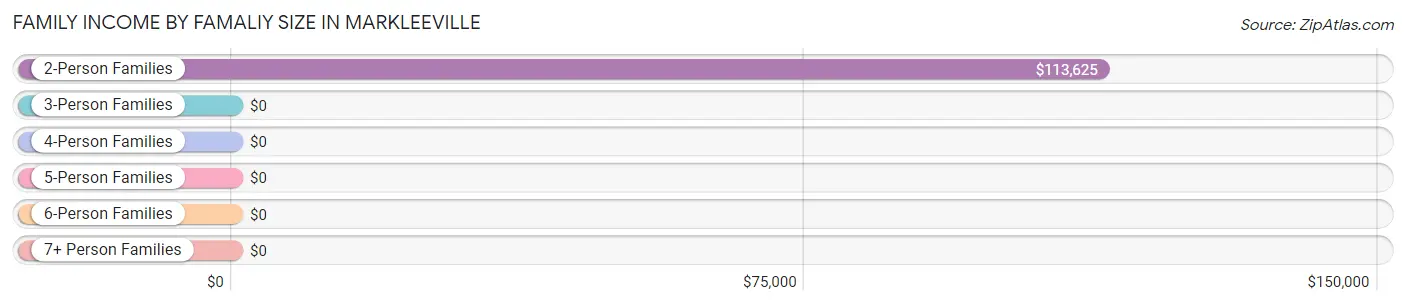
| Income Bracket | # Families | Median Income |
| 2-Person Families | 47 (88.7%) | $113,625 |
| 3-Person Families | 0 (0.0%) | $0 |
| 4-Person Families | 6 (11.3%) | $0 |
| 5-Person Families | 0 (0.0%) | $0 |
| 6-Person Families | 0 (0.0%) | $0 |
| 7+ Person Families | 0 (0.0%) | $0 |
| Total | 53 (100.0%) | $112,875 |
Family Income by Number of Earners in Markleeville
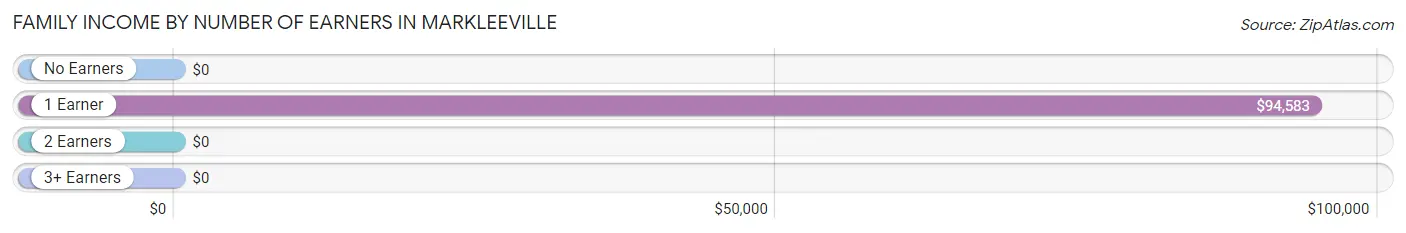
| Number of Earners | # Families | Median Income |
| No Earners | 25 (47.2%) | $0 |
| 1 Earner | 26 (49.1%) | $94,583 |
| 2 Earners | 2 (3.8%) | $0 |
| 3+ Earners | 0 (0.0%) | $0 |
| Total | 53 (100.0%) | $112,875 |
Household Income in Markleeville
Household Income Brackets in Markleeville
With 14 households falling in the category, the $35,000 to $49,999 income range is the most frequent in Markleeville, accounting for 21.9% of all households.
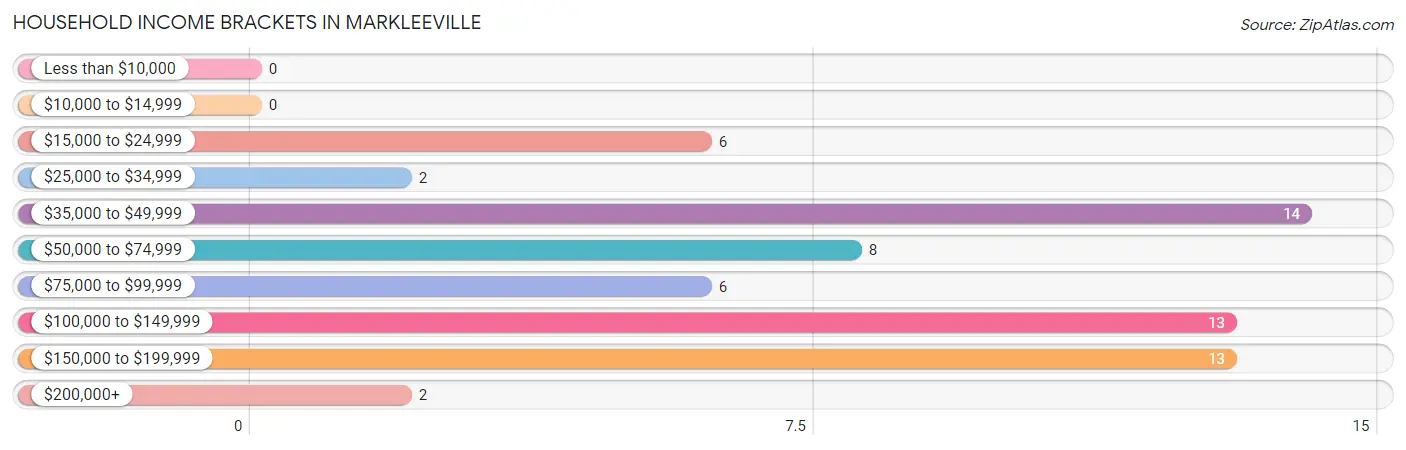
| Income Bracket | # Households | % Households |
| Less than $10,000 | 0 | 0.0% |
| $10,000 to $14,999 | 0 | 0.0% |
| $15,000 to $24,999 | 6 | 9.4% |
| $25,000 to $34,999 | 2 | 3.1% |
| $35,000 to $49,999 | 14 | 21.9% |
| $50,000 to $74,999 | 8 | 12.5% |
| $75,000 to $99,999 | 6 | 9.4% |
| $100,000 to $149,999 | 13 | 20.3% |
| $150,000 to $199,999 | 13 | 20.3% |
| $200,000+ | 2 | 3.1% |
Household Income by Householder Age in Markleeville
The median household income in Markleeville is $93,333, with the highest median household income of $113,750 found in the 65+ years age bracket for the primary householder. A total of 42 households (65.6%) fall into this category.
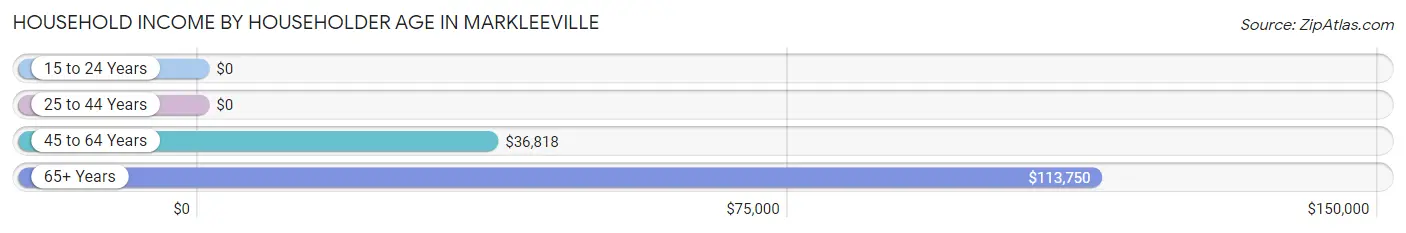
| Income Bracket | # Households | Median Income |
| 15 to 24 Years | 0 (0.0%) | $0 |
| 25 to 44 Years | 6 (9.4%) | $0 |
| 45 to 64 Years | 16 (25.0%) | $36,818 |
| 65+ Years | 42 (65.6%) | $113,750 |
| Total | 64 (100.0%) | $93,333 |
Poverty in Markleeville
Income Below Poverty by Sex and Age in Markleeville
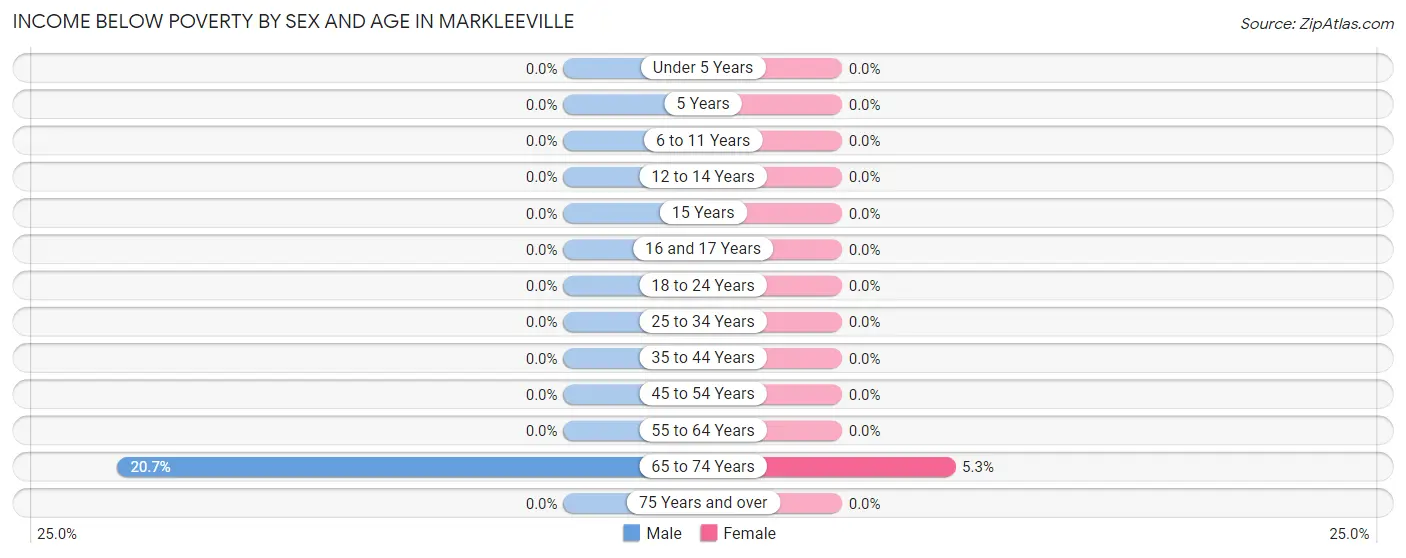
With 6.7% poverty level for males and 2.7% for females among the residents of Markleeville, 65 to 74 year old males and 65 to 74 year old females are the most vulnerable to poverty, with 6 males (20.7%) and 2 females (5.3%) in their respective age groups living below the poverty level.
| Age Bracket | Male | Female |
| Under 5 Years | 0 (0.0%) | 0 (0.0%) |
| 5 Years | 0 (0.0%) | 0 (0.0%) |
| 6 to 11 Years | 0 (0.0%) | 0 (0.0%) |
| 12 to 14 Years | 0 (0.0%) | 0 (0.0%) |
| 15 Years | 0 (0.0%) | 0 (0.0%) |
| 16 and 17 Years | 0 (0.0%) | 0 (0.0%) |
| 18 to 24 Years | 0 (0.0%) | 0 (0.0%) |
| 25 to 34 Years | 0 (0.0%) | 0 (0.0%) |
| 35 to 44 Years | 0 (0.0%) | 0 (0.0%) |
| 45 to 54 Years | 0 (0.0%) | 0 (0.0%) |
| 55 to 64 Years | 0 (0.0%) | 0 (0.0%) |
| 65 to 74 Years | 6 (20.7%) | 2 (5.3%) |
| 75 Years and over | 0 (0.0%) | 0 (0.0%) |
| Total | 6 (6.7%) | 2 (2.7%) |
Income Above Poverty by Sex and Age in Markleeville
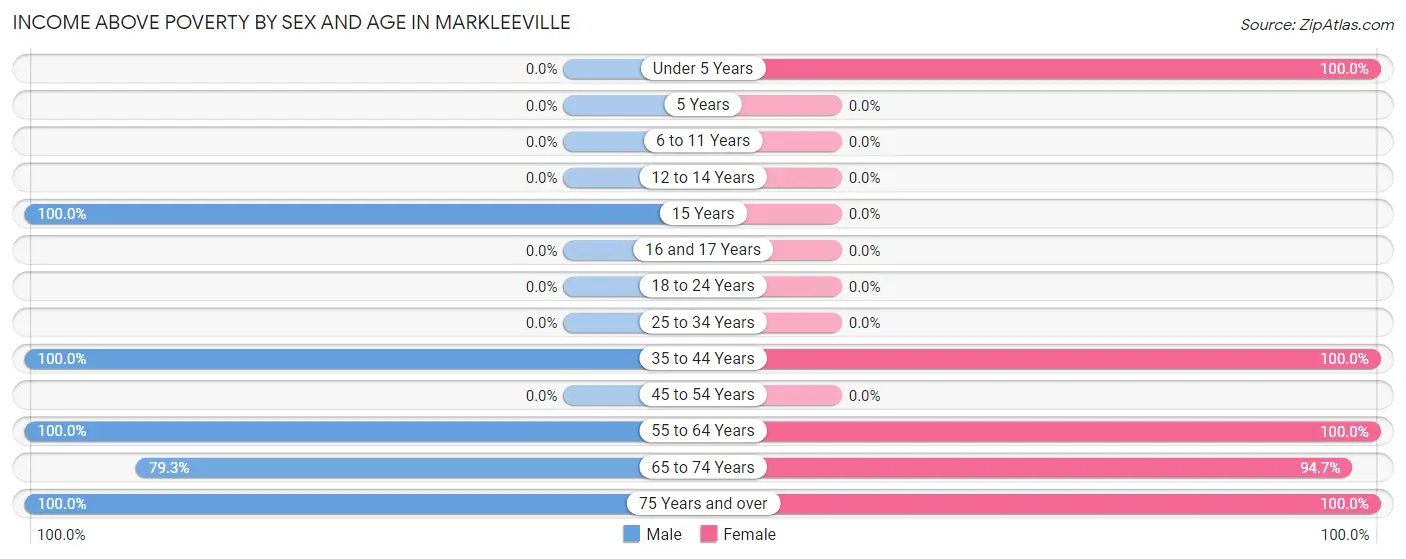
According to the poverty statistics in Markleeville, males aged 15 years and females aged under 5 years are the age groups that are most secure financially, with 100.0% of males and 100.0% of females in these age groups living above the poverty line.
| Age Bracket | Male | Female |
| Under 5 Years | 0 (0.0%) | 14 (100.0%) |
| 5 Years | 0 (0.0%) | 0 (0.0%) |
| 6 to 11 Years | 0 (0.0%) | 0 (0.0%) |
| 12 to 14 Years | 0 (0.0%) | 0 (0.0%) |
| 15 Years | 15 (100.0%) | 0 (0.0%) |
| 16 and 17 Years | 0 (0.0%) | 0 (0.0%) |
| 18 to 24 Years | 0 (0.0%) | 0 (0.0%) |
| 25 to 34 Years | 0 (0.0%) | 0 (0.0%) |
| 35 to 44 Years | 6 (100.0%) | 8 (100.0%) |
| 45 to 54 Years | 0 (0.0%) | 0 (0.0%) |
| 55 to 64 Years | 34 (100.0%) | 12 (100.0%) |
| 65 to 74 Years | 23 (79.3%) | 36 (94.7%) |
| 75 Years and over | 5 (100.0%) | 2 (100.0%) |
| Total | 83 (93.3%) | 72 (97.3%) |
Income Below Poverty Among Married-Couple Families in Markleeville
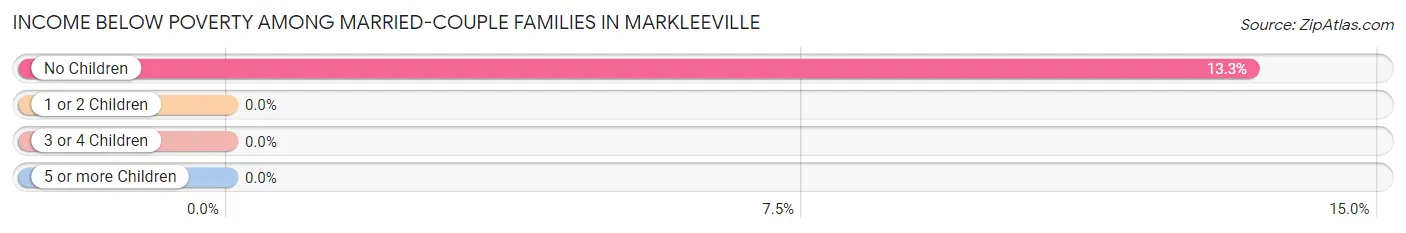
The poverty statistics for married-couple families in Markleeville show that 11.8% or 6 of the total 51 families live below the poverty line. Families with no children have the highest poverty rate of 13.3%, comprising of 6 families. On the other hand, families with 1 or 2 children have the lowest poverty rate of 0.0%, which includes 0 families.
| Children | Above Poverty | Below Poverty |
| No Children | 39 (86.7%) | 6 (13.3%) |
| 1 or 2 Children | 6 (100.0%) | 0 (0.0%) |
| 3 or 4 Children | 0 (0.0%) | 0 (0.0%) |
| 5 or more Children | 0 (0.0%) | 0 (0.0%) |
| Total | 45 (88.2%) | 6 (11.8%) |
Income Below Poverty Among Single-Parent Households in Markleeville
| Children | Single Father | Single Mother |
| No Children | 0 (0.0%) | 0 (0.0%) |
| 1 or 2 Children | 0 (0.0%) | 0 (0.0%) |
| 3 or 4 Children | 0 (0.0%) | 0 (0.0%) |
| 5 or more Children | 0 (0.0%) | 0 (0.0%) |
| Total | 0 (0.0%) | 0 (0.0%) |
Income Below Poverty Among Married-Couple vs Single-Parent Households in Markleeville
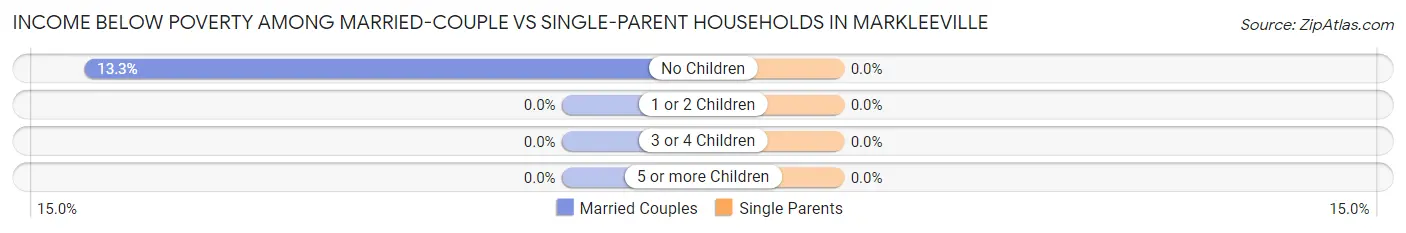
| Children | Married-Couple Families | Single-Parent Households |
| No Children | 6 (13.3%) | 0 (0.0%) |
| 1 or 2 Children | 0 (0.0%) | 0 (0.0%) |
| 3 or 4 Children | 0 (0.0%) | 0 (0.0%) |
| 5 or more Children | 0 (0.0%) | 0 (0.0%) |
| Total | 6 (11.8%) | 0 (0.0%) |
Race in Markleeville
The most populous races in Markleeville are White / Caucasian (163 | 100.0%), and Hispanic or Latino (37 | 22.7%).
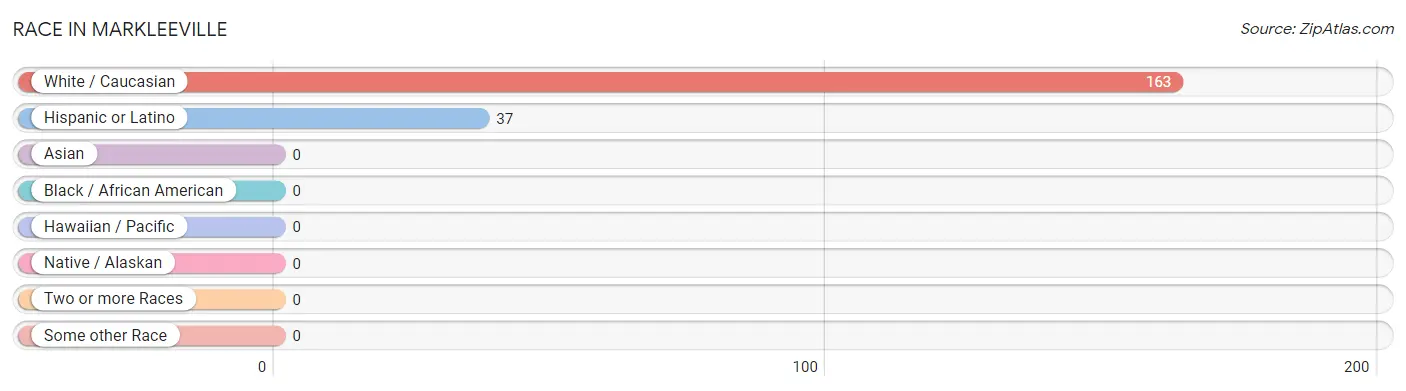
| Race | # Population | % Population |
| Asian | 0 | 0.0% |
| Black / African American | 0 | 0.0% |
| Hawaiian / Pacific | 0 | 0.0% |
| Hispanic or Latino | 37 | 22.7% |
| Native / Alaskan | 0 | 0.0% |
| White / Caucasian | 163 | 100.0% |
| Two or more Races | 0 | 0.0% |
| Some other Race | 0 | 0.0% |
| Total | 163 | 100.0% |
Ancestry in Markleeville
The most populous ancestries reported in Markleeville are Irish (47 | 28.8%), Mexican (37 | 22.7%), Italian (29 | 17.8%), European (23 | 14.1%), and British (16 | 9.8%), together accounting for 93.2% of all Markleeville residents.
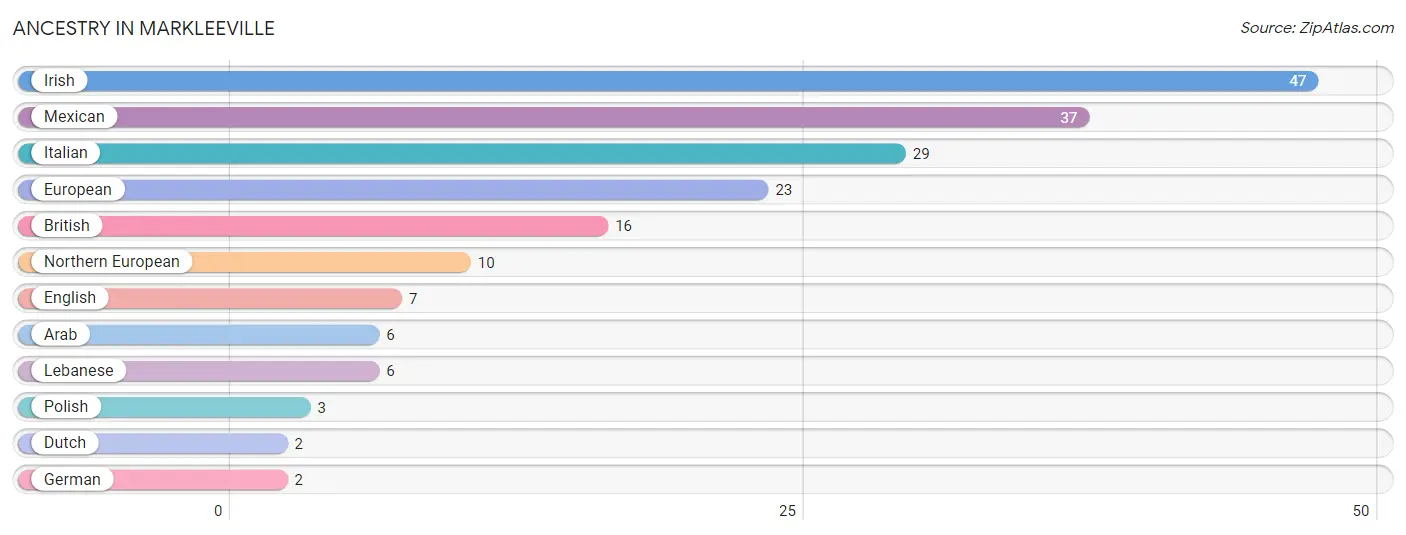
| Ancestry | # Population | % Population |
| Arab | 6 | 3.7% |
| British | 16 | 9.8% |
| Dutch | 2 | 1.2% |
| English | 7 | 4.3% |
| European | 23 | 14.1% |
| German | 2 | 1.2% |
| Irish | 47 | 28.8% |
| Italian | 29 | 17.8% |
| Lebanese | 6 | 3.7% |
| Mexican | 37 | 22.7% |
| Northern European | 10 | 6.1% |
| Polish | 3 | 1.8% | View All 12 Rows |
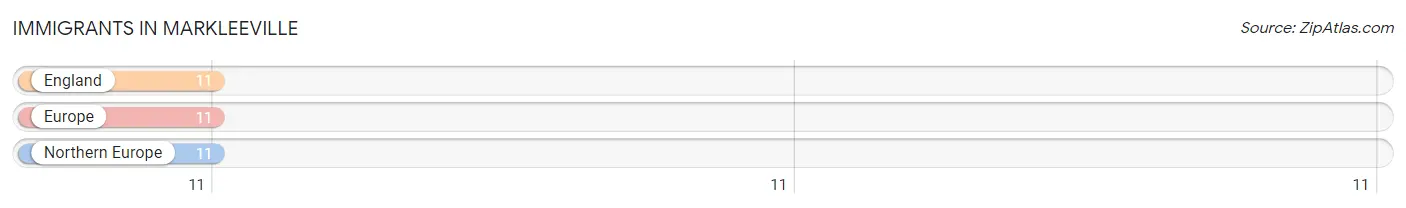
Immigrants in Markleeville
The most numerous immigrant groups reported in Markleeville came from England (11 | 6.8%), Europe (11 | 6.8%), and Northern Europe (11 | 6.8%), together accounting for 20.3% of all Markleeville residents.
| Immigration Origin | # Population | % Population |
| England | 11 | 6.8% |
| Europe | 11 | 6.8% |
| Northern Europe | 11 | 6.8% | View All 3 Rows |
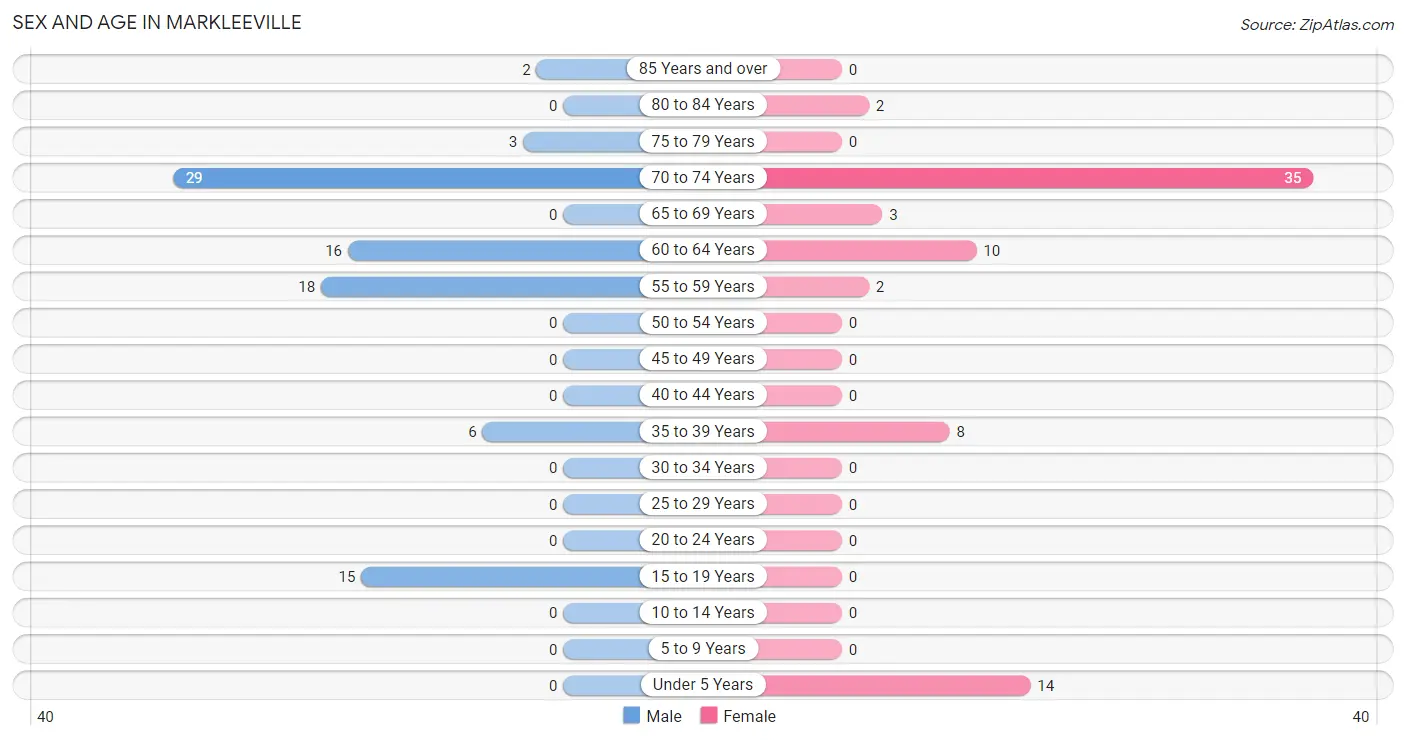
Sex and Age in Markleeville
Sex and Age in Markleeville
The most populous age groups in Markleeville are 70 to 74 Years (29 | 32.6%) for men and 70 to 74 Years (35 | 47.3%) for women.
| Age Bracket | Male | Female |
| Under 5 Years | 0 (0.0%) | 14 (18.9%) |
| 5 to 9 Years | 0 (0.0%) | 0 (0.0%) |
| 10 to 14 Years | 0 (0.0%) | 0 (0.0%) |
| 15 to 19 Years | 15 (16.9%) | 0 (0.0%) |
| 20 to 24 Years | 0 (0.0%) | 0 (0.0%) |
| 25 to 29 Years | 0 (0.0%) | 0 (0.0%) |
| 30 to 34 Years | 0 (0.0%) | 0 (0.0%) |
| 35 to 39 Years | 6 (6.7%) | 8 (10.8%) |
| 40 to 44 Years | 0 (0.0%) | 0 (0.0%) |
| 45 to 49 Years | 0 (0.0%) | 0 (0.0%) |
| 50 to 54 Years | 0 (0.0%) | 0 (0.0%) |
| 55 to 59 Years | 18 (20.2%) | 2 (2.7%) |
| 60 to 64 Years | 16 (18.0%) | 10 (13.5%) |
| 65 to 69 Years | 0 (0.0%) | 3 (4.1%) |
| 70 to 74 Years | 29 (32.6%) | 35 (47.3%) |
| 75 to 79 Years | 3 (3.4%) | 0 (0.0%) |
| 80 to 84 Years | 0 (0.0%) | 2 (2.7%) |
| 85 Years and over | 2 (2.2%) | 0 (0.0%) |
| Total | 89 (100.0%) | 74 (100.0%) |
Families and Households in Markleeville
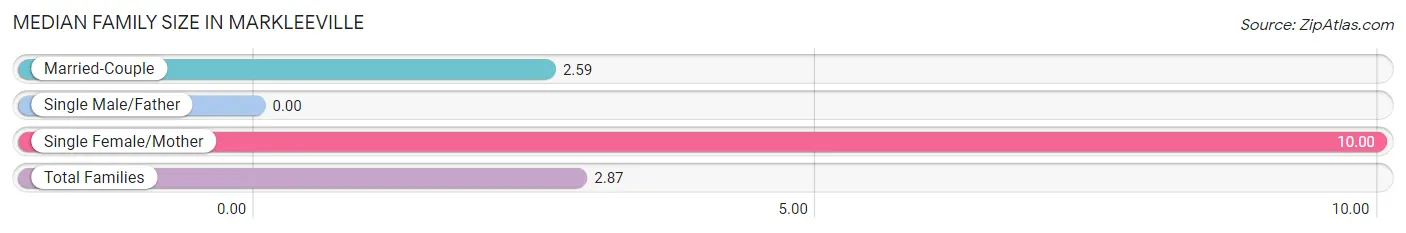
Median Family Size in Markleeville
| Family Type | # Families | Family Size |
| Married-Couple | 51 (96.2%) | 2.59 |
| Single Male/Father | 0 (0.0%) | - |
| Single Female/Mother | 2 (3.8%) | 10.00 |
| Total Families | 53 (100.0%) | 2.87 |
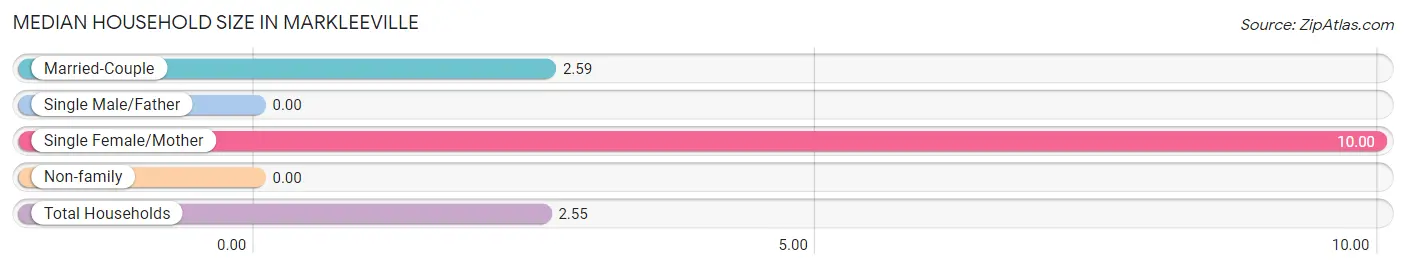
Median Household Size in Markleeville
| Household Type | # Households | Household Size |
| Married-Couple | 51 (79.7%) | 2.59 |
| Single Male/Father | 0 (0.0%) | - |
| Single Female/Mother | 2 (3.1%) | 10.00 |
| Non-family | 11 (17.2%) | - |
| Total Households | 64 (100.0%) | 2.55 |
Household Size by Marriage Status in Markleeville
Out of a total of 64 households in Markleeville, 53 (82.8%) are family households, while 11 (17.2%) are nonfamily households. The most numerous type of family households are 2-person households, comprising 47, and the most common type of nonfamily households are 1-person households, comprising 11.
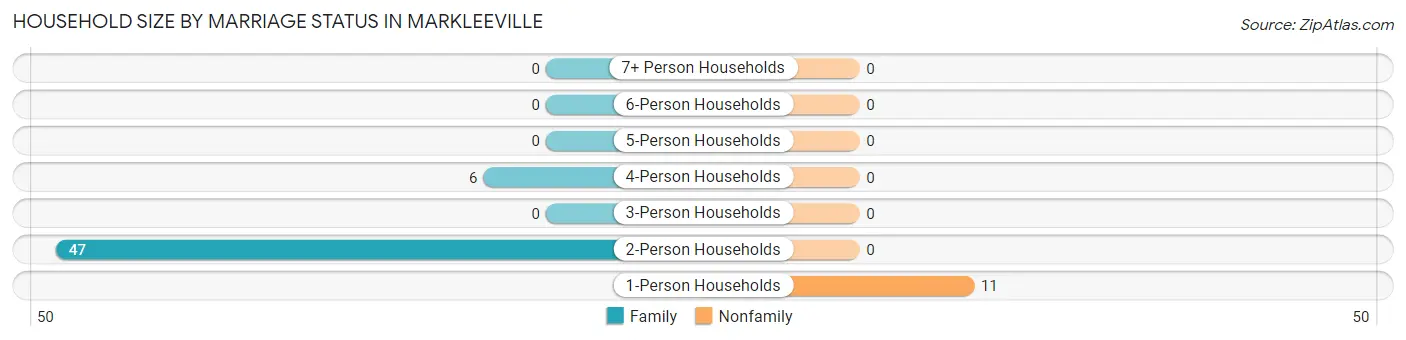
| Household Size | Family Households | Nonfamily Households |
| 1-Person Households | - | 11 (17.2%) |
| 2-Person Households | 47 (73.4%) | 0 (0.0%) |
| 3-Person Households | 0 (0.0%) | 0 (0.0%) |
| 4-Person Households | 6 (9.4%) | 0 (0.0%) |
| 5-Person Households | 0 (0.0%) | 0 (0.0%) |
| 6-Person Households | 0 (0.0%) | 0 (0.0%) |
| 7+ Person Households | 0 (0.0%) | 0 (0.0%) |
| Total | 53 (82.8%) | 11 (17.2%) |
Female Fertility in Markleeville
Fertility by Age in Markleeville
| Age Bracket | Women with Births | Births / 1,000 Women |
| 15 to 19 years | 0 (0.0%) | 0.0 |
| 20 to 34 years | 0 (0.0%) | 0.0 |
| 35 to 50 years | 0 (0.0%) | 0.0 |
| Total | 0 (0.0%) | 0.0 |
Fertility by Age by Marriage Status in Markleeville
| Age Bracket | Married | Unmarried |
| 15 to 19 years | 0 (0.0%) | 0 (0.0%) |
| 20 to 34 years | 0 (0.0%) | 0 (0.0%) |
| 35 to 50 years | 0 (0.0%) | 0 (0.0%) |
| Total | 0 (0.0%) | 0 (0.0%) |
Fertility by Education in Markleeville
| Educational Attainment | Women with Births | Births / 1,000 Women |
| Less than High School | 0 (0.0%) | 0.0 |
| High School Diploma | 0 (0.0%) | 0.0 |
| College or Associate's Degree | 0 (0.0%) | 0.0 |
| Bachelor's Degree | 0 (0.0%) | 0.0 |
| Graduate Degree | 0 (0.0%) | 0.0 |
| Total | 0 (0.0%) | 0.0 |
Fertility by Education by Marriage Status in Markleeville
| Educational Attainment | Married | Unmarried |
| Less than High School | 0 (0.0%) | 0 (0.0%) |
| High School Diploma | 0 (0.0%) | 0 (0.0%) |
| College or Associate's Degree | 0 (0.0%) | 0 (0.0%) |
| Bachelor's Degree | 0 (0.0%) | 0 (0.0%) |
| Graduate Degree | 0 (0.0%) | 0 (0.0%) |
| Total | 0 (0.0%) | 0 (0.0%) |
Employment Characteristics in Markleeville
Employment by Class of Employer in Markleeville
Among the 48 employed individuals in Markleeville, private company employees (33 | 68.8%), self-employed (not incorporated) (13 | 27.1%), and state government employees (2 | 4.2%) make up the most common classes of employment.
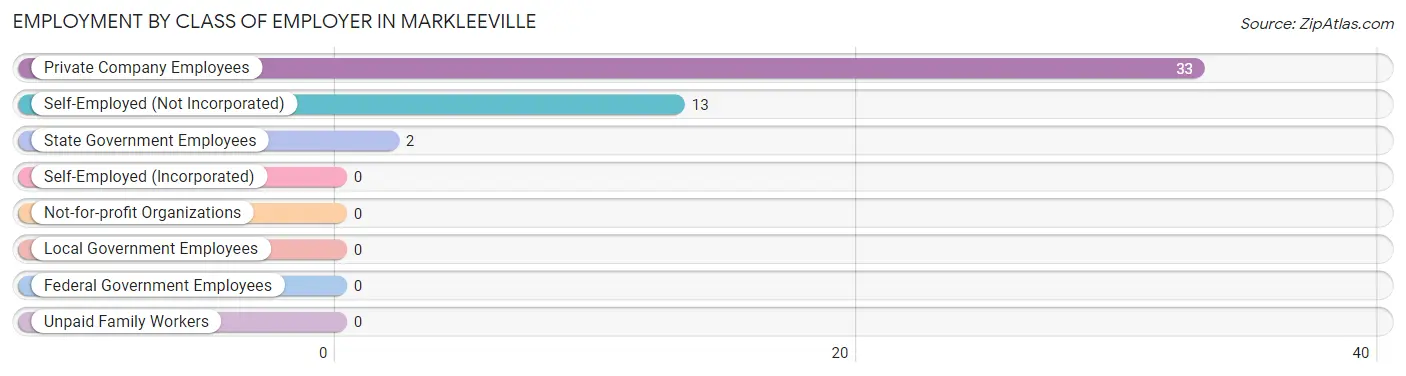
| Employer Class | # Employees | % Employees |
| Private Company Employees | 33 | 68.8% |
| Self-Employed (Incorporated) | 0 | 0.0% |
| Self-Employed (Not Incorporated) | 13 | 27.1% |
| Not-for-profit Organizations | 0 | 0.0% |
| Local Government Employees | 0 | 0.0% |
| State Government Employees | 2 | 4.2% |
| Federal Government Employees | 0 | 0.0% |
| Unpaid Family Workers | 0 | 0.0% |
| Total | 48 | 100.0% |
Employment Status by Age in Markleeville
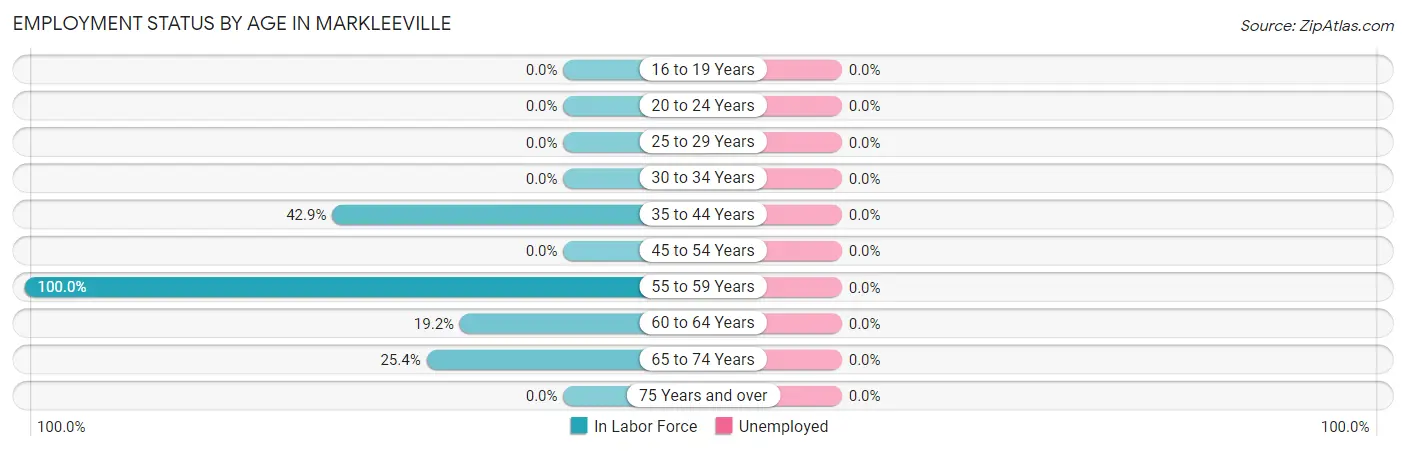
| Age Bracket | In Labor Force | Unemployed |
| 16 to 19 Years | 0 (0.0%) | 0 (0.0%) |
| 20 to 24 Years | 0 (0.0%) | 0 (0.0%) |
| 25 to 29 Years | 0 (0.0%) | 0 (0.0%) |
| 30 to 34 Years | 0 (0.0%) | 0 (0.0%) |
| 35 to 44 Years | 6 (42.9%) | 0 (0.0%) |
| 45 to 54 Years | 0 (0.0%) | 0 (0.0%) |
| 55 to 59 Years | 20 (100.0%) | 0 (0.0%) |
| 60 to 64 Years | 5 (19.2%) | 0 (0.0%) |
| 65 to 74 Years | 17 (25.4%) | 0 (0.0%) |
| 75 Years and over | 0 (0.0%) | 0 (0.0%) |
| Total | 48 (35.8%) | 0 (0.0%) |
Employment Status by Educational Attainment in Markleeville
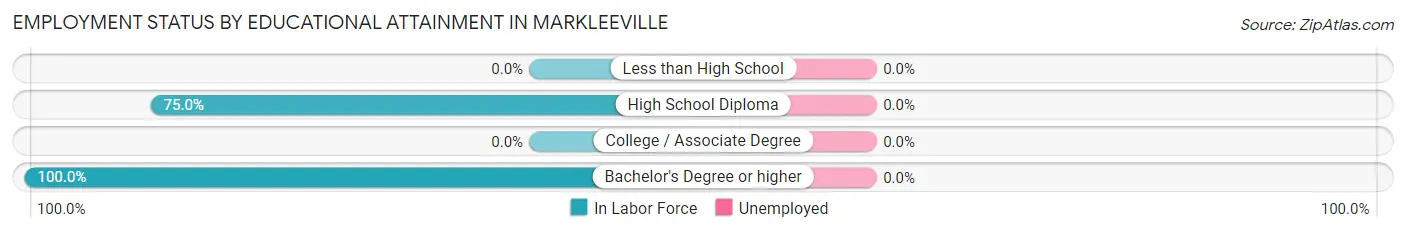
| Educational Attainment | In Labor Force | Unemployed |
| Less than High School | 0 (0.0%) | 0 (0.0%) |
| High School Diploma | 24 (75.0%) | 0 (0.0%) |
| College / Associate Degree | 0 (0.0%) | 0 (0.0%) |
| Bachelor's Degree or higher | 7 (100.0%) | 0 (0.0%) |
| Total | 31 (51.7%) | 0 (0.0%) |
Employment Occupations by Sex in Markleeville
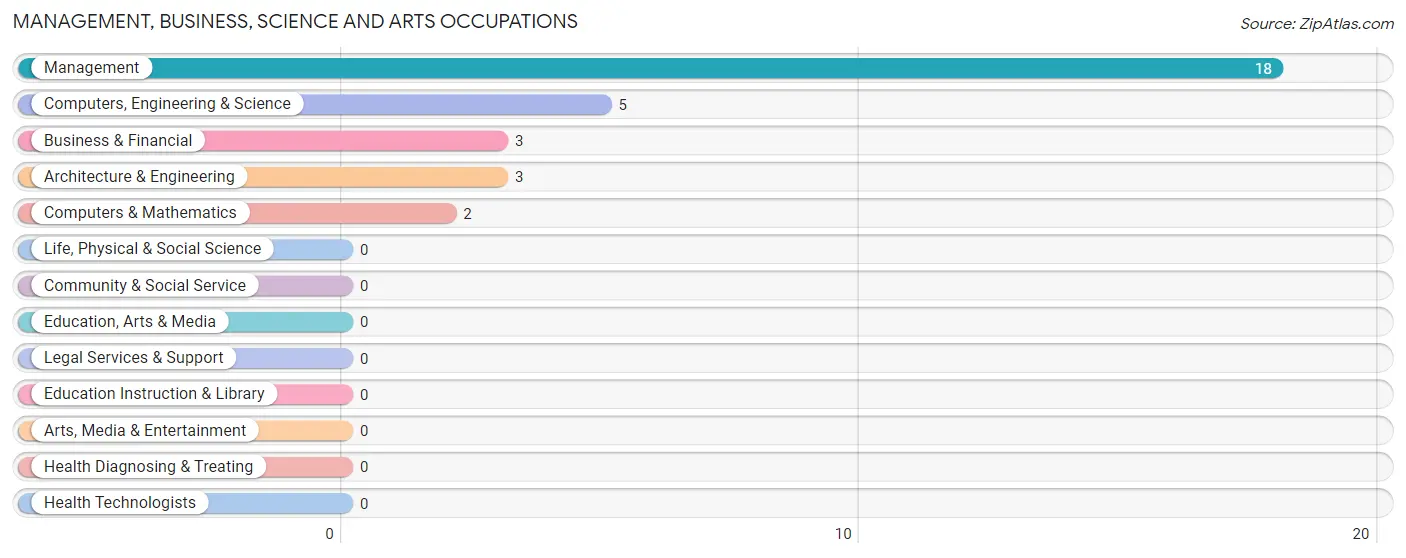
Management, Business, Science and Arts Occupations
The most common Management, Business, Science and Arts occupations in Markleeville are Management (18 | 37.5%), Computers, Engineering & Science (5 | 10.4%), Business & Financial (3 | 6.2%), Architecture & Engineering (3 | 6.2%), and Computers & Mathematics (2 | 4.2%).
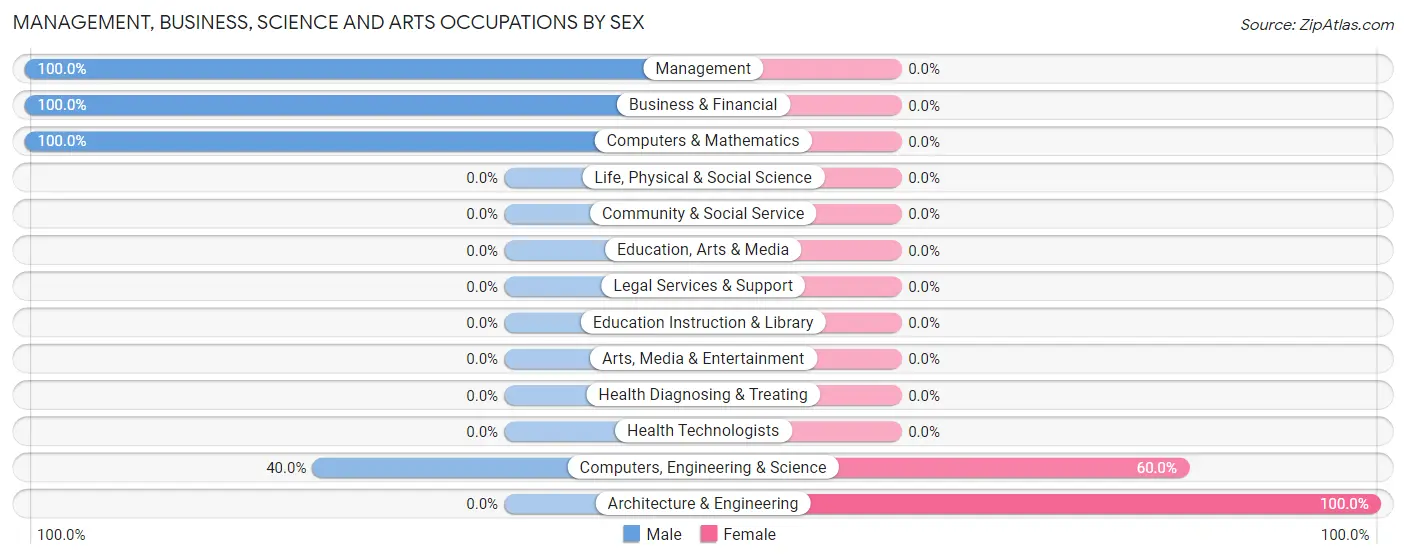
Management, Business, Science and Arts Occupations by Sex
Within the Management, Business, Science and Arts occupations in Markleeville, the most male-oriented occupations are Management (100.0%), Business & Financial (100.0%), and Computers & Mathematics (100.0%), while the most female-oriented occupations are Architecture & Engineering (100.0%), and Computers, Engineering & Science (60.0%).
| Occupation | Male | Female |
| Management | 18 (100.0%) | 0 (0.0%) |
| Business & Financial | 3 (100.0%) | 0 (0.0%) |
| Computers, Engineering & Science | 2 (40.0%) | 3 (60.0%) |
| Computers & Mathematics | 2 (100.0%) | 0 (0.0%) |
| Architecture & Engineering | 0 (0.0%) | 3 (100.0%) |
| Life, Physical & Social Science | 0 (0.0%) | 0 (0.0%) |
| Community & Social Service | 0 (0.0%) | 0 (0.0%) |
| Education, Arts & Media | 0 (0.0%) | 0 (0.0%) |
| Legal Services & Support | 0 (0.0%) | 0 (0.0%) |
| Education Instruction & Library | 0 (0.0%) | 0 (0.0%) |
| Arts, Media & Entertainment | 0 (0.0%) | 0 (0.0%) |
| Health Diagnosing & Treating | 0 (0.0%) | 0 (0.0%) |
| Health Technologists | 0 (0.0%) | 0 (0.0%) |
| Total (Category) | 23 (88.5%) | 3 (11.5%) |
| Total (Overall) | 35 (72.9%) | 13 (27.1%) |
Services Occupations
Services Occupations by Sex
| Occupation | Male | Female |
| Healthcare Support | 0 (0.0%) | 0 (0.0%) |
| Security & Protection | 0 (0.0%) | 0 (0.0%) |
| Firefighting & Prevention | 0 (0.0%) | 0 (0.0%) |
| Law Enforcement | 0 (0.0%) | 0 (0.0%) |
| Food Preparation & Serving | 0 (0.0%) | 0 (0.0%) |
| Cleaning & Maintenance | 0 (0.0%) | 0 (0.0%) |
| Personal Care & Service | 0 (0.0%) | 0 (0.0%) |
| Total (Category) | 0 (0.0%) | 0 (0.0%) |
| Total (Overall) | 35 (72.9%) | 13 (27.1%) |
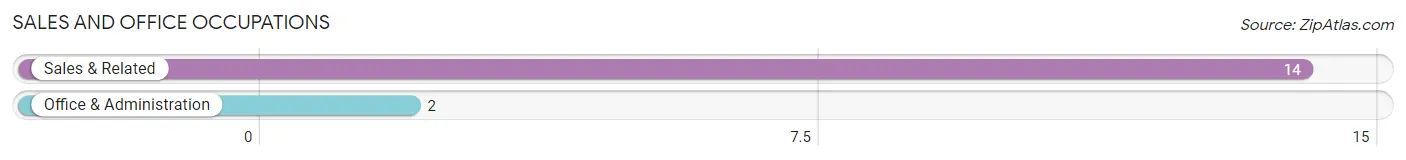
Sales and Office Occupations
The most common Sales and Office occupations in Markleeville are Sales & Related (14 | 29.2%), and Office & Administration (2 | 4.2%).
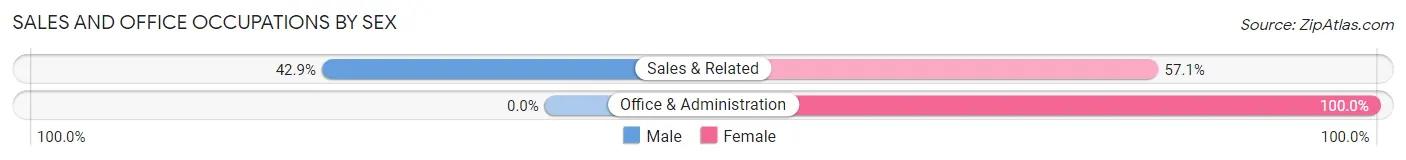
Sales and Office Occupations by Sex
| Occupation | Male | Female |
| Sales & Related | 6 (42.9%) | 8 (57.1%) |
| Office & Administration | 0 (0.0%) | 2 (100.0%) |
| Total (Category) | 6 (37.5%) | 10 (62.5%) |
| Total (Overall) | 35 (72.9%) | 13 (27.1%) |
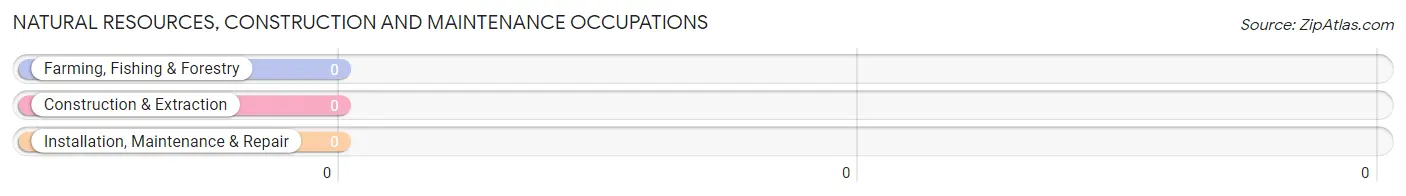
Natural Resources, Construction and Maintenance Occupations
Natural Resources, Construction and Maintenance Occupations by Sex
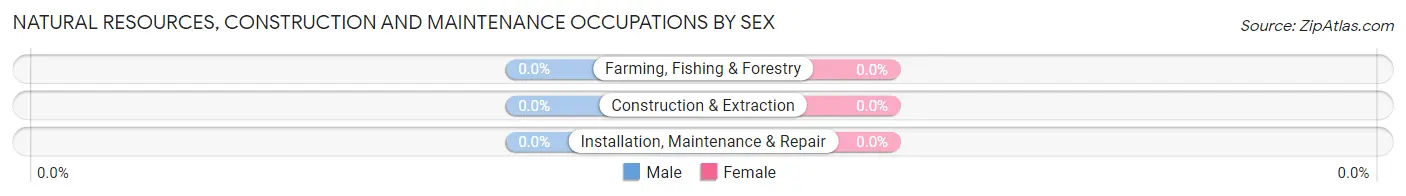
| Occupation | Male | Female |
| Farming, Fishing & Forestry | 0 (0.0%) | 0 (0.0%) |
| Construction & Extraction | 0 (0.0%) | 0 (0.0%) |
| Installation, Maintenance & Repair | 0 (0.0%) | 0 (0.0%) |
| Total (Category) | 0 (0.0%) | 0 (0.0%) |
| Total (Overall) | 35 (72.9%) | 13 (27.1%) |
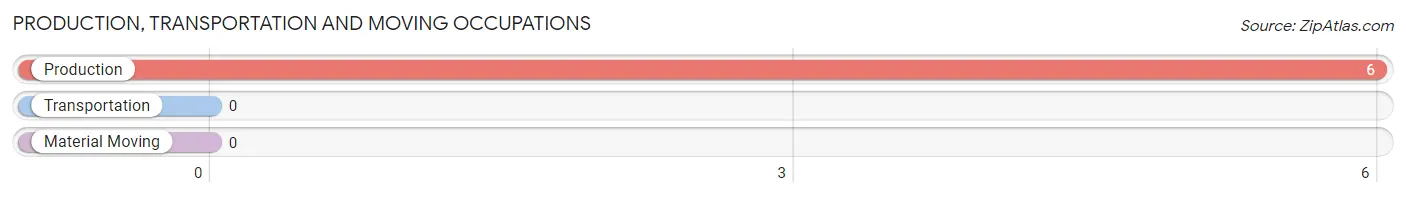
Production, Transportation and Moving Occupations
The most common Production, Transportation and Moving occupations in Markleeville are , and Production (6 | 12.5%).
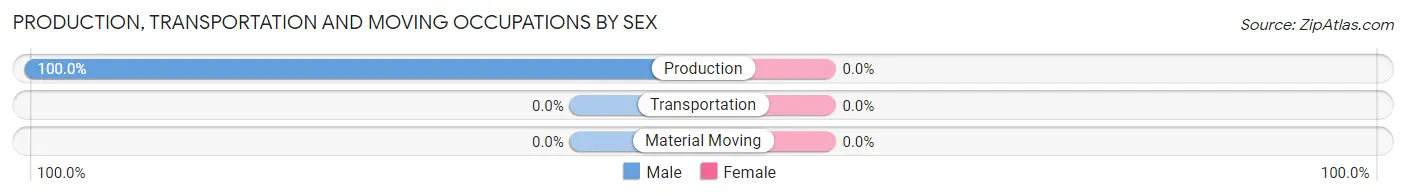
Production, Transportation and Moving Occupations by Sex
| Occupation | Male | Female |
| Production | 6 (100.0%) | 0 (0.0%) |
| Transportation | 0 (0.0%) | 0 (0.0%) |
| Material Moving | 0 (0.0%) | 0 (0.0%) |
| Total (Category) | 6 (100.0%) | 0 (0.0%) |
| Total (Overall) | 35 (72.9%) | 13 (27.1%) |
Employment Industries by Sex in Markleeville
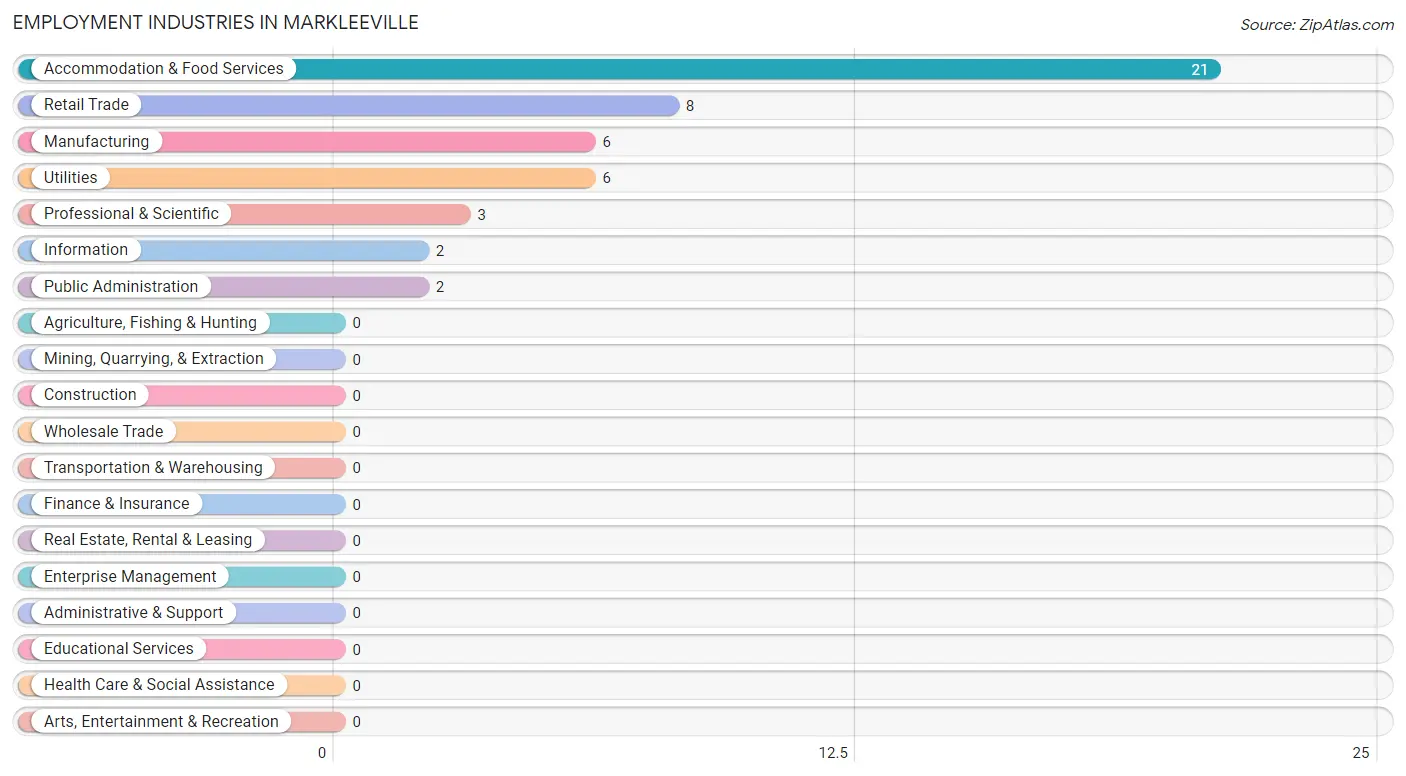
Employment Industries in Markleeville
The major employment industries in Markleeville include Accommodation & Food Services (21 | 43.8%), Retail Trade (8 | 16.7%), Manufacturing (6 | 12.5%), Utilities (6 | 12.5%), and Professional & Scientific (3 | 6.2%).
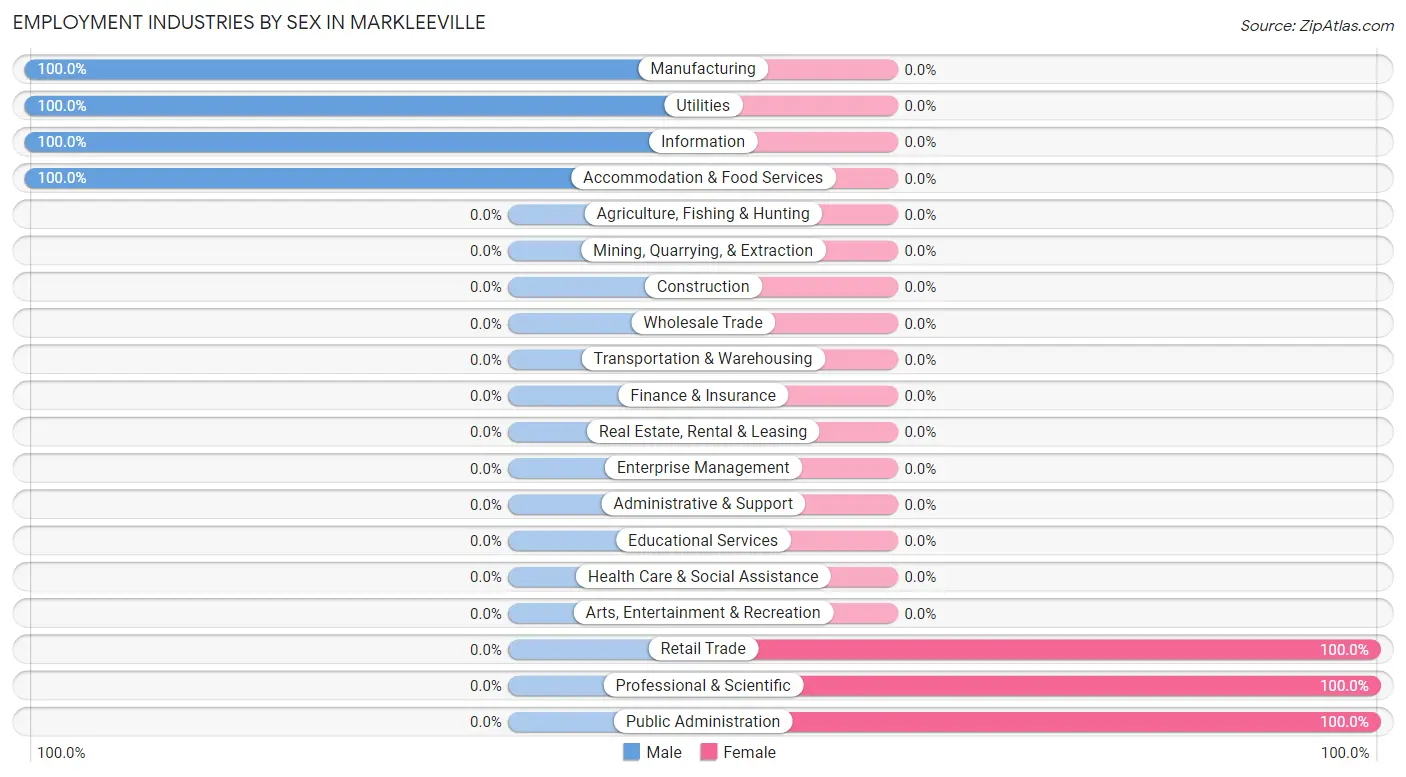
Employment Industries by Sex in Markleeville
The Markleeville industries that see more men than women are Manufacturing (100.0%), Utilities (100.0%), and Information (100.0%), whereas the industries that tend to have a higher number of women are Retail Trade (100.0%), Professional & Scientific (100.0%), and Public Administration (100.0%).
| Industry | Male | Female |
| Agriculture, Fishing & Hunting | 0 (0.0%) | 0 (0.0%) |
| Mining, Quarrying, & Extraction | 0 (0.0%) | 0 (0.0%) |
| Construction | 0 (0.0%) | 0 (0.0%) |
| Manufacturing | 6 (100.0%) | 0 (0.0%) |
| Wholesale Trade | 0 (0.0%) | 0 (0.0%) |
| Retail Trade | 0 (0.0%) | 8 (100.0%) |
| Transportation & Warehousing | 0 (0.0%) | 0 (0.0%) |
| Utilities | 6 (100.0%) | 0 (0.0%) |
| Information | 2 (100.0%) | 0 (0.0%) |
| Finance & Insurance | 0 (0.0%) | 0 (0.0%) |
| Real Estate, Rental & Leasing | 0 (0.0%) | 0 (0.0%) |
| Professional & Scientific | 0 (0.0%) | 3 (100.0%) |
| Enterprise Management | 0 (0.0%) | 0 (0.0%) |
| Administrative & Support | 0 (0.0%) | 0 (0.0%) |
| Educational Services | 0 (0.0%) | 0 (0.0%) |
| Health Care & Social Assistance | 0 (0.0%) | 0 (0.0%) |
| Arts, Entertainment & Recreation | 0 (0.0%) | 0 (0.0%) |
| Accommodation & Food Services | 21 (100.0%) | 0 (0.0%) |
| Public Administration | 0 (0.0%) | 2 (100.0%) |
| Total | 35 (72.9%) | 13 (27.1%) |
Education in Markleeville
School Enrollment in Markleeville
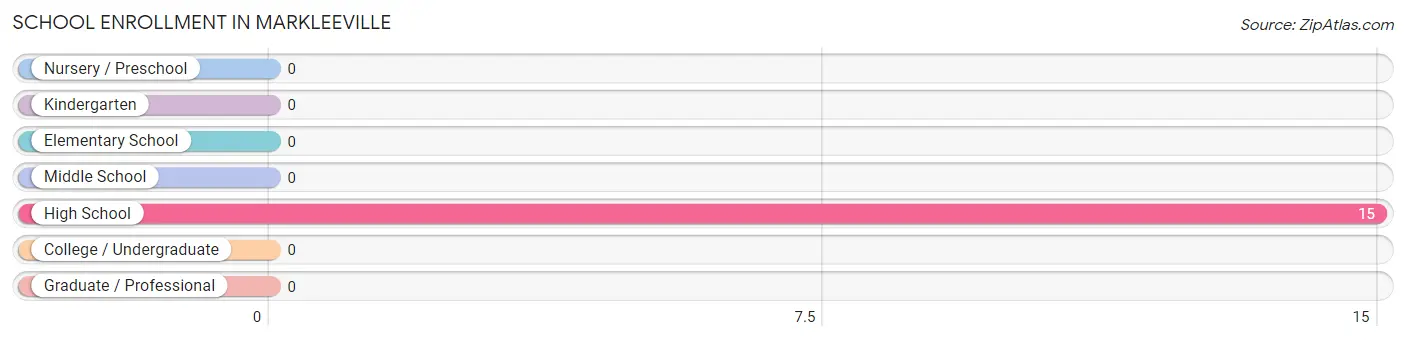
| School Level | # Students | % Students |
| Nursery / Preschool | 0 | 0.0% |
| Kindergarten | 0 | 0.0% |
| Elementary School | 0 | 0.0% |
| Middle School | 0 | 0.0% |
| High School | 15 | 100.0% |
| College / Undergraduate | 0 | 0.0% |
| Graduate / Professional | 0 | 0.0% |
| Total | 15 | 100.0% |
School Enrollment by Age by Funding Source in Markleeville
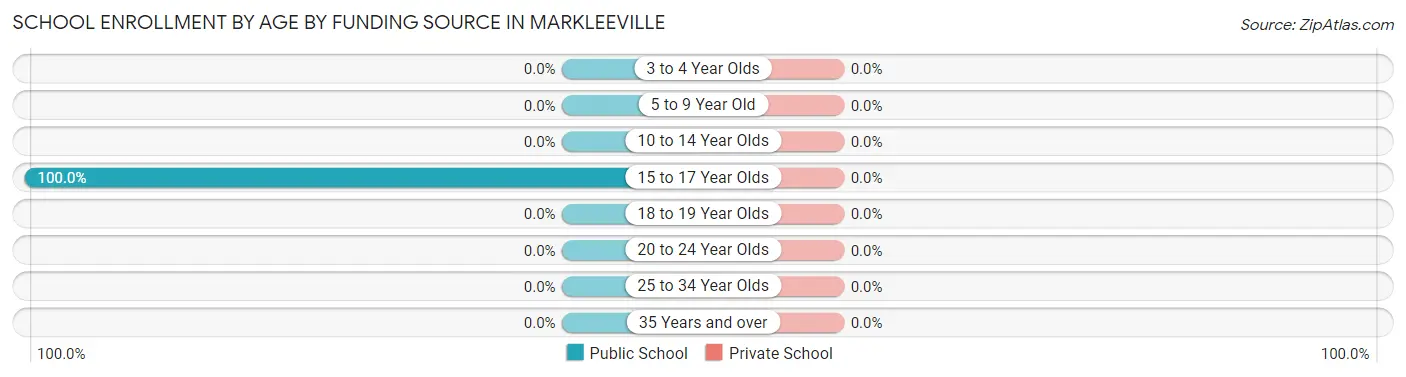
| Age Bracket | Public School | Private School |
| 3 to 4 Year Olds | 0 (0.0%) | 0 (0.0%) |
| 5 to 9 Year Old | 0 (0.0%) | 0 (0.0%) |
| 10 to 14 Year Olds | 0 (0.0%) | 0 (0.0%) |
| 15 to 17 Year Olds | 15 (100.0%) | 0 (0.0%) |
| 18 to 19 Year Olds | 0 (0.0%) | 0 (0.0%) |
| 20 to 24 Year Olds | 0 (0.0%) | 0 (0.0%) |
| 25 to 34 Year Olds | 0 (0.0%) | 0 (0.0%) |
| 35 Years and over | 0 (0.0%) | 0 (0.0%) |
| Total | 15 (100.0%) | 0 (0.0%) |
Educational Attainment by Field of Study in Markleeville
Bio, nature & agricultural (18 | 31.0%), science & technology (15 | 25.9%), computers & mathematics (10 | 17.2%), visual & performing arts (8 | 13.8%), and business (3 | 5.2%) are the most common fields of study among 58 individuals in Markleeville who have obtained a bachelor's degree or higher.
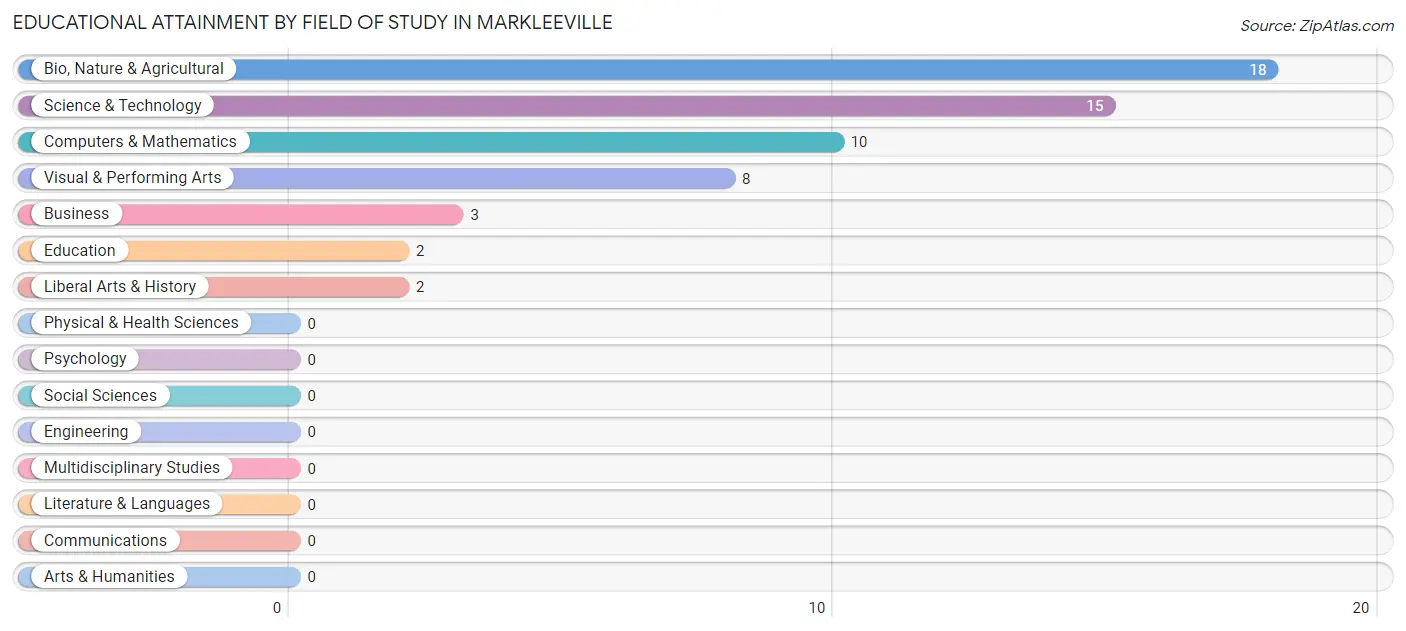
| Field of Study | # Graduates | % Graduates |
| Computers & Mathematics | 10 | 17.2% |
| Bio, Nature & Agricultural | 18 | 31.0% |
| Physical & Health Sciences | 0 | 0.0% |
| Psychology | 0 | 0.0% |
| Social Sciences | 0 | 0.0% |
| Engineering | 0 | 0.0% |
| Multidisciplinary Studies | 0 | 0.0% |
| Science & Technology | 15 | 25.9% |
| Business | 3 | 5.2% |
| Education | 2 | 3.5% |
| Literature & Languages | 0 | 0.0% |
| Liberal Arts & History | 2 | 3.5% |
| Visual & Performing Arts | 8 | 13.8% |
| Communications | 0 | 0.0% |
| Arts & Humanities | 0 | 0.0% |
| Total | 58 | 100.0% |
Transportation & Commute in Markleeville
Vehicle Availability by Sex in Markleeville
The most prevalent vehicle ownership categories in Markleeville are males with 2 vehicles (32, accounting for 91.4%) and females with 2 vehicles (5, making up 246.2%).
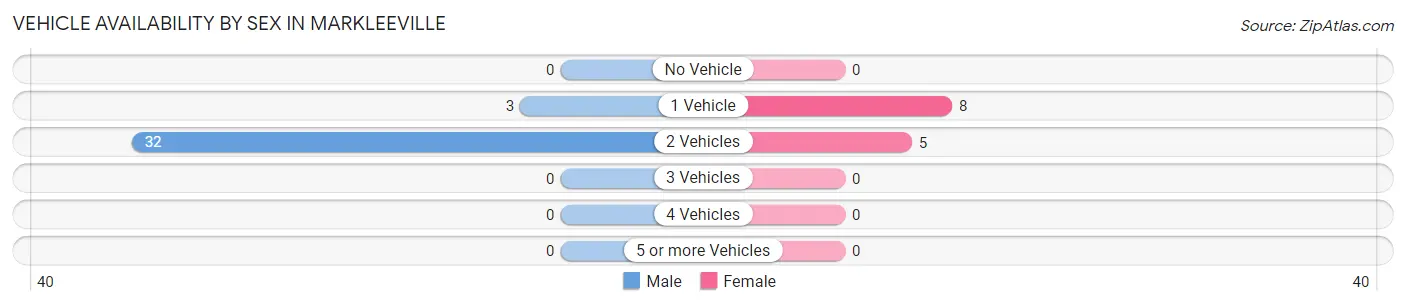
| Vehicles Available | Male | Female |
| No Vehicle | 0 (0.0%) | 0 (0.0%) |
| 1 Vehicle | 3 (8.6%) | 8 (61.5%) |
| 2 Vehicles | 32 (91.4%) | 5 (38.5%) |
| 3 Vehicles | 0 (0.0%) | 0 (0.0%) |
| 4 Vehicles | 0 (0.0%) | 0 (0.0%) |
| 5 or more Vehicles | 0 (0.0%) | 0 (0.0%) |
| Total | 35 (100.0%) | 13 (100.0%) |
Commute Time in Markleeville
The most frequently occuring commute durations in Markleeville are 35 to 39 minutes (24 commuters, 72.7%), 10 to 14 minutes (6 commuters, 18.2%), and 45 to 59 minutes (3 commuters, 9.1%).
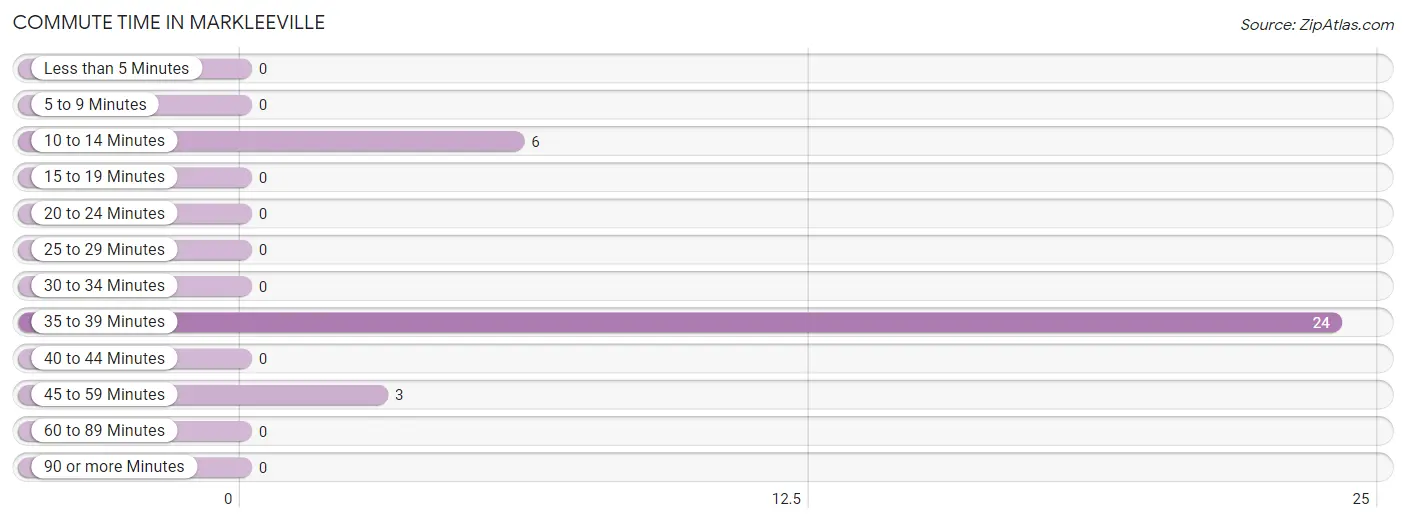
| Commute Time | # Commuters | % Commuters |
| Less than 5 Minutes | 0 | 0.0% |
| 5 to 9 Minutes | 0 | 0.0% |
| 10 to 14 Minutes | 6 | 18.2% |
| 15 to 19 Minutes | 0 | 0.0% |
| 20 to 24 Minutes | 0 | 0.0% |
| 25 to 29 Minutes | 0 | 0.0% |
| 30 to 34 Minutes | 0 | 0.0% |
| 35 to 39 Minutes | 24 | 72.7% |
| 40 to 44 Minutes | 0 | 0.0% |
| 45 to 59 Minutes | 3 | 9.1% |
| 60 to 89 Minutes | 0 | 0.0% |
| 90 or more Minutes | 0 | 0.0% |
Commute Time by Sex in Markleeville
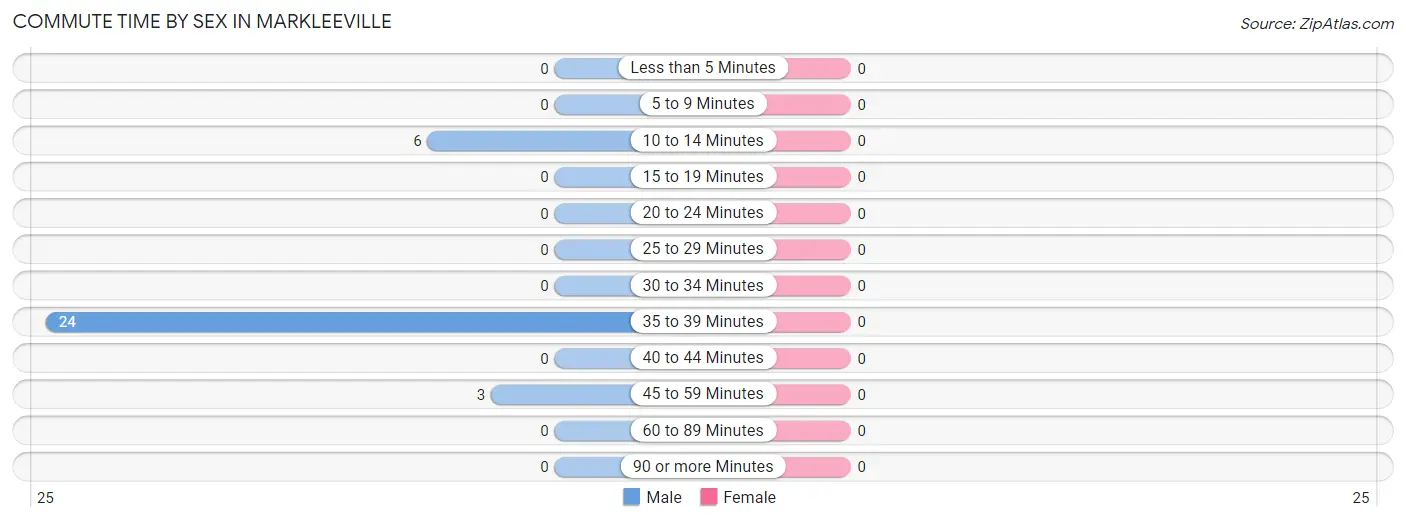
| Commute Time | Male | Female |
| Less than 5 Minutes | 0 (0.0%) | 0 (0.0%) |
| 5 to 9 Minutes | 0 (0.0%) | 0 (0.0%) |
| 10 to 14 Minutes | 6 (18.2%) | 0 (0.0%) |
| 15 to 19 Minutes | 0 (0.0%) | 0 (0.0%) |
| 20 to 24 Minutes | 0 (0.0%) | 0 (0.0%) |
| 25 to 29 Minutes | 0 (0.0%) | 0 (0.0%) |
| 30 to 34 Minutes | 0 (0.0%) | 0 (0.0%) |
| 35 to 39 Minutes | 24 (72.7%) | 0 (0.0%) |
| 40 to 44 Minutes | 0 (0.0%) | 0 (0.0%) |
| 45 to 59 Minutes | 3 (9.1%) | 0 (0.0%) |
| 60 to 89 Minutes | 0 (0.0%) | 0 (0.0%) |
| 90 or more Minutes | 0 (0.0%) | 0 (0.0%) |
Time of Departure to Work by Sex in Markleeville
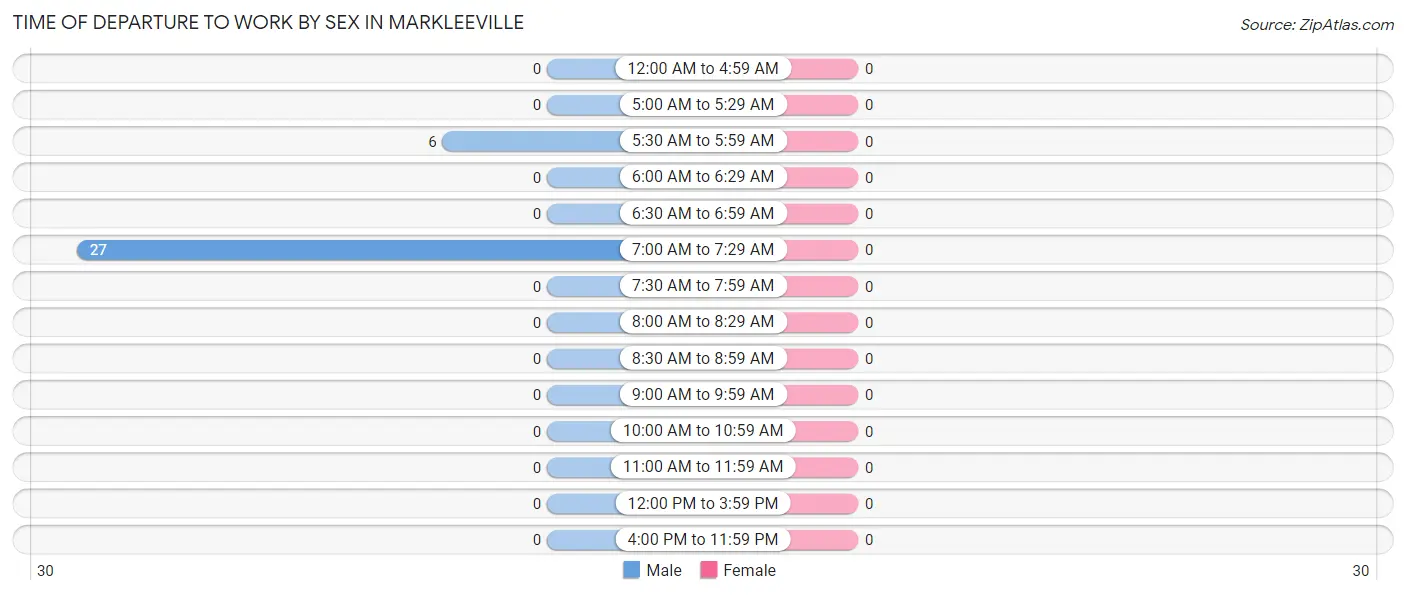
| Time of Departure | Male | Female |
| 12:00 AM to 4:59 AM | 0 (0.0%) | 0 (0.0%) |
| 5:00 AM to 5:29 AM | 0 (0.0%) | 0 (0.0%) |
| 5:30 AM to 5:59 AM | 6 (18.2%) | 0 (0.0%) |
| 6:00 AM to 6:29 AM | 0 (0.0%) | 0 (0.0%) |
| 6:30 AM to 6:59 AM | 0 (0.0%) | 0 (0.0%) |
| 7:00 AM to 7:29 AM | 27 (81.8%) | 0 (0.0%) |
| 7:30 AM to 7:59 AM | 0 (0.0%) | 0 (0.0%) |
| 8:00 AM to 8:29 AM | 0 (0.0%) | 0 (0.0%) |
| 8:30 AM to 8:59 AM | 0 (0.0%) | 0 (0.0%) |
| 9:00 AM to 9:59 AM | 0 (0.0%) | 0 (0.0%) |
| 10:00 AM to 10:59 AM | 0 (0.0%) | 0 (0.0%) |
| 11:00 AM to 11:59 AM | 0 (0.0%) | 0 (0.0%) |
| 12:00 PM to 3:59 PM | 0 (0.0%) | 0 (0.0%) |
| 4:00 PM to 11:59 PM | 0 (0.0%) | 0 (0.0%) |
| Total | 33 (100.0%) | 0 (0.0%) |
Housing Occupancy in Markleeville
Occupancy by Ownership in Markleeville
Of the total 64 dwellings in Markleeville, owner-occupied units account for 58 (90.6%), while renter-occupied units make up 6 (9.4%).
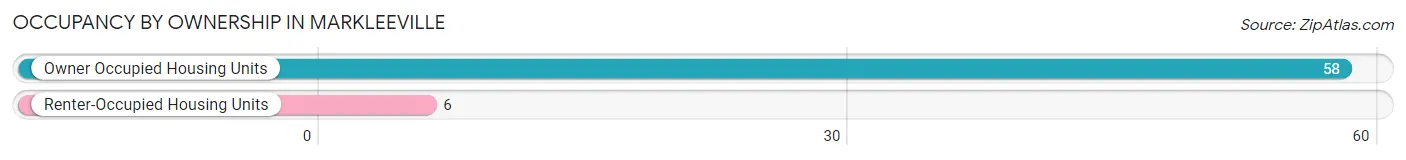
| Occupancy | # Housing Units | % Housing Units |
| Owner Occupied Housing Units | 58 | 90.6% |
| Renter-Occupied Housing Units | 6 | 9.4% |
| Total Occupied Housing Units | 64 | 100.0% |
Occupancy by Household Size in Markleeville
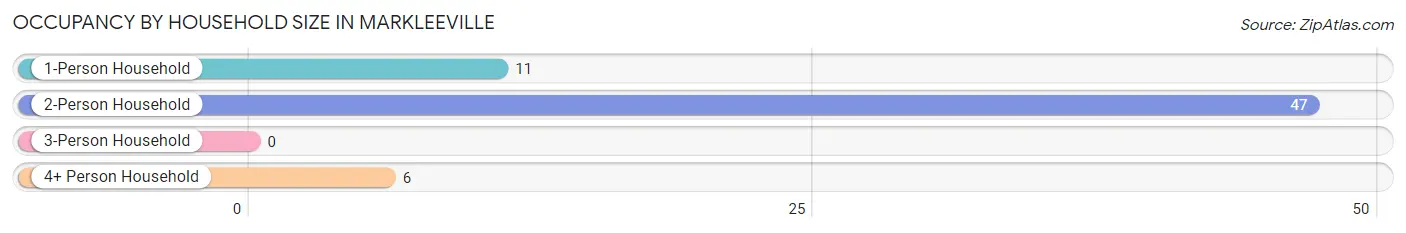
| Household Size | # Housing Units | % Housing Units |
| 1-Person Household | 11 | 17.2% |
| 2-Person Household | 47 | 73.4% |
| 3-Person Household | 0 | 0.0% |
| 4+ Person Household | 6 | 9.4% |
| Total Housing Units | 64 | 100.0% |
Occupancy by Ownership by Household Size in Markleeville
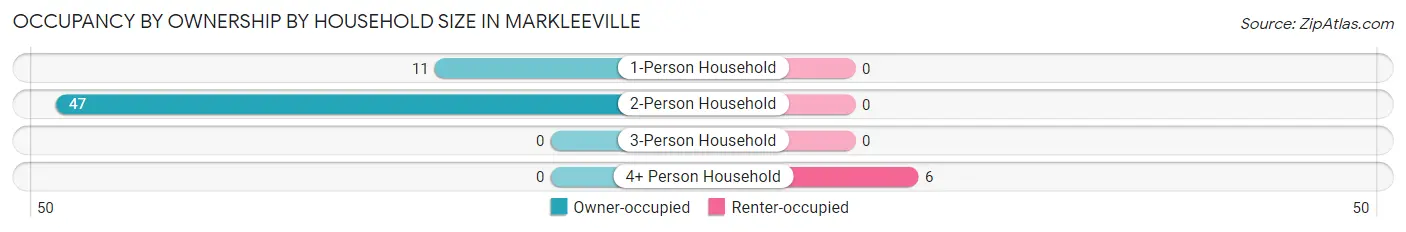
| Household Size | Owner-occupied | Renter-occupied |
| 1-Person Household | 11 (100.0%) | 0 (0.0%) |
| 2-Person Household | 47 (100.0%) | 0 (0.0%) |
| 3-Person Household | 0 (0.0%) | 0 (0.0%) |
| 4+ Person Household | 0 (0.0%) | 6 (100.0%) |
| Total Housing Units | 58 (90.6%) | 6 (9.4%) |
Occupancy by Educational Attainment in Markleeville
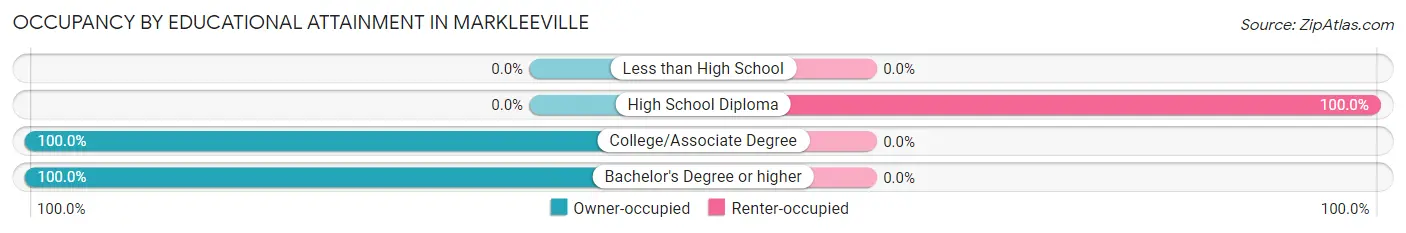
| Household Size | Owner-occupied | Renter-occupied |
| Less than High School | 0 (0.0%) | 0 (0.0%) |
| High School Diploma | 0 (0.0%) | 6 (100.0%) |
| College/Associate Degree | 22 (100.0%) | 0 (0.0%) |
| Bachelor's Degree or higher | 36 (100.0%) | 0 (0.0%) |
Occupancy by Age of Householder in Markleeville
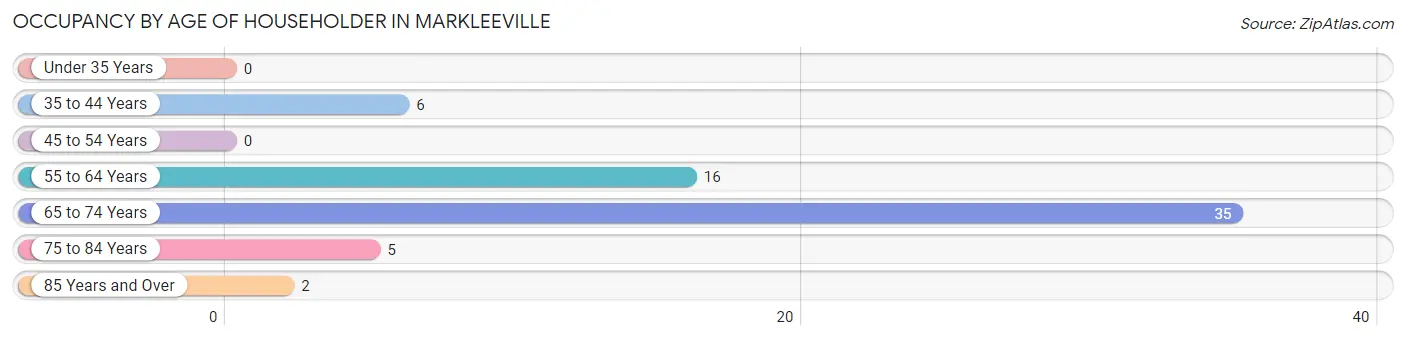
| Age Bracket | # Households | % Households |
| Under 35 Years | 0 | 0.0% |
| 35 to 44 Years | 6 | 9.4% |
| 45 to 54 Years | 0 | 0.0% |
| 55 to 64 Years | 16 | 25.0% |
| 65 to 74 Years | 35 | 54.7% |
| 75 to 84 Years | 5 | 7.8% |
| 85 Years and Over | 2 | 3.1% |
| Total | 64 | 100.0% |
Housing Finances in Markleeville
Median Income by Occupancy in Markleeville
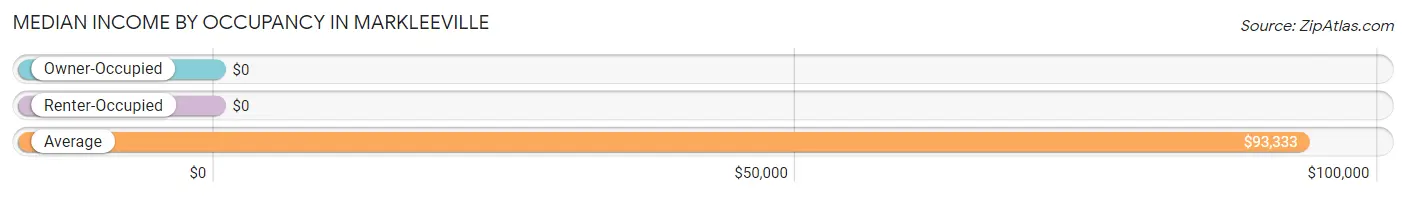
| Occupancy Type | # Households | Median Income |
| Owner-Occupied | 58 (90.6%) | $0 |
| Renter-Occupied | 6 (9.4%) | $0 |
| Average | 64 (100.0%) | $93,333 |
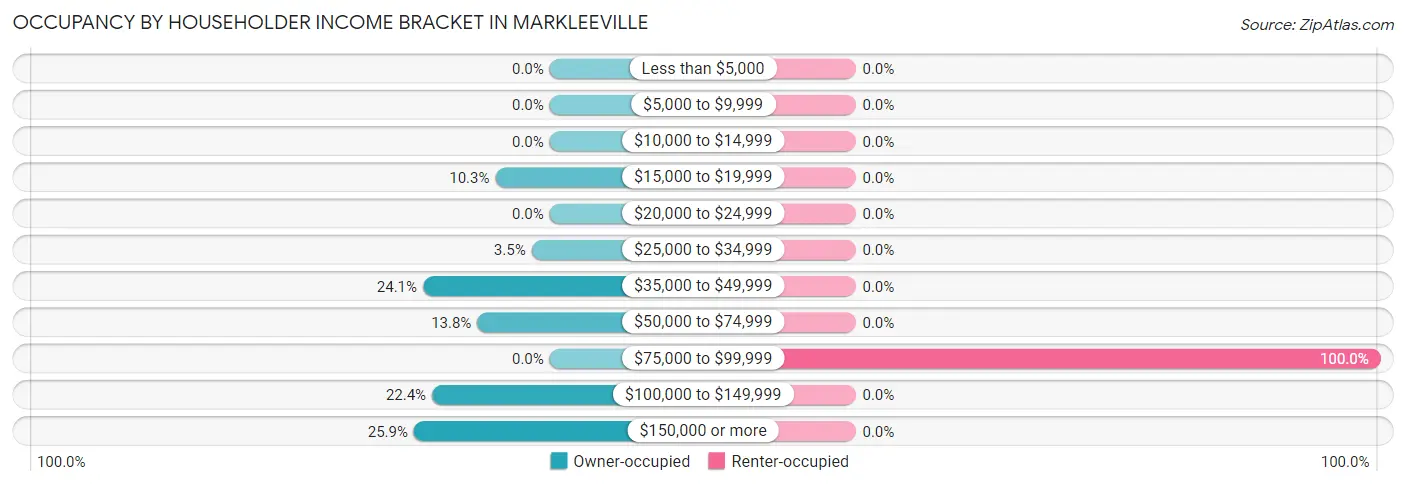
Occupancy by Householder Income Bracket in Markleeville
| Income Bracket | Owner-occupied | Renter-occupied |
| Less than $5,000 | 0 (0.0%) | 0 (0.0%) |
| $5,000 to $9,999 | 0 (0.0%) | 0 (0.0%) |
| $10,000 to $14,999 | 0 (0.0%) | 0 (0.0%) |
| $15,000 to $19,999 | 6 (10.3%) | 0 (0.0%) |
| $20,000 to $24,999 | 0 (0.0%) | 0 (0.0%) |
| $25,000 to $34,999 | 2 (3.5%) | 0 (0.0%) |
| $35,000 to $49,999 | 14 (24.1%) | 0 (0.0%) |
| $50,000 to $74,999 | 8 (13.8%) | 0 (0.0%) |
| $75,000 to $99,999 | 0 (0.0%) | 6 (100.0%) |
| $100,000 to $149,999 | 13 (22.4%) | 0 (0.0%) |
| $150,000 or more | 15 (25.9%) | 0 (0.0%) |
| Total | 58 (100.0%) | 6 (100.0%) |
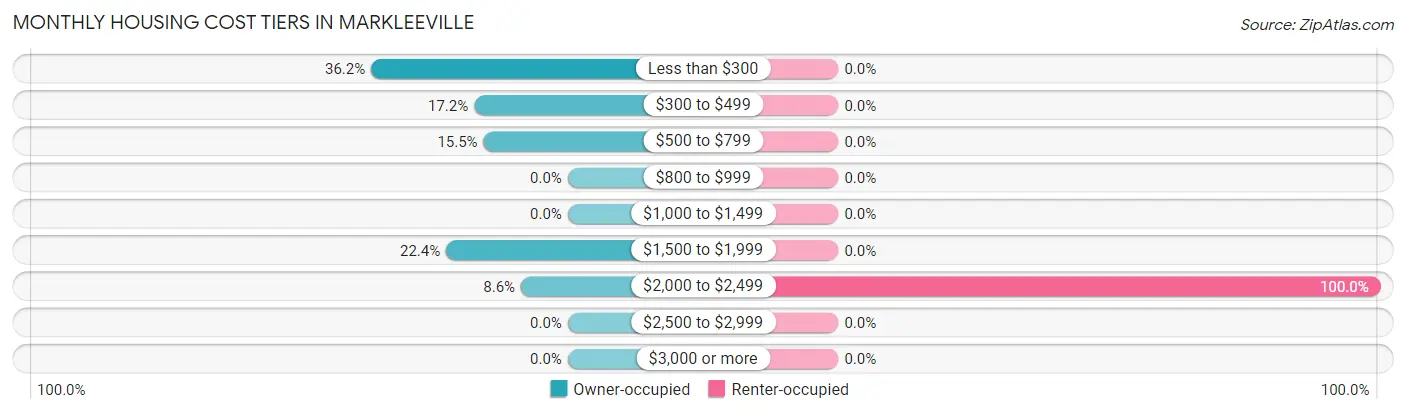
Monthly Housing Cost Tiers in Markleeville
| Monthly Cost | Owner-occupied | Renter-occupied |
| Less than $300 | 21 (36.2%) | 0 (0.0%) |
| $300 to $499 | 10 (17.2%) | 0 (0.0%) |
| $500 to $799 | 9 (15.5%) | 0 (0.0%) |
| $800 to $999 | 0 (0.0%) | 0 (0.0%) |
| $1,000 to $1,499 | 0 (0.0%) | 0 (0.0%) |
| $1,500 to $1,999 | 13 (22.4%) | 0 (0.0%) |
| $2,000 to $2,499 | 5 (8.6%) | 6 (100.0%) |
| $2,500 to $2,999 | 0 (0.0%) | 0 (0.0%) |
| $3,000 or more | 0 (0.0%) | 0 (0.0%) |
| Total | 58 (100.0%) | 6 (100.0%) |
Physical Housing Characteristics in Markleeville
Housing Structures in Markleeville
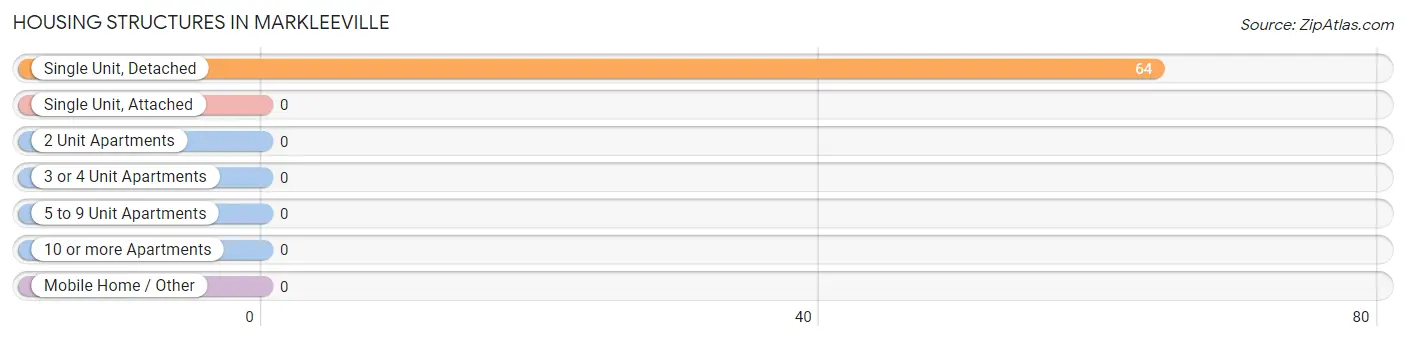
| Structure Type | # Housing Units | % Housing Units |
| Single Unit, Detached | 64 | 100.0% |
| Single Unit, Attached | 0 | 0.0% |
| 2 Unit Apartments | 0 | 0.0% |
| 3 or 4 Unit Apartments | 0 | 0.0% |
| 5 to 9 Unit Apartments | 0 | 0.0% |
| 10 or more Apartments | 0 | 0.0% |
| Mobile Home / Other | 0 | 0.0% |
| Total | 64 | 100.0% |
Housing Structures by Occupancy in Markleeville
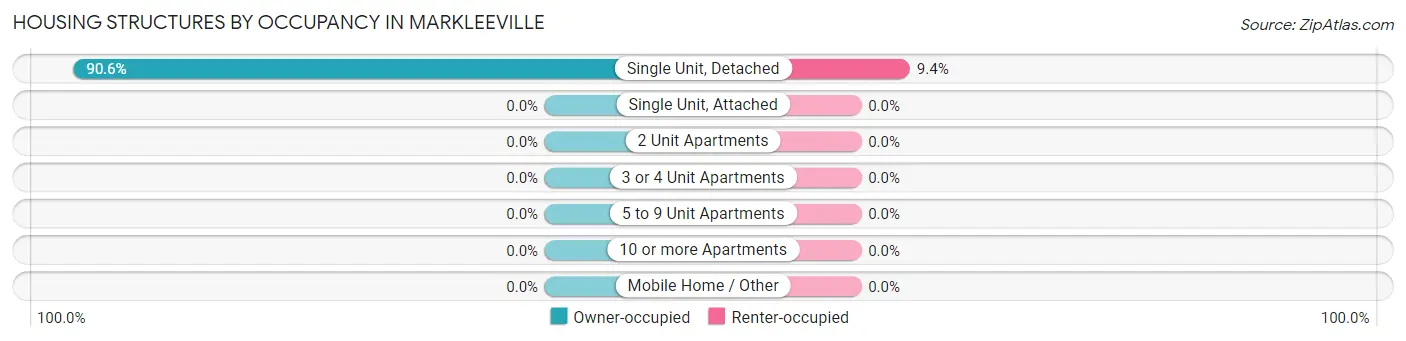
| Structure Type | Owner-occupied | Renter-occupied |
| Single Unit, Detached | 58 (90.6%) | 6 (9.4%) |
| Single Unit, Attached | 0 (0.0%) | 0 (0.0%) |
| 2 Unit Apartments | 0 (0.0%) | 0 (0.0%) |
| 3 or 4 Unit Apartments | 0 (0.0%) | 0 (0.0%) |
| 5 to 9 Unit Apartments | 0 (0.0%) | 0 (0.0%) |
| 10 or more Apartments | 0 (0.0%) | 0 (0.0%) |
| Mobile Home / Other | 0 (0.0%) | 0 (0.0%) |
| Total | 58 (90.6%) | 6 (9.4%) |
Housing Structures by Number of Rooms in Markleeville
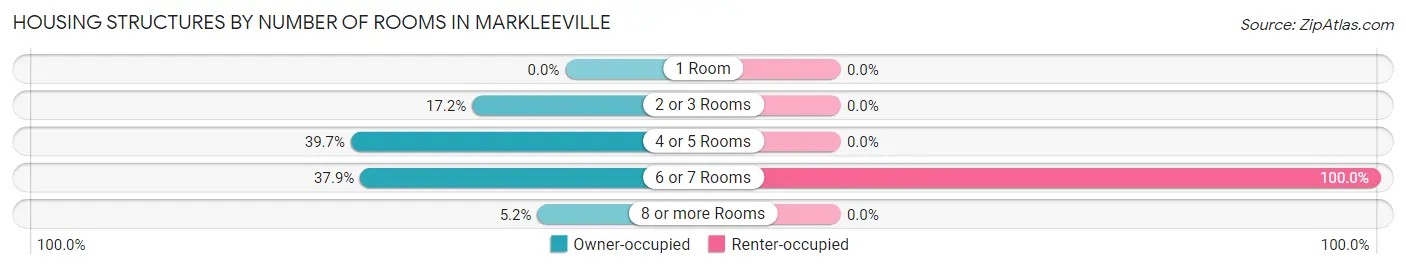
| Number of Rooms | Owner-occupied | Renter-occupied |
| 1 Room | 0 (0.0%) | 0 (0.0%) |
| 2 or 3 Rooms | 10 (17.2%) | 0 (0.0%) |
| 4 or 5 Rooms | 23 (39.7%) | 0 (0.0%) |
| 6 or 7 Rooms | 22 (37.9%) | 6 (100.0%) |
| 8 or more Rooms | 3 (5.2%) | 0 (0.0%) |
| Total | 58 (100.0%) | 6 (100.0%) |
Housing Structure by Heating Type in Markleeville
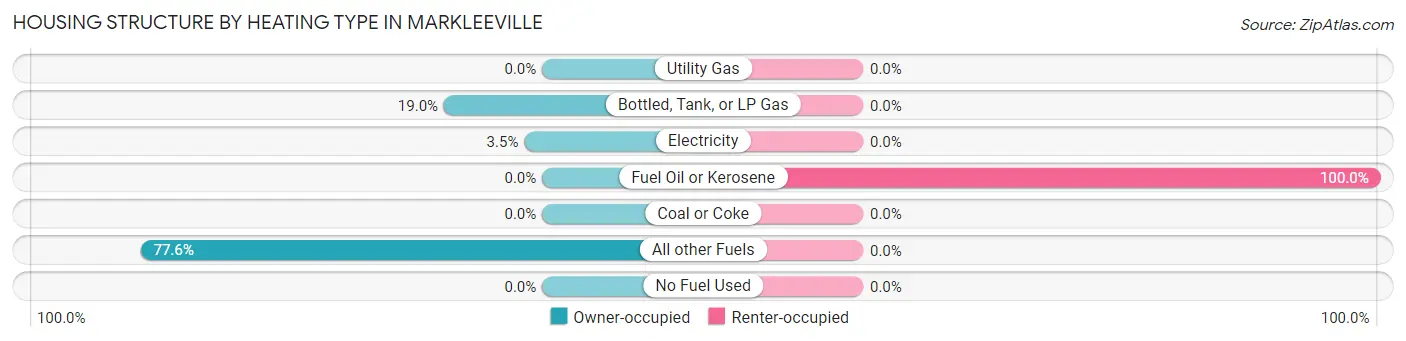
| Heating Type | Owner-occupied | Renter-occupied |
| Utility Gas | 0 (0.0%) | 0 (0.0%) |
| Bottled, Tank, or LP Gas | 11 (19.0%) | 0 (0.0%) |
| Electricity | 2 (3.5%) | 0 (0.0%) |
| Fuel Oil or Kerosene | 0 (0.0%) | 6 (100.0%) |
| Coal or Coke | 0 (0.0%) | 0 (0.0%) |
| All other Fuels | 45 (77.6%) | 0 (0.0%) |
| No Fuel Used | 0 (0.0%) | 0 (0.0%) |
| Total | 58 (100.0%) | 6 (100.0%) |
Household Vehicle Usage in Markleeville
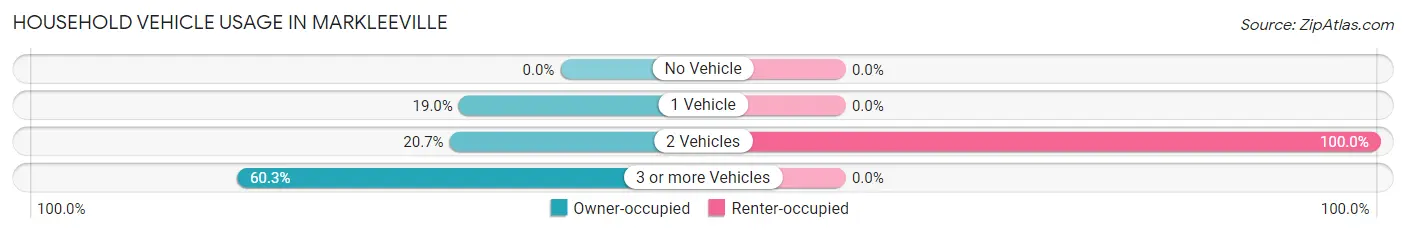
| Vehicles per Household | Owner-occupied | Renter-occupied |
| No Vehicle | 0 (0.0%) | 0 (0.0%) |
| 1 Vehicle | 11 (19.0%) | 0 (0.0%) |
| 2 Vehicles | 12 (20.7%) | 6 (100.0%) |
| 3 or more Vehicles | 35 (60.3%) | 0 (0.0%) |
| Total | 58 (100.0%) | 6 (100.0%) |
Real Estate & Mortgages in Markleeville
Real Estate and Mortgage Overview in Markleeville
| Characteristic | Without Mortgage | With Mortgage |
| Housing Units | 38 | 20 |
| Median Property Value | $409,500 | $611,100 |
| Median Household Income | - | - |
| Monthly Housing Costs | $295 | $0 |
| Real Estate Taxes | $1,328 | $0 |
Property Value by Mortgage Status in Markleeville
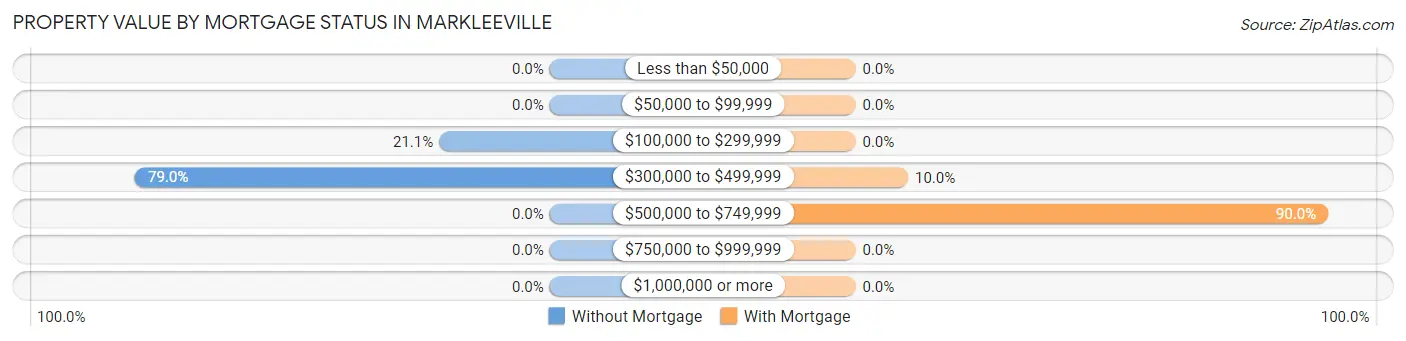
| Property Value | Without Mortgage | With Mortgage |
| Less than $50,000 | 0 (0.0%) | 0 (0.0%) |
| $50,000 to $99,999 | 0 (0.0%) | 0 (0.0%) |
| $100,000 to $299,999 | 8 (21.0%) | 0 (0.0%) |
| $300,000 to $499,999 | 30 (78.9%) | 2 (10.0%) |
| $500,000 to $749,999 | 0 (0.0%) | 18 (90.0%) |
| $750,000 to $999,999 | 0 (0.0%) | 0 (0.0%) |
| $1,000,000 or more | 0 (0.0%) | 0 (0.0%) |
| Total | 38 (100.0%) | 20 (100.0%) |
Household Income by Mortgage Status in Markleeville
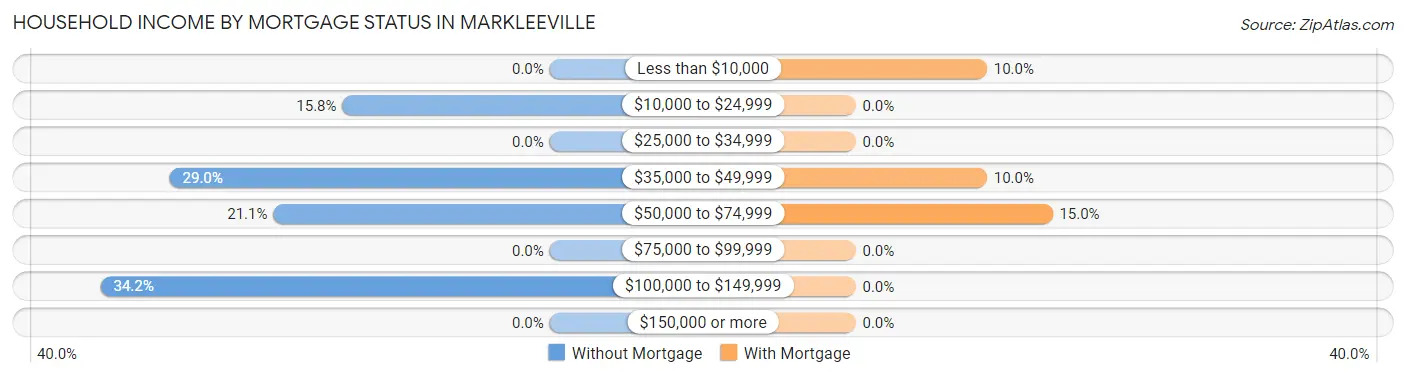
| Household Income | Without Mortgage | With Mortgage |
| Less than $10,000 | 0 (0.0%) | 2 (10.0%) |
| $10,000 to $24,999 | 6 (15.8%) | 0 (0.0%) |
| $25,000 to $34,999 | 0 (0.0%) | 0 (0.0%) |
| $35,000 to $49,999 | 11 (28.9%) | 2 (10.0%) |
| $50,000 to $74,999 | 8 (21.0%) | 3 (15.0%) |
| $75,000 to $99,999 | 0 (0.0%) | 0 (0.0%) |
| $100,000 to $149,999 | 13 (34.2%) | 0 (0.0%) |
| $150,000 or more | 0 (0.0%) | 0 (0.0%) |
| Total | 38 (100.0%) | 20 (100.0%) |
Property Value to Household Income Ratio in Markleeville
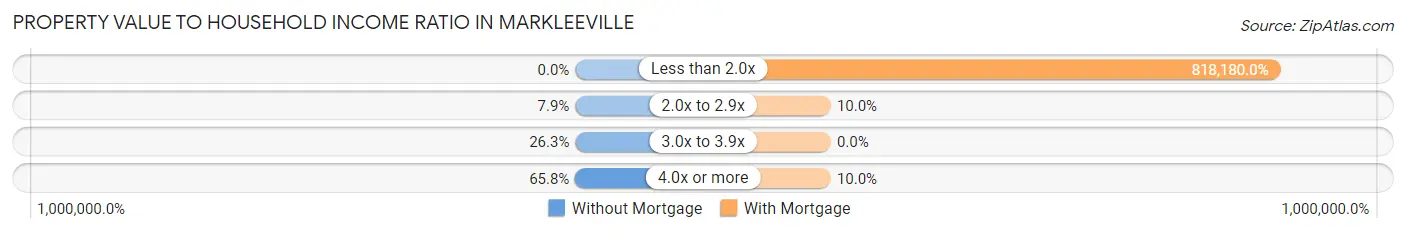
| Value-to-Income Ratio | Without Mortgage | With Mortgage |
| Less than 2.0x | 0 (0.0%) | 163,636 (818,180.0%) |
| 2.0x to 2.9x | 3 (7.9%) | 2 (10.0%) |
| 3.0x to 3.9x | 10 (26.3%) | 0 (0.0%) |
| 4.0x or more | 25 (65.8%) | 2 (10.0%) |
| Total | 38 (100.0%) | 20 (100.0%) |
Real Estate Taxes by Mortgage Status in Markleeville
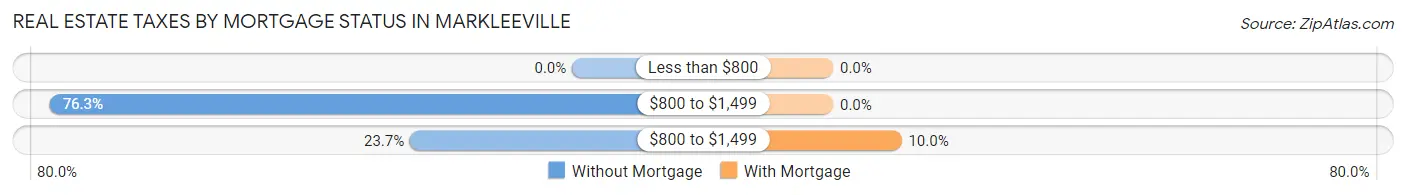
| Property Taxes | Without Mortgage | With Mortgage |
| Less than $800 | 0 (0.0%) | 0 (0.0%) |
| $800 to $1,499 | 29 (76.3%) | 0 (0.0%) |
| $800 to $1,499 | 9 (23.7%) | 2 (10.0%) |
| Total | 38 (100.0%) | 20 (100.0%) |
Health & Disability in Markleeville
Health Insurance Coverage by Age in Markleeville
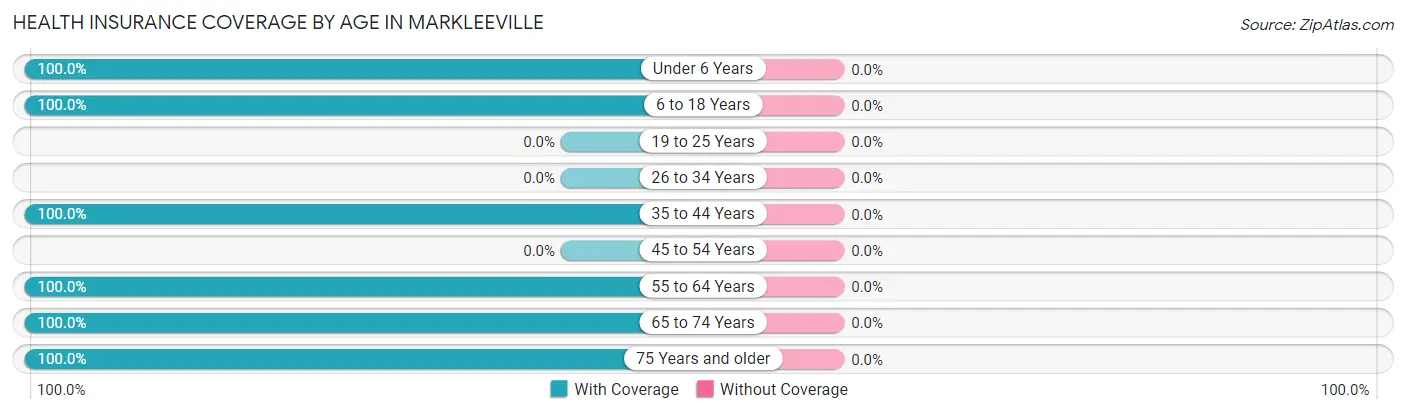
| Age Bracket | With Coverage | Without Coverage |
| Under 6 Years | 14 (100.0%) | 0 (0.0%) |
| 6 to 18 Years | 15 (100.0%) | 0 (0.0%) |
| 19 to 25 Years | 0 (0.0%) | 0 (0.0%) |
| 26 to 34 Years | 0 (0.0%) | 0 (0.0%) |
| 35 to 44 Years | 14 (100.0%) | 0 (0.0%) |
| 45 to 54 Years | 0 (0.0%) | 0 (0.0%) |
| 55 to 64 Years | 46 (100.0%) | 0 (0.0%) |
| 65 to 74 Years | 67 (100.0%) | 0 (0.0%) |
| 75 Years and older | 7 (100.0%) | 0 (0.0%) |
| Total | 163 (100.0%) | 0 (0.0%) |
Health Insurance Coverage by Citizenship Status in Markleeville
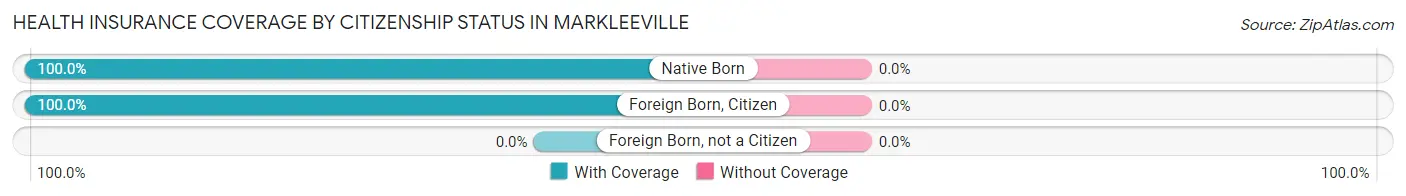
| Citizenship Status | With Coverage | Without Coverage |
| Native Born | 14 (100.0%) | 0 (0.0%) |
| Foreign Born, Citizen | 15 (100.0%) | 0 (0.0%) |
| Foreign Born, not a Citizen | 0 (0.0%) | 0 (0.0%) |
Health Insurance Coverage by Household Income in Markleeville
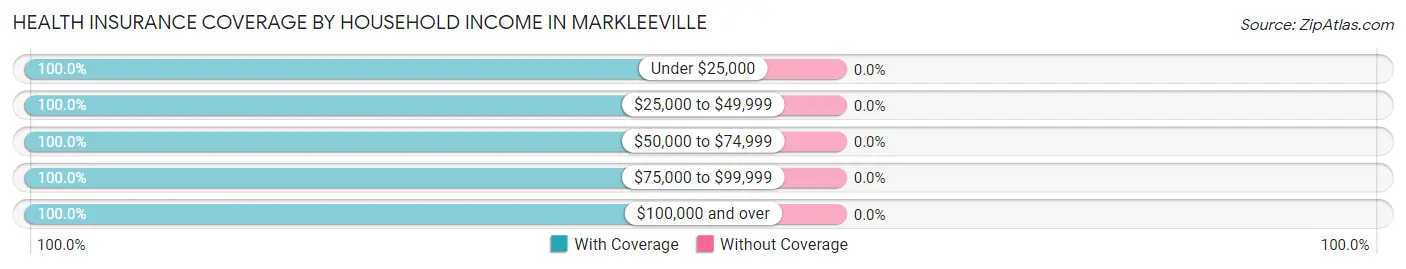
| Household Income | With Coverage | Without Coverage |
| Under $25,000 | 8 (100.0%) | 0 (0.0%) |
| $25,000 to $49,999 | 44 (100.0%) | 0 (0.0%) |
| $50,000 to $74,999 | 8 (100.0%) | 0 (0.0%) |
| $75,000 to $99,999 | 43 (100.0%) | 0 (0.0%) |
| $100,000 and over | 60 (100.0%) | 0 (0.0%) |
Public vs Private Health Insurance Coverage by Age in Markleeville
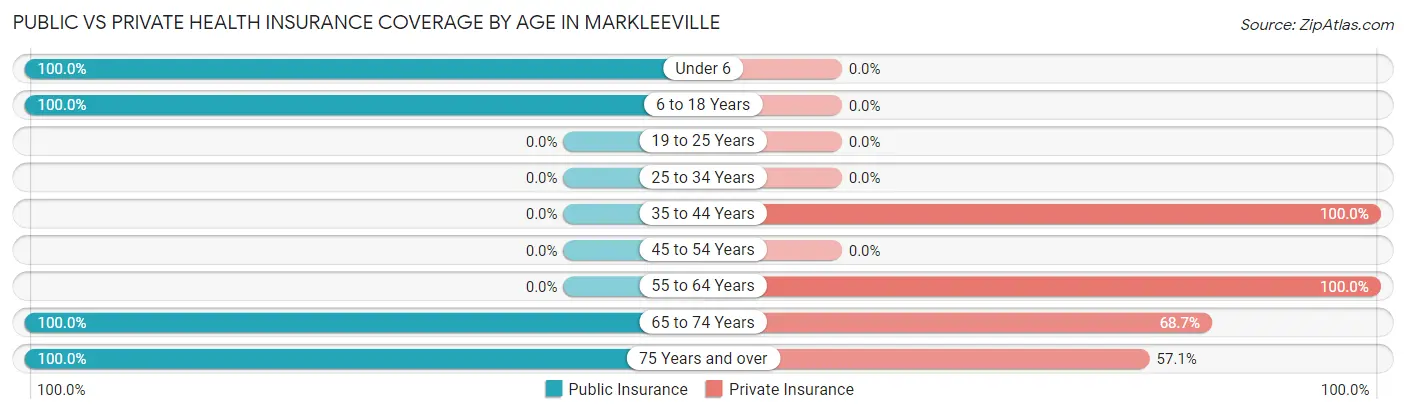
| Age Bracket | Public Insurance | Private Insurance |
| Under 6 | 14 (100.0%) | 0 (0.0%) |
| 6 to 18 Years | 15 (100.0%) | 0 (0.0%) |
| 19 to 25 Years | 0 (0.0%) | 0 (0.0%) |
| 25 to 34 Years | 0 (0.0%) | 0 (0.0%) |
| 35 to 44 Years | 0 (0.0%) | 14 (100.0%) |
| 45 to 54 Years | 0 (0.0%) | 0 (0.0%) |
| 55 to 64 Years | 0 (0.0%) | 46 (100.0%) |
| 65 to 74 Years | 67 (100.0%) | 46 (68.7%) |
| 75 Years and over | 7 (100.0%) | 4 (57.1%) |
| Total | 103 (63.2%) | 110 (67.5%) |
Disability Status by Sex by Age in Markleeville
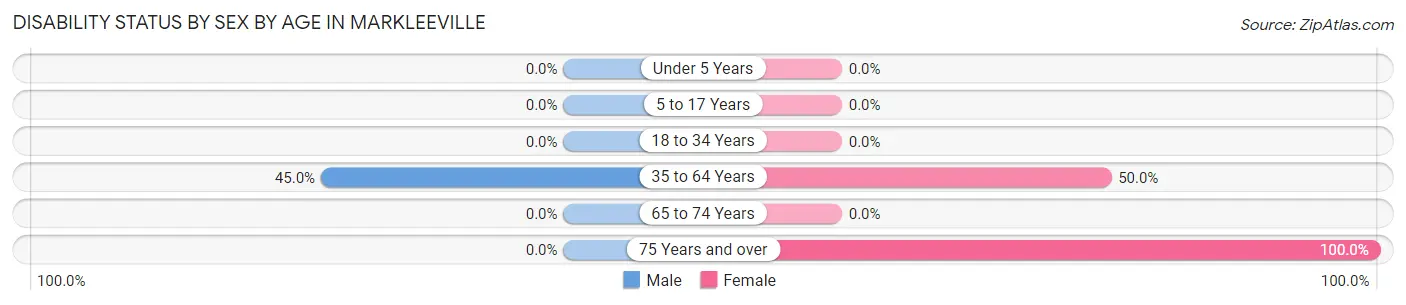
| Age Bracket | Male | Female |
| Under 5 Years | 0 (0.0%) | 0 (0.0%) |
| 5 to 17 Years | 0 (0.0%) | 0 (0.0%) |
| 18 to 34 Years | 0 (0.0%) | 0 (0.0%) |
| 35 to 64 Years | 18 (45.0%) | 10 (50.0%) |
| 65 to 74 Years | 0 (0.0%) | 0 (0.0%) |
| 75 Years and over | 0 (0.0%) | 2 (100.0%) |
Disability Class by Sex by Age in Markleeville
Disability Class: Hearing Difficulty
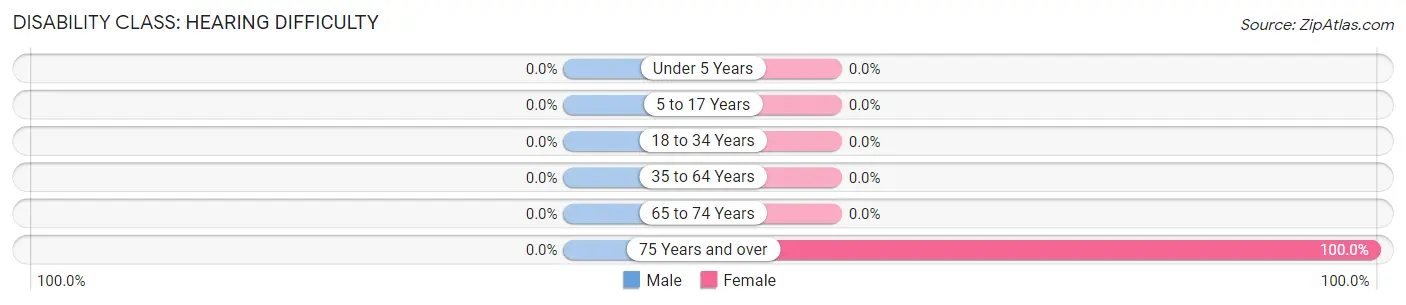
| Age Bracket | Male | Female |
| Under 5 Years | 0 (0.0%) | 0 (0.0%) |
| 5 to 17 Years | 0 (0.0%) | 0 (0.0%) |
| 18 to 34 Years | 0 (0.0%) | 0 (0.0%) |
| 35 to 64 Years | 0 (0.0%) | 0 (0.0%) |
| 65 to 74 Years | 0 (0.0%) | 0 (0.0%) |
| 75 Years and over | 0 (0.0%) | 2 (100.0%) |
Disability Class: Vision Difficulty
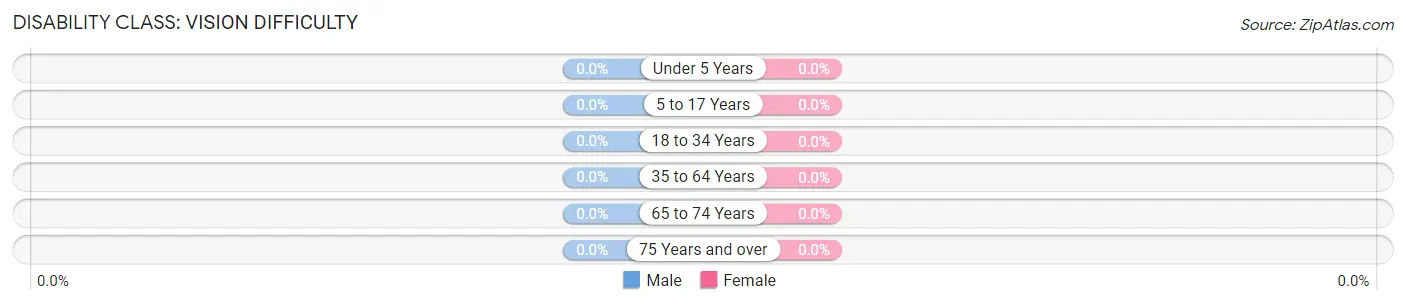
| Age Bracket | Male | Female |
| Under 5 Years | 0 (0.0%) | 0 (0.0%) |
| 5 to 17 Years | 0 (0.0%) | 0 (0.0%) |
| 18 to 34 Years | 0 (0.0%) | 0 (0.0%) |
| 35 to 64 Years | 0 (0.0%) | 0 (0.0%) |
| 65 to 74 Years | 0 (0.0%) | 0 (0.0%) |
| 75 Years and over | 0 (0.0%) | 0 (0.0%) |
Disability Class: Cognitive Difficulty

| Age Bracket | Male | Female |
| 5 to 17 Years | 0 (0.0%) | 0 (0.0%) |
| 18 to 34 Years | 0 (0.0%) | 0 (0.0%) |
| 35 to 64 Years | 0 (0.0%) | 0 (0.0%) |
| 65 to 74 Years | 0 (0.0%) | 0 (0.0%) |
| 75 Years and over | 0 (0.0%) | 0 (0.0%) |
Disability Class: Ambulatory Difficulty
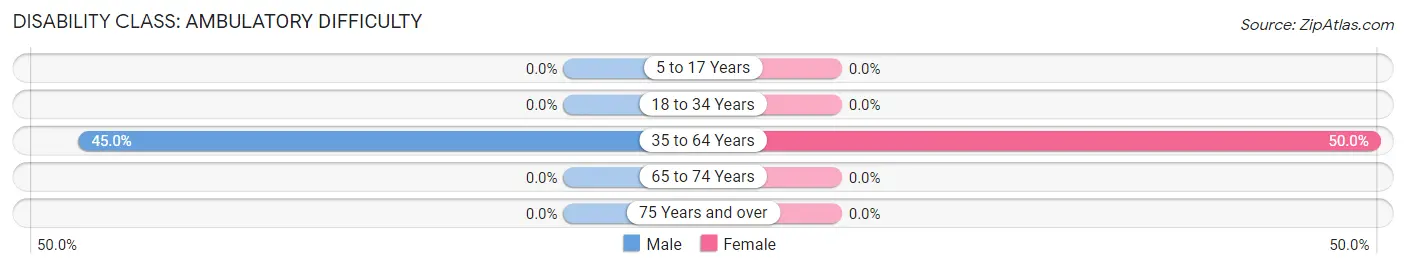
| Age Bracket | Male | Female |
| 5 to 17 Years | 0 (0.0%) | 0 (0.0%) |
| 18 to 34 Years | 0 (0.0%) | 0 (0.0%) |
| 35 to 64 Years | 18 (45.0%) | 10 (50.0%) |
| 65 to 74 Years | 0 (0.0%) | 0 (0.0%) |
| 75 Years and over | 0 (0.0%) | 0 (0.0%) |
Disability Class: Self-Care Difficulty
| Age Bracket | Male | Female |
| 5 to 17 Years | 0 (0.0%) | 0 (0.0%) |
| 18 to 34 Years | 0 (0.0%) | 0 (0.0%) |
| 35 to 64 Years | 0 (0.0%) | 0 (0.0%) |
| 65 to 74 Years | 0 (0.0%) | 0 (0.0%) |
| 75 Years and over | 0 (0.0%) | 0 (0.0%) |
Technology Access in Markleeville
Computing Device Access in Markleeville
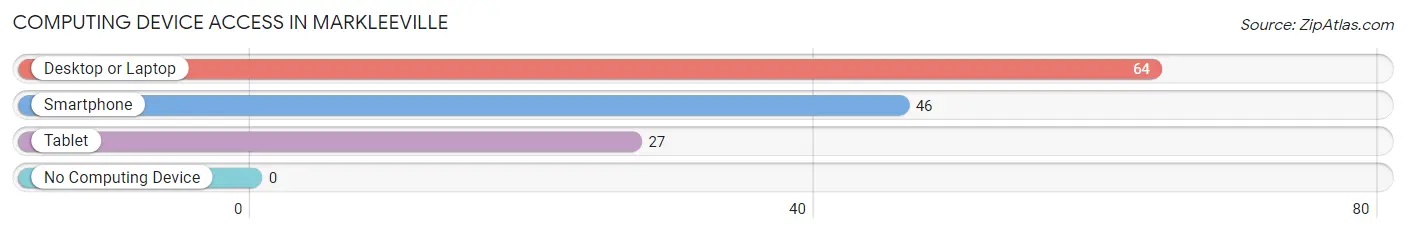
| Device Type | # Households | % Households |
| Desktop or Laptop | 64 | 100.0% |
| Smartphone | 46 | 71.9% |
| Tablet | 27 | 42.2% |
| No Computing Device | 0 | 0.0% |
| Total | 64 | 100.0% |
Internet Access in Markleeville
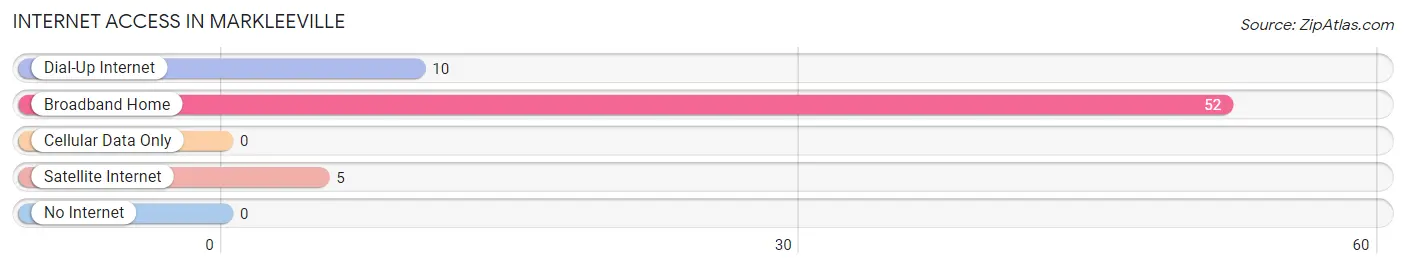
| Internet Type | # Households | % Households |
| Dial-Up Internet | 10 | 15.6% |
| Broadband Home | 52 | 81.2% |
| Cellular Data Only | 0 | 0.0% |
| Satellite Internet | 5 | 7.8% |
| No Internet | 0 | 0.0% |
| Total | 64 | 100.0% |
Markleeville Summary
Markleeville, California is a small town located in the Sierra Nevada Mountains of Alpine County. It is situated at an elevation of 5,945 feet and is the county seat of Alpine County. The town was founded in 1859 by Jacob Marklee, a miner who discovered gold in the area. The town was named after him and has since become a popular tourist destination due to its proximity to Lake Tahoe and the surrounding mountains.
History
Markleeville was founded in 1859 by Jacob Marklee, a miner who discovered gold in the area. The town was named after him and quickly grew to become a bustling mining town. The town was incorporated in 1864 and soon became the county seat of Alpine County. The town was a major hub for the mining industry in the area and was home to several saloons, hotels, and stores.
The town experienced a decline in the late 19th century as the mining industry began to decline. However, the town was revitalized in the early 20th century when the nearby Lake Tahoe became a popular tourist destination. The town began to attract tourists and vacationers who were looking to escape the hustle and bustle of the city.
Geography
Markleeville is located in the Sierra Nevada Mountains of Alpine County. It is situated at an elevation of 5,945 feet and is the county seat of Alpine County. The town is surrounded by the Carson Range to the east and the Sierra Nevada Mountains to the west. The town is located near the headwaters of the Carson River and is close to Lake Tahoe.
The town is located in a temperate climate zone and experiences warm summers and cold winters. The average annual temperature is around 50 degrees Fahrenheit and the average annual precipitation is around 20 inches.
Economy
Markleeville’s economy is largely based on tourism and recreation. The town is a popular destination for tourists and vacationers who are looking to escape the hustle and bustle of the city. The town is home to several restaurants, hotels, and stores that cater to tourists and vacationers.
The town is also home to several small businesses that provide goods and services to the local community. These businesses include a grocery store, a hardware store, a gas station, and a post office.
Demographics
As of the 2010 census, the population of Markleeville was 210. The racial makeup of the town was 95.2% White, 0.5% African American, 0.5% Native American, 0.5% Asian, 0.0% Pacific Islander, 1.9% from other races, and 1.4% from two or more races. Hispanic or Latino of any race were 4.3% of the population.
The median income for a household in the town was $41,250 and the median income for a family was $50,000. The per capita income for the town was $20,917. About 8.3% of families and 10.5% of the population were below the poverty line, including 14.3% of those under age 18 and none of those age 65 or over.
Common Questions
What is Per Capita Income in Markleeville?
Per Capita income in Markleeville is $40,204.
What is the Median Family Income in Markleeville?
Median Family Income in Markleeville is $112,875.
What is the Median Household income in Markleeville?
Median Household Income in Markleeville is $93,333.
What is Inequality or Gini Index in Markleeville?
Inequality or Gini Index in Markleeville is 0.36.
What is the Total Population of Markleeville?
Total Population of Markleeville is 163.
What is the Total Male Population of Markleeville?
Total Male Population of Markleeville is 89.
What is the Total Female Population of Markleeville?
Total Female Population of Markleeville is 74.
What is the Ratio of Males per 100 Females in Markleeville?
There are 120.27 Males per 100 Females in Markleeville.
What is the Ratio of Females per 100 Males in Markleeville?
There are 83.15 Females per 100 Males in Markleeville.
What is the Median Population Age in Markleeville?
Median Population Age in Markleeville is 64.6 Years.
What is the Average Family Size in Markleeville
Average Family Size in Markleeville is 2.9 People.
What is the Average Household Size in Markleeville
Average Household Size in Markleeville is 2.5 People.
How Large is the Labor Force in Markleeville?
There are 48 People in the Labor Forcein in Markleeville.
What is the Percentage of People in the Labor Force in Markleeville?
35.8% of People are in the Labor Force in Markleeville.