Zip Codes with the Highest Percentage of Population Employed in Architecture & Engineering in Duarte, CA
RELATED REPORTS & OPTIONS
Architecture & Engineering
Duarte
Compare Zip Codes
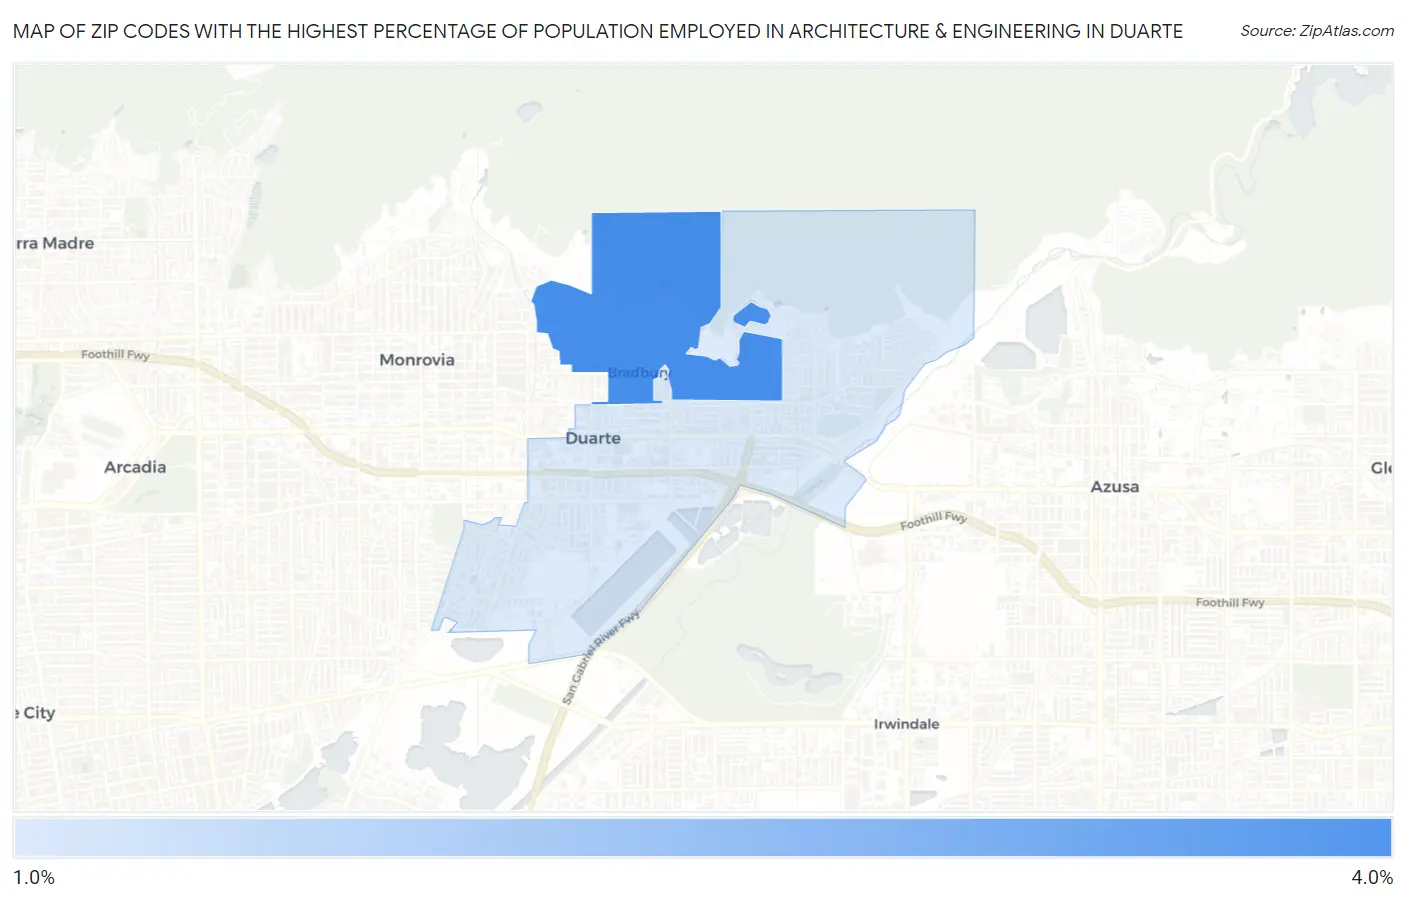
Map of Zip Codes with the Highest Percentage of Population Employed in Architecture & Engineering in Duarte
1.1%
3.3%
Zip Codes with the Highest Percentage of Population Employed in Architecture & Engineering in Duarte, CA
| Zip Code | % Employed | vs State | vs National | |
| 1. | 91008 | 3.3% | 2.6%(+0.779)#337 | 2.1%(+1.18)#4,106 |
| 2. | 91010 | 1.1% | 2.6%(-1.46)#1,007 | 2.1%(-1.06)#15,947 |
1
Common Questions
What are the Top Zip Codes with the Highest Percentage of Population Employed in Architecture & Engineering in Duarte, CA?
Top Zip Codes with the Highest Percentage of Population Employed in Architecture & Engineering in Duarte, CA are:
What zip code has the Highest Percentage of Population Employed in Architecture & Engineering in Duarte, CA?
91008 has the Highest Percentage of Population Employed in Architecture & Engineering in Duarte, CA with 3.3%.
What is the Percentage of Population Employed in Architecture & Engineering in Duarte, CA?
Percentage of Population Employed in Architecture & Engineering in Duarte is 1.2%.
What is the Percentage of Population Employed in Architecture & Engineering in California?
Percentage of Population Employed in Architecture & Engineering in California is 2.6%.
What is the Percentage of Population Employed in Architecture & Engineering in the United States?
Percentage of Population Employed in Architecture & Engineering in the United States is 2.1%.