Vandenberg Village, CA Map & Demographics
Vandenberg Village Map
Vandenberg Village Overview
$47,000
PER CAPITA INCOME
$120,000
AVG FAMILY INCOME
$93,817
AVG HOUSEHOLD INCOME
29.0%
WAGE / INCOME GAP [ % ]
71.0¢/ $1
WAGE / INCOME GAP [ $ ]
0.41
INEQUALITY / GINI INDEX
6,702
TOTAL POPULATION
3,570
MALE POPULATION
3,132
FEMALE POPULATION
113.98
MALES / 100 FEMALES
87.73
FEMALES / 100 MALES
46.2
MEDIAN AGE
3.0
AVG FAMILY SIZE
2.5
AVG HOUSEHOLD SIZE
3,509
LABOR FORCE [ PEOPLE ]
63.2%
PERCENT IN LABOR FORCE
7.1%
UNEMPLOYMENT RATE
Income in Vandenberg Village
Income Overview in Vandenberg Village
Per Capita Income in Vandenberg Village is $47,000, while median incomes of families and households are $120,000 and $93,817 respectively.
| Characteristic | Number | Measure |
| Per Capita Income | 6,702 | $47,000 |
| Median Family Income | 1,848 | $120,000 |
| Mean Family Income | 1,848 | $141,625 |
| Median Household Income | 2,647 | $93,817 |
| Mean Household Income | 2,647 | $118,715 |
| Income Deficit | 1,848 | $0 |
| Wage / Income Gap (%) | 6,702 | 28.95% |
| Wage / Income Gap ($) | 6,702 | 71.05¢ per $1 |
| Gini / Inequality Index | 6,702 | 0.41 |
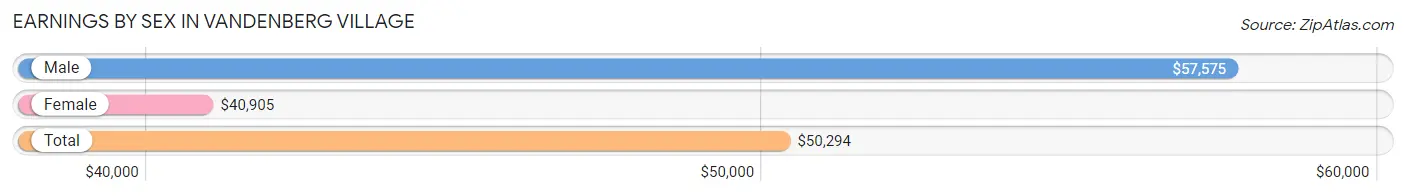
Earnings by Sex in Vandenberg Village
Average Earnings in Vandenberg Village are $50,294, $57,575 for men and $40,905 for women, a difference of 28.9%.
| Sex | Number | Average Earnings |
| Male | 2,055 (57.3%) | $57,575 |
| Female | 1,531 (42.7%) | $40,905 |
| Total | 3,586 (100.0%) | $50,294 |
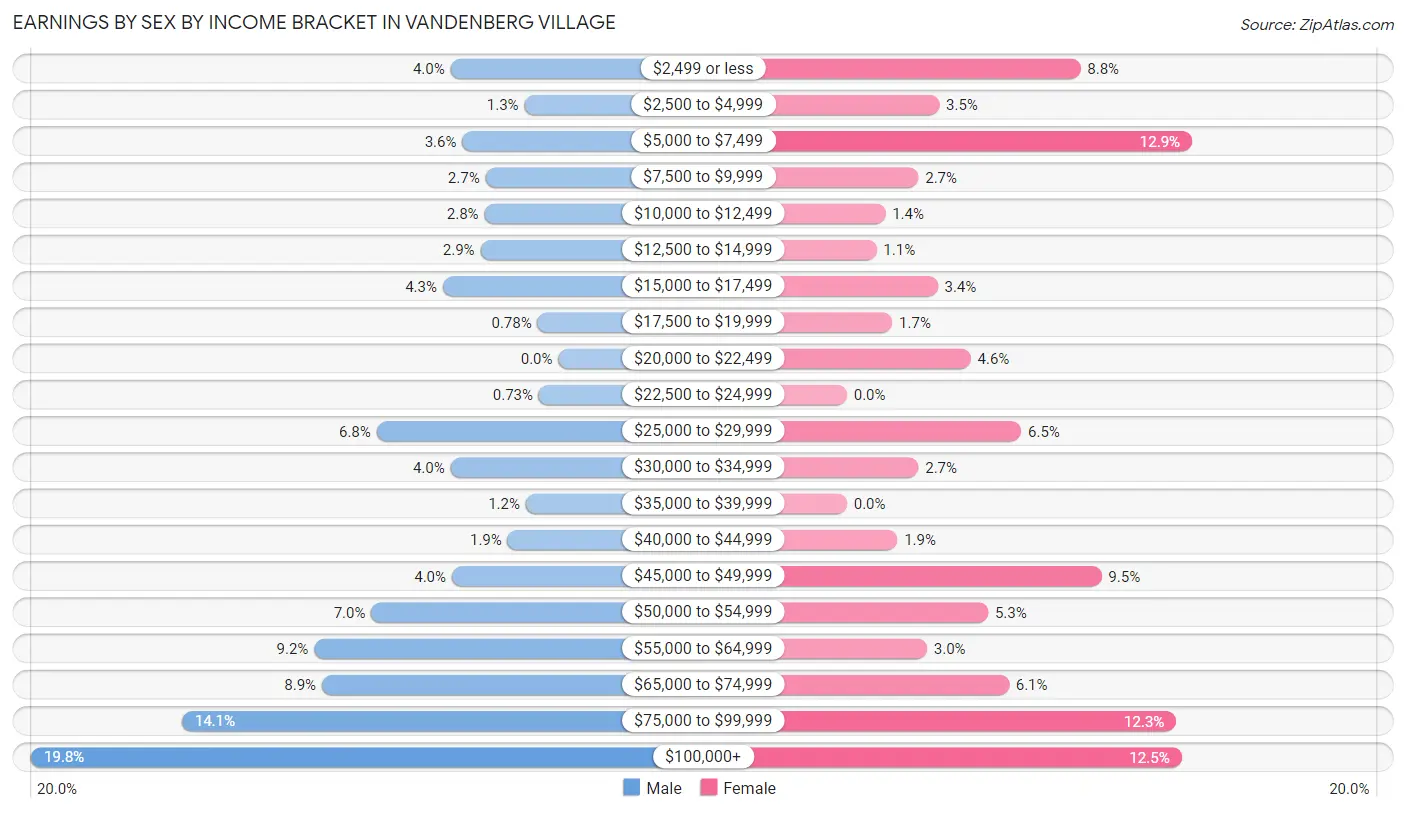
Earnings by Sex by Income Bracket in Vandenberg Village
The most common earnings brackets in Vandenberg Village are $100,000+ for men (406 | 19.8%) and $5,000 to $7,499 for women (198 | 12.9%).
| Income | Male | Female |
| $2,499 or less | 83 (4.0%) | 134 (8.7%) |
| $2,500 to $4,999 | 26 (1.3%) | 53 (3.5%) |
| $5,000 to $7,499 | 74 (3.6%) | 198 (12.9%) |
| $7,500 to $9,999 | 56 (2.7%) | 41 (2.7%) |
| $10,000 to $12,499 | 57 (2.8%) | 22 (1.4%) |
| $12,500 to $14,999 | 60 (2.9%) | 17 (1.1%) |
| $15,000 to $17,499 | 89 (4.3%) | 52 (3.4%) |
| $17,500 to $19,999 | 16 (0.8%) | 26 (1.7%) |
| $20,000 to $22,499 | 0 (0.0%) | 71 (4.6%) |
| $22,500 to $24,999 | 15 (0.7%) | 0 (0.0%) |
| $25,000 to $29,999 | 140 (6.8%) | 100 (6.5%) |
| $30,000 to $34,999 | 83 (4.0%) | 41 (2.7%) |
| $35,000 to $39,999 | 25 (1.2%) | 0 (0.0%) |
| $40,000 to $44,999 | 39 (1.9%) | 29 (1.9%) |
| $45,000 to $49,999 | 82 (4.0%) | 146 (9.5%) |
| $50,000 to $54,999 | 144 (7.0%) | 81 (5.3%) |
| $55,000 to $64,999 | 188 (9.1%) | 46 (3.0%) |
| $65,000 to $74,999 | 182 (8.9%) | 93 (6.1%) |
| $75,000 to $99,999 | 290 (14.1%) | 189 (12.3%) |
| $100,000+ | 406 (19.8%) | 192 (12.5%) |
| Total | 2,055 (100.0%) | 1,531 (100.0%) |
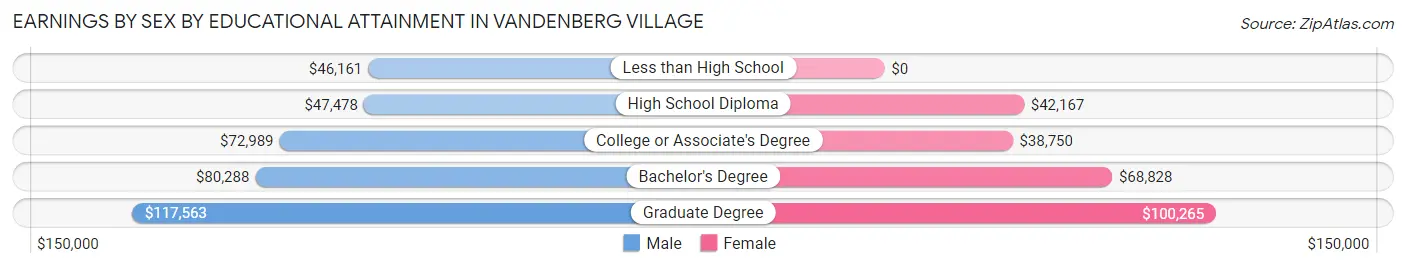
Earnings by Sex by Educational Attainment in Vandenberg Village
Average earnings in Vandenberg Village are $67,543 for men and $47,330 for women, a difference of 29.9%. Men with an educational attainment of graduate degree enjoy the highest average annual earnings of $117,563, while those with less than high school education earn the least with $46,161. Women with an educational attainment of graduate degree earn the most with the average annual earnings of $100,265, while those with college or associate's degree education have the smallest earnings of $38,750.
| Educational Attainment | Male Income | Female Income |
| Less than High School | $46,161 | $0 |
| High School Diploma | $47,478 | $42,167 |
| College or Associate's Degree | $72,989 | $38,750 |
| Bachelor's Degree | $80,288 | $68,828 |
| Graduate Degree | $117,563 | $100,265 |
| Total | $67,543 | $47,330 |
Family Income in Vandenberg Village
Family Income Brackets in Vandenberg Village
According to the Vandenberg Village family income data, there are 527 families falling into the $100,000 to $149,999 income range, which is the most common income bracket and makes up 28.5% of all families.
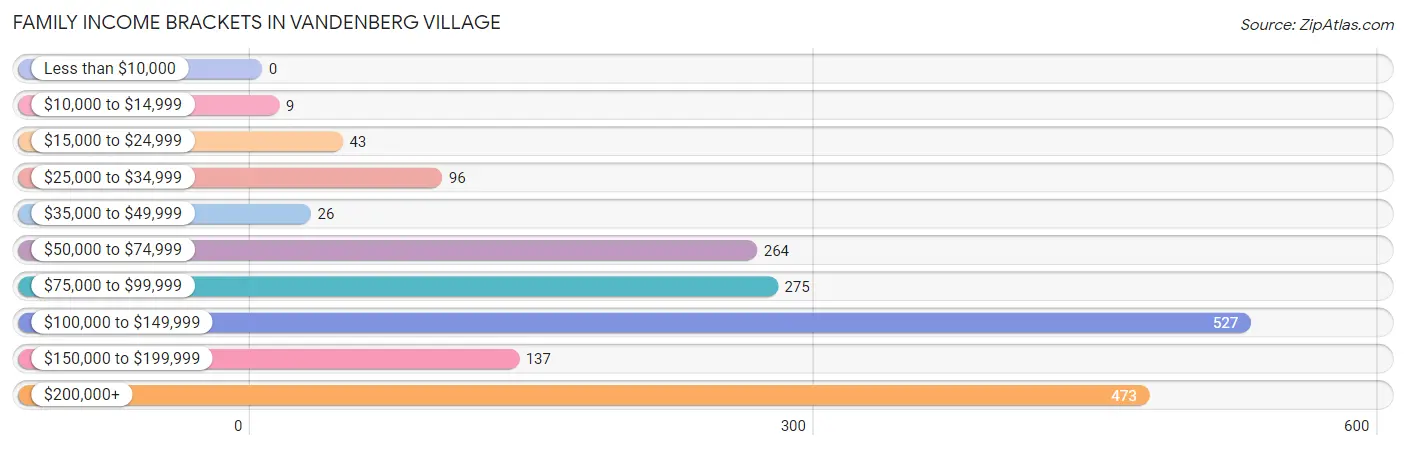
| Income Bracket | # Families | % Families |
| Less than $10,000 | 0 | 0.0% |
| $10,000 to $14,999 | 9 | 0.5% |
| $15,000 to $24,999 | 43 | 2.3% |
| $25,000 to $34,999 | 96 | 5.2% |
| $35,000 to $49,999 | 26 | 1.4% |
| $50,000 to $74,999 | 264 | 14.3% |
| $75,000 to $99,999 | 275 | 14.9% |
| $100,000 to $149,999 | 527 | 28.5% |
| $150,000 to $199,999 | 137 | 7.4% |
| $200,000+ | 473 | 25.6% |
Family Income by Famaliy Size in Vandenberg Village
6-person families (47 | 2.5%) account for the highest median family income in Vandenberg Village with $201,083 per family, while 2-person families (1,033 | 55.9%) have the highest median income of $51,438 per family member.
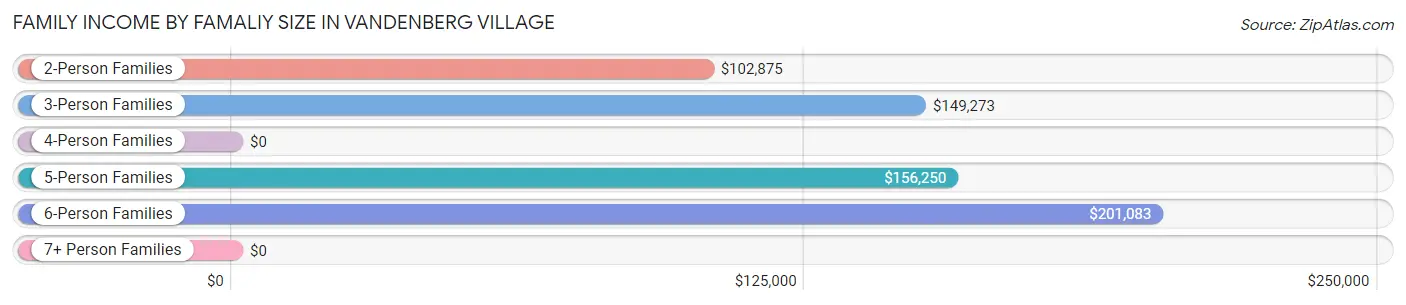
| Income Bracket | # Families | Median Income |
| 2-Person Families | 1,033 (55.9%) | $102,875 |
| 3-Person Families | 276 (14.9%) | $149,273 |
| 4-Person Families | 271 (14.7%) | $0 |
| 5-Person Families | 192 (10.4%) | $156,250 |
| 6-Person Families | 47 (2.5%) | $201,083 |
| 7+ Person Families | 29 (1.6%) | $0 |
| Total | 1,848 (100.0%) | $120,000 |
Family Income by Number of Earners in Vandenberg Village
The median family income in Vandenberg Village is $120,000, with families comprising 3+ earners (277) having the highest median family income of $156,076, while families with no earners (342) have the lowest median family income of $80,308, accounting for 15.0% and 18.5% of families, respectively.
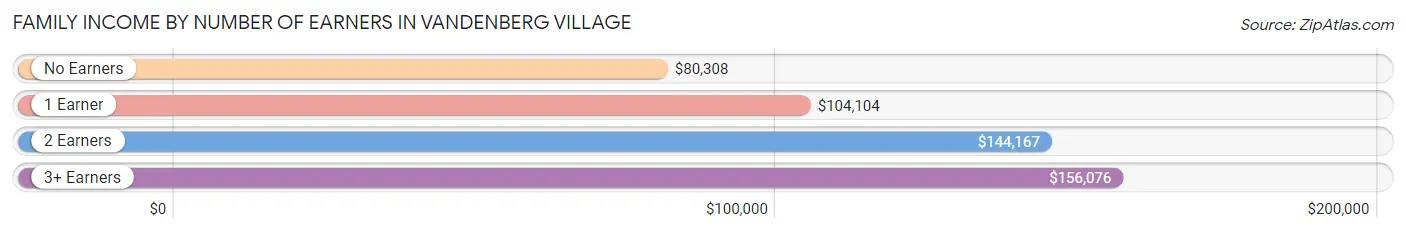
| Number of Earners | # Families | Median Income |
| No Earners | 342 (18.5%) | $80,308 |
| 1 Earner | 435 (23.5%) | $104,104 |
| 2 Earners | 794 (43.0%) | $144,167 |
| 3+ Earners | 277 (15.0%) | $156,076 |
| Total | 1,848 (100.0%) | $120,000 |
Household Income in Vandenberg Village
Household Income Brackets in Vandenberg Village
With 580 households falling in the category, the $100,000 to $149,999 income range is the most frequent in Vandenberg Village, accounting for 21.9% of all households. In contrast, only 29 households (1.1%) fall into the less than $10,000 income bracket, making it the least populous group.
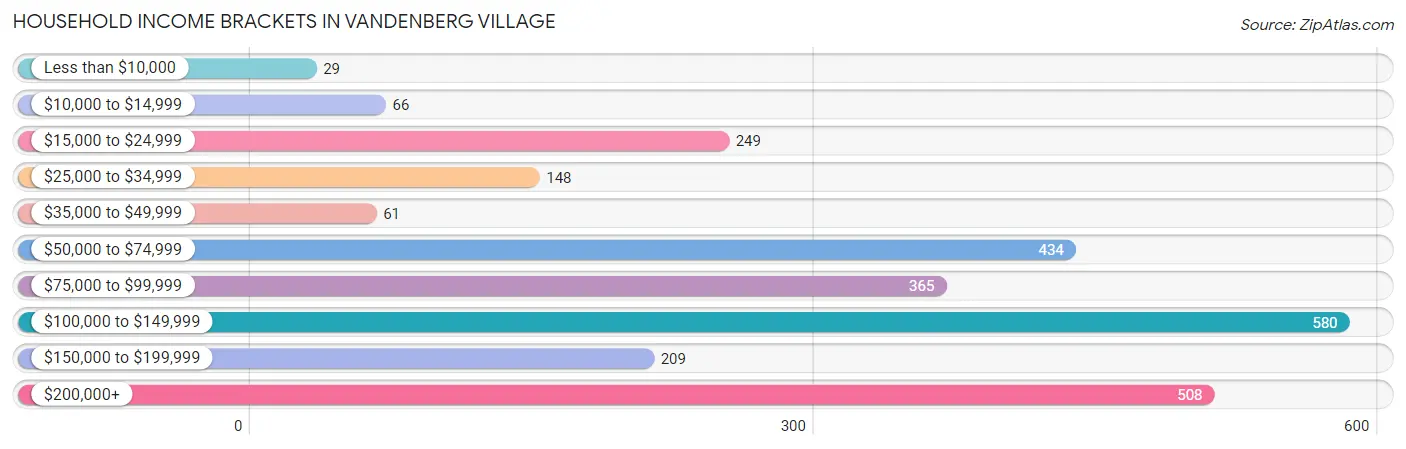
| Income Bracket | # Households | % Households |
| Less than $10,000 | 29 | 1.1% |
| $10,000 to $14,999 | 66 | 2.5% |
| $15,000 to $24,999 | 249 | 9.4% |
| $25,000 to $34,999 | 148 | 5.6% |
| $35,000 to $49,999 | 61 | 2.3% |
| $50,000 to $74,999 | 434 | 16.4% |
| $75,000 to $99,999 | 365 | 13.8% |
| $100,000 to $149,999 | 580 | 21.9% |
| $150,000 to $199,999 | 209 | 7.9% |
| $200,000+ | 508 | 19.2% |
Household Income by Householder Age in Vandenberg Village
The median household income in Vandenberg Village is $93,817, with the highest median household income of $144,083 found in the 45 to 64 years age bracket for the primary householder. A total of 1,098 households (41.5%) fall into this category. Meanwhile, the 15 to 24 years age bracket for the primary householder has the lowest median household income of $0, with 151 households (5.7%) in this group.
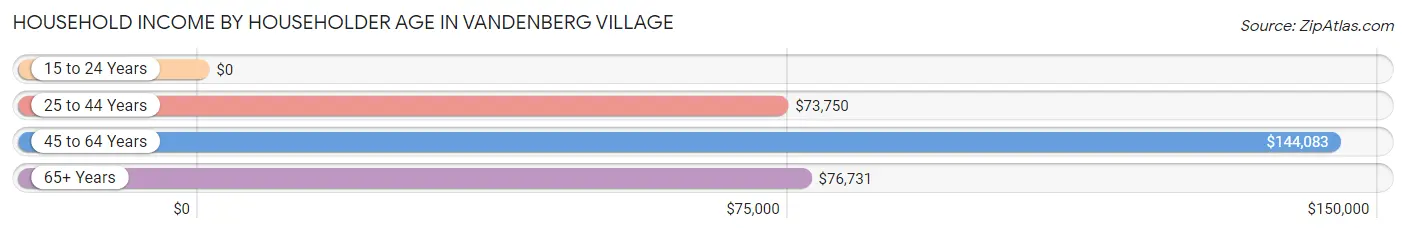
| Income Bracket | # Households | Median Income |
| 15 to 24 Years | 151 (5.7%) | $0 |
| 25 to 44 Years | 498 (18.8%) | $73,750 |
| 45 to 64 Years | 1,098 (41.5%) | $144,083 |
| 65+ Years | 900 (34.0%) | $76,731 |
| Total | 2,647 (100.0%) | $93,817 |
Poverty in Vandenberg Village
Income Below Poverty by Sex and Age in Vandenberg Village
With 5.5% poverty level for males and 5.2% for females among the residents of Vandenberg Village, 12 to 14 year old males and 18 to 24 year old females are the most vulnerable to poverty, with 37 males (30.1%) and 83 females (33.5%) in their respective age groups living below the poverty level.
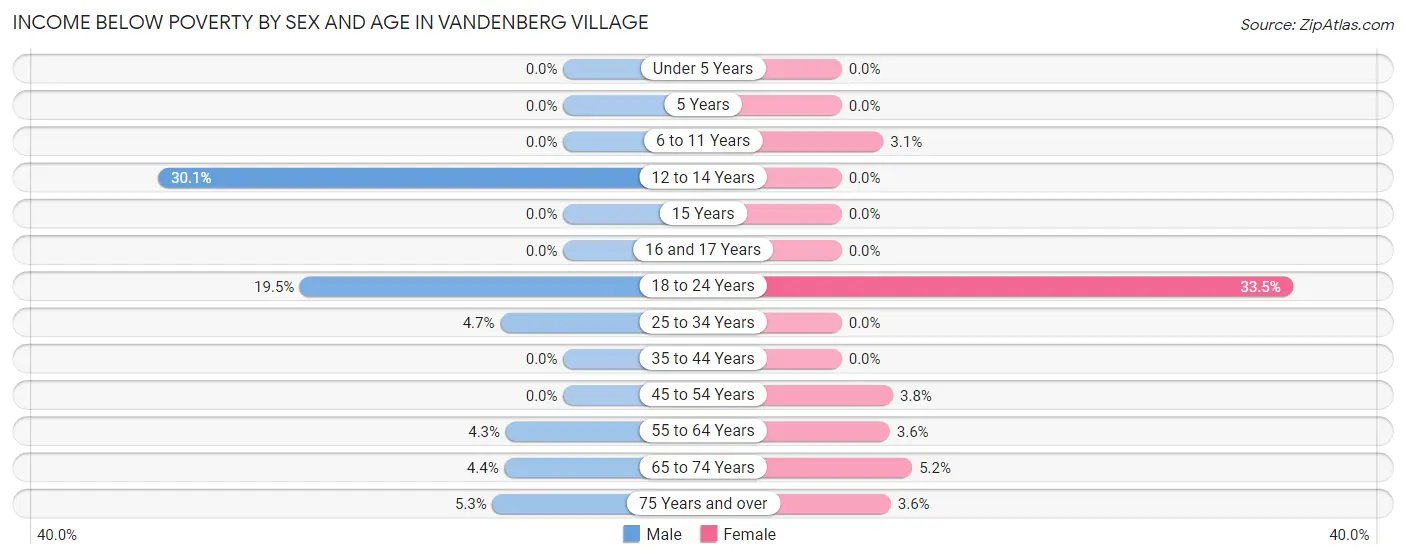
| Age Bracket | Male | Female |
| Under 5 Years | 0 (0.0%) | 0 (0.0%) |
| 5 Years | 0 (0.0%) | 0 (0.0%) |
| 6 to 11 Years | 0 (0.0%) | 9 (3.1%) |
| 12 to 14 Years | 37 (30.1%) | 0 (0.0%) |
| 15 Years | 0 (0.0%) | 0 (0.0%) |
| 16 and 17 Years | 0 (0.0%) | 0 (0.0%) |
| 18 to 24 Years | 85 (19.5%) | 83 (33.5%) |
| 25 to 34 Years | 18 (4.7%) | 0 (0.0%) |
| 35 to 44 Years | 0 (0.0%) | 0 (0.0%) |
| 45 to 54 Years | 0 (0.0%) | 14 (3.8%) |
| 55 to 64 Years | 23 (4.3%) | 18 (3.6%) |
| 65 to 74 Years | 15 (4.4%) | 19 (5.2%) |
| 75 Years and over | 19 (5.2%) | 18 (3.6%) |
| Total | 197 (5.5%) | 161 (5.2%) |
Income Above Poverty by Sex and Age in Vandenberg Village
According to the poverty statistics in Vandenberg Village, males aged under 5 years and females aged under 5 years are the age groups that are most secure financially, with 100.0% of males and 100.0% of females in these age groups living above the poverty line.
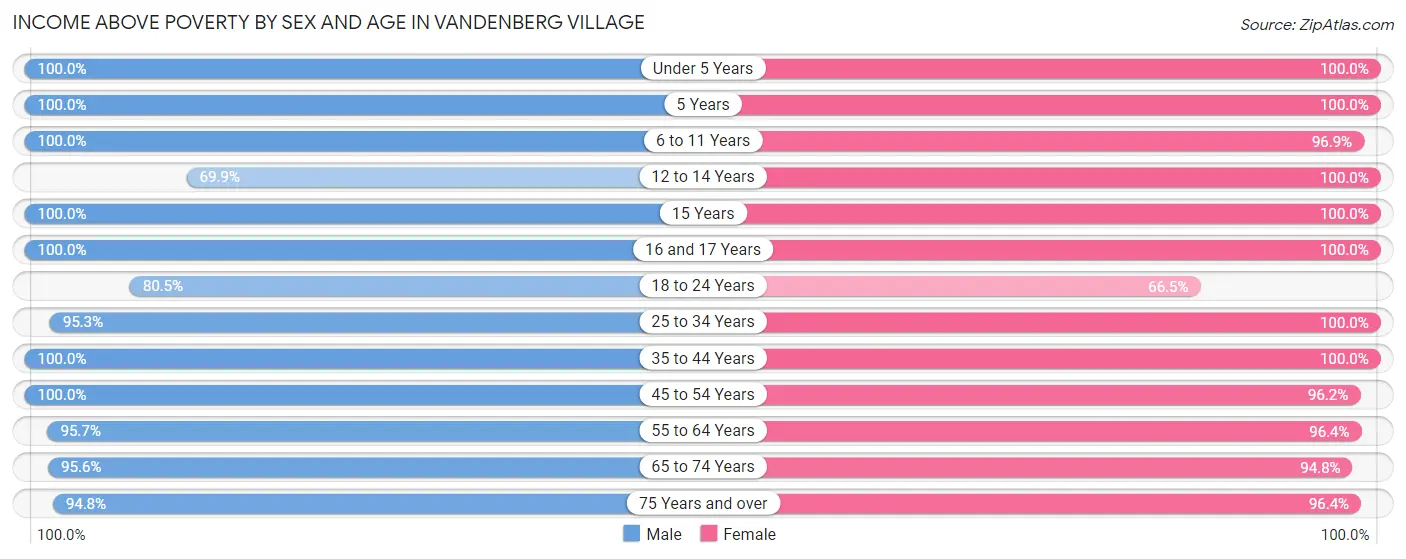
| Age Bracket | Male | Female |
| Under 5 Years | 127 (100.0%) | 62 (100.0%) |
| 5 Years | 49 (100.0%) | 39 (100.0%) |
| 6 to 11 Years | 285 (100.0%) | 282 (96.9%) |
| 12 to 14 Years | 86 (69.9%) | 104 (100.0%) |
| 15 Years | 30 (100.0%) | 11 (100.0%) |
| 16 and 17 Years | 86 (100.0%) | 42 (100.0%) |
| 18 to 24 Years | 350 (80.5%) | 165 (66.5%) |
| 25 to 34 Years | 367 (95.3%) | 251 (100.0%) |
| 35 to 44 Years | 304 (100.0%) | 340 (100.0%) |
| 45 to 54 Years | 489 (100.0%) | 353 (96.2%) |
| 55 to 64 Years | 516 (95.7%) | 486 (96.4%) |
| 65 to 74 Years | 328 (95.6%) | 344 (94.8%) |
| 75 Years and over | 343 (94.8%) | 477 (96.4%) |
| Total | 3,360 (94.5%) | 2,956 (94.8%) |
Income Below Poverty Among Married-Couple Families in Vandenberg Village
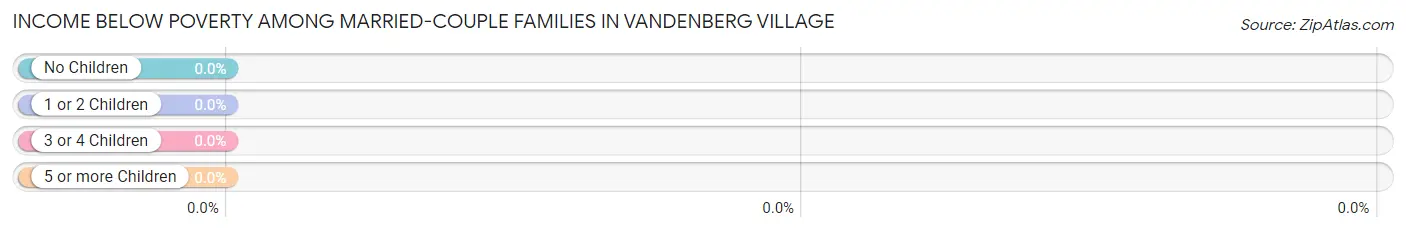
| Children | Above Poverty | Below Poverty |
| No Children | 997 (100.0%) | 0 (0.0%) |
| 1 or 2 Children | 419 (100.0%) | 0 (0.0%) |
| 3 or 4 Children | 102 (100.0%) | 0 (0.0%) |
| 5 or more Children | 16 (100.0%) | 0 (0.0%) |
| Total | 1,534 (100.0%) | 0 (0.0%) |
Income Below Poverty Among Single-Parent Households in Vandenberg Village
According to the poverty data in Vandenberg Village, 9.8% or 13 single-father households and 12.7% or 23 single-mother households are living below the poverty line. Among single-father households, those with no children have the highest poverty rate, with 13 households (15.5%) experiencing poverty. Likewise, among single-mother households, those with 1 or 2 children have the highest poverty rate, with 23 households (60.5%) falling below the poverty line.
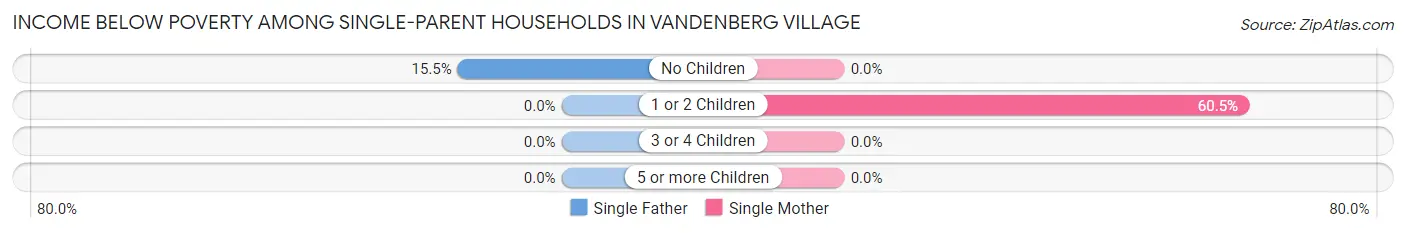
| Children | Single Father | Single Mother |
| No Children | 13 (15.5%) | 0 (0.0%) |
| 1 or 2 Children | 0 (0.0%) | 23 (60.5%) |
| 3 or 4 Children | 0 (0.0%) | 0 (0.0%) |
| 5 or more Children | 0 (0.0%) | 0 (0.0%) |
| Total | 13 (9.8%) | 23 (12.7%) |
Income Below Poverty Among Married-Couple vs Single-Parent Households in Vandenberg Village
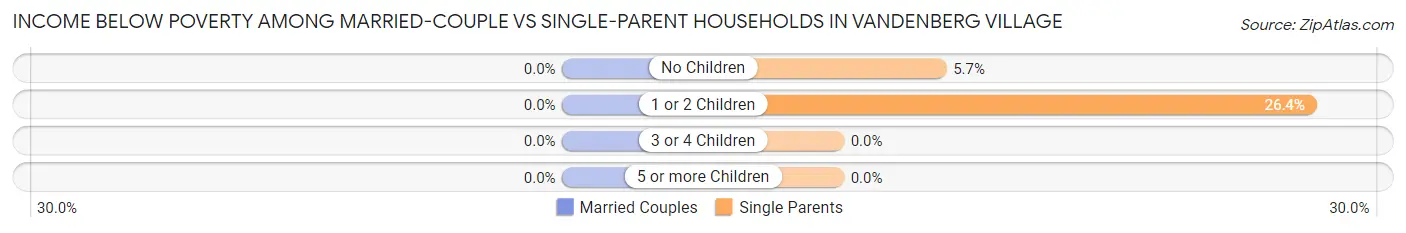
| Children | Married-Couple Families | Single-Parent Households |
| No Children | 0 (0.0%) | 13 (5.7%) |
| 1 or 2 Children | 0 (0.0%) | 23 (26.4%) |
| 3 or 4 Children | 0 (0.0%) | 0 (0.0%) |
| 5 or more Children | 0 (0.0%) | 0 (0.0%) |
| Total | 0 (0.0%) | 36 (11.5%) |
Race in Vandenberg Village
The most populous races in Vandenberg Village are White / Caucasian (4,462 | 66.6%), Hispanic or Latino (1,851 | 27.6%), and Some other Race (794 | 11.8%).
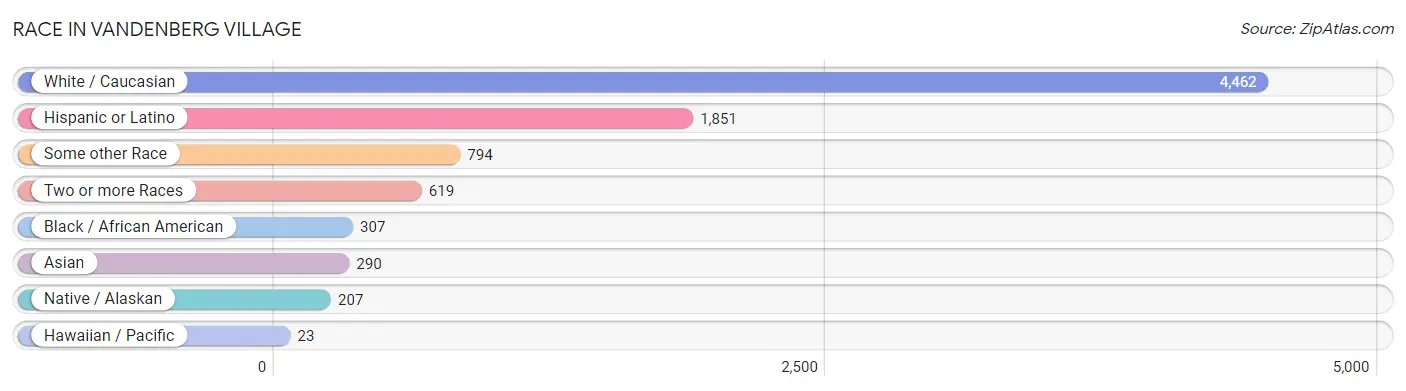
| Race | # Population | % Population |
| Asian | 290 | 4.3% |
| Black / African American | 307 | 4.6% |
| Hawaiian / Pacific | 23 | 0.3% |
| Hispanic or Latino | 1,851 | 27.6% |
| Native / Alaskan | 207 | 3.1% |
| White / Caucasian | 4,462 | 66.6% |
| Two or more Races | 619 | 9.2% |
| Some other Race | 794 | 11.8% |
| Total | 6,702 | 100.0% |
Ancestry in Vandenberg Village
The most populous ancestries reported in Vandenberg Village are Mexican (1,547 | 23.1%), English (769 | 11.5%), German (707 | 10.5%), Irish (655 | 9.8%), and American (385 | 5.7%), together accounting for 60.6% of all Vandenberg Village residents.
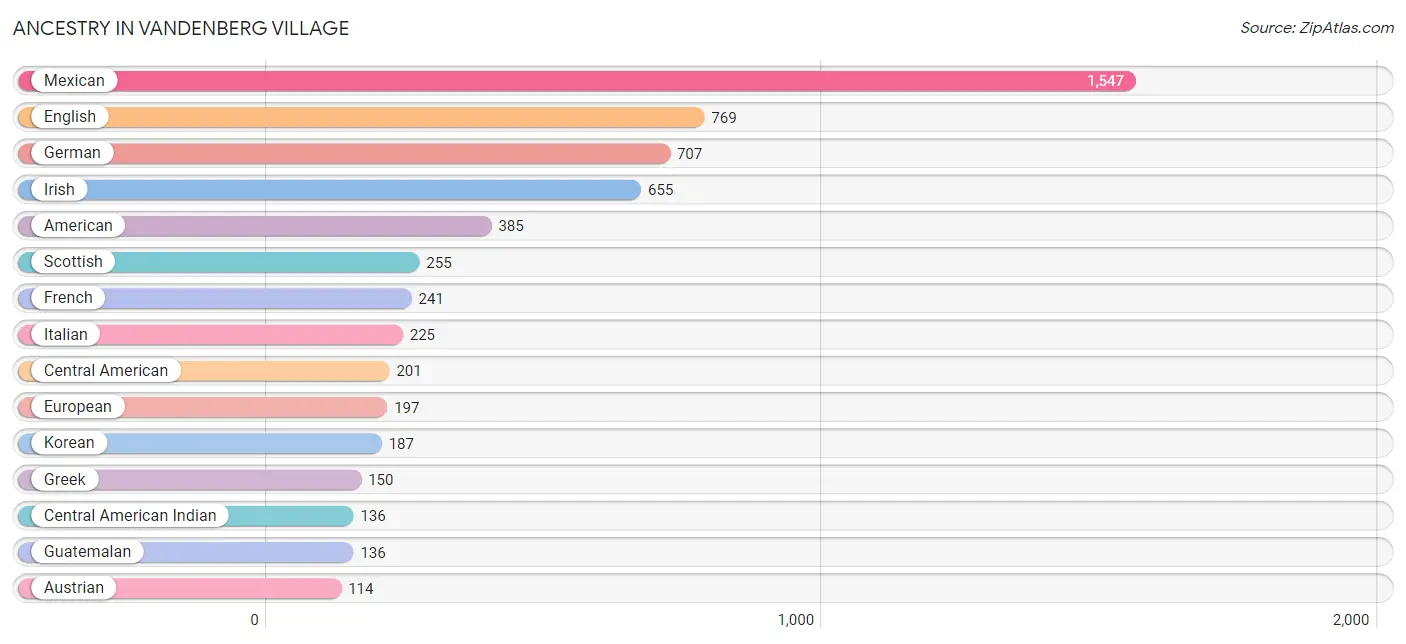
| Ancestry | # Population | % Population |
| African | 7 | 0.1% |
| American | 385 | 5.7% |
| Arab | 55 | 0.8% |
| Austrian | 114 | 1.7% |
| Belizean | 1 | 0.0% |
| Bhutanese | 107 | 1.6% |
| Blackfeet | 1 | 0.0% |
| British | 38 | 0.6% |
| Central American | 201 | 3.0% |
| Central American Indian | 136 | 2.0% |
| Chilean | 15 | 0.2% |
| Czechoslovakian | 15 | 0.2% |
| Danish | 65 | 1.0% |
| Dutch | 84 | 1.3% |
| English | 769 | 11.5% |
| European | 197 | 2.9% |
| Finnish | 15 | 0.2% |
| French | 241 | 3.6% |
| French Canadian | 62 | 0.9% |
| German | 707 | 10.5% |
| Greek | 150 | 2.2% |
| Guatemalan | 136 | 2.0% |
| Honduran | 30 | 0.4% |
| Indian (Asian) | 86 | 1.3% |
| Iranian | 17 | 0.3% |
| Irish | 655 | 9.8% |
| Italian | 225 | 3.4% |
| Korean | 187 | 2.8% |
| Mexican | 1,547 | 23.1% |
| Mexican American Indian | 102 | 1.5% |
| Navajo | 1 | 0.0% |
| Northern European | 21 | 0.3% |
| Norwegian | 39 | 0.6% |
| Peruvian | 30 | 0.4% |
| Polish | 31 | 0.5% |
| Portuguese | 59 | 0.9% |
| Puerto Rican | 12 | 0.2% |
| Russian | 16 | 0.2% |
| Salvadoran | 35 | 0.5% |
| Scotch-Irish | 113 | 1.7% |
| Scottish | 255 | 3.8% |
| South American | 45 | 0.7% |
| Spanish | 26 | 0.4% |
| Subsaharan African | 7 | 0.1% |
| Swedish | 37 | 0.5% |
| Swiss | 18 | 0.3% |
| Syrian | 55 | 0.8% |
| Tongan | 38 | 0.6% |
| Ukrainian | 16 | 0.2% |
| Welsh | 11 | 0.2% | View All 50 Rows |
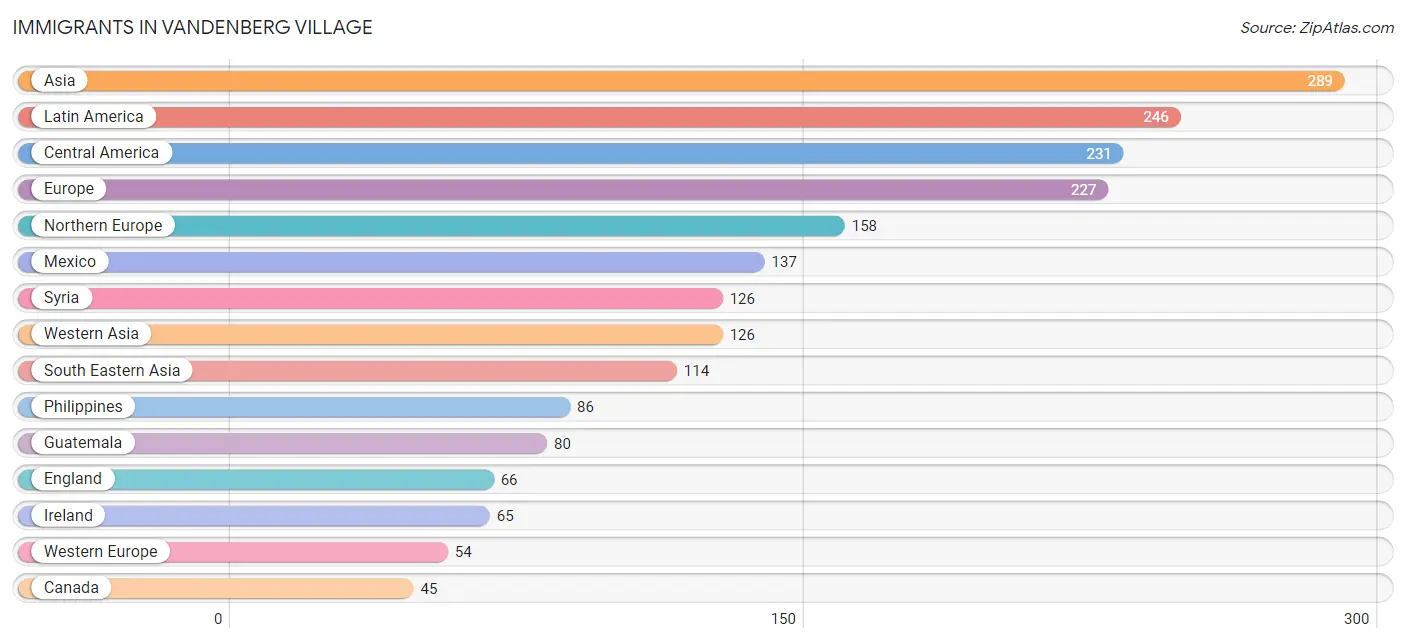
Immigrants in Vandenberg Village
The most numerous immigrant groups reported in Vandenberg Village came from Asia (289 | 4.3%), Latin America (246 | 3.7%), Central America (231 | 3.5%), Europe (227 | 3.4%), and Northern Europe (158 | 2.4%), together accounting for 17.2% of all Vandenberg Village residents.
| Immigration Origin | # Population | % Population |
| Asia | 289 | 4.3% |
| Australia | 39 | 0.6% |
| Canada | 45 | 0.7% |
| Central America | 231 | 3.5% |
| Chile | 15 | 0.2% |
| Denmark | 27 | 0.4% |
| Eastern Asia | 35 | 0.5% |
| England | 66 | 1.0% |
| Europe | 227 | 3.4% |
| France | 37 | 0.5% |
| Germany | 3 | 0.0% |
| Guatemala | 80 | 1.2% |
| Honduras | 14 | 0.2% |
| India | 14 | 0.2% |
| Ireland | 65 | 1.0% |
| Japan | 35 | 0.5% |
| Laos | 28 | 0.4% |
| Latin America | 246 | 3.7% |
| Mexico | 137 | 2.0% |
| Netherlands | 14 | 0.2% |
| Northern Europe | 158 | 2.4% |
| Oceania | 39 | 0.6% |
| Philippines | 86 | 1.3% |
| Portugal | 15 | 0.2% |
| South America | 15 | 0.2% |
| South Central Asia | 14 | 0.2% |
| South Eastern Asia | 114 | 1.7% |
| Southern Europe | 15 | 0.2% |
| Syria | 126 | 1.9% |
| Western Asia | 126 | 1.9% |
| Western Europe | 54 | 0.8% | View All 31 Rows |
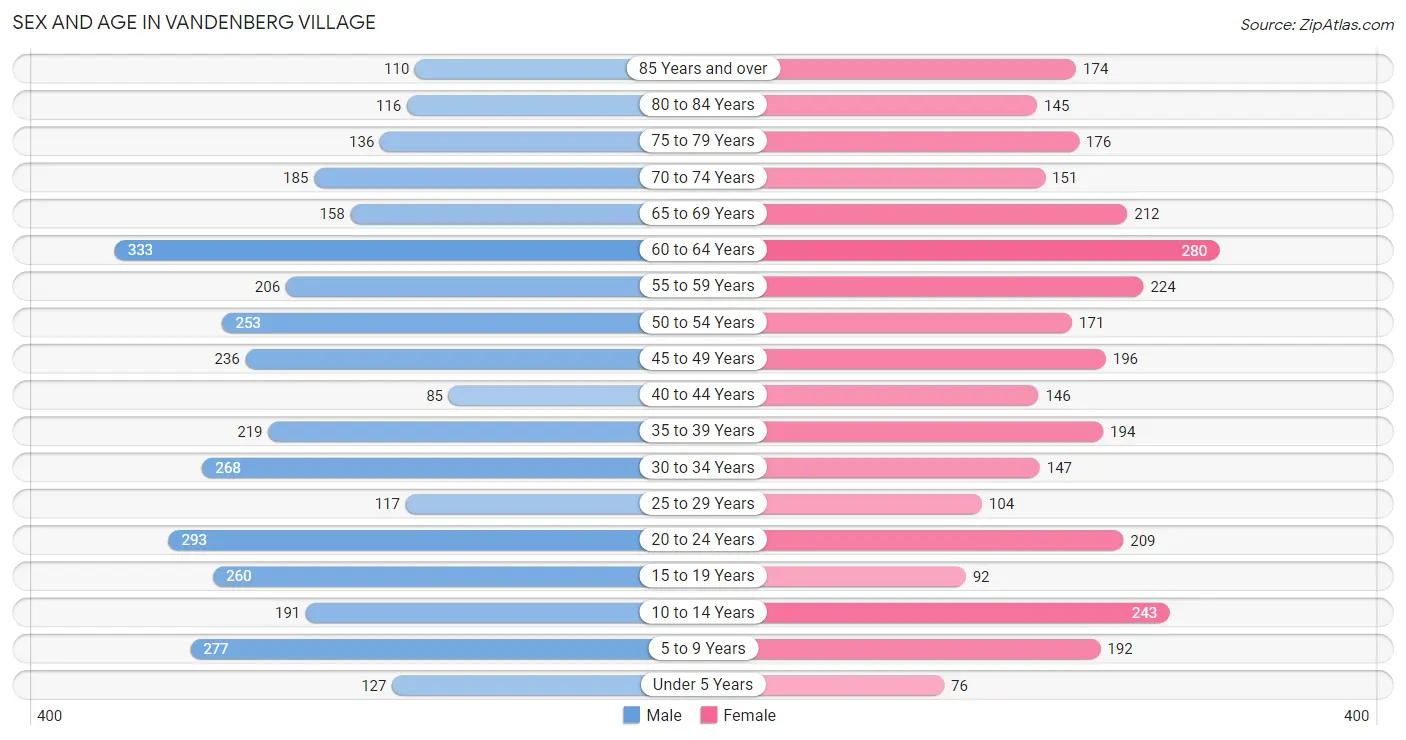
Sex and Age in Vandenberg Village
Sex and Age in Vandenberg Village
The most populous age groups in Vandenberg Village are 60 to 64 Years (333 | 9.3%) for men and 60 to 64 Years (280 | 8.9%) for women.
| Age Bracket | Male | Female |
| Under 5 Years | 127 (3.6%) | 76 (2.4%) |
| 5 to 9 Years | 277 (7.8%) | 192 (6.1%) |
| 10 to 14 Years | 191 (5.3%) | 243 (7.8%) |
| 15 to 19 Years | 260 (7.3%) | 92 (2.9%) |
| 20 to 24 Years | 293 (8.2%) | 209 (6.7%) |
| 25 to 29 Years | 117 (3.3%) | 104 (3.3%) |
| 30 to 34 Years | 268 (7.5%) | 147 (4.7%) |
| 35 to 39 Years | 219 (6.1%) | 194 (6.2%) |
| 40 to 44 Years | 85 (2.4%) | 146 (4.7%) |
| 45 to 49 Years | 236 (6.6%) | 196 (6.3%) |
| 50 to 54 Years | 253 (7.1%) | 171 (5.5%) |
| 55 to 59 Years | 206 (5.8%) | 224 (7.1%) |
| 60 to 64 Years | 333 (9.3%) | 280 (8.9%) |
| 65 to 69 Years | 158 (4.4%) | 212 (6.8%) |
| 70 to 74 Years | 185 (5.2%) | 151 (4.8%) |
| 75 to 79 Years | 136 (3.8%) | 176 (5.6%) |
| 80 to 84 Years | 116 (3.3%) | 145 (4.6%) |
| 85 Years and over | 110 (3.1%) | 174 (5.6%) |
| Total | 3,570 (100.0%) | 3,132 (100.0%) |
Families and Households in Vandenberg Village
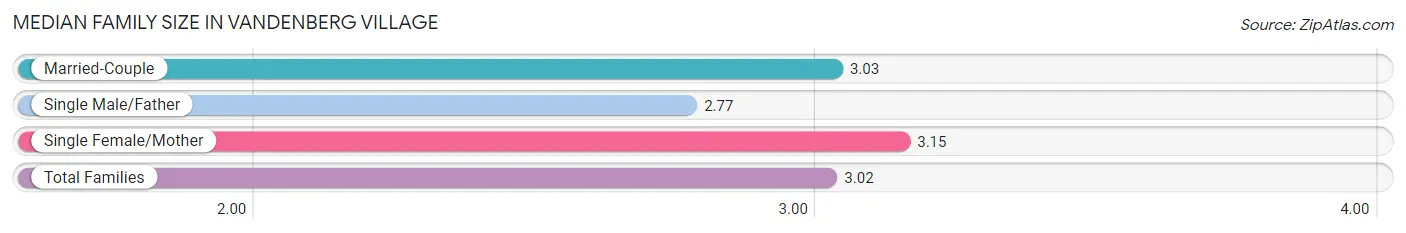
Median Family Size in Vandenberg Village
The median family size in Vandenberg Village is 3.02 persons per family, with single female/mother families (181 | 9.8%) accounting for the largest median family size of 3.15 persons per family. On the other hand, single male/father families (133 | 7.2%) represent the smallest median family size with 2.77 persons per family.
| Family Type | # Families | Family Size |
| Married-Couple | 1,534 (83.0%) | 3.03 |
| Single Male/Father | 133 (7.2%) | 2.77 |
| Single Female/Mother | 181 (9.8%) | 3.15 |
| Total Families | 1,848 (100.0%) | 3.02 |
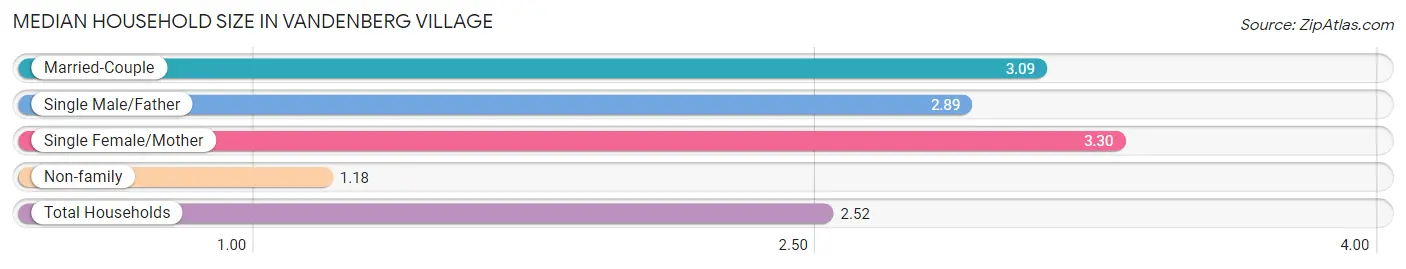
Median Household Size in Vandenberg Village
The median household size in Vandenberg Village is 2.52 persons per household, with single female/mother households (181 | 6.8%) accounting for the largest median household size of 3.3 persons per household. non-family households (799 | 30.2%) represent the smallest median household size with 1.18 persons per household.
| Household Type | # Households | Household Size |
| Married-Couple | 1,534 (58.0%) | 3.09 |
| Single Male/Father | 133 (5.0%) | 2.89 |
| Single Female/Mother | 181 (6.8%) | 3.30 |
| Non-family | 799 (30.2%) | 1.18 |
| Total Households | 2,647 (100.0%) | 2.52 |
Household Size by Marriage Status in Vandenberg Village
Out of a total of 2,647 households in Vandenberg Village, 1,848 (69.8%) are family households, while 799 (30.2%) are nonfamily households. The most numerous type of family households are 2-person households, comprising 991, and the most common type of nonfamily households are 1-person households, comprising 708.
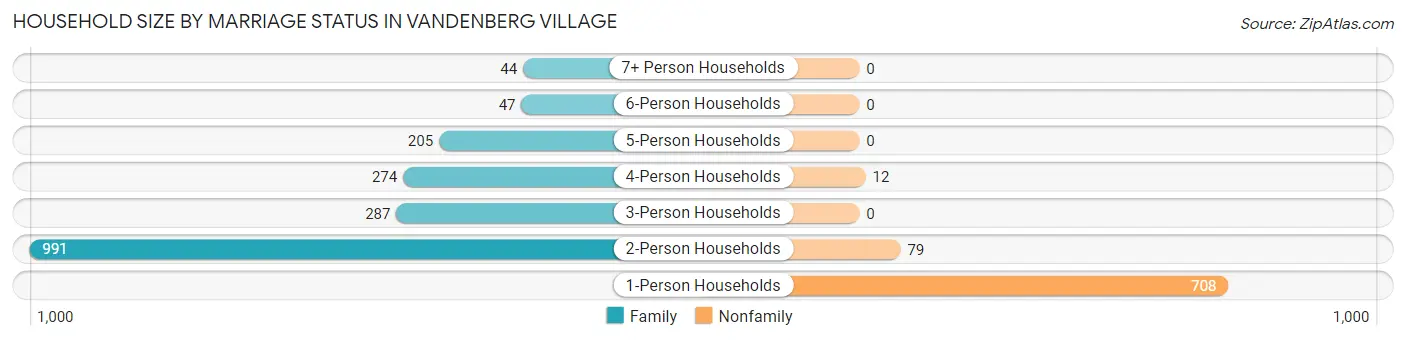
| Household Size | Family Households | Nonfamily Households |
| 1-Person Households | - | 708 (26.8%) |
| 2-Person Households | 991 (37.4%) | 79 (3.0%) |
| 3-Person Households | 287 (10.8%) | 0 (0.0%) |
| 4-Person Households | 274 (10.3%) | 12 (0.4%) |
| 5-Person Households | 205 (7.7%) | 0 (0.0%) |
| 6-Person Households | 47 (1.8%) | 0 (0.0%) |
| 7+ Person Households | 44 (1.7%) | 0 (0.0%) |
| Total | 1,848 (69.8%) | 799 (30.2%) |
Female Fertility in Vandenberg Village
Fertility by Age in Vandenberg Village
Average fertility rate in Vandenberg Village is 37.0 births per 1,000 women. Women in the age bracket of 20 to 34 years have the highest fertility rate with 91.0 births per 1,000 women. Women in the age bracket of 20 to 34 years acount for 100.0% of all women with births.
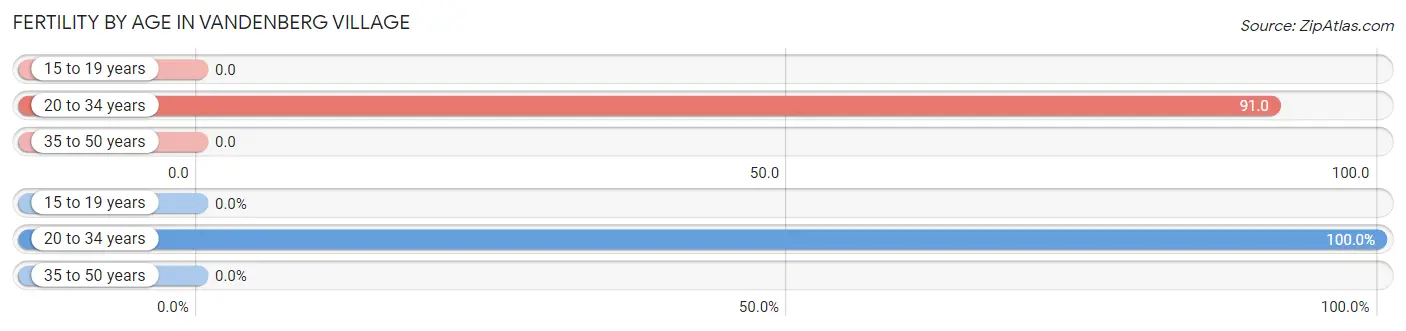
| Age Bracket | Women with Births | Births / 1,000 Women |
| 15 to 19 years | 0 (0.0%) | 0.0 |
| 20 to 34 years | 42 (100.0%) | 91.0 |
| 35 to 50 years | 0 (0.0%) | 0.0 |
| Total | 42 (100.0%) | 37.0 |
Fertility by Age by Marriage Status in Vandenberg Village
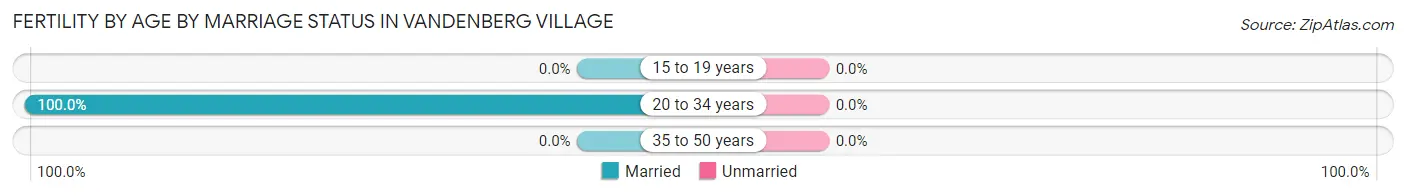
| Age Bracket | Married | Unmarried |
| 15 to 19 years | 0 (0.0%) | 0 (0.0%) |
| 20 to 34 years | 42 (100.0%) | 0 (0.0%) |
| 35 to 50 years | 0 (0.0%) | 0 (0.0%) |
| Total | 42 (100.0%) | 0 (0.0%) |
Fertility by Education in Vandenberg Village
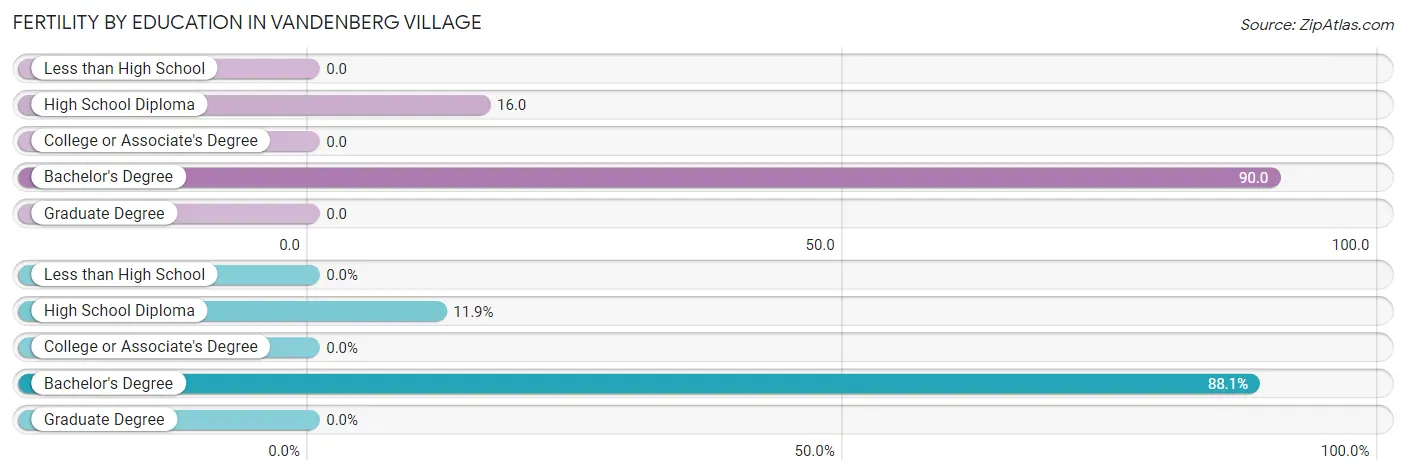
| Educational Attainment | Women with Births | Births / 1,000 Women |
| Less than High School | 0 (0.0%) | 0.0 |
| High School Diploma | 5 (11.9%) | 16.0 |
| College or Associate's Degree | 0 (0.0%) | 0.0 |
| Bachelor's Degree | 37 (88.1%) | 90.0 |
| Graduate Degree | 0 (0.0%) | 0.0 |
| Total | 42 (100.0%) | 37.0 |
Fertility by Education by Marriage Status in Vandenberg Village
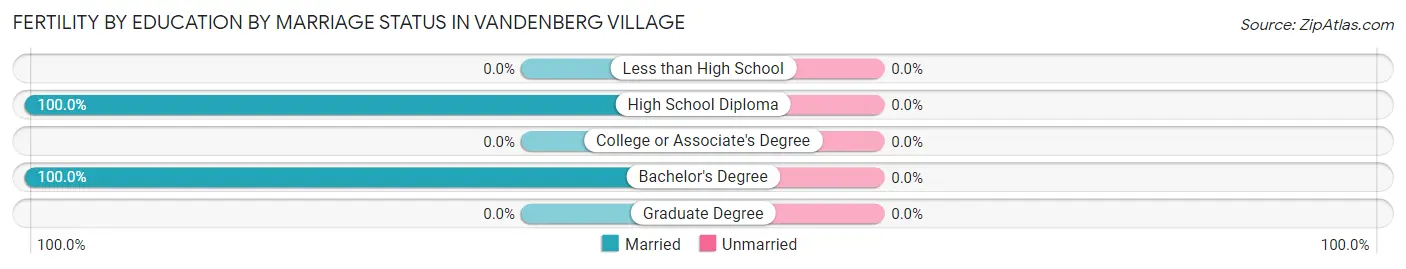
| Educational Attainment | Married | Unmarried |
| Less than High School | 0 (0.0%) | 0 (0.0%) |
| High School Diploma | 5 (100.0%) | 0 (0.0%) |
| College or Associate's Degree | 0 (0.0%) | 0 (0.0%) |
| Bachelor's Degree | 37 (100.0%) | 0 (0.0%) |
| Graduate Degree | 0 (0.0%) | 0 (0.0%) |
| Total | 42 (100.0%) | 0 (0.0%) |
Employment Characteristics in Vandenberg Village
Employment by Class of Employer in Vandenberg Village
Among the 3,141 employed individuals in Vandenberg Village, private company employees (1,741 | 55.4%), local government employees (431 | 13.7%), and federal government employees (353 | 11.2%) make up the most common classes of employment.
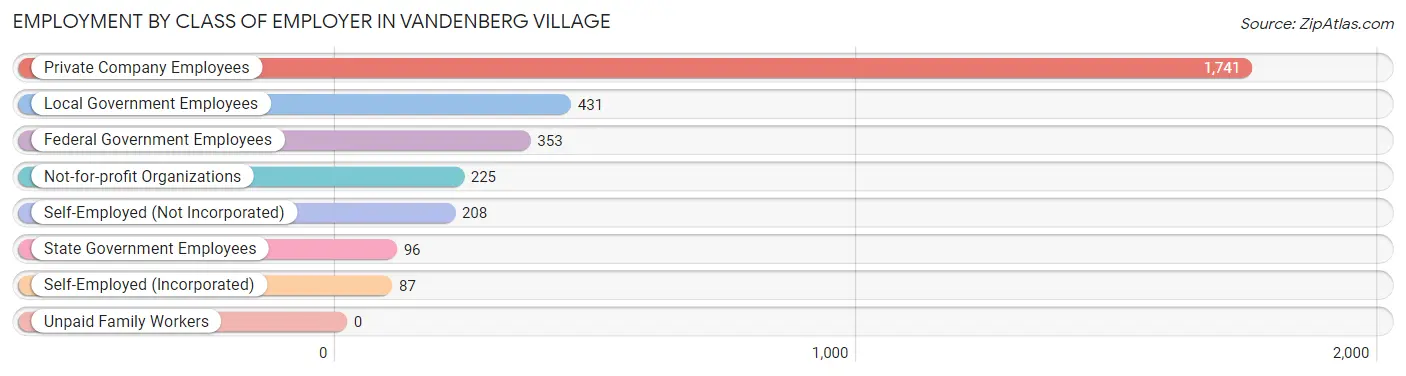
| Employer Class | # Employees | % Employees |
| Private Company Employees | 1,741 | 55.4% |
| Self-Employed (Incorporated) | 87 | 2.8% |
| Self-Employed (Not Incorporated) | 208 | 6.6% |
| Not-for-profit Organizations | 225 | 7.2% |
| Local Government Employees | 431 | 13.7% |
| State Government Employees | 96 | 3.1% |
| Federal Government Employees | 353 | 11.2% |
| Unpaid Family Workers | 0 | 0.0% |
| Total | 3,141 | 100.0% |
Employment Status by Age in Vandenberg Village
According to the labor force statistics for Vandenberg Village, out of the total population over 16 years of age (5,553), 63.2% or 3,509 individuals are in the labor force, with 7.1% or 249 of them unemployed. The age group with the highest labor force participation rate is 35 to 44 years, with 91.9% or 592 individuals in the labor force. Within the labor force, the 75 years and over age range has the highest percentage of unemployed individuals, with 80.6% or 50 of them being unemployed.
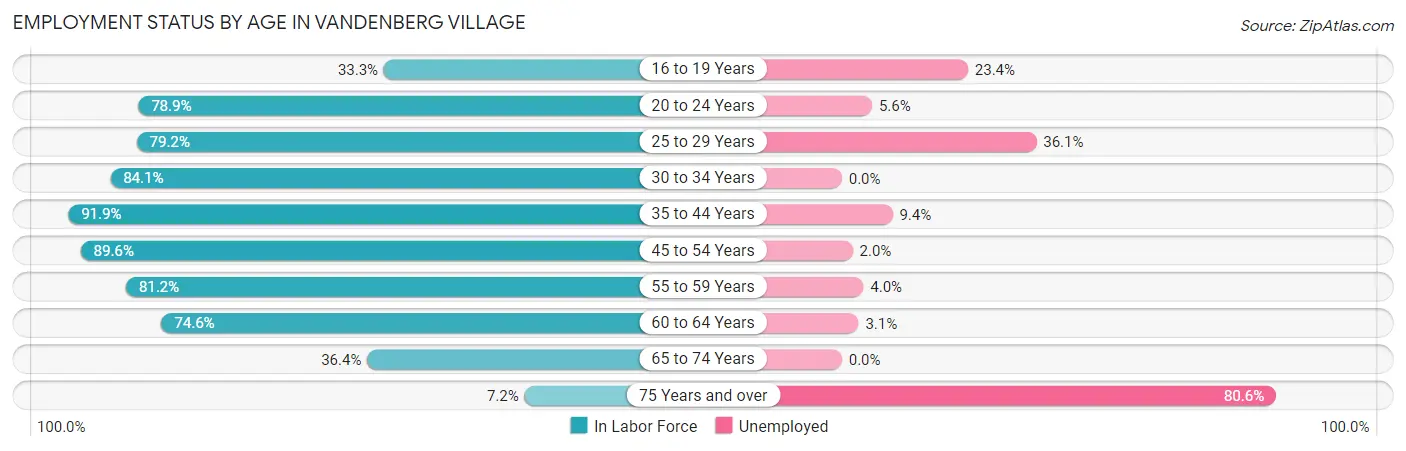
| Age Bracket | In Labor Force | Unemployed |
| 16 to 19 Years | 103 (33.3%) | 24 (23.4%) |
| 20 to 24 Years | 396 (78.9%) | 22 (5.6%) |
| 25 to 29 Years | 175 (79.2%) | 63 (36.1%) |
| 30 to 34 Years | 349 (84.1%) | 0 (0.0%) |
| 35 to 44 Years | 592 (91.9%) | 56 (9.4%) |
| 45 to 54 Years | 767 (89.6%) | 15 (2.0%) |
| 55 to 59 Years | 349 (81.2%) | 14 (4.0%) |
| 60 to 64 Years | 457 (74.6%) | 14 (3.1%) |
| 65 to 74 Years | 257 (36.4%) | 0 (0.0%) |
| 75 Years and over | 62 (7.2%) | 50 (80.6%) |
| Total | 3,509 (63.2%) | 249 (7.1%) |
Employment Status by Educational Attainment in Vandenberg Village
According to labor force statistics for Vandenberg Village, 84.6% of individuals (2,689) out of the total population between 25 and 64 years of age (3,179) are in the labor force, with 6.0% or 161 of them being unemployed. The group with the highest labor force participation rate are those with the educational attainment of bachelor's degree or higher, with 88.9% or 900 individuals in the labor force. Within the labor force, individuals with less than high school education have the highest percentage of unemployment, with 52.0% or 66 of them being unemployed.
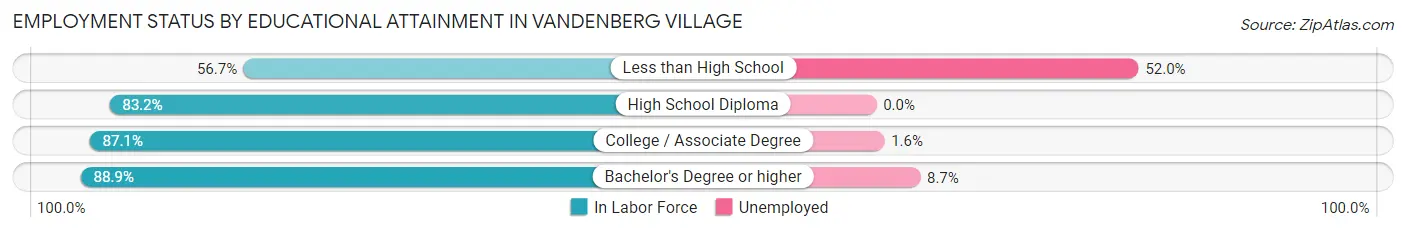
| Educational Attainment | In Labor Force | Unemployed |
| Less than High School | 127 (56.7%) | 116 (52.0%) |
| High School Diploma | 656 (83.2%) | 0 (0.0%) |
| College / Associate Degree | 1,006 (87.1%) | 18 (1.6%) |
| Bachelor's Degree or higher | 900 (88.9%) | 88 (8.7%) |
| Total | 2,689 (84.6%) | 191 (6.0%) |
Employment Occupations by Sex in Vandenberg Village
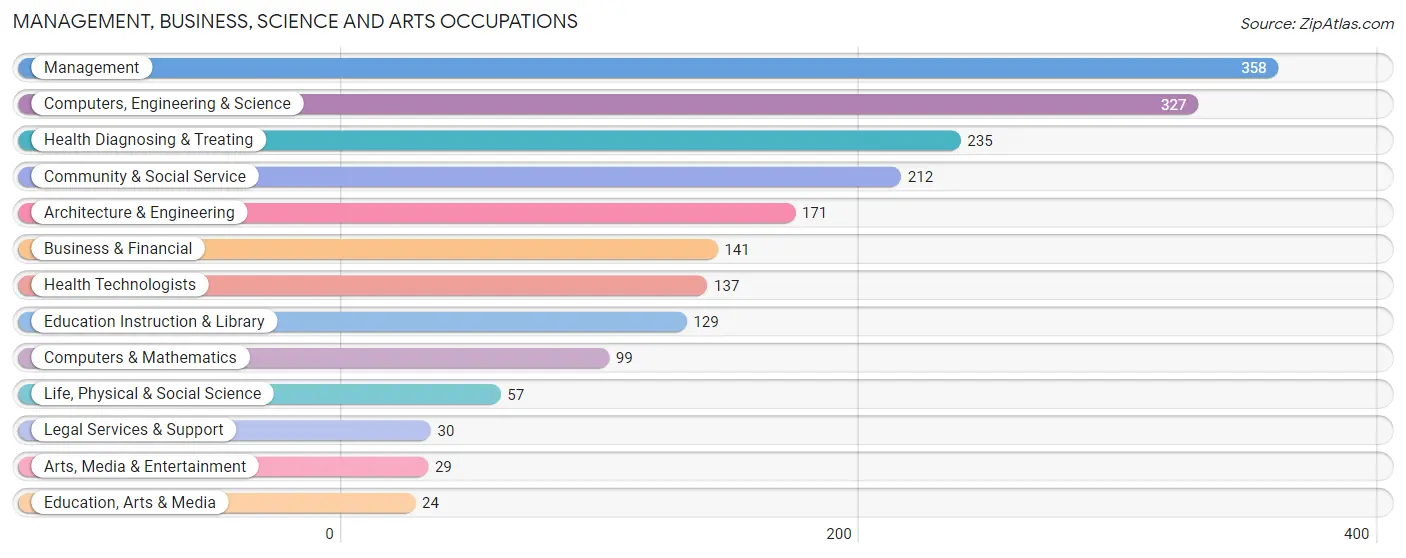
Management, Business, Science and Arts Occupations
The most common Management, Business, Science and Arts occupations in Vandenberg Village are Management (358 | 11.8%), Computers, Engineering & Science (327 | 10.8%), Health Diagnosing & Treating (235 | 7.7%), Community & Social Service (212 | 7.0%), and Architecture & Engineering (171 | 5.6%).
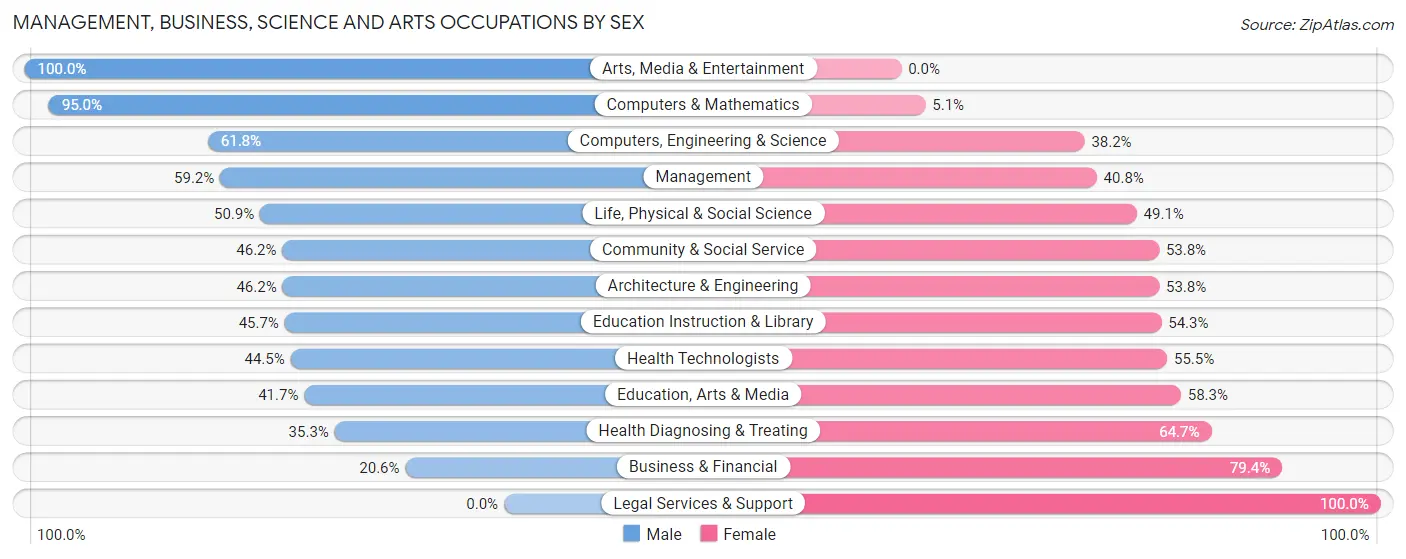
Management, Business, Science and Arts Occupations by Sex
Within the Management, Business, Science and Arts occupations in Vandenberg Village, the most male-oriented occupations are Arts, Media & Entertainment (100.0%), Computers & Mathematics (95.0%), and Computers, Engineering & Science (61.8%), while the most female-oriented occupations are Legal Services & Support (100.0%), Business & Financial (79.4%), and Health Diagnosing & Treating (64.7%).
| Occupation | Male | Female |
| Management | 212 (59.2%) | 146 (40.8%) |
| Business & Financial | 29 (20.6%) | 112 (79.4%) |
| Computers, Engineering & Science | 202 (61.8%) | 125 (38.2%) |
| Computers & Mathematics | 94 (95.0%) | 5 (5.1%) |
| Architecture & Engineering | 79 (46.2%) | 92 (53.8%) |
| Life, Physical & Social Science | 29 (50.9%) | 28 (49.1%) |
| Community & Social Service | 98 (46.2%) | 114 (53.8%) |
| Education, Arts & Media | 10 (41.7%) | 14 (58.3%) |
| Legal Services & Support | 0 (0.0%) | 30 (100.0%) |
| Education Instruction & Library | 59 (45.7%) | 70 (54.3%) |
| Arts, Media & Entertainment | 29 (100.0%) | 0 (0.0%) |
| Health Diagnosing & Treating | 83 (35.3%) | 152 (64.7%) |
| Health Technologists | 61 (44.5%) | 76 (55.5%) |
| Total (Category) | 624 (49.0%) | 649 (51.0%) |
| Total (Overall) | 1,685 (55.4%) | 1,354 (44.6%) |
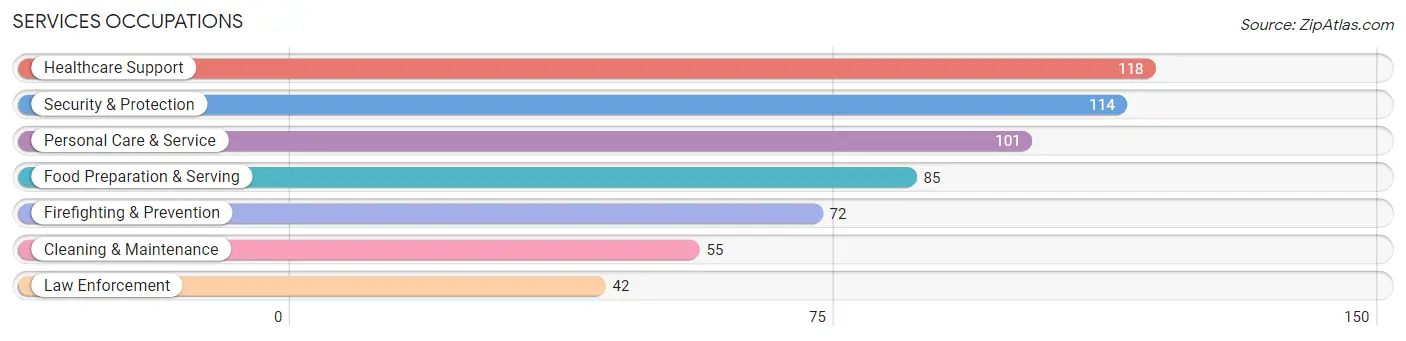
Services Occupations
The most common Services occupations in Vandenberg Village are Healthcare Support (118 | 3.9%), Security & Protection (114 | 3.7%), Personal Care & Service (101 | 3.3%), Food Preparation & Serving (85 | 2.8%), and Firefighting & Prevention (72 | 2.4%).
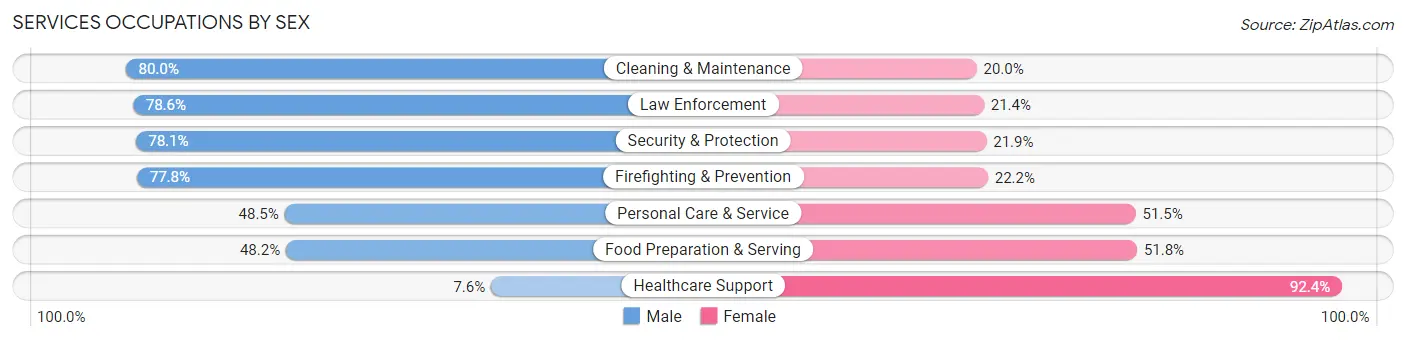
Services Occupations by Sex
Within the Services occupations in Vandenberg Village, the most male-oriented occupations are Cleaning & Maintenance (80.0%), Law Enforcement (78.6%), and Security & Protection (78.1%), while the most female-oriented occupations are Healthcare Support (92.4%), Food Preparation & Serving (51.8%), and Personal Care & Service (51.5%).
| Occupation | Male | Female |
| Healthcare Support | 9 (7.6%) | 109 (92.4%) |
| Security & Protection | 89 (78.1%) | 25 (21.9%) |
| Firefighting & Prevention | 56 (77.8%) | 16 (22.2%) |
| Law Enforcement | 33 (78.6%) | 9 (21.4%) |
| Food Preparation & Serving | 41 (48.2%) | 44 (51.8%) |
| Cleaning & Maintenance | 44 (80.0%) | 11 (20.0%) |
| Personal Care & Service | 49 (48.5%) | 52 (51.5%) |
| Total (Category) | 232 (49.0%) | 241 (50.9%) |
| Total (Overall) | 1,685 (55.4%) | 1,354 (44.6%) |
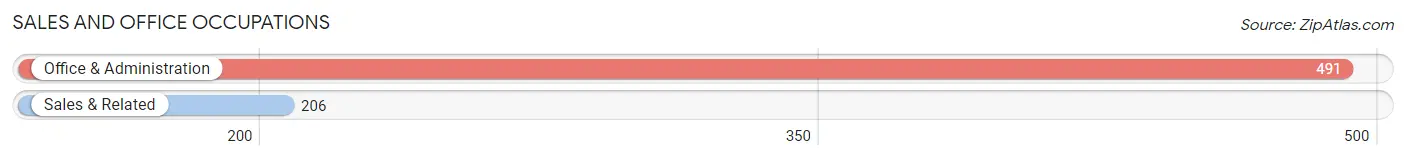
Sales and Office Occupations
The most common Sales and Office occupations in Vandenberg Village are Office & Administration (491 | 16.2%), and Sales & Related (206 | 6.8%).
Sales and Office Occupations by Sex
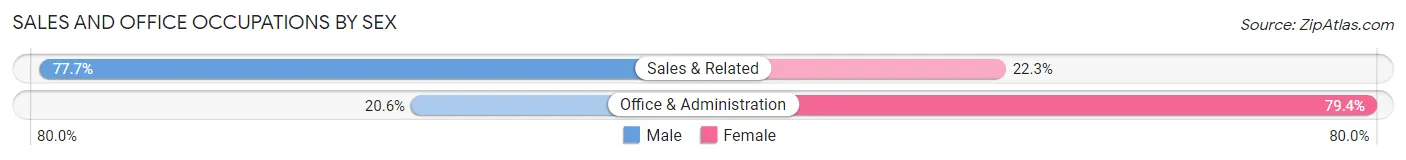
| Occupation | Male | Female |
| Sales & Related | 160 (77.7%) | 46 (22.3%) |
| Office & Administration | 101 (20.6%) | 390 (79.4%) |
| Total (Category) | 261 (37.4%) | 436 (62.5%) |
| Total (Overall) | 1,685 (55.4%) | 1,354 (44.6%) |
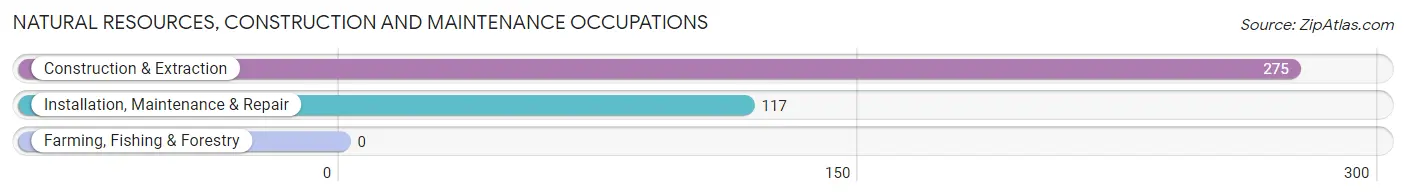
Natural Resources, Construction and Maintenance Occupations
The most common Natural Resources, Construction and Maintenance occupations in Vandenberg Village are Construction & Extraction (275 | 9.0%), and Installation, Maintenance & Repair (117 | 3.8%).
Natural Resources, Construction and Maintenance Occupations by Sex
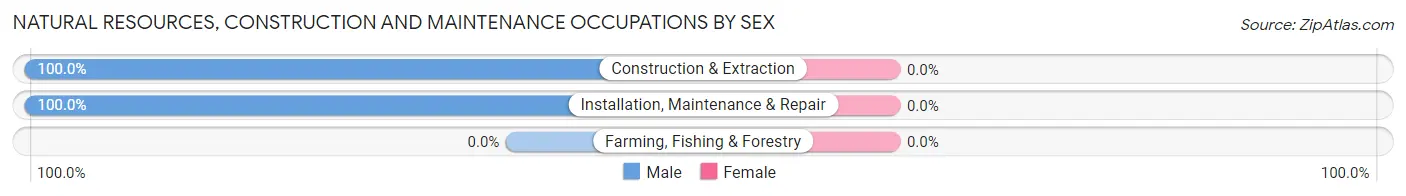
| Occupation | Male | Female |
| Farming, Fishing & Forestry | 0 (0.0%) | 0 (0.0%) |
| Construction & Extraction | 275 (100.0%) | 0 (0.0%) |
| Installation, Maintenance & Repair | 117 (100.0%) | 0 (0.0%) |
| Total (Category) | 392 (100.0%) | 0 (0.0%) |
| Total (Overall) | 1,685 (55.4%) | 1,354 (44.6%) |
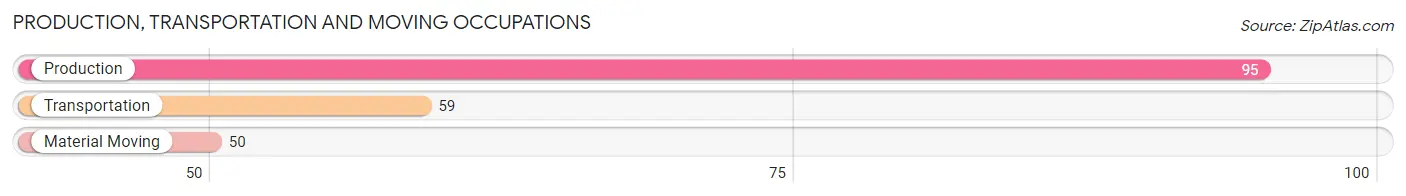
Production, Transportation and Moving Occupations
The most common Production, Transportation and Moving occupations in Vandenberg Village are Production (95 | 3.1%), Transportation (59 | 1.9%), and Material Moving (50 | 1.7%).
Production, Transportation and Moving Occupations by Sex
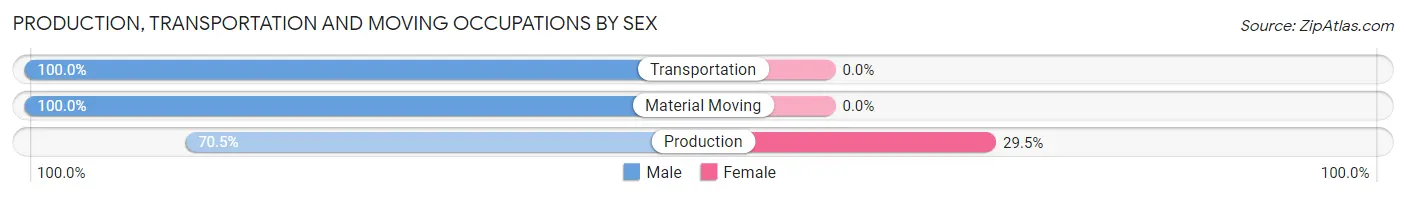
| Occupation | Male | Female |
| Production | 67 (70.5%) | 28 (29.5%) |
| Transportation | 59 (100.0%) | 0 (0.0%) |
| Material Moving | 50 (100.0%) | 0 (0.0%) |
| Total (Category) | 176 (86.3%) | 28 (13.7%) |
| Total (Overall) | 1,685 (55.4%) | 1,354 (44.6%) |
Employment Industries by Sex in Vandenberg Village
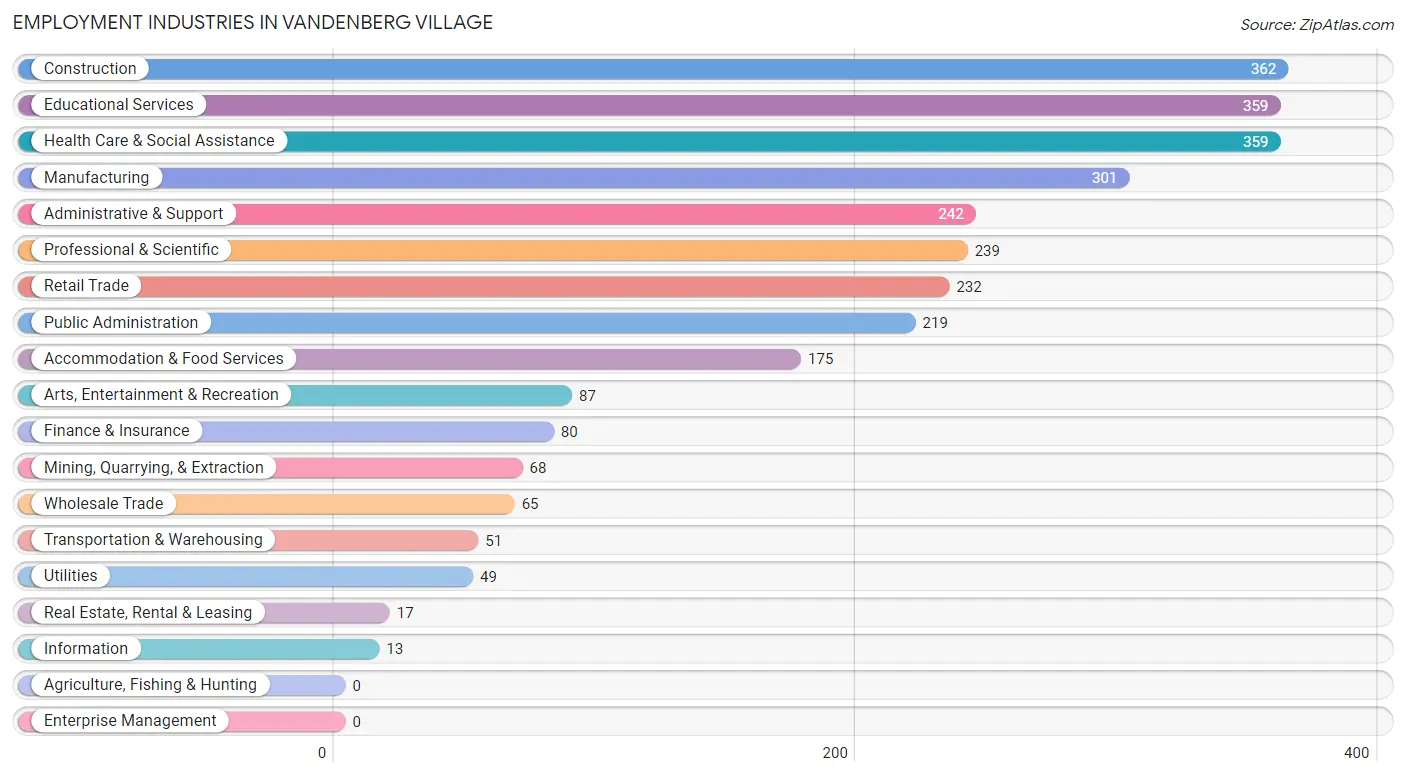
Employment Industries in Vandenberg Village
The major employment industries in Vandenberg Village include Construction (362 | 11.9%), Educational Services (359 | 11.8%), Health Care & Social Assistance (359 | 11.8%), Manufacturing (301 | 9.9%), and Administrative & Support (242 | 8.0%).
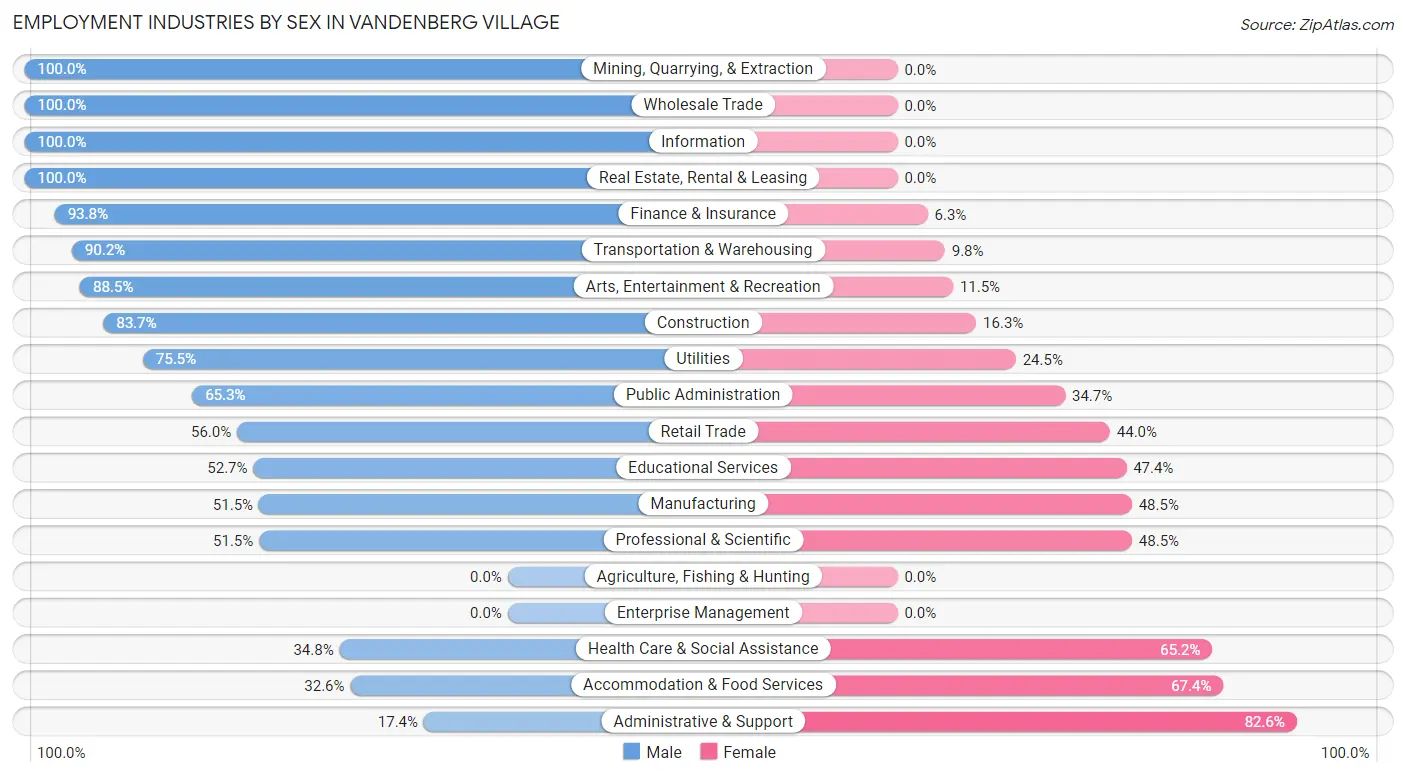
Employment Industries by Sex in Vandenberg Village
The Vandenberg Village industries that see more men than women are Mining, Quarrying, & Extraction (100.0%), Wholesale Trade (100.0%), and Information (100.0%), whereas the industries that tend to have a higher number of women are Administrative & Support (82.6%), Accommodation & Food Services (67.4%), and Health Care & Social Assistance (65.2%).
| Industry | Male | Female |
| Agriculture, Fishing & Hunting | 0 (0.0%) | 0 (0.0%) |
| Mining, Quarrying, & Extraction | 68 (100.0%) | 0 (0.0%) |
| Construction | 303 (83.7%) | 59 (16.3%) |
| Manufacturing | 155 (51.5%) | 146 (48.5%) |
| Wholesale Trade | 65 (100.0%) | 0 (0.0%) |
| Retail Trade | 130 (56.0%) | 102 (44.0%) |
| Transportation & Warehousing | 46 (90.2%) | 5 (9.8%) |
| Utilities | 37 (75.5%) | 12 (24.5%) |
| Information | 13 (100.0%) | 0 (0.0%) |
| Finance & Insurance | 75 (93.8%) | 5 (6.2%) |
| Real Estate, Rental & Leasing | 17 (100.0%) | 0 (0.0%) |
| Professional & Scientific | 123 (51.5%) | 116 (48.5%) |
| Enterprise Management | 0 (0.0%) | 0 (0.0%) |
| Administrative & Support | 42 (17.4%) | 200 (82.6%) |
| Educational Services | 189 (52.6%) | 170 (47.3%) |
| Health Care & Social Assistance | 125 (34.8%) | 234 (65.2%) |
| Arts, Entertainment & Recreation | 77 (88.5%) | 10 (11.5%) |
| Accommodation & Food Services | 57 (32.6%) | 118 (67.4%) |
| Public Administration | 143 (65.3%) | 76 (34.7%) |
| Total | 1,685 (55.4%) | 1,354 (44.6%) |
Education in Vandenberg Village
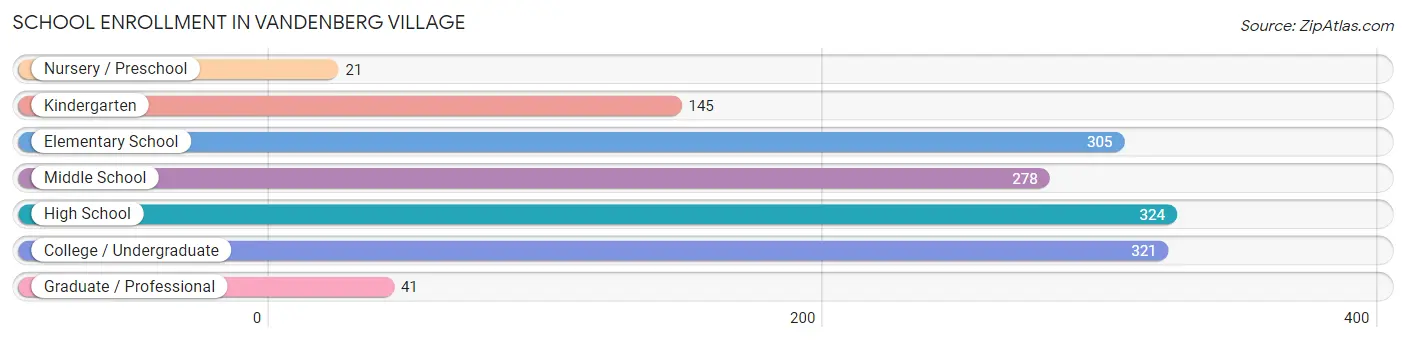
School Enrollment in Vandenberg Village
The most common levels of schooling among the 1,435 students in Vandenberg Village are high school (324 | 22.6%), college / undergraduate (321 | 22.4%), and elementary school (305 | 21.2%).
| School Level | # Students | % Students |
| Nursery / Preschool | 21 | 1.5% |
| Kindergarten | 145 | 10.1% |
| Elementary School | 305 | 21.2% |
| Middle School | 278 | 19.4% |
| High School | 324 | 22.6% |
| College / Undergraduate | 321 | 22.4% |
| Graduate / Professional | 41 | 2.9% |
| Total | 1,435 | 100.0% |
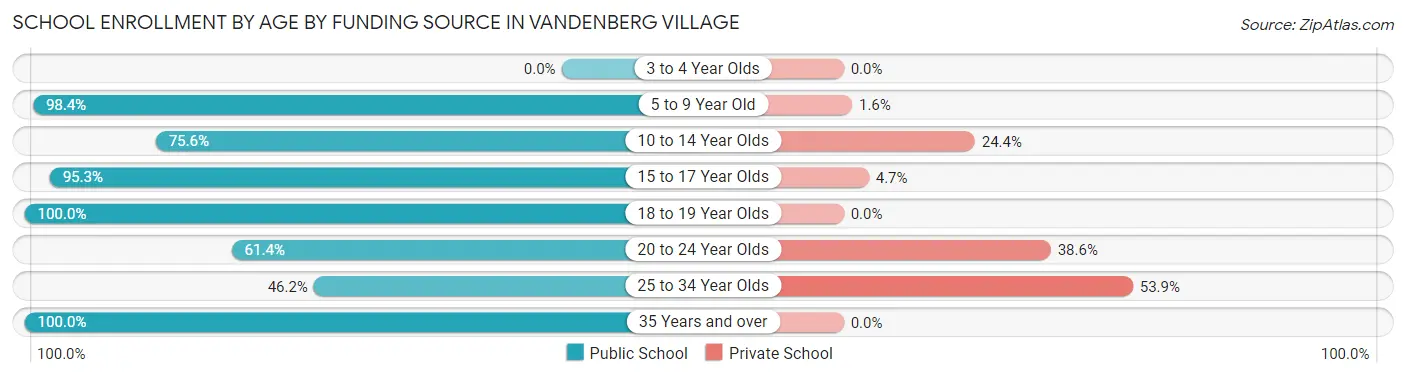
School Enrollment by Age by Funding Source in Vandenberg Village
Out of a total of 1,435 students who are enrolled in schools in Vandenberg Village, 195 (13.6%) attend a private institution, while the remaining 1,240 (86.4%) are enrolled in public schools. The age group of 25 to 34 year olds has the highest likelihood of being enrolled in private schools, with 56 (53.8% in the age bracket) enrolled. Conversely, the age group of 18 to 19 year olds has the lowest likelihood of being enrolled in a private school, with 181 (100.0% in the age bracket) attending a public institution.
| Age Bracket | Public School | Private School |
| 3 to 4 Year Olds | 0 (0.0%) | 0 (0.0%) |
| 5 to 9 Year Old | 442 (98.4%) | 7 (1.6%) |
| 10 to 14 Year Olds | 300 (75.6%) | 97 (24.4%) |
| 15 to 17 Year Olds | 163 (95.3%) | 8 (4.7%) |
| 18 to 19 Year Olds | 181 (100.0%) | 0 (0.0%) |
| 20 to 24 Year Olds | 43 (61.4%) | 27 (38.6%) |
| 25 to 34 Year Olds | 48 (46.2%) | 56 (53.8%) |
| 35 Years and over | 63 (100.0%) | 0 (0.0%) |
| Total | 1,240 (86.4%) | 195 (13.6%) |
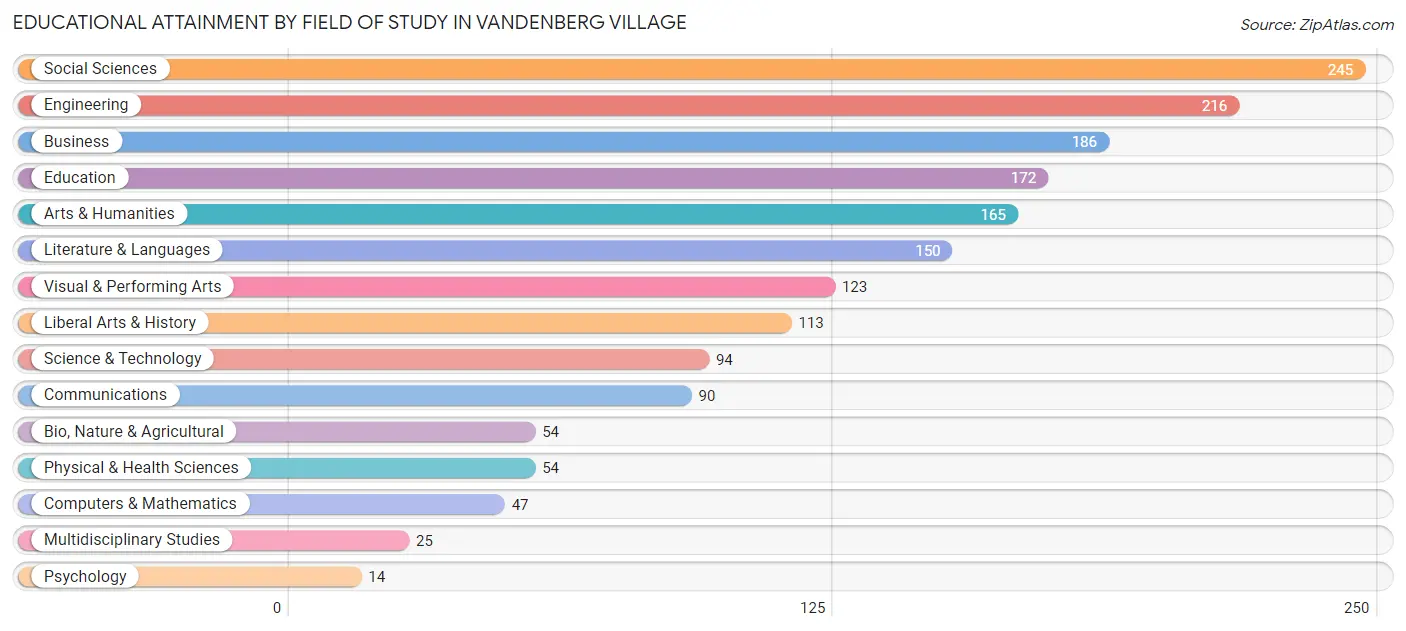
Educational Attainment by Field of Study in Vandenberg Village
Social sciences (245 | 14.0%), engineering (216 | 12.4%), business (186 | 10.6%), education (172 | 9.8%), and arts & humanities (165 | 9.4%) are the most common fields of study among 1,748 individuals in Vandenberg Village who have obtained a bachelor's degree or higher.
| Field of Study | # Graduates | % Graduates |
| Computers & Mathematics | 47 | 2.7% |
| Bio, Nature & Agricultural | 54 | 3.1% |
| Physical & Health Sciences | 54 | 3.1% |
| Psychology | 14 | 0.8% |
| Social Sciences | 245 | 14.0% |
| Engineering | 216 | 12.4% |
| Multidisciplinary Studies | 25 | 1.4% |
| Science & Technology | 94 | 5.4% |
| Business | 186 | 10.6% |
| Education | 172 | 9.8% |
| Literature & Languages | 150 | 8.6% |
| Liberal Arts & History | 113 | 6.5% |
| Visual & Performing Arts | 123 | 7.0% |
| Communications | 90 | 5.1% |
| Arts & Humanities | 165 | 9.4% |
| Total | 1,748 | 100.0% |
Transportation & Commute in Vandenberg Village
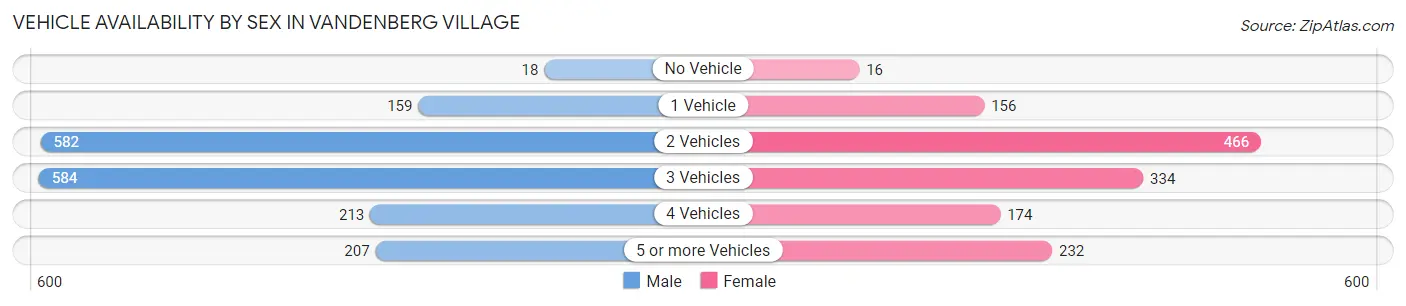
Vehicle Availability by Sex in Vandenberg Village
The most prevalent vehicle ownership categories in Vandenberg Village are males with 3 vehicles (584, accounting for 33.1%) and females with 3 vehicles (334, making up 42.4%).
| Vehicles Available | Male | Female |
| No Vehicle | 18 (1.0%) | 16 (1.2%) |
| 1 Vehicle | 159 (9.0%) | 156 (11.3%) |
| 2 Vehicles | 582 (33.0%) | 466 (33.8%) |
| 3 Vehicles | 584 (33.1%) | 334 (24.2%) |
| 4 Vehicles | 213 (12.1%) | 174 (12.6%) |
| 5 or more Vehicles | 207 (11.7%) | 232 (16.8%) |
| Total | 1,763 (100.0%) | 1,378 (100.0%) |
Commute Time in Vandenberg Village
The most frequently occuring commute durations in Vandenberg Village are 10 to 14 minutes (614 commuters, 21.4%), 15 to 19 minutes (461 commuters, 16.1%), and 5 to 9 minutes (361 commuters, 12.6%).
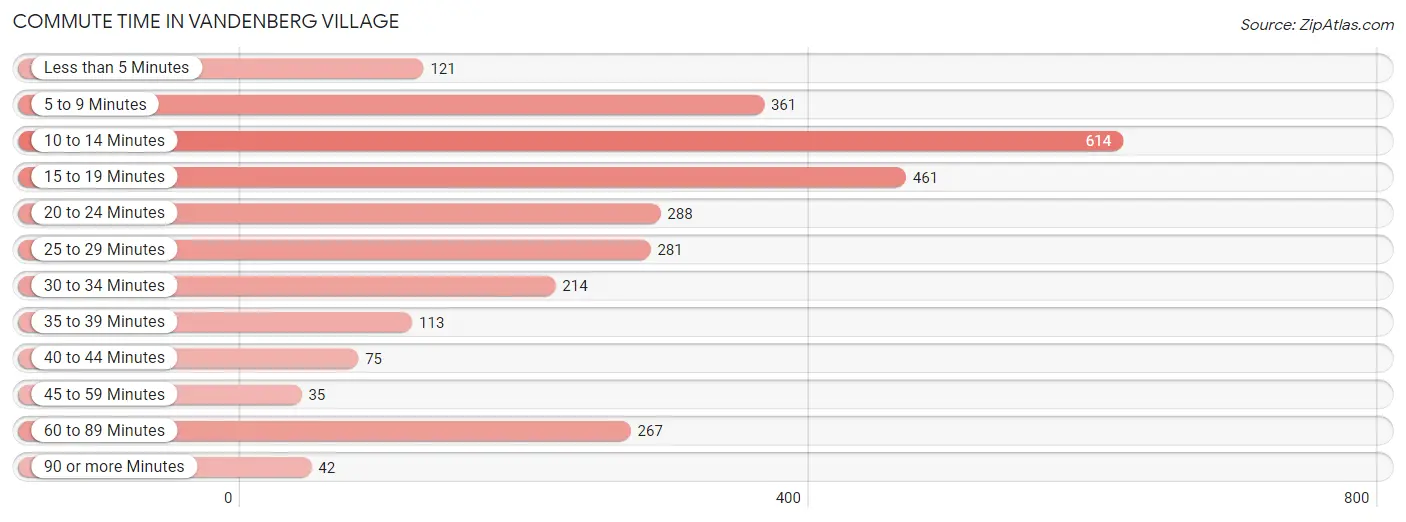
| Commute Time | # Commuters | % Commuters |
| Less than 5 Minutes | 121 | 4.2% |
| 5 to 9 Minutes | 361 | 12.6% |
| 10 to 14 Minutes | 614 | 21.4% |
| 15 to 19 Minutes | 461 | 16.1% |
| 20 to 24 Minutes | 288 | 10.0% |
| 25 to 29 Minutes | 281 | 9.8% |
| 30 to 34 Minutes | 214 | 7.4% |
| 35 to 39 Minutes | 113 | 3.9% |
| 40 to 44 Minutes | 75 | 2.6% |
| 45 to 59 Minutes | 35 | 1.2% |
| 60 to 89 Minutes | 267 | 9.3% |
| 90 or more Minutes | 42 | 1.5% |
Commute Time by Sex in Vandenberg Village
The most common commute times in Vandenberg Village are 10 to 14 minutes (305 commuters, 18.4%) for males and 10 to 14 minutes (309 commuters, 25.5%) for females.
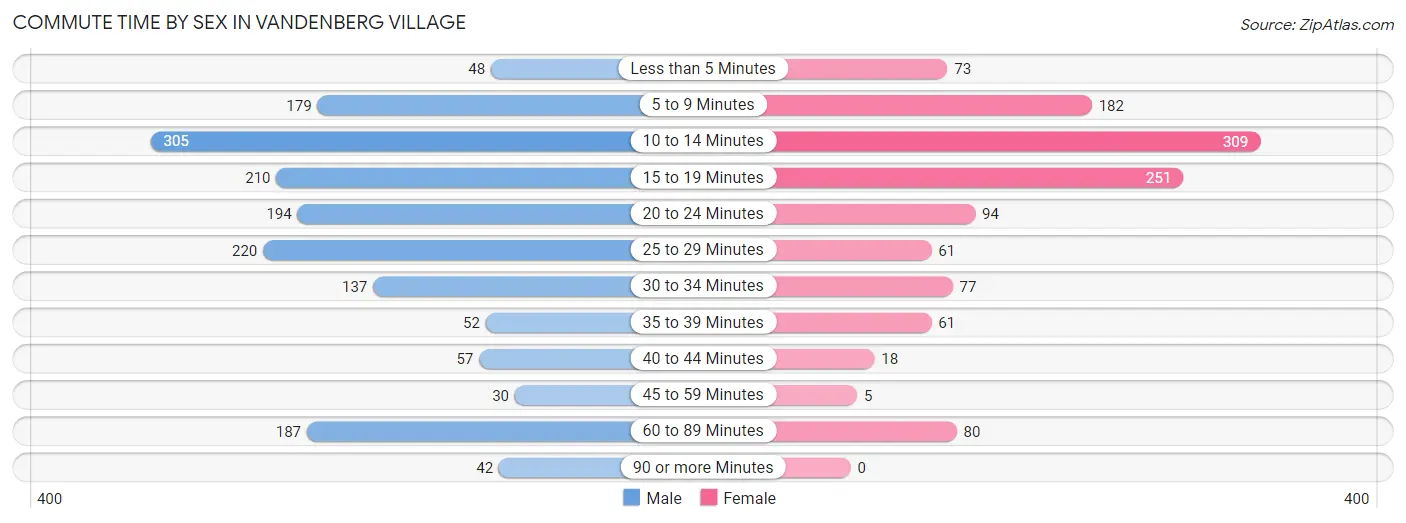
| Commute Time | Male | Female |
| Less than 5 Minutes | 48 (2.9%) | 73 (6.0%) |
| 5 to 9 Minutes | 179 (10.8%) | 182 (15.0%) |
| 10 to 14 Minutes | 305 (18.4%) | 309 (25.5%) |
| 15 to 19 Minutes | 210 (12.6%) | 251 (20.7%) |
| 20 to 24 Minutes | 194 (11.7%) | 94 (7.8%) |
| 25 to 29 Minutes | 220 (13.3%) | 61 (5.0%) |
| 30 to 34 Minutes | 137 (8.3%) | 77 (6.4%) |
| 35 to 39 Minutes | 52 (3.1%) | 61 (5.0%) |
| 40 to 44 Minutes | 57 (3.4%) | 18 (1.5%) |
| 45 to 59 Minutes | 30 (1.8%) | 5 (0.4%) |
| 60 to 89 Minutes | 187 (11.3%) | 80 (6.6%) |
| 90 or more Minutes | 42 (2.5%) | 0 (0.0%) |
Time of Departure to Work by Sex in Vandenberg Village
The most frequent times of departure to work in Vandenberg Village are 7:00 AM to 7:29 AM (297, 17.9%) for males and 7:00 AM to 7:29 AM (273, 22.5%) for females.
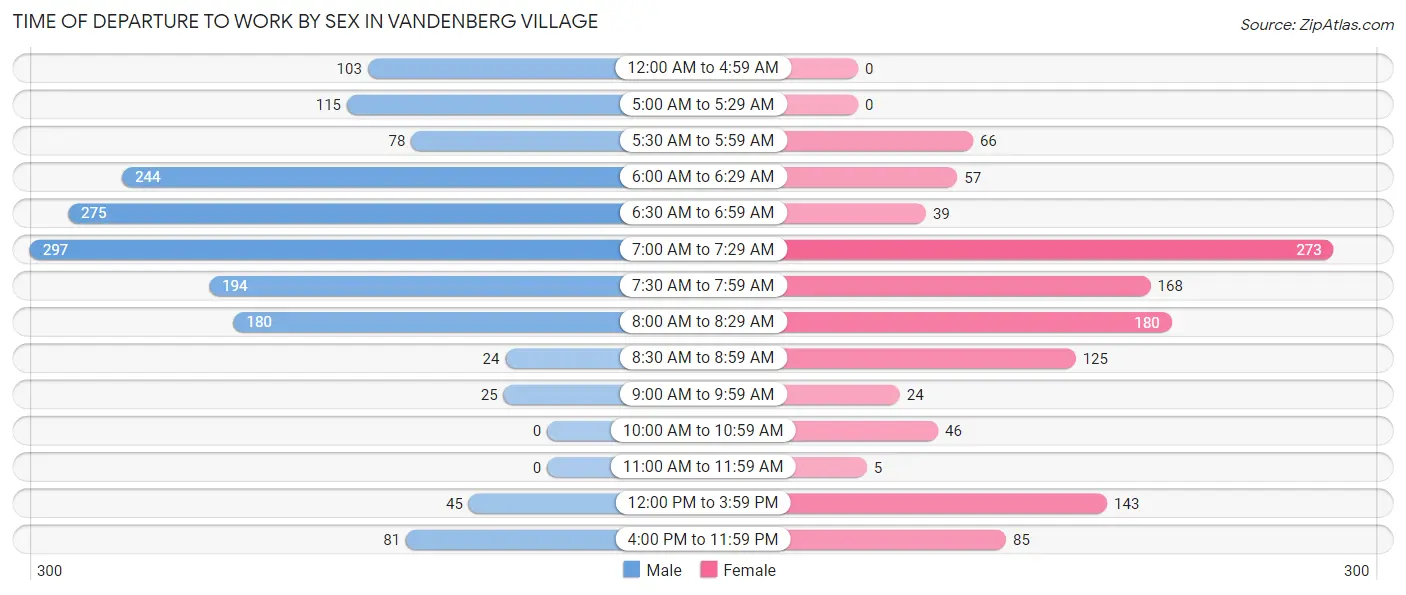
| Time of Departure | Male | Female |
| 12:00 AM to 4:59 AM | 103 (6.2%) | 0 (0.0%) |
| 5:00 AM to 5:29 AM | 115 (6.9%) | 0 (0.0%) |
| 5:30 AM to 5:59 AM | 78 (4.7%) | 66 (5.4%) |
| 6:00 AM to 6:29 AM | 244 (14.7%) | 57 (4.7%) |
| 6:30 AM to 6:59 AM | 275 (16.6%) | 39 (3.2%) |
| 7:00 AM to 7:29 AM | 297 (17.9%) | 273 (22.5%) |
| 7:30 AM to 7:59 AM | 194 (11.7%) | 168 (13.9%) |
| 8:00 AM to 8:29 AM | 180 (10.8%) | 180 (14.9%) |
| 8:30 AM to 8:59 AM | 24 (1.4%) | 125 (10.3%) |
| 9:00 AM to 9:59 AM | 25 (1.5%) | 24 (2.0%) |
| 10:00 AM to 10:59 AM | 0 (0.0%) | 46 (3.8%) |
| 11:00 AM to 11:59 AM | 0 (0.0%) | 5 (0.4%) |
| 12:00 PM to 3:59 PM | 45 (2.7%) | 143 (11.8%) |
| 4:00 PM to 11:59 PM | 81 (4.9%) | 85 (7.0%) |
| Total | 1,661 (100.0%) | 1,211 (100.0%) |
Housing Occupancy in Vandenberg Village
Occupancy by Ownership in Vandenberg Village
Of the total 2,647 dwellings in Vandenberg Village, owner-occupied units account for 2,015 (76.1%), while renter-occupied units make up 632 (23.9%).
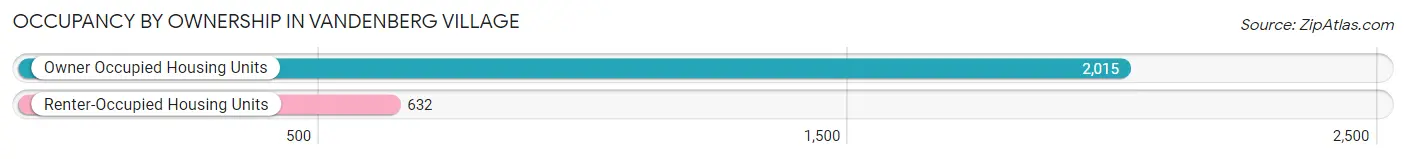
| Occupancy | # Housing Units | % Housing Units |
| Owner Occupied Housing Units | 2,015 | 76.1% |
| Renter-Occupied Housing Units | 632 | 23.9% |
| Total Occupied Housing Units | 2,647 | 100.0% |
Occupancy by Household Size in Vandenberg Village
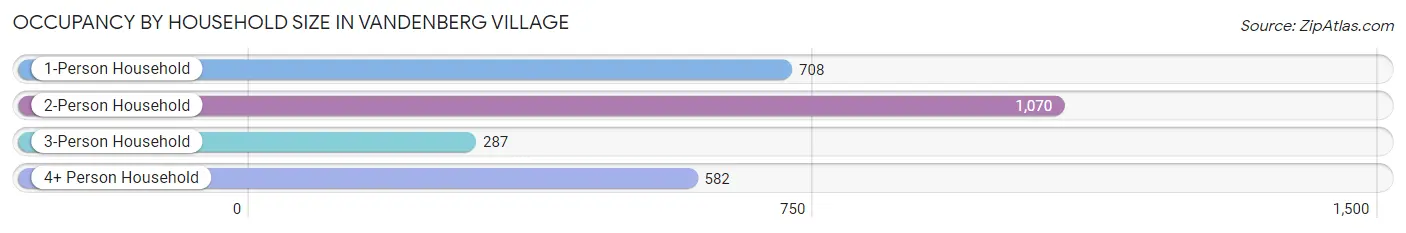
| Household Size | # Housing Units | % Housing Units |
| 1-Person Household | 708 | 26.8% |
| 2-Person Household | 1,070 | 40.4% |
| 3-Person Household | 287 | 10.8% |
| 4+ Person Household | 582 | 22.0% |
| Total Housing Units | 2,647 | 100.0% |
Occupancy by Ownership by Household Size in Vandenberg Village
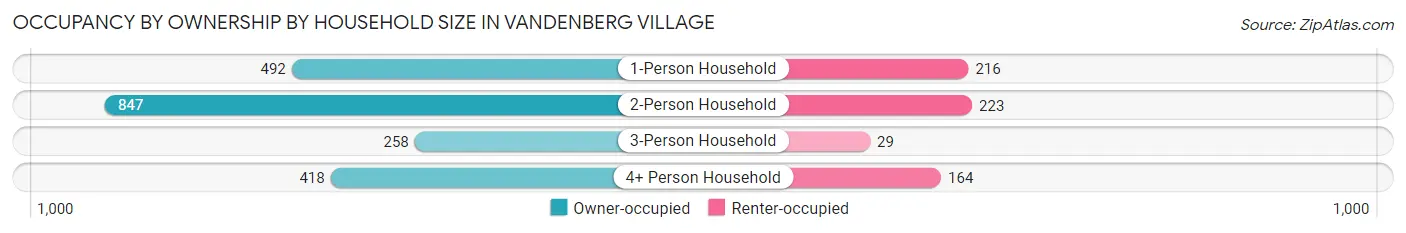
| Household Size | Owner-occupied | Renter-occupied |
| 1-Person Household | 492 (69.5%) | 216 (30.5%) |
| 2-Person Household | 847 (79.2%) | 223 (20.8%) |
| 3-Person Household | 258 (89.9%) | 29 (10.1%) |
| 4+ Person Household | 418 (71.8%) | 164 (28.2%) |
| Total Housing Units | 2,015 (76.1%) | 632 (23.9%) |
Occupancy by Educational Attainment in Vandenberg Village
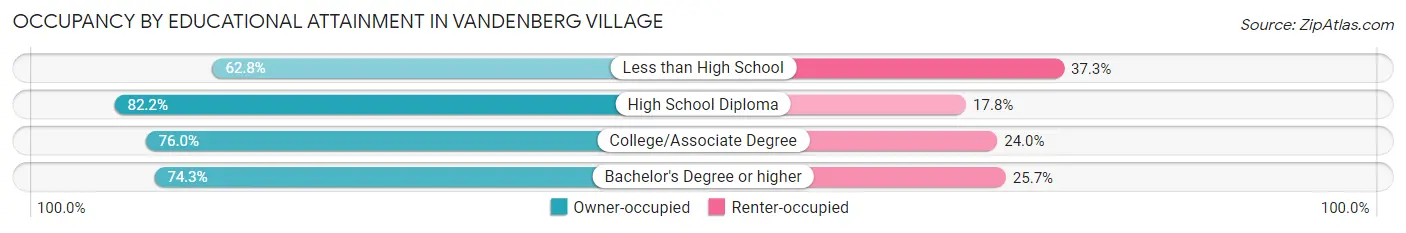
| Household Size | Owner-occupied | Renter-occupied |
| Less than High School | 64 (62.7%) | 38 (37.2%) |
| High School Diploma | 465 (82.2%) | 101 (17.8%) |
| College/Associate Degree | 712 (76.0%) | 225 (24.0%) |
| Bachelor's Degree or higher | 774 (74.3%) | 268 (25.7%) |
Occupancy by Age of Householder in Vandenberg Village
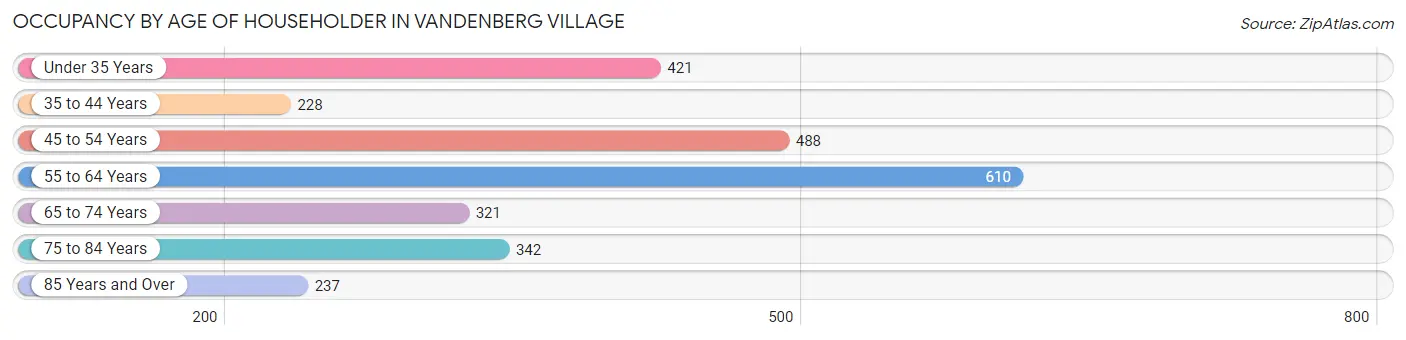
| Age Bracket | # Households | % Households |
| Under 35 Years | 421 | 15.9% |
| 35 to 44 Years | 228 | 8.6% |
| 45 to 54 Years | 488 | 18.4% |
| 55 to 64 Years | 610 | 23.0% |
| 65 to 74 Years | 321 | 12.1% |
| 75 to 84 Years | 342 | 12.9% |
| 85 Years and Over | 237 | 8.9% |
| Total | 2,647 | 100.0% |
Housing Finances in Vandenberg Village
Median Income by Occupancy in Vandenberg Village
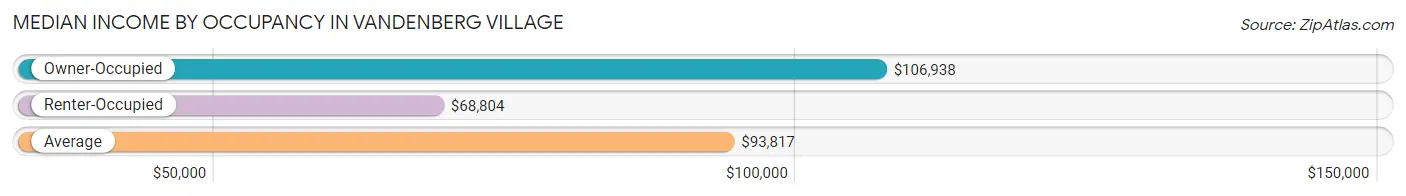
| Occupancy Type | # Households | Median Income |
| Owner-Occupied | 2,015 (76.1%) | $106,938 |
| Renter-Occupied | 632 (23.9%) | $68,804 |
| Average | 2,647 (100.0%) | $93,817 |
Occupancy by Householder Income Bracket in Vandenberg Village
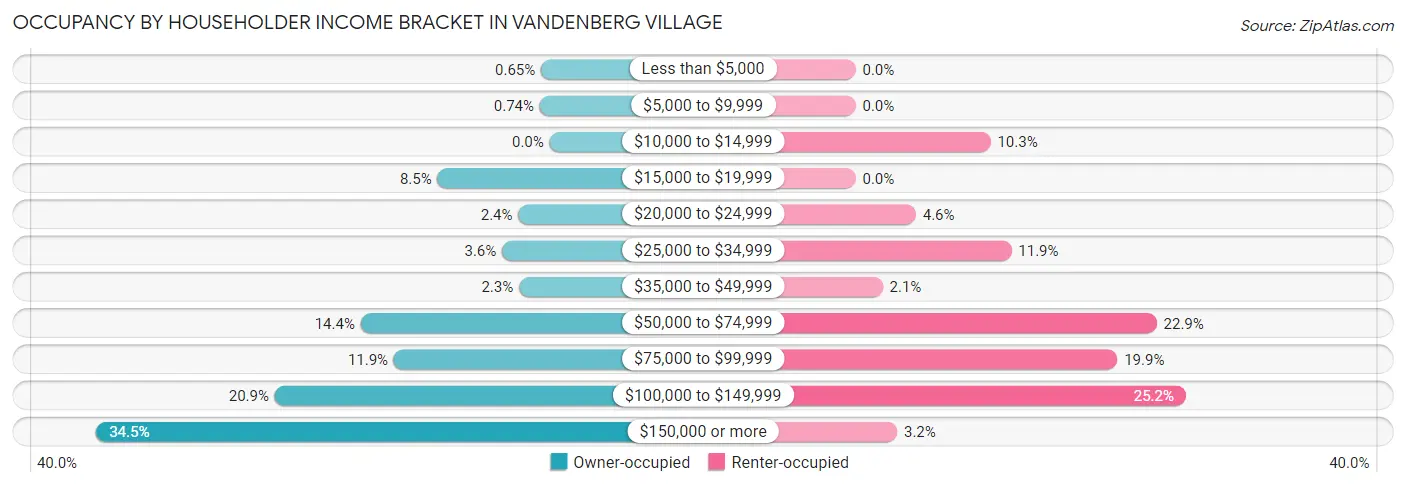
| Income Bracket | Owner-occupied | Renter-occupied |
| Less than $5,000 | 13 (0.6%) | 0 (0.0%) |
| $5,000 to $9,999 | 15 (0.7%) | 0 (0.0%) |
| $10,000 to $14,999 | 0 (0.0%) | 65 (10.3%) |
| $15,000 to $19,999 | 172 (8.5%) | 0 (0.0%) |
| $20,000 to $24,999 | 48 (2.4%) | 29 (4.6%) |
| $25,000 to $34,999 | 73 (3.6%) | 75 (11.9%) |
| $35,000 to $49,999 | 47 (2.3%) | 13 (2.1%) |
| $50,000 to $74,999 | 290 (14.4%) | 145 (22.9%) |
| $75,000 to $99,999 | 239 (11.9%) | 126 (19.9%) |
| $100,000 to $149,999 | 422 (20.9%) | 159 (25.2%) |
| $150,000 or more | 696 (34.5%) | 20 (3.2%) |
| Total | 2,015 (100.0%) | 632 (100.0%) |
Monthly Housing Cost Tiers in Vandenberg Village
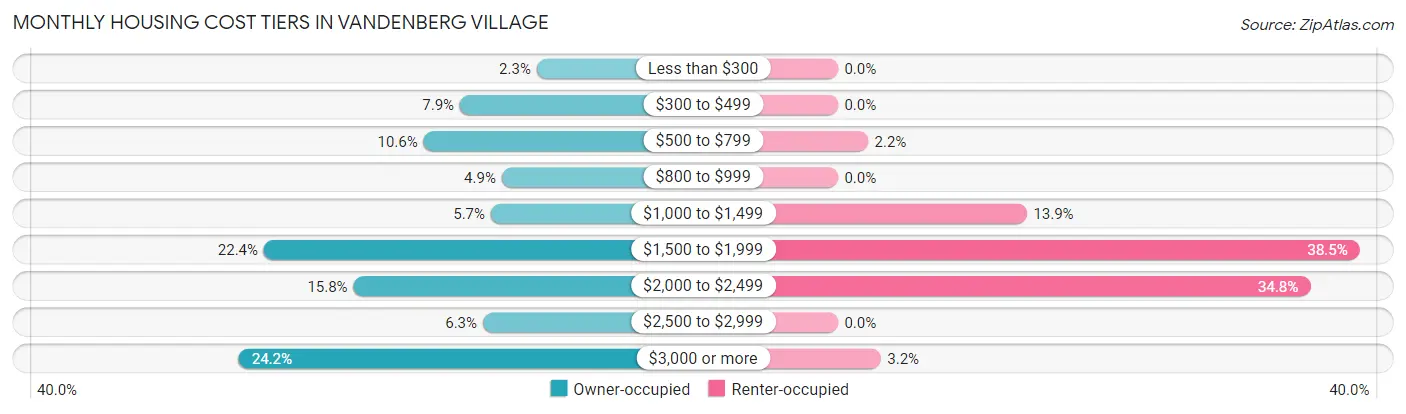
| Monthly Cost | Owner-occupied | Renter-occupied |
| Less than $300 | 46 (2.3%) | 0 (0.0%) |
| $300 to $499 | 160 (7.9%) | 0 (0.0%) |
| $500 to $799 | 214 (10.6%) | 14 (2.2%) |
| $800 to $999 | 98 (4.9%) | 0 (0.0%) |
| $1,000 to $1,499 | 114 (5.7%) | 88 (13.9%) |
| $1,500 to $1,999 | 451 (22.4%) | 243 (38.5%) |
| $2,000 to $2,499 | 318 (15.8%) | 220 (34.8%) |
| $2,500 to $2,999 | 126 (6.2%) | 0 (0.0%) |
| $3,000 or more | 488 (24.2%) | 20 (3.2%) |
| Total | 2,015 (100.0%) | 632 (100.0%) |
Physical Housing Characteristics in Vandenberg Village
Housing Structures in Vandenberg Village
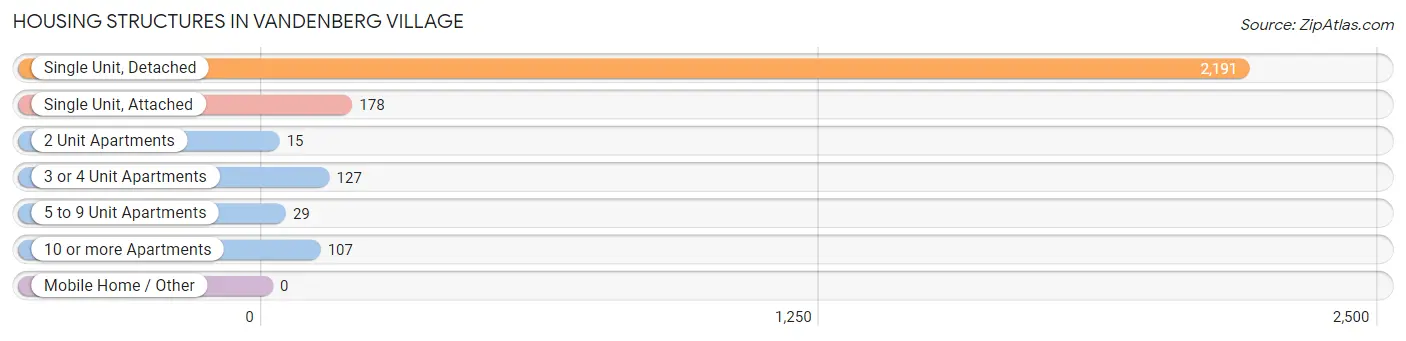
| Structure Type | # Housing Units | % Housing Units |
| Single Unit, Detached | 2,191 | 82.8% |
| Single Unit, Attached | 178 | 6.7% |
| 2 Unit Apartments | 15 | 0.6% |
| 3 or 4 Unit Apartments | 127 | 4.8% |
| 5 to 9 Unit Apartments | 29 | 1.1% |
| 10 or more Apartments | 107 | 4.0% |
| Mobile Home / Other | 0 | 0.0% |
| Total | 2,647 | 100.0% |
Housing Structures by Occupancy in Vandenberg Village
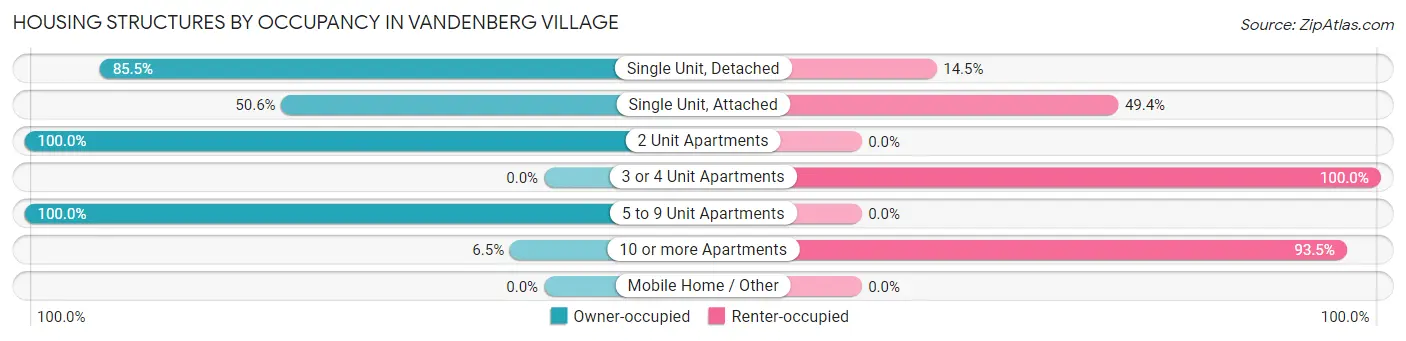
| Structure Type | Owner-occupied | Renter-occupied |
| Single Unit, Detached | 1,874 (85.5%) | 317 (14.5%) |
| Single Unit, Attached | 90 (50.6%) | 88 (49.4%) |
| 2 Unit Apartments | 15 (100.0%) | 0 (0.0%) |
| 3 or 4 Unit Apartments | 0 (0.0%) | 127 (100.0%) |
| 5 to 9 Unit Apartments | 29 (100.0%) | 0 (0.0%) |
| 10 or more Apartments | 7 (6.5%) | 100 (93.5%) |
| Mobile Home / Other | 0 (0.0%) | 0 (0.0%) |
| Total | 2,015 (76.1%) | 632 (23.9%) |
Housing Structures by Number of Rooms in Vandenberg Village
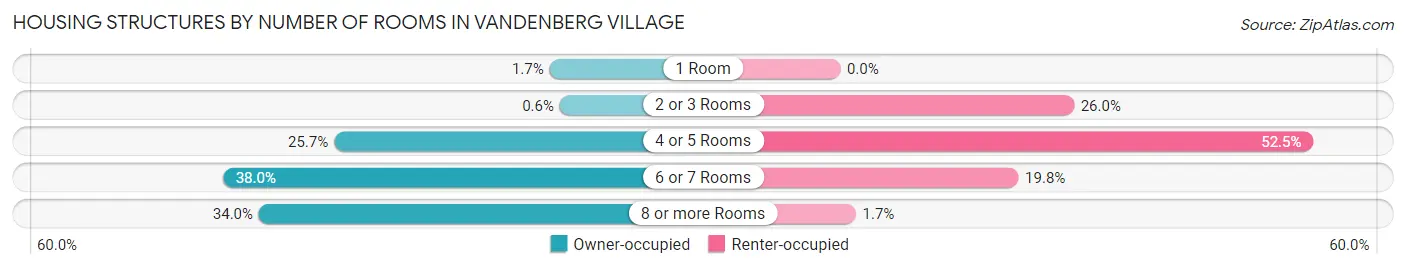
| Number of Rooms | Owner-occupied | Renter-occupied |
| 1 Room | 35 (1.7%) | 0 (0.0%) |
| 2 or 3 Rooms | 12 (0.6%) | 164 (26.0%) |
| 4 or 5 Rooms | 517 (25.7%) | 332 (52.5%) |
| 6 or 7 Rooms | 766 (38.0%) | 125 (19.8%) |
| 8 or more Rooms | 685 (34.0%) | 11 (1.7%) |
| Total | 2,015 (100.0%) | 632 (100.0%) |
Housing Structure by Heating Type in Vandenberg Village
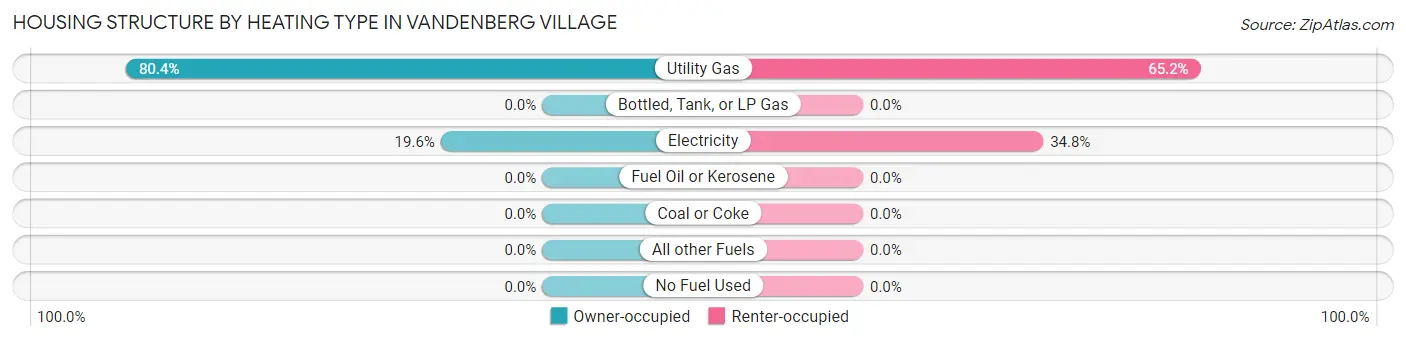
| Heating Type | Owner-occupied | Renter-occupied |
| Utility Gas | 1,620 (80.4%) | 412 (65.2%) |
| Bottled, Tank, or LP Gas | 0 (0.0%) | 0 (0.0%) |
| Electricity | 395 (19.6%) | 220 (34.8%) |
| Fuel Oil or Kerosene | 0 (0.0%) | 0 (0.0%) |
| Coal or Coke | 0 (0.0%) | 0 (0.0%) |
| All other Fuels | 0 (0.0%) | 0 (0.0%) |
| No Fuel Used | 0 (0.0%) | 0 (0.0%) |
| Total | 2,015 (100.0%) | 632 (100.0%) |
Household Vehicle Usage in Vandenberg Village
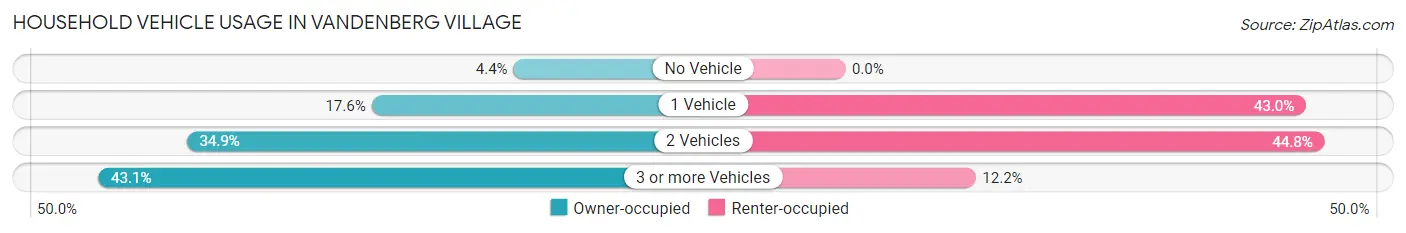
| Vehicles per Household | Owner-occupied | Renter-occupied |
| No Vehicle | 88 (4.4%) | 0 (0.0%) |
| 1 Vehicle | 355 (17.6%) | 272 (43.0%) |
| 2 Vehicles | 703 (34.9%) | 283 (44.8%) |
| 3 or more Vehicles | 869 (43.1%) | 77 (12.2%) |
| Total | 2,015 (100.0%) | 632 (100.0%) |
Real Estate & Mortgages in Vandenberg Village
Real Estate and Mortgage Overview in Vandenberg Village
| Characteristic | Without Mortgage | With Mortgage |
| Housing Units | 594 | 1,421 |
| Median Property Value | $513,900 | $566,200 |
| Median Household Income | $65,833 | $634 |
| Monthly Housing Costs | $678 | $488 |
| Real Estate Taxes | $3,040 | $15 |
Property Value by Mortgage Status in Vandenberg Village
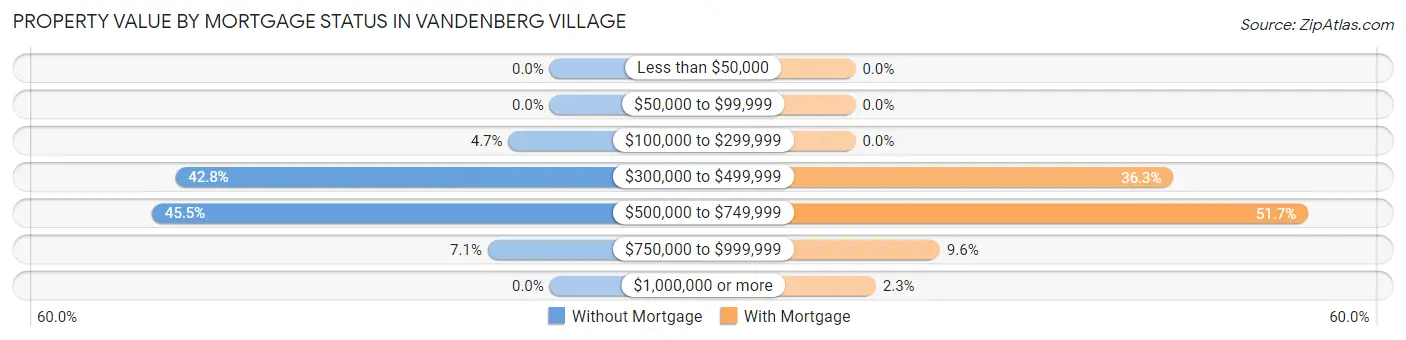
| Property Value | Without Mortgage | With Mortgage |
| Less than $50,000 | 0 (0.0%) | 0 (0.0%) |
| $50,000 to $99,999 | 0 (0.0%) | 0 (0.0%) |
| $100,000 to $299,999 | 28 (4.7%) | 0 (0.0%) |
| $300,000 to $499,999 | 254 (42.8%) | 516 (36.3%) |
| $500,000 to $749,999 | 270 (45.5%) | 735 (51.7%) |
| $750,000 to $999,999 | 42 (7.1%) | 137 (9.6%) |
| $1,000,000 or more | 0 (0.0%) | 33 (2.3%) |
| Total | 594 (100.0%) | 1,421 (100.0%) |
Household Income by Mortgage Status in Vandenberg Village
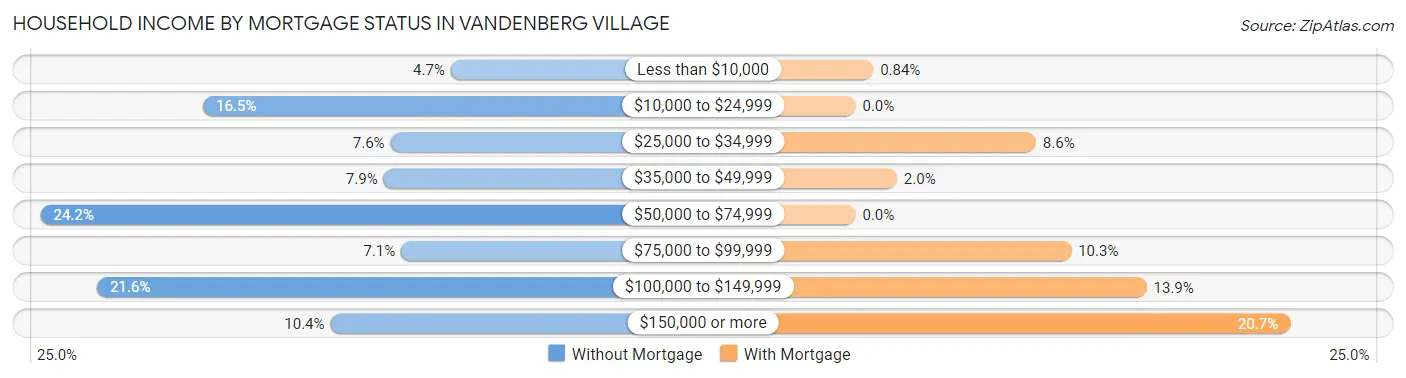
| Household Income | Without Mortgage | With Mortgage |
| Less than $10,000 | 28 (4.7%) | 12 (0.8%) |
| $10,000 to $24,999 | 98 (16.5%) | 0 (0.0%) |
| $25,000 to $34,999 | 45 (7.6%) | 122 (8.6%) |
| $35,000 to $49,999 | 47 (7.9%) | 28 (2.0%) |
| $50,000 to $74,999 | 144 (24.2%) | 0 (0.0%) |
| $75,000 to $99,999 | 42 (7.1%) | 146 (10.3%) |
| $100,000 to $149,999 | 128 (21.5%) | 197 (13.9%) |
| $150,000 or more | 62 (10.4%) | 294 (20.7%) |
| Total | 594 (100.0%) | 1,421 (100.0%) |
Property Value to Household Income Ratio in Vandenberg Village
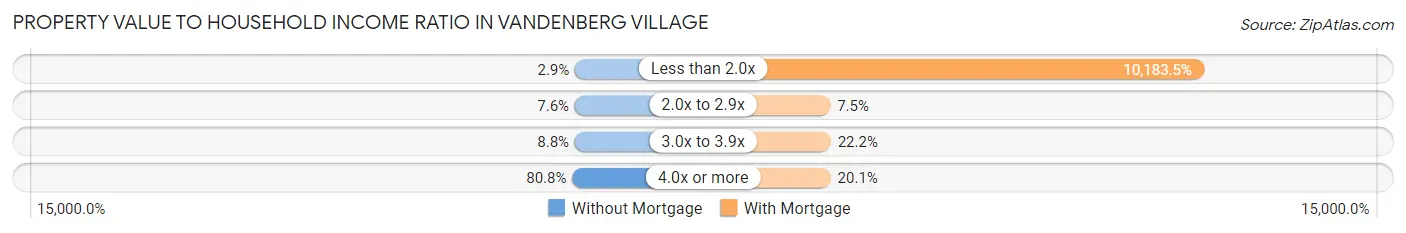
| Value-to-Income Ratio | Without Mortgage | With Mortgage |
| Less than 2.0x | 17 (2.9%) | 144,708 (10,183.5%) |
| 2.0x to 2.9x | 45 (7.6%) | 106 (7.5%) |
| 3.0x to 3.9x | 52 (8.7%) | 315 (22.2%) |
| 4.0x or more | 480 (80.8%) | 285 (20.1%) |
| Total | 594 (100.0%) | 1,421 (100.0%) |
Real Estate Taxes by Mortgage Status in Vandenberg Village
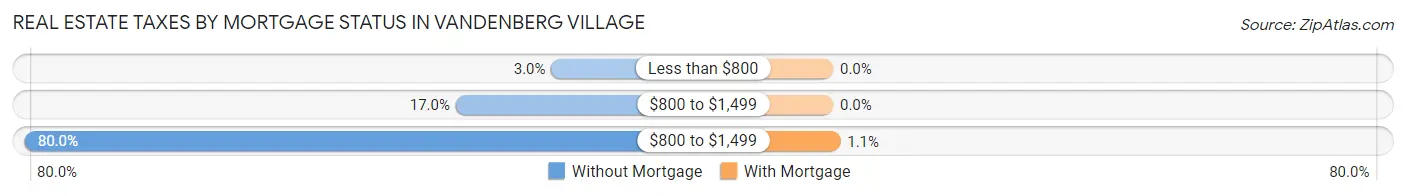
| Property Taxes | Without Mortgage | With Mortgage |
| Less than $800 | 18 (3.0%) | 0 (0.0%) |
| $800 to $1,499 | 101 (17.0%) | 0 (0.0%) |
| $800 to $1,499 | 475 (80.0%) | 15 (1.1%) |
| Total | 594 (100.0%) | 1,421 (100.0%) |
Health & Disability in Vandenberg Village
Health Insurance Coverage by Age in Vandenberg Village
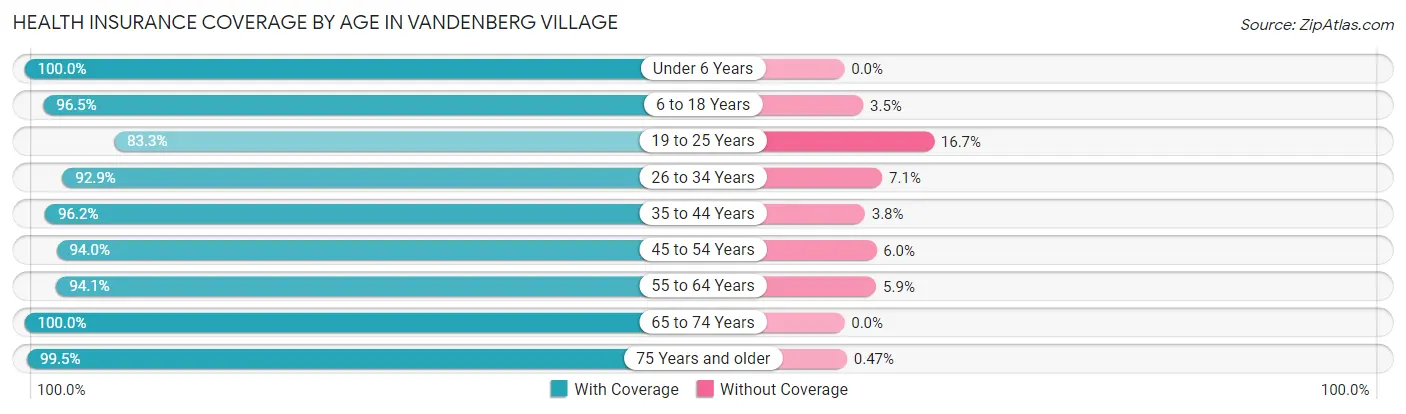
| Age Bracket | With Coverage | Without Coverage |
| Under 6 Years | 301 (100.0%) | 0 (0.0%) |
| 6 to 18 Years | 1,016 (96.5%) | 37 (3.5%) |
| 19 to 25 Years | 424 (83.3%) | 85 (16.7%) |
| 26 to 34 Years | 474 (92.9%) | 36 (7.1%) |
| 35 to 44 Years | 604 (96.2%) | 24 (3.8%) |
| 45 to 54 Years | 805 (94.0%) | 51 (6.0%) |
| 55 to 64 Years | 981 (94.1%) | 62 (5.9%) |
| 65 to 74 Years | 706 (100.0%) | 0 (0.0%) |
| 75 Years and older | 853 (99.5%) | 4 (0.5%) |
| Total | 6,164 (95.4%) | 299 (4.6%) |
Health Insurance Coverage by Citizenship Status in Vandenberg Village
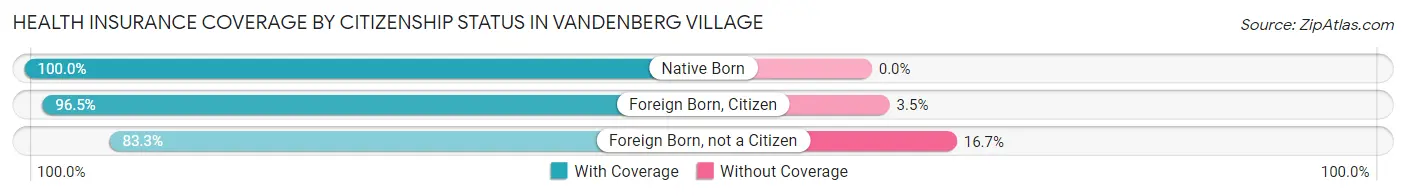
| Citizenship Status | With Coverage | Without Coverage |
| Native Born | 301 (100.0%) | 0 (0.0%) |
| Foreign Born, Citizen | 1,016 (96.5%) | 37 (3.5%) |
| Foreign Born, not a Citizen | 424 (83.3%) | 85 (16.7%) |
Health Insurance Coverage by Household Income in Vandenberg Village
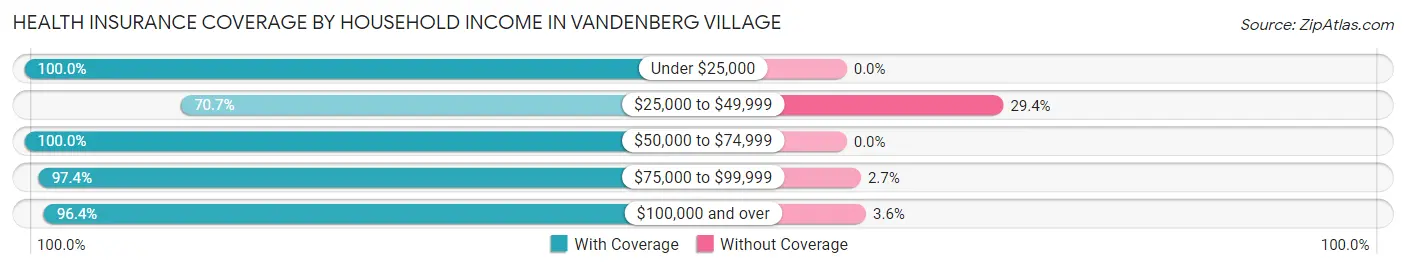
| Household Income | With Coverage | Without Coverage |
| Under $25,000 | 384 (100.0%) | 0 (0.0%) |
| $25,000 to $49,999 | 325 (70.7%) | 135 (29.3%) |
| $50,000 to $74,999 | 988 (100.0%) | 0 (0.0%) |
| $75,000 to $99,999 | 661 (97.4%) | 18 (2.6%) |
| $100,000 and over | 3,780 (96.4%) | 142 (3.6%) |
Public vs Private Health Insurance Coverage by Age in Vandenberg Village
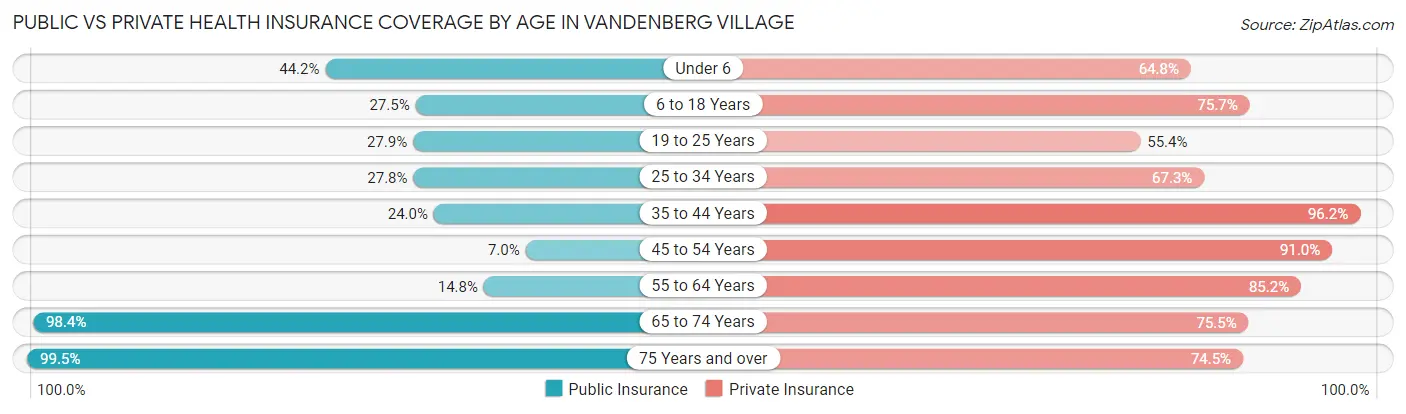
| Age Bracket | Public Insurance | Private Insurance |
| Under 6 | 133 (44.2%) | 195 (64.8%) |
| 6 to 18 Years | 289 (27.5%) | 797 (75.7%) |
| 19 to 25 Years | 142 (27.9%) | 282 (55.4%) |
| 25 to 34 Years | 142 (27.8%) | 343 (67.2%) |
| 35 to 44 Years | 151 (24.0%) | 604 (96.2%) |
| 45 to 54 Years | 60 (7.0%) | 779 (91.0%) |
| 55 to 64 Years | 154 (14.8%) | 889 (85.2%) |
| 65 to 74 Years | 695 (98.4%) | 533 (75.5%) |
| 75 Years and over | 853 (99.5%) | 638 (74.5%) |
| Total | 2,619 (40.5%) | 5,060 (78.3%) |
Disability Status by Sex by Age in Vandenberg Village
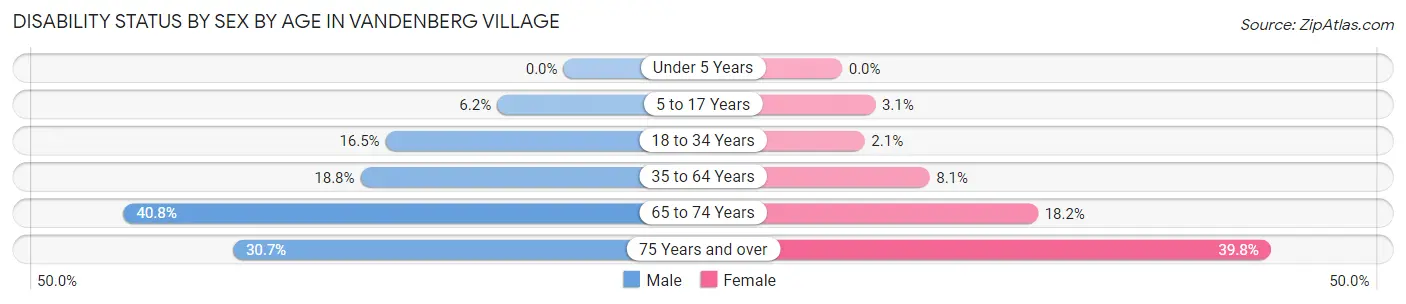
| Age Bracket | Male | Female |
| Under 5 Years | 0 (0.0%) | 0 (0.0%) |
| 5 to 17 Years | 36 (6.2%) | 15 (3.1%) |
| 18 to 34 Years | 103 (16.5%) | 10 (2.1%) |
| 35 to 64 Years | 251 (18.8%) | 97 (8.1%) |
| 65 to 74 Years | 140 (40.8%) | 66 (18.2%) |
| 75 Years and over | 111 (30.7%) | 197 (39.8%) |
Disability Class by Sex by Age in Vandenberg Village
Disability Class: Hearing Difficulty
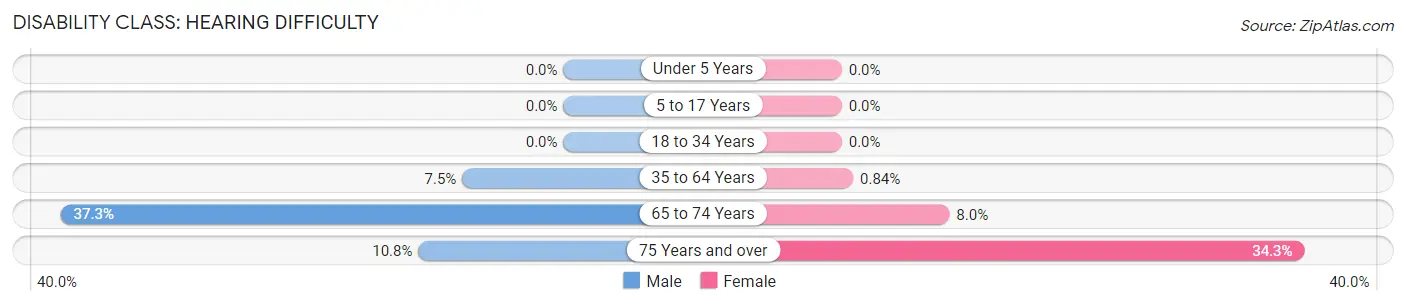
| Age Bracket | Male | Female |
| Under 5 Years | 0 (0.0%) | 0 (0.0%) |
| 5 to 17 Years | 0 (0.0%) | 0 (0.0%) |
| 18 to 34 Years | 0 (0.0%) | 0 (0.0%) |
| 35 to 64 Years | 100 (7.5%) | 10 (0.8%) |
| 65 to 74 Years | 128 (37.3%) | 29 (8.0%) |
| 75 Years and over | 39 (10.8%) | 170 (34.3%) |
Disability Class: Vision Difficulty
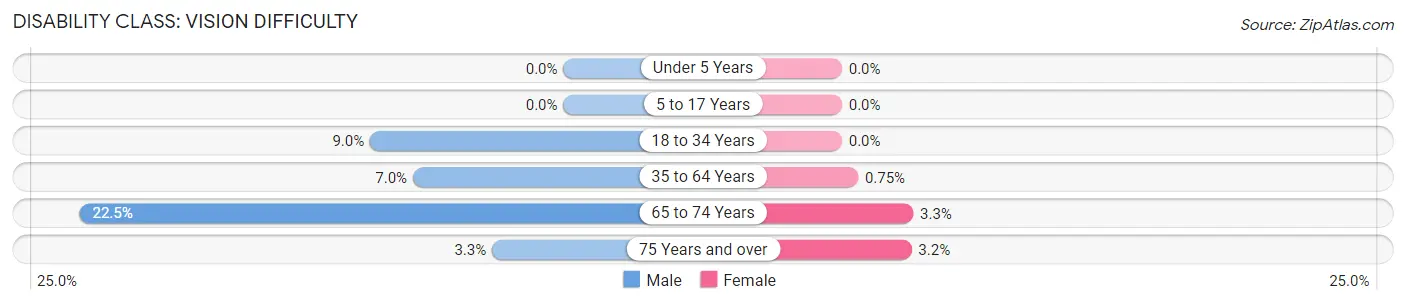
| Age Bracket | Male | Female |
| Under 5 Years | 0 (0.0%) | 0 (0.0%) |
| 5 to 17 Years | 0 (0.0%) | 0 (0.0%) |
| 18 to 34 Years | 56 (9.0%) | 0 (0.0%) |
| 35 to 64 Years | 93 (7.0%) | 9 (0.7%) |
| 65 to 74 Years | 77 (22.5%) | 12 (3.3%) |
| 75 Years and over | 12 (3.3%) | 16 (3.2%) |
Disability Class: Cognitive Difficulty
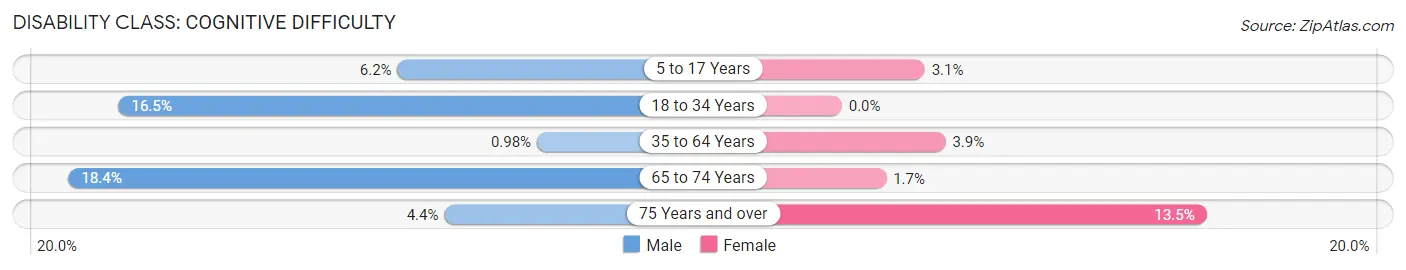
| Age Bracket | Male | Female |
| 5 to 17 Years | 36 (6.2%) | 15 (3.1%) |
| 18 to 34 Years | 103 (16.5%) | 0 (0.0%) |
| 35 to 64 Years | 13 (1.0%) | 46 (3.8%) |
| 65 to 74 Years | 63 (18.4%) | 6 (1.7%) |
| 75 Years and over | 16 (4.4%) | 67 (13.5%) |
Disability Class: Ambulatory Difficulty
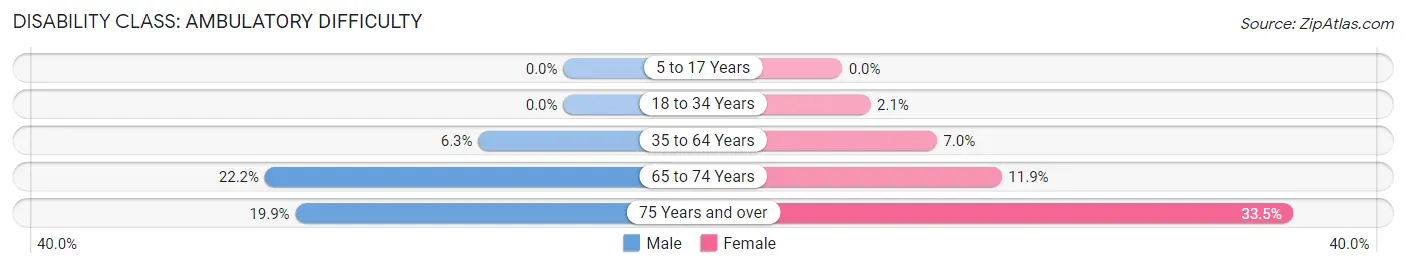
| Age Bracket | Male | Female |
| 5 to 17 Years | 0 (0.0%) | 0 (0.0%) |
| 18 to 34 Years | 0 (0.0%) | 10 (2.1%) |
| 35 to 64 Years | 84 (6.3%) | 84 (7.0%) |
| 65 to 74 Years | 76 (22.2%) | 43 (11.8%) |
| 75 Years and over | 72 (19.9%) | 166 (33.5%) |
Disability Class: Self-Care Difficulty
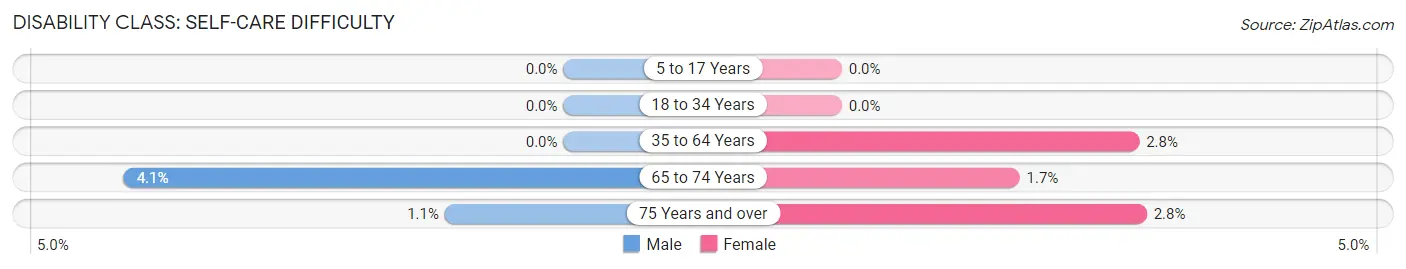
| Age Bracket | Male | Female |
| 5 to 17 Years | 0 (0.0%) | 0 (0.0%) |
| 18 to 34 Years | 0 (0.0%) | 0 (0.0%) |
| 35 to 64 Years | 0 (0.0%) | 33 (2.8%) |
| 65 to 74 Years | 14 (4.1%) | 6 (1.7%) |
| 75 Years and over | 4 (1.1%) | 14 (2.8%) |
Technology Access in Vandenberg Village
Computing Device Access in Vandenberg Village
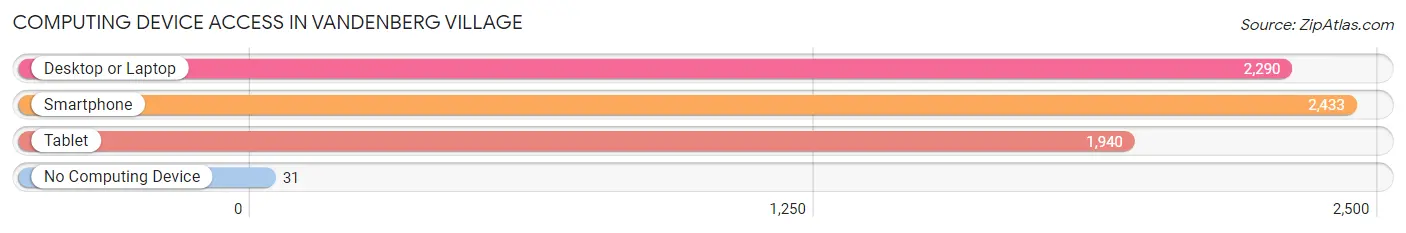
| Device Type | # Households | % Households |
| Desktop or Laptop | 2,290 | 86.5% |
| Smartphone | 2,433 | 91.9% |
| Tablet | 1,940 | 73.3% |
| No Computing Device | 31 | 1.2% |
| Total | 2,647 | 100.0% |
Internet Access in Vandenberg Village
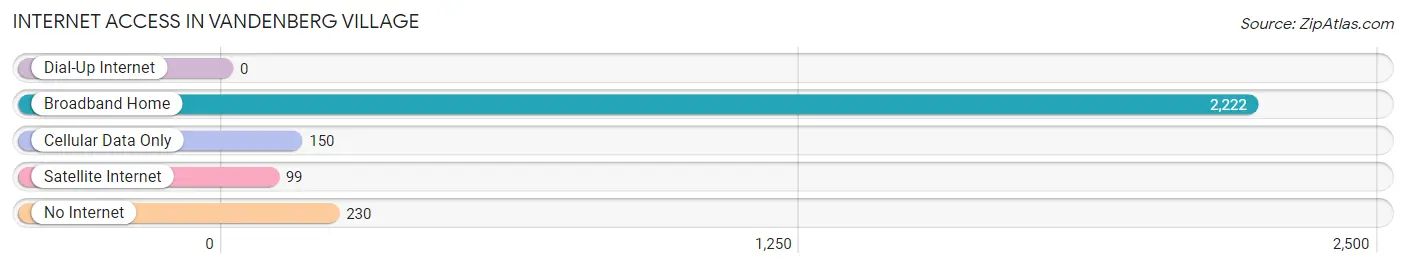
| Internet Type | # Households | % Households |
| Dial-Up Internet | 0 | 0.0% |
| Broadband Home | 2,222 | 83.9% |
| Cellular Data Only | 150 | 5.7% |
| Satellite Internet | 99 | 3.7% |
| No Internet | 230 | 8.7% |
| Total | 2,647 | 100.0% |
Vandenberg Village Summary
Vandenberg Village is a census-designated place located in Santa Barbara County, California. It is located about 8 miles northwest of the city of Lompoc and is part of the Lompoc-Vandenberg Village metropolitan area. The population of Vandenberg Village was 4,845 at the 2010 census.
History
Vandenberg Village was originally part of the Rancho Nuevo y Potrero Viejo, a Mexican land grant given to Jose Antonio de la Guerra in 1842. The land was later sold to the Vandenberg family in 1872. The family farmed the land until the 1950s when the United States Air Force purchased the land to build the Vandenberg Air Force Base. The base was built in 1957 and the village was established shortly after.
Geography
Vandenberg Village is located at 34°44'25"N 120°32'45"W (34.740278, -120.545833). It is situated in the Santa Ynez Valley, about 8 miles northwest of the city of Lompoc. The village is bordered by the Santa Ynez Mountains to the east and the Pacific Ocean to the west.
Economy
The economy of Vandenberg Village is largely dependent on the Vandenberg Air Force Base. The base is the primary employer in the area and provides jobs for many of the residents. Other major employers in the area include Vandenberg Village Elementary School, Vandenberg Village Community Center, and Vandenberg Village Golf Course.
Demographics
As of the 2010 census, there were 4,845 people, 1,845 households, and 1,323 families residing in Vandenberg Village. The population density was 1,845.2 people per square mile (711.7/km2). The racial makeup of the village was 75.2% White, 8.2% African American, 0.7% Native American, 5.2% Asian, 0.2% Pacific Islander, 6.2% from other races, and 4.5% from two or more races. Hispanic or Latino of any race were 18.2% of the population.
The median income for a household in the village was $50,938, and the median income for a family was $60,938. About 8.2% of families and 10.2% of the population were below the poverty line, including 14.2% of those under age 18 and 6.2% of those age 65 or over.
Common Questions
What is Per Capita Income in Vandenberg Village?
Per Capita income in Vandenberg Village is $47,000.
What is the Median Family Income in Vandenberg Village?
Median Family Income in Vandenberg Village is $120,000.
What is the Median Household income in Vandenberg Village?
Median Household Income in Vandenberg Village is $93,817.
What is Income or Wage Gap in Vandenberg Village?
Income or Wage Gap in Vandenberg Village is 29.0%.
Women in Vandenberg Village earn 71.0 cents for every dollar earned by a man.
What is Inequality or Gini Index in Vandenberg Village?
Inequality or Gini Index in Vandenberg Village is 0.41.
What is the Total Population of Vandenberg Village?
Total Population of Vandenberg Village is 6,702.
What is the Total Male Population of Vandenberg Village?
Total Male Population of Vandenberg Village is 3,570.
What is the Total Female Population of Vandenberg Village?
Total Female Population of Vandenberg Village is 3,132.
What is the Ratio of Males per 100 Females in Vandenberg Village?
There are 113.98 Males per 100 Females in Vandenberg Village.
What is the Ratio of Females per 100 Males in Vandenberg Village?
There are 87.73 Females per 100 Males in Vandenberg Village.
What is the Median Population Age in Vandenberg Village?
Median Population Age in Vandenberg Village is 46.2 Years.
What is the Average Family Size in Vandenberg Village
Average Family Size in Vandenberg Village is 3.0 People.
What is the Average Household Size in Vandenberg Village
Average Household Size in Vandenberg Village is 2.5 People.
How Large is the Labor Force in Vandenberg Village?
There are 3,509 People in the Labor Forcein in Vandenberg Village.
What is the Percentage of People in the Labor Force in Vandenberg Village?
63.2% of People are in the Labor Force in Vandenberg Village.
What is the Unemployment Rate in Vandenberg Village?
Unemployment Rate in Vandenberg Village is 7.1%.