Cities with the Highest Percentage of Population Employed in Architecture & Engineering in Delaware
RELATED REPORTS & OPTIONS
Architecture & Engineering
Delaware
Compare Cities
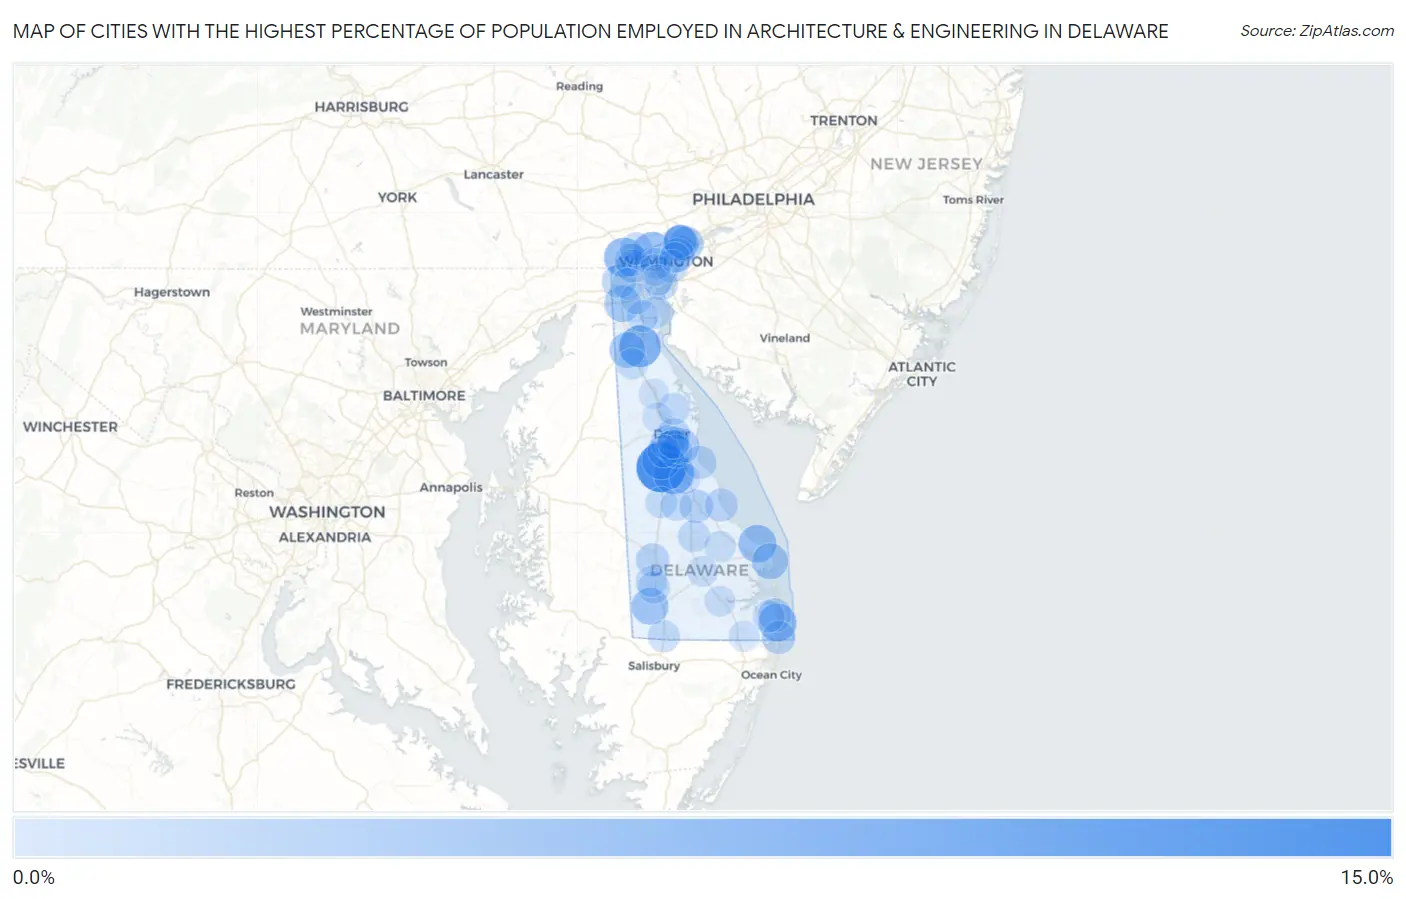
Map of Cities with the Highest Percentage of Population Employed in Architecture & Engineering in Delaware
0.0%
15.0%
Cities with the Highest Percentage of Population Employed in Architecture & Engineering in Delaware
| City | % Employed | vs State | vs National | |
| 1. | Viola | 12.2% | 1.7%(+10.5)#1 | 2.1%(+10.0)#344 |
| 2. | Odessa | 7.2% | 1.7%(+5.54)#2 | 2.1%(+5.08)#868 |
| 3. | Riverview | 6.6% | 1.7%(+4.92)#3 | 2.1%(+4.46)#1,020 |
| 4. | North Star | 5.8% | 1.7%(+4.08)#4 | 2.1%(+3.62)#1,352 |
| 5. | Lincoln | 5.5% | 1.7%(+3.85)#5 | 2.1%(+3.39)#1,489 |
| 6. | Greenville | 5.4% | 1.7%(+3.71)#6 | 2.1%(+3.25)#1,567 |
| 7. | Woodside | 5.4% | 1.7%(+3.67)#7 | 2.1%(+3.21)#1,589 |
| 8. | South Bethany | 4.9% | 1.7%(+3.17)#8 | 2.1%(+2.71)#1,929 |
| 9. | Lewes | 4.7% | 1.7%(+3.03)#9 | 2.1%(+2.57)#2,038 |
| 10. | Bethel | 4.2% | 1.7%(+2.51)#10 | 2.1%(+2.05)#2,520 |
| 11. | Glasgow | 3.8% | 1.7%(+2.08)#11 | 2.1%(+1.63)#3,056 |
| 12. | Rehoboth Beach | 3.6% | 1.7%(+1.92)#12 | 2.1%(+1.46)#3,322 |
| 13. | Ardencroft | 3.5% | 1.7%(+1.82)#13 | 2.1%(+1.36)#3,515 |
| 14. | Middletown | 3.5% | 1.7%(+1.77)#14 | 2.1%(+1.32)#3,586 |
| 15. | Dover Base Housing | 3.4% | 1.7%(+1.76)#15 | 2.1%(+1.30)#3,608 |
| 16. | Ardentown | 3.0% | 1.7%(+1.31)#16 | 2.1%(+0.851)#4,585 |
| 17. | Claymont | 2.7% | 1.7%(+1.03)#17 | 2.1%(+0.575)#5,344 |
| 18. | Rodney Village | 2.4% | 1.7%(+0.687)#18 | 2.1%(+0.227)#6,466 |
| 19. | Newark | 2.2% | 1.7%(+0.500)#19 | 2.1%(+0.040)#7,170 |
| 20. | Bellefonte | 2.2% | 1.7%(+0.492)#20 | 2.1%(+0.033)#7,196 |
| 21. | Milford | 2.1% | 1.7%(+0.365)#21 | 2.1%(-0.095)#7,732 |
| 22. | Bethany Beach | 2.0% | 1.7%(+0.356)#22 | 2.1%(-0.103)#7,760 |
| 23. | Dover | 2.0% | 1.7%(+0.325)#23 | 2.1%(-0.135)#7,872 |
| 24. | Bridgeville | 2.0% | 1.7%(+0.295)#24 | 2.1%(-0.164)#7,984 |
| 25. | Bowers | 2.0% | 1.7%(+0.271)#25 | 2.1%(-0.188)#8,073 |
| 26. | Highland Acres | 1.9% | 1.7%(+0.240)#26 | 2.1%(-0.219)#8,174 |
| 27. | Fenwick Island | 1.9% | 1.7%(+0.179)#27 | 2.1%(-0.280)#8,447 |
| 28. | New Castle | 1.9% | 1.7%(+0.175)#28 | 2.1%(-0.284)#8,470 |
| 29. | Rising Sun Lebanon | 1.8% | 1.7%(+0.100)#29 | 2.1%(-0.359)#8,804 |
| 30. | Pike Creek Valley | 1.7% | 1.7%(+0.039)#30 | 2.1%(-0.420)#9,094 |
| 31. | Slaughter Beach | 1.7% | 1.7%(+0.034)#31 | 2.1%(-0.425)#9,118 |
| 32. | Pike Creek | 1.7% | 1.7%(-0.010)#32 | 2.1%(-0.470)#9,330 |
| 33. | Arden | 1.7% | 1.7%(-0.017)#33 | 2.1%(-0.477)#9,359 |
| 34. | Wilmington | 1.6% | 1.7%(-0.066)#34 | 2.1%(-0.526)#9,597 |
| 35. | Hockessin | 1.6% | 1.7%(-0.083)#35 | 2.1%(-0.543)#9,692 |
| 36. | Camden | 1.4% | 1.7%(-0.317)#36 | 2.1%(-0.777)#10,857 |
| 37. | Kent Acres | 1.3% | 1.7%(-0.350)#37 | 2.1%(-0.810)#11,043 |
| 38. | Blades | 1.3% | 1.7%(-0.374)#38 | 2.1%(-0.833)#11,190 |
| 39. | Delaware City | 1.2% | 1.7%(-0.466)#39 | 2.1%(-0.926)#11,651 |
| 40. | Delmar | 1.2% | 1.7%(-0.478)#40 | 2.1%(-0.937)#11,706 |
| 41. | Ocean View | 1.2% | 1.7%(-0.480)#41 | 2.1%(-0.939)#11,718 |
| 42. | Leipsic | 1.1% | 1.7%(-0.566)#42 | 2.1%(-1.03)#12,162 |
| 43. | Ellendale | 1.1% | 1.7%(-0.626)#43 | 2.1%(-1.09)#12,489 |
| 44. | Brookside | 1.0% | 1.7%(-0.659)#44 | 2.1%(-1.12)#12,662 |
| 45. | St Georges | 1.00% | 1.7%(-0.694)#45 | 2.1%(-1.15)#12,862 |
| 46. | Elsmere | 0.98% | 1.7%(-0.714)#46 | 2.1%(-1.17)#12,977 |
| 47. | Newport | 0.92% | 1.7%(-0.766)#47 | 2.1%(-1.22)#13,274 |
| 48. | Harrington | 0.87% | 1.7%(-0.817)#48 | 2.1%(-1.28)#13,555 |
| 49. | Houston | 0.79% | 1.7%(-0.896)#49 | 2.1%(-1.36)#14,021 |
| 50. | Bear | 0.76% | 1.7%(-0.932)#50 | 2.1%(-1.39)#14,238 |
| 51. | Seaford | 0.75% | 1.7%(-0.935)#51 | 2.1%(-1.39)#14,256 |
| 52. | Townsend | 0.65% | 1.7%(-1.04)#52 | 2.1%(-1.50)#14,831 |
| 53. | Milton | 0.64% | 1.7%(-1.05)#53 | 2.1%(-1.51)#14,889 |
| 54. | Georgetown | 0.48% | 1.7%(-1.21)#54 | 2.1%(-1.67)#15,693 |
| 55. | Wilmington Manor | 0.48% | 1.7%(-1.21)#55 | 2.1%(-1.67)#15,722 |
| 56. | Millsboro | 0.44% | 1.7%(-1.25)#56 | 2.1%(-1.71)#15,895 |
| 57. | Frederica | 0.41% | 1.7%(-1.28)#57 | 2.1%(-1.74)#16,021 |
| 58. | Edgemoor | 0.35% | 1.7%(-1.34)#58 | 2.1%(-1.80)#16,297 |
| 59. | Selbyville | 0.34% | 1.7%(-1.35)#59 | 2.1%(-1.81)#16,356 |
| 60. | Smyrna | 0.20% | 1.7%(-1.49)#60 | 2.1%(-1.95)#16,715 |
| 61. | Cheswold | 0.14% | 1.7%(-1.55)#61 | 2.1%(-2.01)#16,800 |
1
Common Questions
What are the Top 10 Cities with the Highest Percentage of Population Employed in Architecture & Engineering in Delaware?
Top 10 Cities with the Highest Percentage of Population Employed in Architecture & Engineering in Delaware are:
#1
12.2%
#2
7.2%
#3
6.6%
#4
5.8%
#5
5.4%
#6
5.4%
#7
4.9%
#8
4.7%
#9
4.2%
#10
3.8%
What city has the Highest Percentage of Population Employed in Architecture & Engineering in Delaware?
Viola has the Highest Percentage of Population Employed in Architecture & Engineering in Delaware with 12.2%.
What is the Percentage of Population Employed in Architecture & Engineering in the State of Delaware?
Percentage of Population Employed in Architecture & Engineering in Delaware is 1.7%.
What is the Percentage of Population Employed in Architecture & Engineering in the United States?
Percentage of Population Employed in Architecture & Engineering in the United States is 2.1%.