Cupertino, CA Map & Demographics
Cupertino Map
Cupertino Overview
$99,138
PER CAPITA INCOME
$250,001
AVG FAMILY INCOME
$223,667
AVG HOUSEHOLD INCOME
45.6%
WAGE / INCOME GAP [ % ]
54.4¢/ $1
WAGE / INCOME GAP [ $ ]
$11,958
FAMILY INCOME DEFICIT
0.45
INEQUALITY / GINI INDEX
59,763
TOTAL POPULATION
31,431
MALE POPULATION
28,332
FEMALE POPULATION
110.94
MALES / 100 FEMALES
90.14
FEMALES / 100 MALES
40.4
MEDIAN AGE
3.2
AVG FAMILY SIZE
2.9
AVG HOUSEHOLD SIZE
29,023
LABOR FORCE [ PEOPLE ]
61.5%
PERCENT IN LABOR FORCE
3.0%
UNEMPLOYMENT RATE
Cupertino Zip Codes
Cupertino Area Codes
Income in Cupertino
Income Overview in Cupertino
Per Capita Income in Cupertino is $99,138, while median incomes of families and households are $250,001 and $223,667 respectively.
| Characteristic | Number | Measure |
| Per Capita Income | 59,763 | $99,138 |
| Median Family Income | 15,949 | $250,001 |
| Mean Family Income | 15,949 | $323,500 |
| Median Household Income | 20,744 | $223,667 |
| Mean Household Income | 20,744 | $283,063 |
| Income Deficit | 15,949 | $11,958 |
| Wage / Income Gap (%) | 59,763 | 45.60% |
| Wage / Income Gap ($) | 59,763 | 54.40¢ per $1 |
| Gini / Inequality Index | 59,763 | 0.45 |
Earnings by Sex in Cupertino
Average Earnings in Cupertino are $141,329, $173,844 for men and $94,567 for women, a difference of 45.6%.
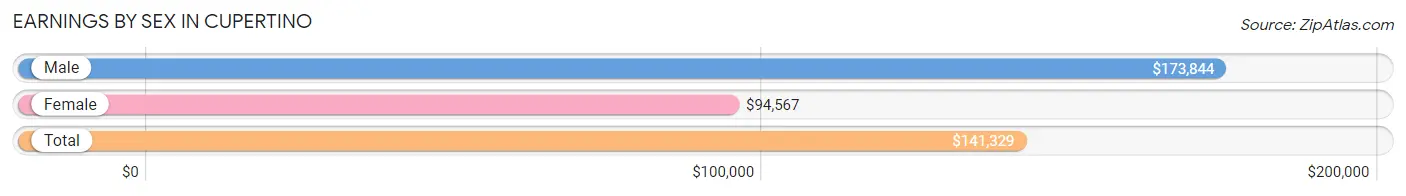
| Sex | Number | Average Earnings |
| Male | 18,229 (60.1%) | $173,844 |
| Female | 12,110 (39.9%) | $94,567 |
| Total | 30,339 (100.0%) | $141,329 |
Earnings by Sex by Income Bracket in Cupertino
The most common earnings brackets in Cupertino are $100,000+ for men (13,038 | 71.5%) and $100,000+ for women (5,823 | 48.1%).
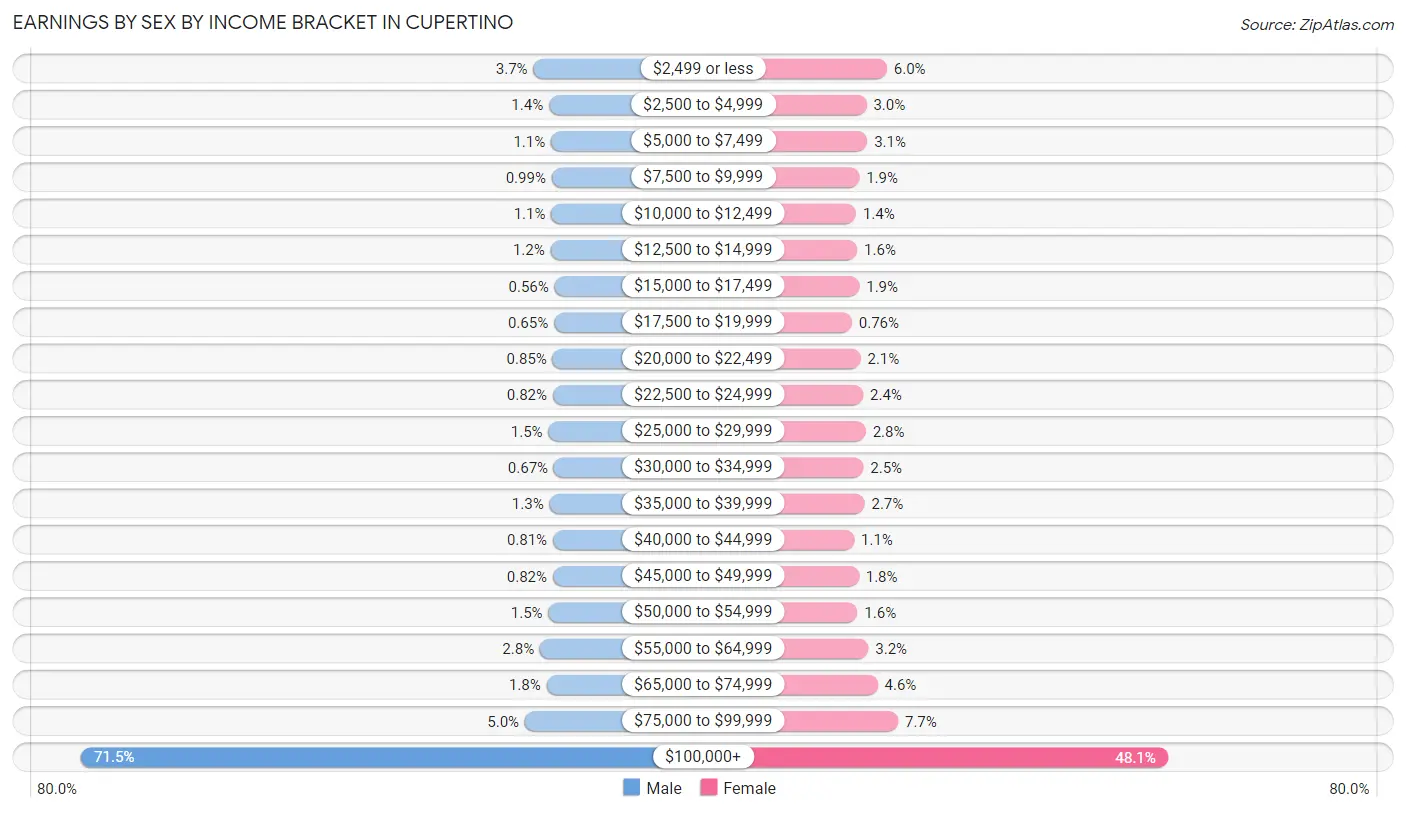
| Income | Male | Female |
| $2,499 or less | 680 (3.7%) | 726 (6.0%) |
| $2,500 to $4,999 | 255 (1.4%) | 357 (2.9%) |
| $5,000 to $7,499 | 201 (1.1%) | 371 (3.1%) |
| $7,500 to $9,999 | 181 (1.0%) | 225 (1.9%) |
| $10,000 to $12,499 | 193 (1.1%) | 167 (1.4%) |
| $12,500 to $14,999 | 214 (1.2%) | 188 (1.5%) |
| $15,000 to $17,499 | 102 (0.6%) | 227 (1.9%) |
| $17,500 to $19,999 | 118 (0.6%) | 92 (0.8%) |
| $20,000 to $22,499 | 155 (0.9%) | 249 (2.1%) |
| $22,500 to $24,999 | 150 (0.8%) | 295 (2.4%) |
| $25,000 to $29,999 | 272 (1.5%) | 344 (2.8%) |
| $30,000 to $34,999 | 123 (0.7%) | 300 (2.5%) |
| $35,000 to $39,999 | 242 (1.3%) | 322 (2.7%) |
| $40,000 to $44,999 | 147 (0.8%) | 133 (1.1%) |
| $45,000 to $49,999 | 149 (0.8%) | 218 (1.8%) |
| $50,000 to $54,999 | 271 (1.5%) | 193 (1.6%) |
| $55,000 to $64,999 | 502 (2.8%) | 391 (3.2%) |
| $65,000 to $74,999 | 322 (1.8%) | 559 (4.6%) |
| $75,000 to $99,999 | 914 (5.0%) | 930 (7.7%) |
| $100,000+ | 13,038 (71.5%) | 5,823 (48.1%) |
| Total | 18,229 (100.0%) | 12,110 (100.0%) |
Earnings by Sex by Educational Attainment in Cupertino
Average earnings in Cupertino are $189,136 for men and $108,810 for women, a difference of 42.5%. Men with an educational attainment of graduate degree enjoy the highest average annual earnings of $212,903, while those with less than high school education earn the least with $36,472. Women with an educational attainment of graduate degree earn the most with the average annual earnings of $145,089, while those with less than high school education have the smallest earnings of $20,500.
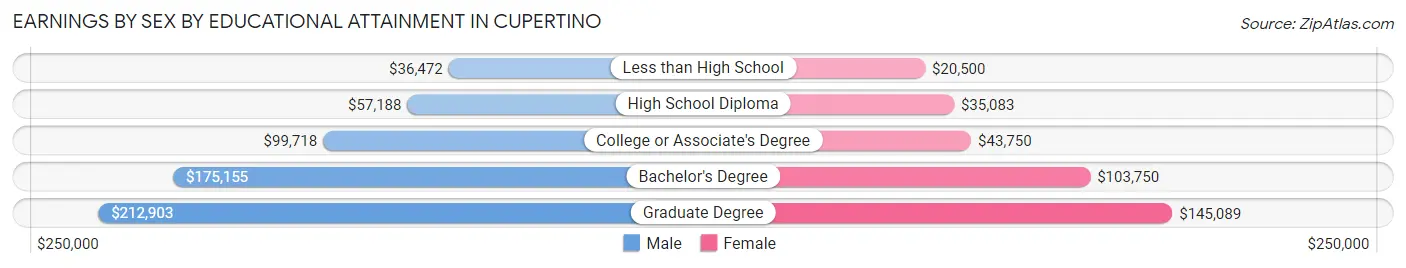
| Educational Attainment | Male Income | Female Income |
| Less than High School | $36,472 | $20,500 |
| High School Diploma | $57,188 | $35,083 |
| College or Associate's Degree | $99,718 | $43,750 |
| Bachelor's Degree | $175,155 | $103,750 |
| Graduate Degree | $212,903 | $145,089 |
| Total | $189,136 | $108,810 |
Family Income in Cupertino
Family Income Brackets in Cupertino
According to the Cupertino family income data, there are 10,207 families falling into the $200,000+ income range, which is the most common income bracket and makes up 64.0% of all families. Conversely, the $10,000 to $14,999 income bracket is the least frequent group with only 80 families (0.5%) belonging to this category.
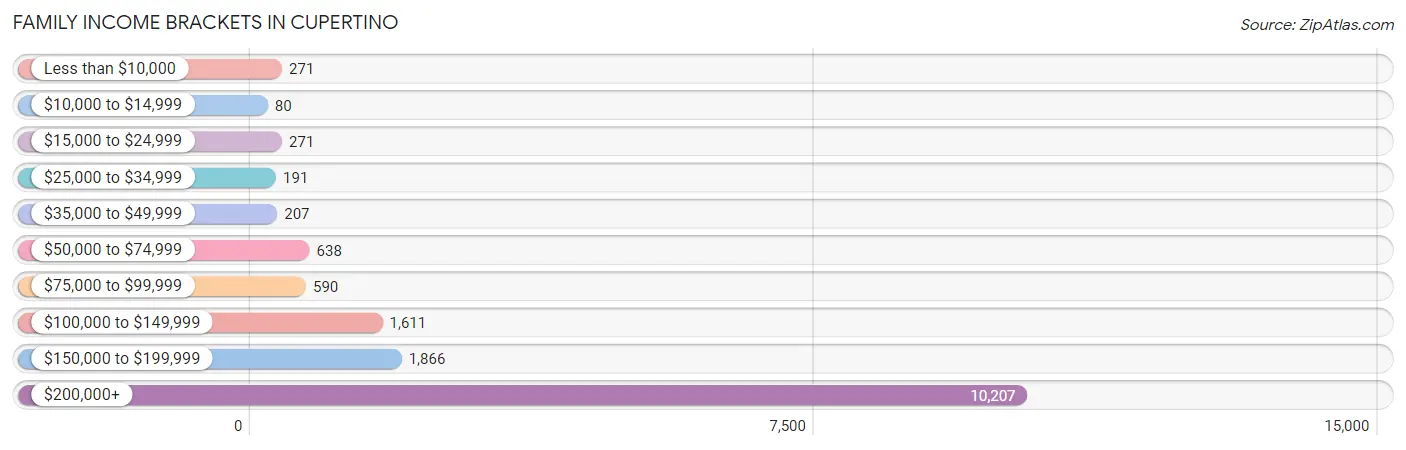
| Income Bracket | # Families | % Families |
| Less than $10,000 | 271 | 1.7% |
| $10,000 to $14,999 | 80 | 0.5% |
| $15,000 to $24,999 | 271 | 1.7% |
| $25,000 to $34,999 | 191 | 1.2% |
| $35,000 to $49,999 | 207 | 1.3% |
| $50,000 to $74,999 | 638 | 4.0% |
| $75,000 to $99,999 | 590 | 3.7% |
| $100,000 to $149,999 | 1,611 | 10.1% |
| $150,000 to $199,999 | 1,866 | 11.7% |
| $200,000+ | 10,207 | 64.0% |
Family Income by Famaliy Size in Cupertino
3-person families (4,790 | 30.0%) account for the highest median family income in Cupertino with $250,001 per family, while 2-person families (4,993 | 31.3%) have the highest median income of $93,412 per family member.
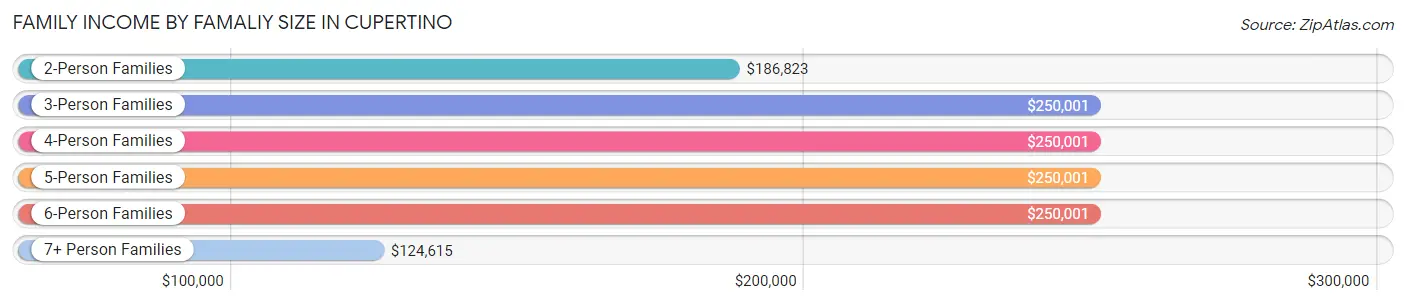
| Income Bracket | # Families | Median Income |
| 2-Person Families | 4,993 (31.3%) | $186,823 |
| 3-Person Families | 4,790 (30.0%) | $250,001 |
| 4-Person Families | 4,783 (30.0%) | $250,001 |
| 5-Person Families | 1,084 (6.8%) | $250,001 |
| 6-Person Families | 233 (1.5%) | $250,001 |
| 7+ Person Families | 66 (0.4%) | $124,615 |
| Total | 15,949 (100.0%) | $250,001 |
Family Income by Number of Earners in Cupertino
The median family income in Cupertino is $250,001, with families comprising 2 earners (7,213) having the highest median family income of $250,001, while families with no earners (1,713) have the lowest median family income of $87,188, accounting for 45.2% and 10.7% of families, respectively.
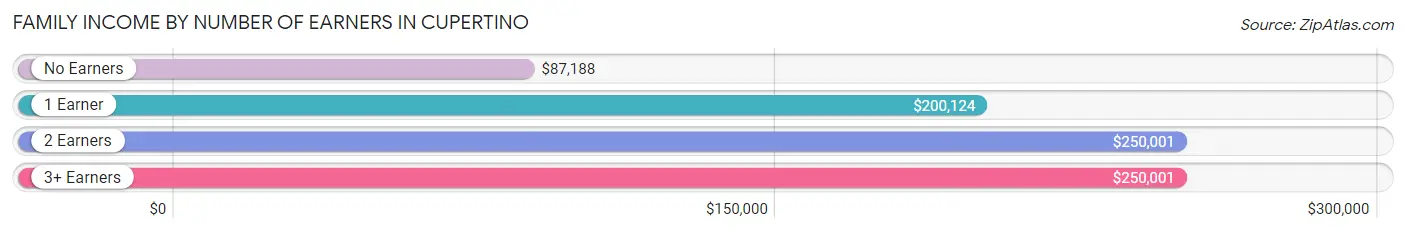
| Number of Earners | # Families | Median Income |
| No Earners | 1,713 (10.7%) | $87,188 |
| 1 Earner | 5,321 (33.4%) | $200,124 |
| 2 Earners | 7,213 (45.2%) | $250,001 |
| 3+ Earners | 1,702 (10.7%) | $250,001 |
| Total | 15,949 (100.0%) | $250,001 |
Household Income in Cupertino
Household Income Brackets in Cupertino
With 11,347 households falling in the category, the $200,000+ income range is the most frequent in Cupertino, accounting for 54.7% of all households. In contrast, only 228 households (1.1%) fall into the $10,000 to $14,999 income bracket, making it the least populous group.
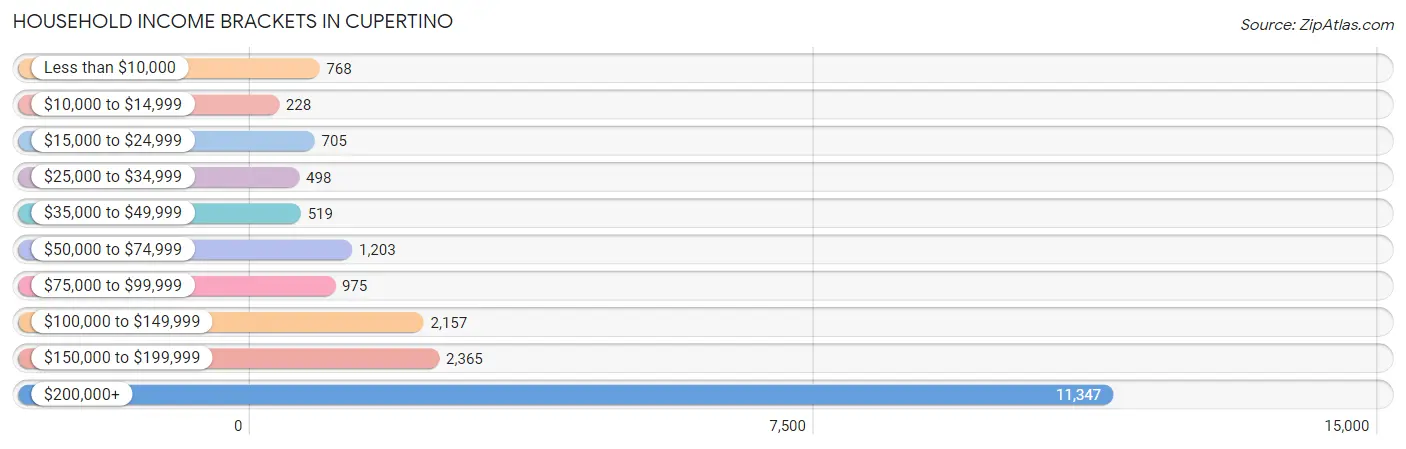
| Income Bracket | # Households | % Households |
| Less than $10,000 | 768 | 3.7% |
| $10,000 to $14,999 | 228 | 1.1% |
| $15,000 to $24,999 | 705 | 3.4% |
| $25,000 to $34,999 | 498 | 2.4% |
| $35,000 to $49,999 | 519 | 2.5% |
| $50,000 to $74,999 | 1,203 | 5.8% |
| $75,000 to $99,999 | 975 | 4.7% |
| $100,000 to $149,999 | 2,157 | 10.4% |
| $150,000 to $199,999 | 2,365 | 11.4% |
| $200,000+ | 11,347 | 54.7% |
Household Income by Householder Age in Cupertino
The median household income in Cupertino is $223,667, with the highest median household income of $250,001 found in the 25 to 44 years age bracket for the primary householder. A total of 6,969 households (33.6%) fall into this category. Meanwhile, the 15 to 24 years age bracket for the primary householder has the lowest median household income of $70,202, with 455 households (2.2%) in this group.
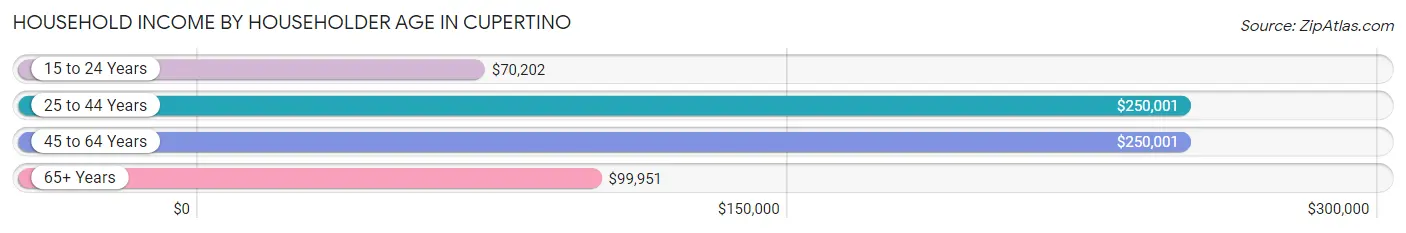
| Income Bracket | # Households | Median Income |
| 15 to 24 Years | 455 (2.2%) | $70,202 |
| 25 to 44 Years | 6,969 (33.6%) | $250,001 |
| 45 to 64 Years | 8,959 (43.2%) | $250,001 |
| 65+ Years | 4,361 (21.0%) | $99,951 |
| Total | 20,744 (100.0%) | $223,667 |
Poverty in Cupertino
Income Below Poverty by Sex and Age in Cupertino
With 5.7% poverty level for males and 4.8% for females among the residents of Cupertino, 18 to 24 year old males and 18 to 24 year old females are the most vulnerable to poverty, with 592 males (19.5%) and 189 females (10.2%) in their respective age groups living below the poverty level.
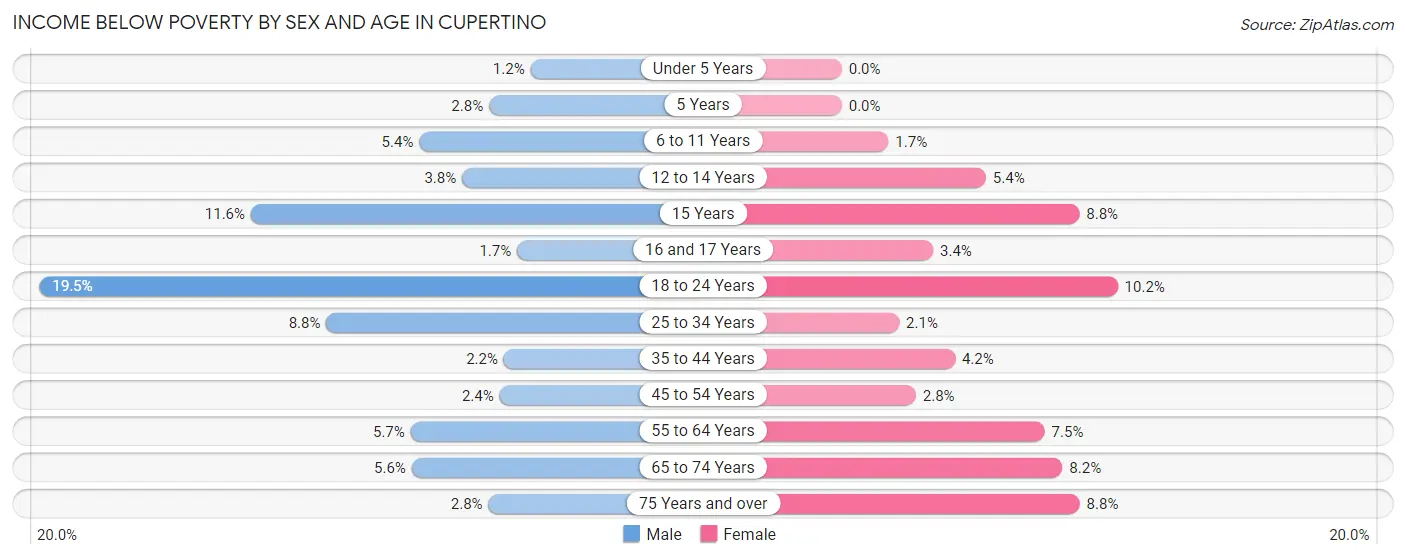
| Age Bracket | Male | Female |
| Under 5 Years | 18 (1.2%) | 0 (0.0%) |
| 5 Years | 11 (2.8%) | 0 (0.0%) |
| 6 to 11 Years | 134 (5.3%) | 46 (1.7%) |
| 12 to 14 Years | 61 (3.8%) | 82 (5.3%) |
| 15 Years | 53 (11.6%) | 30 (8.8%) |
| 16 and 17 Years | 19 (1.7%) | 26 (3.4%) |
| 18 to 24 Years | 592 (19.5%) | 189 (10.2%) |
| 25 to 34 Years | 317 (8.8%) | 55 (2.1%) |
| 35 to 44 Years | 106 (2.2%) | 194 (4.2%) |
| 45 to 54 Years | 123 (2.4%) | 133 (2.8%) |
| 55 to 64 Years | 201 (5.7%) | 229 (7.5%) |
| 65 to 74 Years | 108 (5.6%) | 169 (8.2%) |
| 75 Years and over | 44 (2.8%) | 207 (8.8%) |
| Total | 1,787 (5.7%) | 1,360 (4.8%) |
Income Above Poverty by Sex and Age in Cupertino
According to the poverty statistics in Cupertino, males aged under 5 years and females aged under 5 years are the age groups that are most secure financially, with 98.8% of males and 100.0% of females in these age groups living above the poverty line.
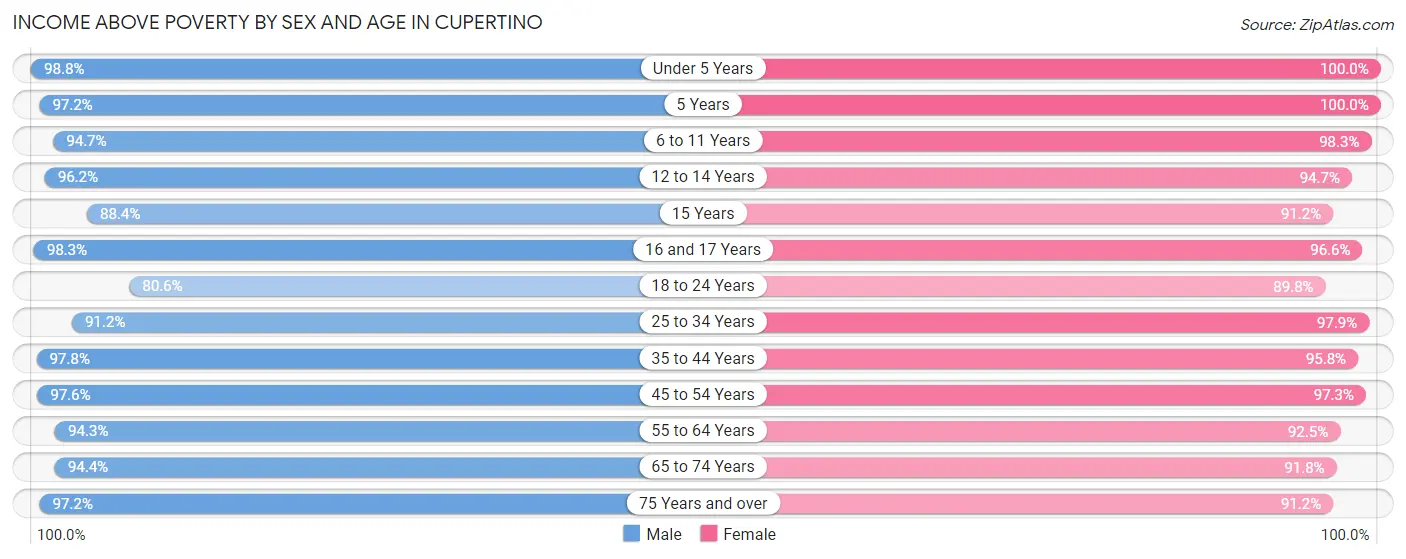
| Age Bracket | Male | Female |
| Under 5 Years | 1,458 (98.8%) | 1,244 (100.0%) |
| 5 Years | 387 (97.2%) | 284 (100.0%) |
| 6 to 11 Years | 2,373 (94.7%) | 2,609 (98.3%) |
| 12 to 14 Years | 1,560 (96.2%) | 1,450 (94.7%) |
| 15 Years | 404 (88.4%) | 310 (91.2%) |
| 16 and 17 Years | 1,084 (98.3%) | 742 (96.6%) |
| 18 to 24 Years | 2,451 (80.5%) | 1,656 (89.8%) |
| 25 to 34 Years | 3,286 (91.2%) | 2,531 (97.9%) |
| 35 to 44 Years | 4,694 (97.8%) | 4,421 (95.8%) |
| 45 to 54 Years | 5,062 (97.6%) | 4,711 (97.3%) |
| 55 to 64 Years | 3,343 (94.3%) | 2,812 (92.5%) |
| 65 to 74 Years | 1,809 (94.4%) | 1,894 (91.8%) |
| 75 Years and over | 1,536 (97.2%) | 2,136 (91.2%) |
| Total | 29,447 (94.3%) | 26,800 (95.2%) |
Income Below Poverty Among Married-Couple Families in Cupertino
The poverty statistics for married-couple families in Cupertino show that 2.5% or 344 of the total 14,057 families live below the poverty line. Families with no children have the highest poverty rate of 3.5%, comprising of 202 families. On the other hand, families with 3 or 4 children have the lowest poverty rate of 0.0%, which includes 0 families.
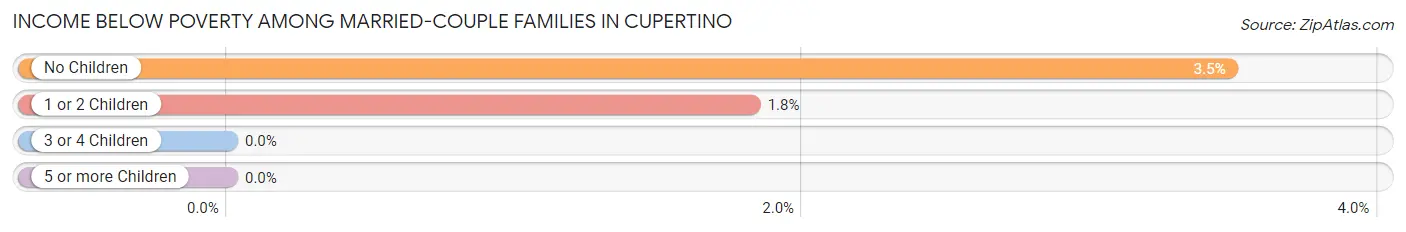
| Children | Above Poverty | Below Poverty |
| No Children | 5,605 (96.5%) | 202 (3.5%) |
| 1 or 2 Children | 7,662 (98.2%) | 142 (1.8%) |
| 3 or 4 Children | 433 (100.0%) | 0 (0.0%) |
| 5 or more Children | 13 (100.0%) | 0 (0.0%) |
| Total | 13,713 (97.6%) | 344 (2.5%) |
Income Below Poverty Among Single-Parent Households in Cupertino
According to the poverty data in Cupertino, 7.3% or 45 single-father households and 13.9% or 177 single-mother households are living below the poverty line. Among single-father households, those with 1 or 2 children have the highest poverty rate, with 23 households (8.6%) experiencing poverty. Likewise, among single-mother households, those with 1 or 2 children have the highest poverty rate, with 159 households (27.8%) falling below the poverty line.
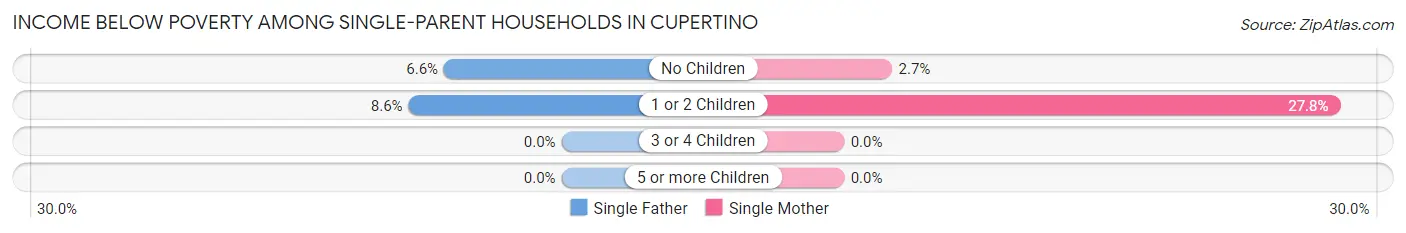
| Children | Single Father | Single Mother |
| No Children | 22 (6.6%) | 18 (2.7%) |
| 1 or 2 Children | 23 (8.6%) | 159 (27.8%) |
| 3 or 4 Children | 0 (0.0%) | 0 (0.0%) |
| 5 or more Children | 0 (0.0%) | 0 (0.0%) |
| Total | 45 (7.3%) | 177 (13.9%) |
Income Below Poverty Among Married-Couple vs Single-Parent Households in Cupertino
The poverty data for Cupertino shows that 344 of the married-couple family households (2.5%) and 222 of the single-parent households (11.7%) are living below the poverty level. Within the married-couple family households, those with no children have the highest poverty rate, with 202 households (3.5%) falling below the poverty line. Among the single-parent households, those with 1 or 2 children have the highest poverty rate, with 182 household (21.6%) living below poverty.
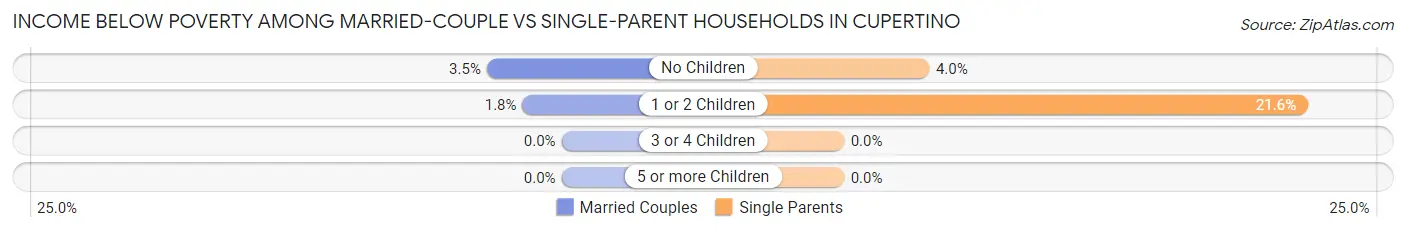
| Children | Married-Couple Families | Single-Parent Households |
| No Children | 202 (3.5%) | 40 (4.0%) |
| 1 or 2 Children | 142 (1.8%) | 182 (21.6%) |
| 3 or 4 Children | 0 (0.0%) | 0 (0.0%) |
| 5 or more Children | 0 (0.0%) | 0 (0.0%) |
| Total | 344 (2.5%) | 222 (11.7%) |
Race in Cupertino
The most populous races in Cupertino are Asian (41,933 | 70.2%), White / Caucasian (13,575 | 22.7%), and Two or more Races (2,793 | 4.7%).
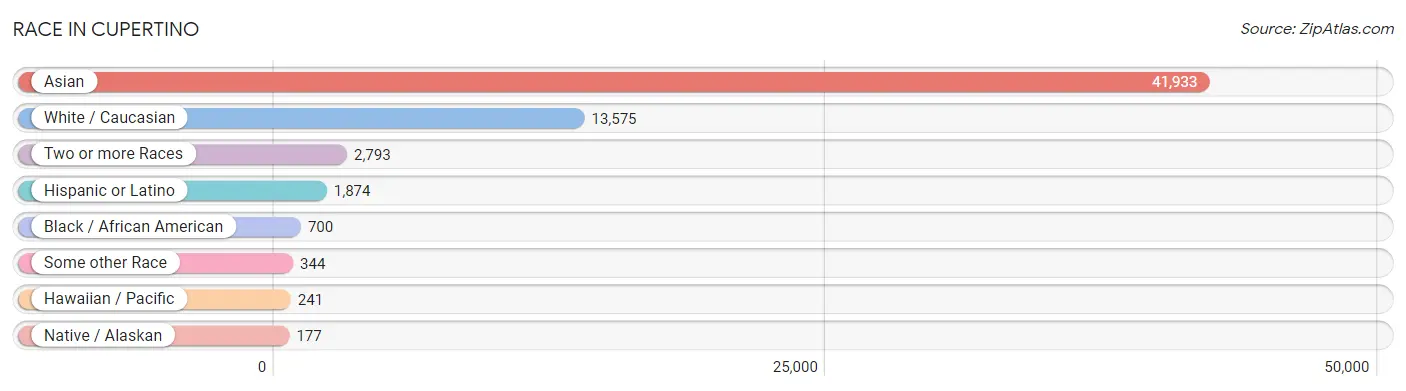
| Race | # Population | % Population |
| Asian | 41,933 | 70.2% |
| Black / African American | 700 | 1.2% |
| Hawaiian / Pacific | 241 | 0.4% |
| Hispanic or Latino | 1,874 | 3.1% |
| Native / Alaskan | 177 | 0.3% |
| White / Caucasian | 13,575 | 22.7% |
| Two or more Races | 2,793 | 4.7% |
| Some other Race | 344 | 0.6% |
| Total | 59,763 | 100.0% |
Ancestry in Cupertino
The most populous ancestries reported in Cupertino are Thai (18,147 | 30.4%), Indian (Asian) (17,859 | 29.9%), Burmese (2,635 | 4.4%), German (2,060 | 3.5%), and English (1,961 | 3.3%), together accounting for 71.4% of all Cupertino residents.
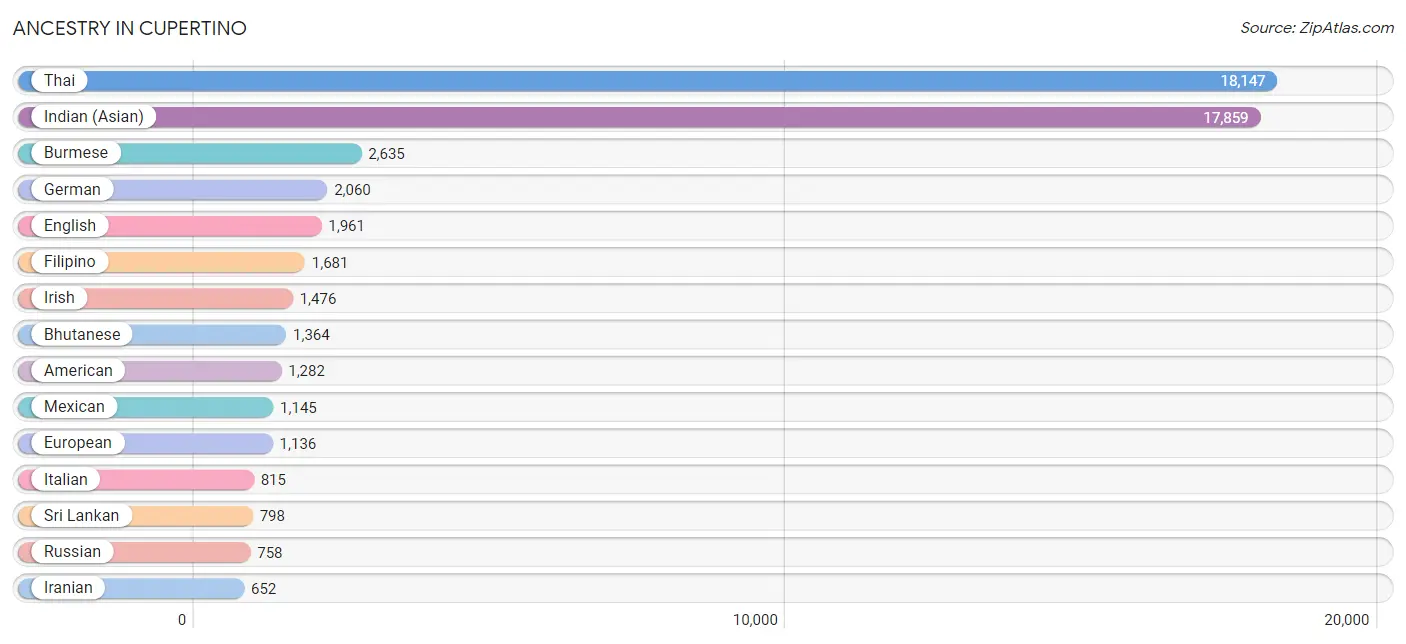
| Ancestry | # Population | % Population |
| African | 395 | 0.7% |
| American | 1,282 | 2.1% |
| Arab | 226 | 0.4% |
| Argentinean | 16 | 0.0% |
| Armenian | 86 | 0.1% |
| Australian | 13 | 0.0% |
| Austrian | 141 | 0.2% |
| Bangladeshi | 27 | 0.1% |
| Basque | 15 | 0.0% |
| Belgian | 78 | 0.1% |
| Bhutanese | 1,364 | 2.3% |
| British | 348 | 0.6% |
| British West Indian | 3 | 0.0% |
| Bulgarian | 21 | 0.0% |
| Burmese | 2,635 | 4.4% |
| Canadian | 19 | 0.0% |
| Central American | 183 | 0.3% |
| Central American Indian | 53 | 0.1% |
| Cherokee | 13 | 0.0% |
| Chippewa | 6 | 0.0% |
| Colombian | 44 | 0.1% |
| Croatian | 22 | 0.0% |
| Czech | 125 | 0.2% |
| Czechoslovakian | 25 | 0.0% |
| Danish | 60 | 0.1% |
| Dutch | 242 | 0.4% |
| Eastern European | 73 | 0.1% |
| Egyptian | 108 | 0.2% |
| English | 1,961 | 3.3% |
| European | 1,136 | 1.9% |
| Filipino | 1,681 | 2.8% |
| Finnish | 125 | 0.2% |
| French | 506 | 0.9% |
| French Canadian | 227 | 0.4% |
| German | 2,060 | 3.5% |
| Greek | 84 | 0.1% |
| Guamanian / Chamorro | 72 | 0.1% |
| Guyanese | 3 | 0.0% |
| Haitian | 53 | 0.1% |
| Hungarian | 94 | 0.2% |
| Indian (Asian) | 17,859 | 29.9% |
| Indonesian | 24 | 0.0% |
| Iranian | 652 | 1.1% |
| Irish | 1,476 | 2.5% |
| Israeli | 50 | 0.1% |
| Italian | 815 | 1.4% |
| Japanese | 15 | 0.0% |
| Korean | 594 | 1.0% |
| Laotian | 35 | 0.1% |
| Lebanese | 13 | 0.0% |
| Lithuanian | 63 | 0.1% |
| Mexican | 1,145 | 1.9% |
| Mexican American Indian | 81 | 0.1% |
| Mongolian | 10 | 0.0% |
| Moroccan | 22 | 0.0% |
| Native Hawaiian | 129 | 0.2% |
| New Zealander | 27 | 0.1% |
| Nicaraguan | 38 | 0.1% |
| Nigerian | 6 | 0.0% |
| Northern European | 75 | 0.1% |
| Norwegian | 266 | 0.4% |
| Pakistani | 80 | 0.1% |
| Palestinian | 18 | 0.0% |
| Pennsylvania German | 9 | 0.0% |
| Peruvian | 59 | 0.1% |
| Polish | 495 | 0.8% |
| Portuguese | 237 | 0.4% |
| Puerto Rican | 119 | 0.2% |
| Romanian | 169 | 0.3% |
| Russian | 758 | 1.3% |
| Salvadoran | 145 | 0.2% |
| Samoan | 1 | 0.0% |
| Scandinavian | 81 | 0.1% |
| Scotch-Irish | 160 | 0.3% |
| Scottish | 455 | 0.8% |
| Serbian | 5 | 0.0% |
| Slavic | 24 | 0.0% |
| Slovak | 52 | 0.1% |
| Slovene | 35 | 0.1% |
| Somali | 79 | 0.1% |
| South American | 224 | 0.4% |
| South American Indian | 17 | 0.0% |
| Spaniard | 107 | 0.2% |
| Spanish | 61 | 0.1% |
| Sri Lankan | 798 | 1.3% |
| Subsaharan African | 485 | 0.8% |
| Swedish | 331 | 0.5% |
| Swiss | 163 | 0.3% |
| Syrian | 6 | 0.0% |
| Thai | 18,147 | 30.4% |
| Tongan | 6 | 0.0% |
| Turkish | 321 | 0.5% |
| Ukrainian | 362 | 0.6% |
| Uruguayan | 36 | 0.1% |
| Venezuelan | 69 | 0.1% |
| Vietnamese | 57 | 0.1% |
| Welsh | 66 | 0.1% |
| Yakama | 7 | 0.0% |
| Yugoslavian | 34 | 0.1% | View All 99 Rows |
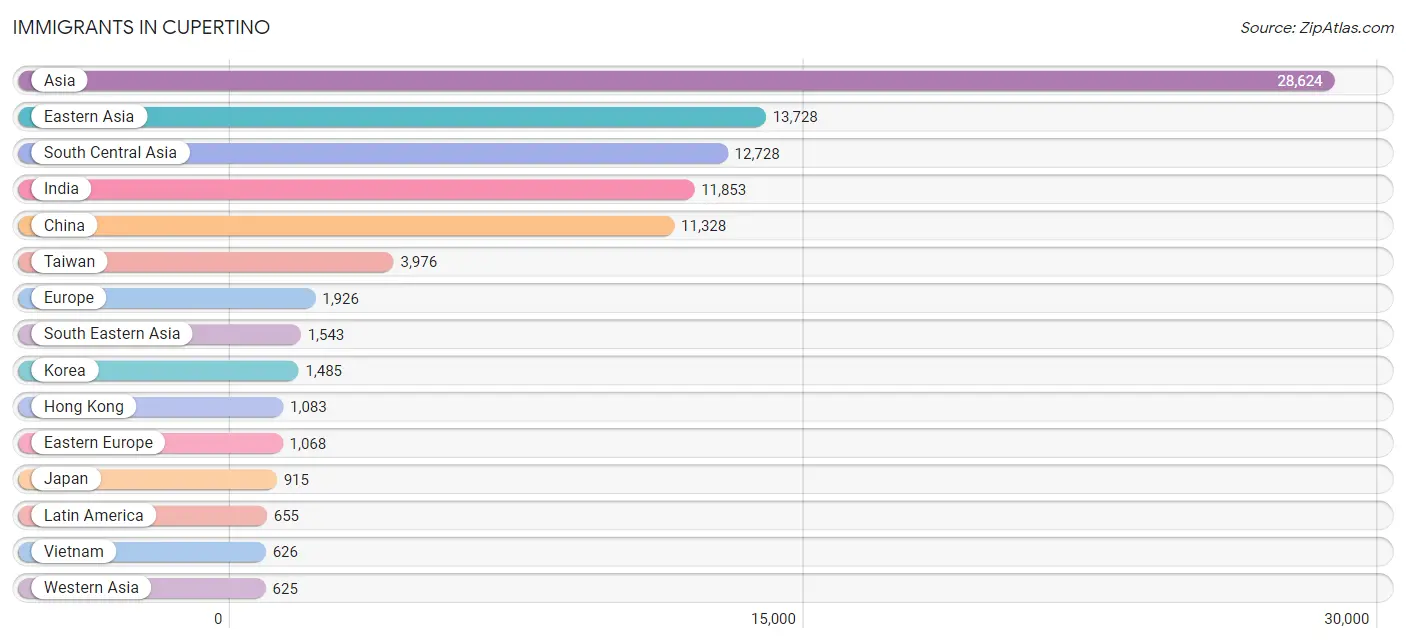
Immigrants in Cupertino
The most numerous immigrant groups reported in Cupertino came from Asia (28,624 | 47.9%), Eastern Asia (13,728 | 23.0%), South Central Asia (12,728 | 21.3%), India (11,853 | 19.8%), and China (11,328 | 19.0%), together accounting for 130.9% of all Cupertino residents.
| Immigration Origin | # Population | % Population |
| Africa | 434 | 0.7% |
| Argentina | 16 | 0.0% |
| Asia | 28,624 | 47.9% |
| Australia | 29 | 0.1% |
| Austria | 56 | 0.1% |
| Bangladesh | 60 | 0.1% |
| Belarus | 78 | 0.1% |
| Belgium | 22 | 0.0% |
| Bosnia and Herzegovina | 12 | 0.0% |
| Brazil | 91 | 0.2% |
| Bulgaria | 9 | 0.0% |
| Cambodia | 36 | 0.1% |
| Canada | 418 | 0.7% |
| Central America | 400 | 0.7% |
| China | 11,328 | 19.0% |
| Colombia | 29 | 0.1% |
| Czechoslovakia | 12 | 0.0% |
| Denmark | 10 | 0.0% |
| Eastern Africa | 251 | 0.4% |
| Eastern Asia | 13,728 | 23.0% |
| Eastern Europe | 1,068 | 1.8% |
| Egypt | 40 | 0.1% |
| El Salvador | 64 | 0.1% |
| England | 96 | 0.2% |
| Eritrea | 117 | 0.2% |
| Europe | 1,926 | 3.2% |
| Fiji | 57 | 0.1% |
| France | 85 | 0.1% |
| Germany | 117 | 0.2% |
| Greece | 6 | 0.0% |
| Hong Kong | 1,083 | 1.8% |
| Hungary | 16 | 0.0% |
| India | 11,853 | 19.8% |
| Indonesia | 167 | 0.3% |
| Iran | 438 | 0.7% |
| Ireland | 89 | 0.2% |
| Israel | 163 | 0.3% |
| Italy | 100 | 0.2% |
| Japan | 915 | 1.5% |
| Kenya | 63 | 0.1% |
| Korea | 1,485 | 2.5% |
| Latin America | 655 | 1.1% |
| Lebanon | 31 | 0.1% |
| Malaysia | 145 | 0.2% |
| Mexico | 323 | 0.5% |
| Micronesia | 32 | 0.1% |
| Moldova | 41 | 0.1% |
| Morocco | 36 | 0.1% |
| Nepal | 180 | 0.3% |
| Nicaragua | 13 | 0.0% |
| Northern Africa | 90 | 0.2% |
| Northern Europe | 400 | 0.7% |
| Oceania | 162 | 0.3% |
| Pakistan | 139 | 0.2% |
| Peru | 14 | 0.0% |
| Philippines | 251 | 0.4% |
| Poland | 99 | 0.2% |
| Romania | 55 | 0.1% |
| Russia | 424 | 0.7% |
| Saudi Arabia | 21 | 0.0% |
| Scotland | 19 | 0.0% |
| Sierra Leone | 13 | 0.0% |
| Singapore | 138 | 0.2% |
| Somalia | 41 | 0.1% |
| South Africa | 75 | 0.1% |
| South America | 255 | 0.4% |
| South Central Asia | 12,728 | 21.3% |
| South Eastern Asia | 1,543 | 2.6% |
| Southern Europe | 144 | 0.2% |
| Spain | 38 | 0.1% |
| Sweden | 44 | 0.1% |
| Switzerland | 34 | 0.1% |
| Taiwan | 3,976 | 6.7% |
| Thailand | 100 | 0.2% |
| Turkey | 276 | 0.5% |
| Ukraine | 254 | 0.4% |
| Uruguay | 36 | 0.1% |
| Venezuela | 69 | 0.1% |
| Vietnam | 626 | 1.1% |
| Western Africa | 13 | 0.0% |
| Western Asia | 625 | 1.1% |
| Western Europe | 314 | 0.5% | View All 82 Rows |
Sex and Age in Cupertino
Sex and Age in Cupertino
The most populous age groups in Cupertino are 40 to 44 Years (2,940 | 9.3%) for men and 40 to 44 Years (2,630 | 9.3%) for women.
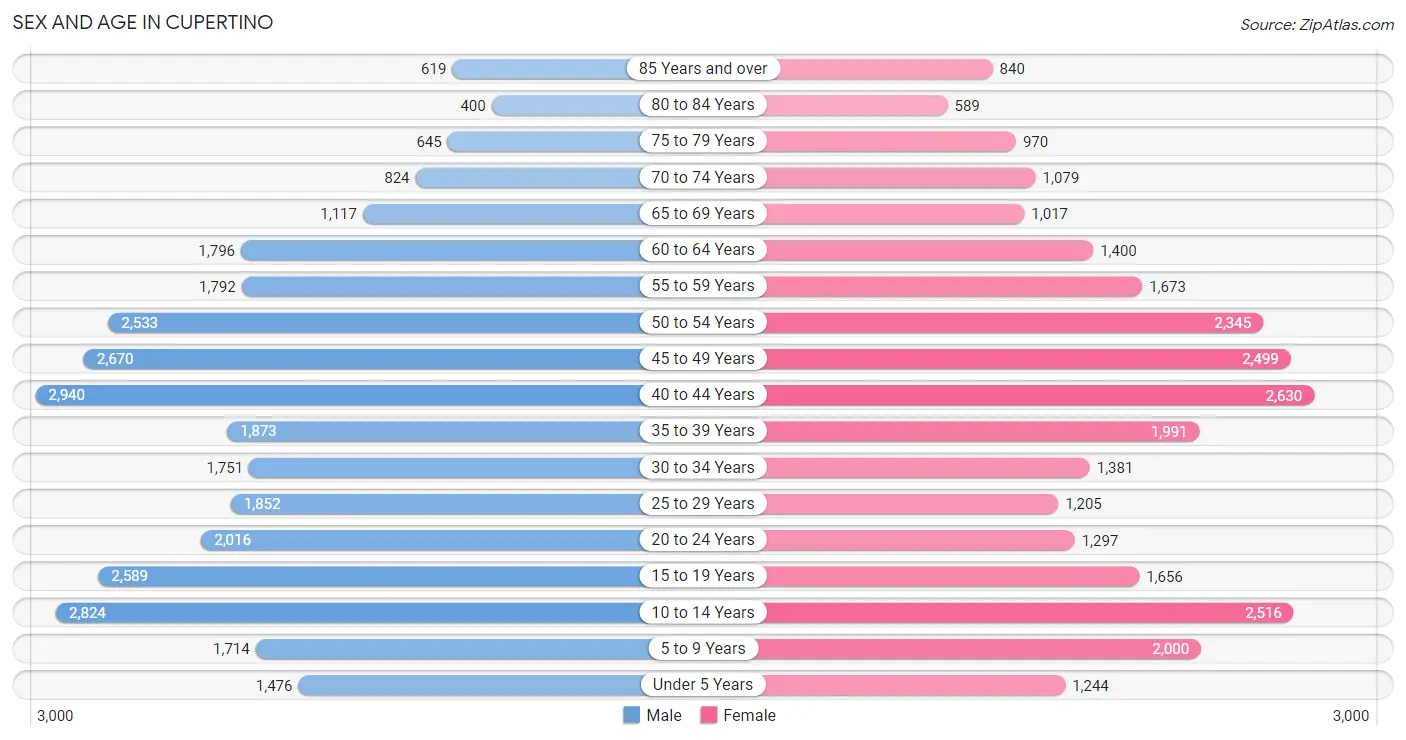
| Age Bracket | Male | Female |
| Under 5 Years | 1,476 (4.7%) | 1,244 (4.4%) |
| 5 to 9 Years | 1,714 (5.4%) | 2,000 (7.1%) |
| 10 to 14 Years | 2,824 (9.0%) | 2,516 (8.9%) |
| 15 to 19 Years | 2,589 (8.2%) | 1,656 (5.8%) |
| 20 to 24 Years | 2,016 (6.4%) | 1,297 (4.6%) |
| 25 to 29 Years | 1,852 (5.9%) | 1,205 (4.3%) |
| 30 to 34 Years | 1,751 (5.6%) | 1,381 (4.9%) |
| 35 to 39 Years | 1,873 (6.0%) | 1,991 (7.0%) |
| 40 to 44 Years | 2,940 (9.3%) | 2,630 (9.3%) |
| 45 to 49 Years | 2,670 (8.5%) | 2,499 (8.8%) |
| 50 to 54 Years | 2,533 (8.1%) | 2,345 (8.3%) |
| 55 to 59 Years | 1,792 (5.7%) | 1,673 (5.9%) |
| 60 to 64 Years | 1,796 (5.7%) | 1,400 (4.9%) |
| 65 to 69 Years | 1,117 (3.5%) | 1,017 (3.6%) |
| 70 to 74 Years | 824 (2.6%) | 1,079 (3.8%) |
| 75 to 79 Years | 645 (2.1%) | 970 (3.4%) |
| 80 to 84 Years | 400 (1.3%) | 589 (2.1%) |
| 85 Years and over | 619 (2.0%) | 840 (3.0%) |
| Total | 31,431 (100.0%) | 28,332 (100.0%) |
Families and Households in Cupertino
Median Family Size in Cupertino
The median family size in Cupertino is 3.25 persons per family, with married-couple families (14,057 | 88.1%) accounting for the largest median family size of 3.31 persons per family. On the other hand, single male/father families (614 | 3.8%) represent the smallest median family size with 2.72 persons per family.
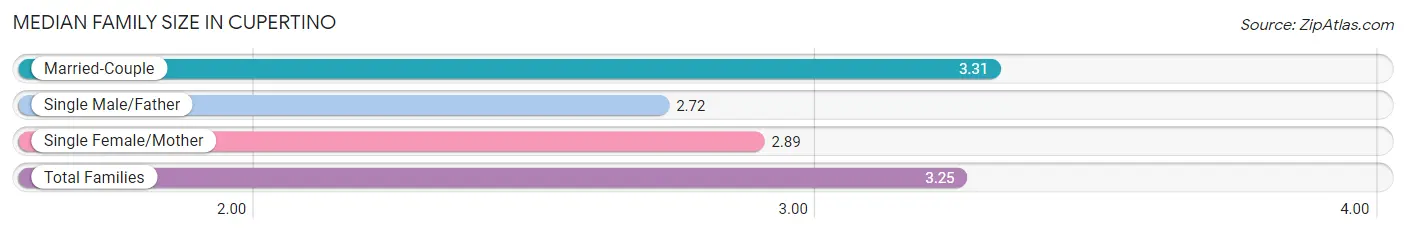
| Family Type | # Families | Family Size |
| Married-Couple | 14,057 (88.1%) | 3.31 |
| Single Male/Father | 614 (3.8%) | 2.72 |
| Single Female/Mother | 1,278 (8.0%) | 2.89 |
| Total Families | 15,949 (100.0%) | 3.25 |
Median Household Size in Cupertino
The median household size in Cupertino is 2.86 persons per household, with married-couple households (14,057 | 67.8%) accounting for the largest median household size of 3.33 persons per household. non-family households (4,795 | 23.1%) represent the smallest median household size with 1.41 persons per household.
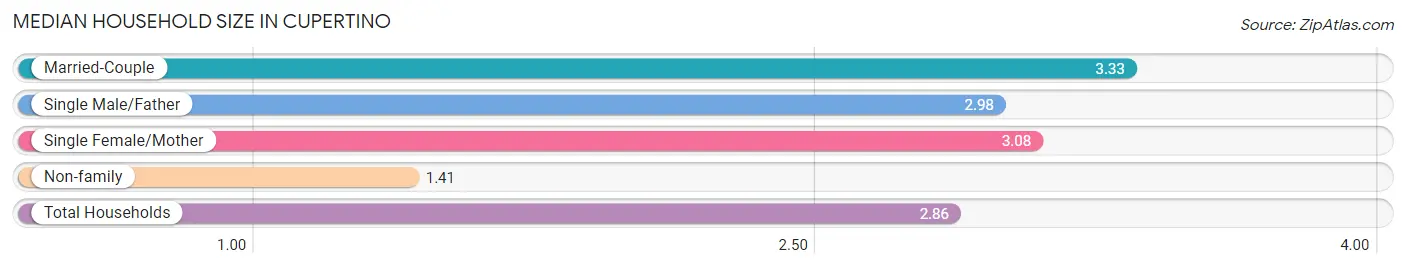
| Household Type | # Households | Household Size |
| Married-Couple | 14,057 (67.8%) | 3.33 |
| Single Male/Father | 614 (3.0%) | 2.98 |
| Single Female/Mother | 1,278 (6.2%) | 3.08 |
| Non-family | 4,795 (23.1%) | 1.41 |
| Total Households | 20,744 (100.0%) | 2.86 |
Household Size by Marriage Status in Cupertino
Out of a total of 20,744 households in Cupertino, 15,949 (76.9%) are family households, while 4,795 (23.1%) are nonfamily households. The most numerous type of family households are 4-person households, comprising 4,881, and the most common type of nonfamily households are 1-person households, comprising 3,806.
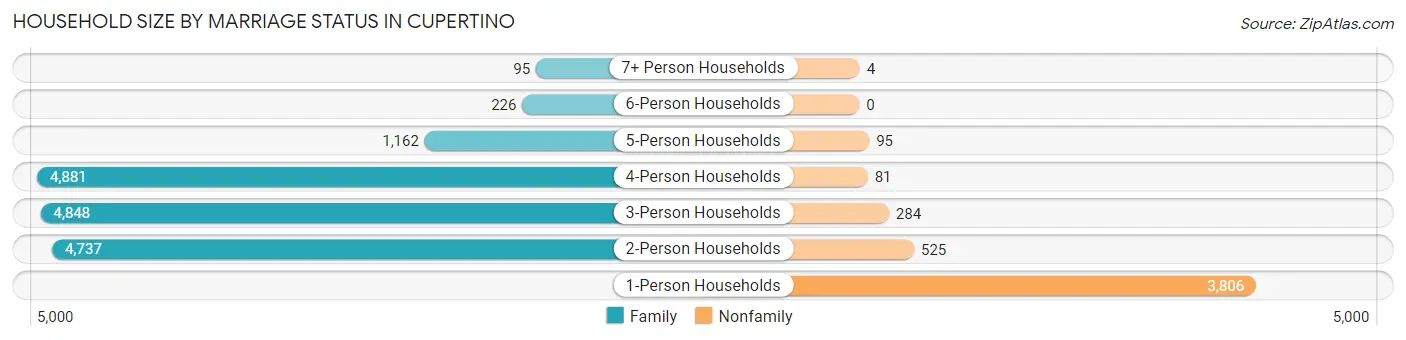
| Household Size | Family Households | Nonfamily Households |
| 1-Person Households | - | 3,806 (18.3%) |
| 2-Person Households | 4,737 (22.8%) | 525 (2.5%) |
| 3-Person Households | 4,848 (23.4%) | 284 (1.4%) |
| 4-Person Households | 4,881 (23.5%) | 81 (0.4%) |
| 5-Person Households | 1,162 (5.6%) | 95 (0.5%) |
| 6-Person Households | 226 (1.1%) | 0 (0.0%) |
| 7+ Person Households | 95 (0.5%) | 4 (0.0%) |
| Total | 15,949 (76.9%) | 4,795 (23.1%) |
Female Fertility in Cupertino
Fertility by Age in Cupertino
Average fertility rate in Cupertino is 31.0 births per 1,000 women. Women in the age bracket of 20 to 34 years have the highest fertility rate with 42.0 births per 1,000 women. Women in the age bracket of 35 to 50 years acount for 59.4% of all women with births.
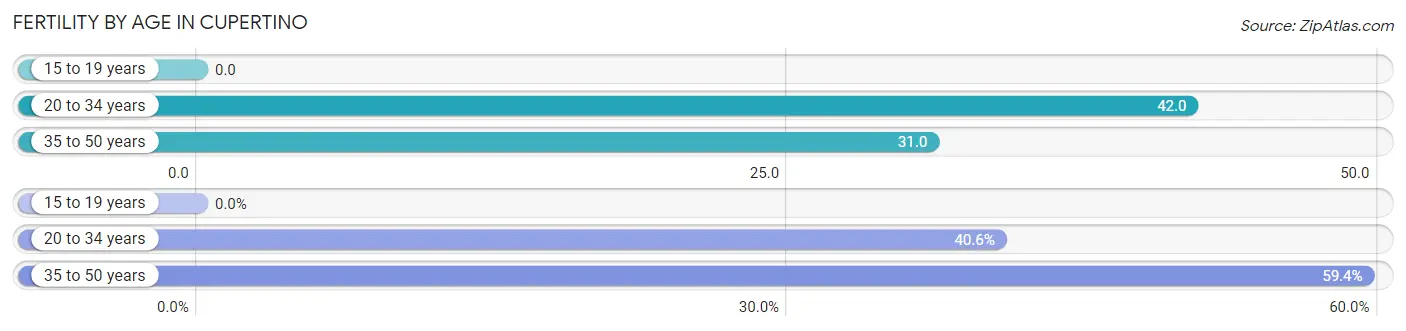
| Age Bracket | Women with Births | Births / 1,000 Women |
| 15 to 19 years | 0 (0.0%) | 0.0 |
| 20 to 34 years | 165 (40.6%) | 42.0 |
| 35 to 50 years | 241 (59.4%) | 31.0 |
| Total | 406 (100.0%) | 31.0 |
Fertility by Age by Marriage Status in Cupertino
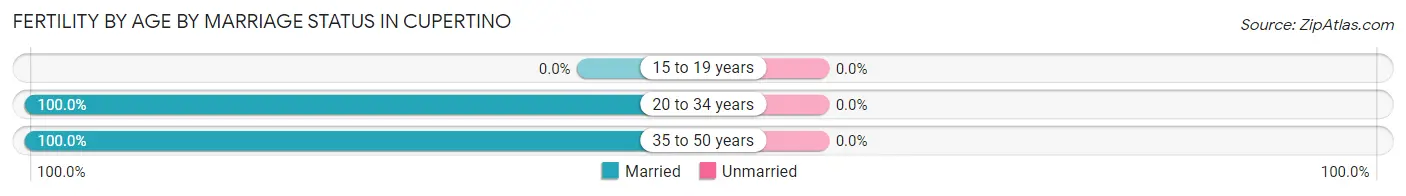
| Age Bracket | Married | Unmarried |
| 15 to 19 years | 0 (0.0%) | 0 (0.0%) |
| 20 to 34 years | 165 (100.0%) | 0 (0.0%) |
| 35 to 50 years | 241 (100.0%) | 0 (0.0%) |
| Total | 406 (100.0%) | 0 (0.0%) |
Fertility by Education in Cupertino
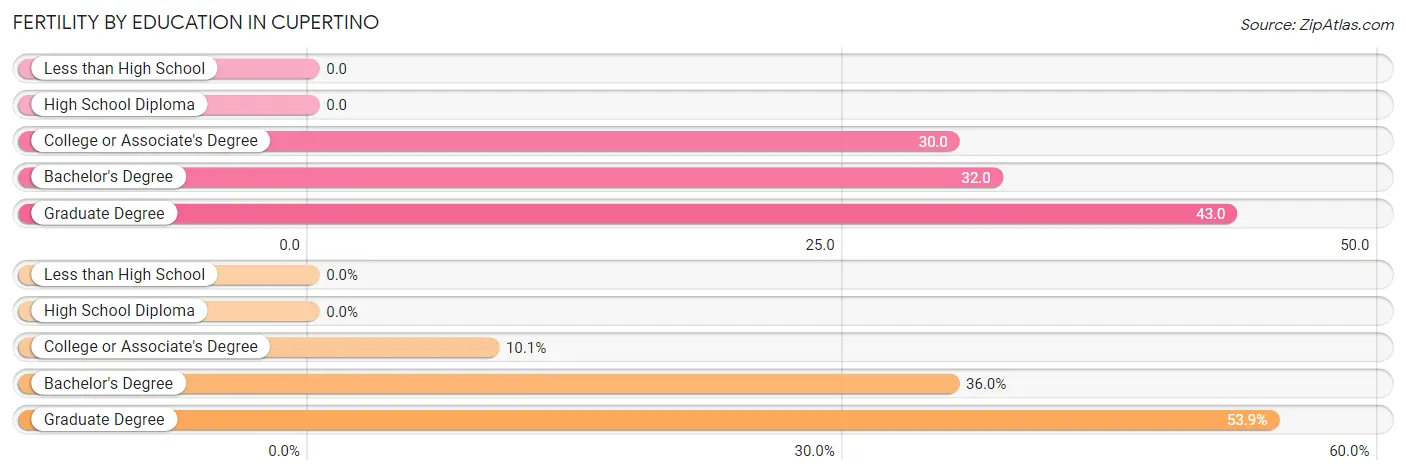
| Educational Attainment | Women with Births | Births / 1,000 Women |
| Less than High School | 0 (0.0%) | 0.0 |
| High School Diploma | 0 (0.0%) | 0.0 |
| College or Associate's Degree | 41 (10.1%) | 30.0 |
| Bachelor's Degree | 146 (36.0%) | 32.0 |
| Graduate Degree | 219 (53.9%) | 43.0 |
| Total | 406 (100.0%) | 31.0 |
Fertility by Education by Marriage Status in Cupertino
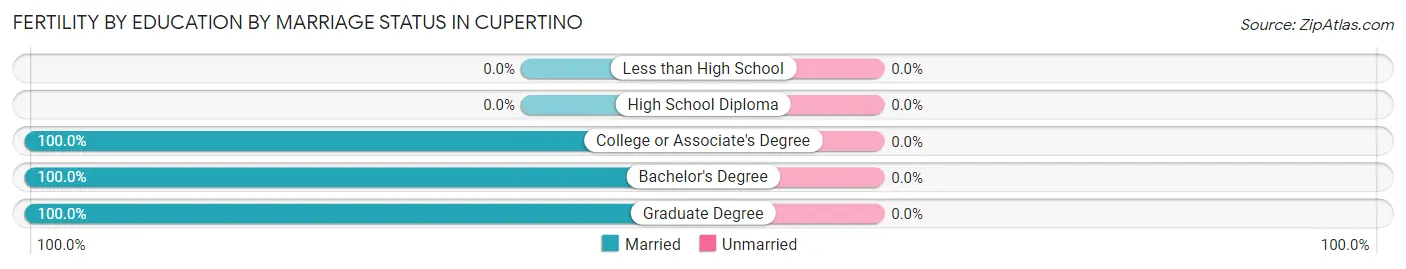
| Educational Attainment | Married | Unmarried |
| Less than High School | 0 (0.0%) | 0 (0.0%) |
| High School Diploma | 0 (0.0%) | 0 (0.0%) |
| College or Associate's Degree | 41 (100.0%) | 0 (0.0%) |
| Bachelor's Degree | 146 (100.0%) | 0 (0.0%) |
| Graduate Degree | 219 (100.0%) | 0 (0.0%) |
| Total | 406 (100.0%) | 0 (0.0%) |
Employment Characteristics in Cupertino
Employment by Class of Employer in Cupertino
Among the 27,767 employed individuals in Cupertino, private company employees (22,663 | 81.6%), not-for-profit organizations (1,572 | 5.7%), and local government employees (1,094 | 3.9%) make up the most common classes of employment.
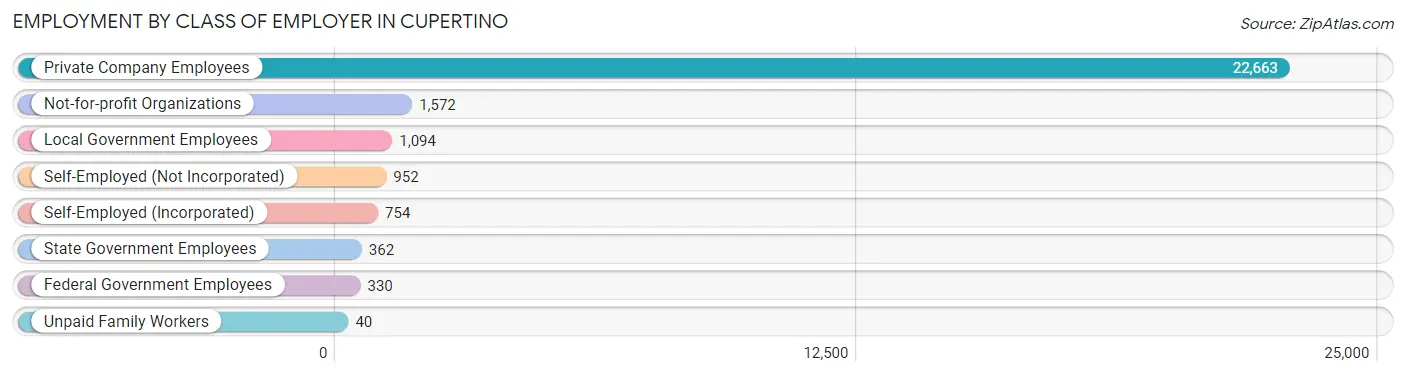
| Employer Class | # Employees | % Employees |
| Private Company Employees | 22,663 | 81.6% |
| Self-Employed (Incorporated) | 754 | 2.7% |
| Self-Employed (Not Incorporated) | 952 | 3.4% |
| Not-for-profit Organizations | 1,572 | 5.7% |
| Local Government Employees | 1,094 | 3.9% |
| State Government Employees | 362 | 1.3% |
| Federal Government Employees | 330 | 1.2% |
| Unpaid Family Workers | 40 | 0.1% |
| Total | 27,767 | 100.0% |
Employment Status by Age in Cupertino
According to the labor force statistics for Cupertino, out of the total population over 16 years of age (47,192), 61.5% or 29,023 individuals are in the labor force, with 3.0% or 871 of them unemployed. The age group with the highest labor force participation rate is 30 to 34 years, with 85.1% or 2,665 individuals in the labor force. Within the labor force, the 16 to 19 years age range has the highest percentage of unemployed individuals, with 12.6% or 72 of them being unemployed.
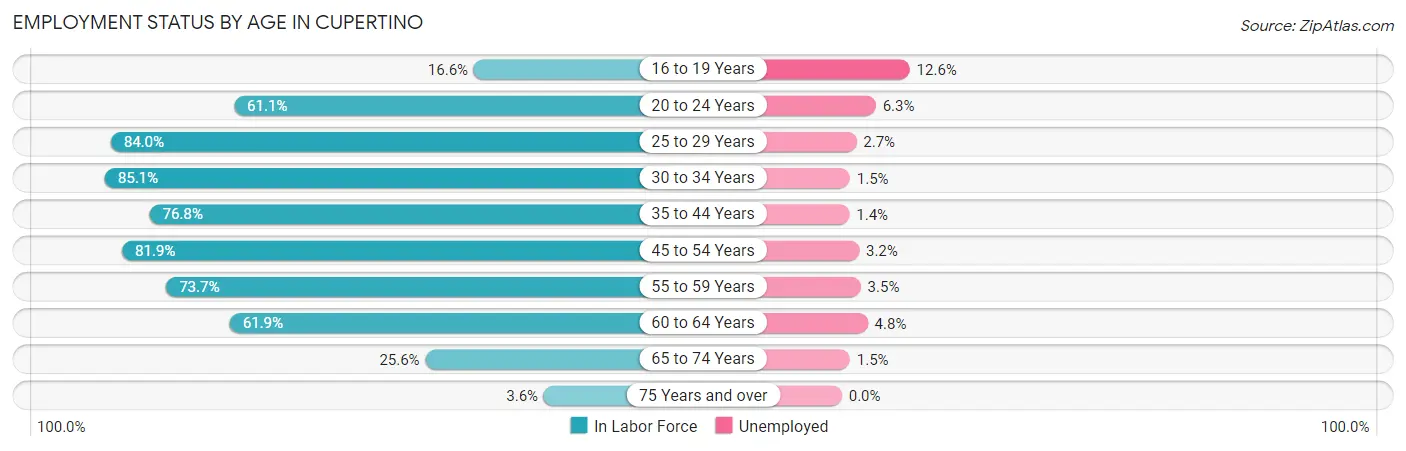
| Age Bracket | In Labor Force | Unemployed |
| 16 to 19 Years | 572 (16.6%) | 72 (12.6%) |
| 20 to 24 Years | 2,024 (61.1%) | 128 (6.3%) |
| 25 to 29 Years | 2,568 (84.0%) | 69 (2.7%) |
| 30 to 34 Years | 2,665 (85.1%) | 40 (1.5%) |
| 35 to 44 Years | 7,245 (76.8%) | 101 (1.4%) |
| 45 to 54 Years | 8,228 (81.9%) | 263 (3.2%) |
| 55 to 59 Years | 2,554 (73.7%) | 89 (3.5%) |
| 60 to 64 Years | 1,978 (61.9%) | 95 (4.8%) |
| 65 to 74 Years | 1,033 (25.6%) | 15 (1.5%) |
| 75 Years and over | 146 (3.6%) | 0 (0.0%) |
| Total | 29,023 (61.5%) | 871 (3.0%) |
Employment Status by Educational Attainment in Cupertino
According to labor force statistics for Cupertino, 78.1% of individuals (25,251) out of the total population between 25 and 64 years of age (32,331) are in the labor force, with 2.6% or 657 of them being unemployed. The group with the highest labor force participation rate are those with the educational attainment of bachelor's degree or higher, with 80.5% or 22,458 individuals in the labor force. Within the labor force, individuals with less than high school education have the highest percentage of unemployment, with 9.0% or 24 of them being unemployed.
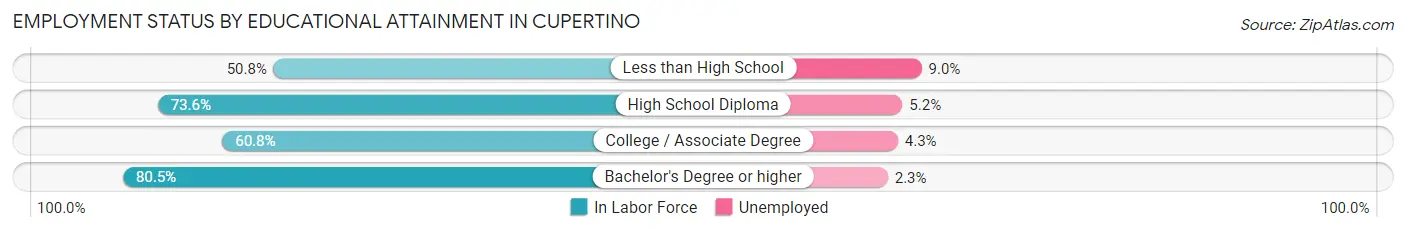
| Educational Attainment | In Labor Force | Unemployed |
| Less than High School | 267 (50.8%) | 47 (9.0%) |
| High School Diploma | 752 (73.6%) | 53 (5.2%) |
| College / Associate Degree | 1,754 (60.8%) | 124 (4.3%) |
| Bachelor's Degree or higher | 22,458 (80.5%) | 642 (2.3%) |
| Total | 25,251 (78.1%) | 841 (2.6%) |
Employment Occupations by Sex in Cupertino
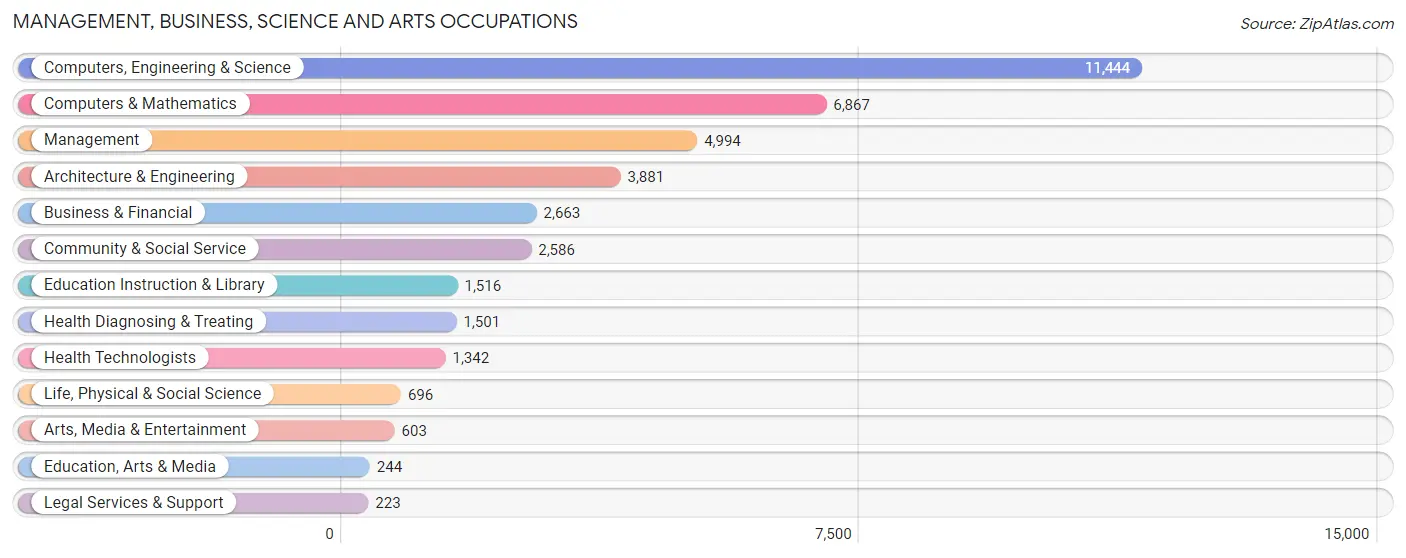
Management, Business, Science and Arts Occupations
The most common Management, Business, Science and Arts occupations in Cupertino are Computers, Engineering & Science (11,444 | 40.7%), Computers & Mathematics (6,867 | 24.4%), Management (4,994 | 17.7%), Architecture & Engineering (3,881 | 13.8%), and Business & Financial (2,663 | 9.5%).
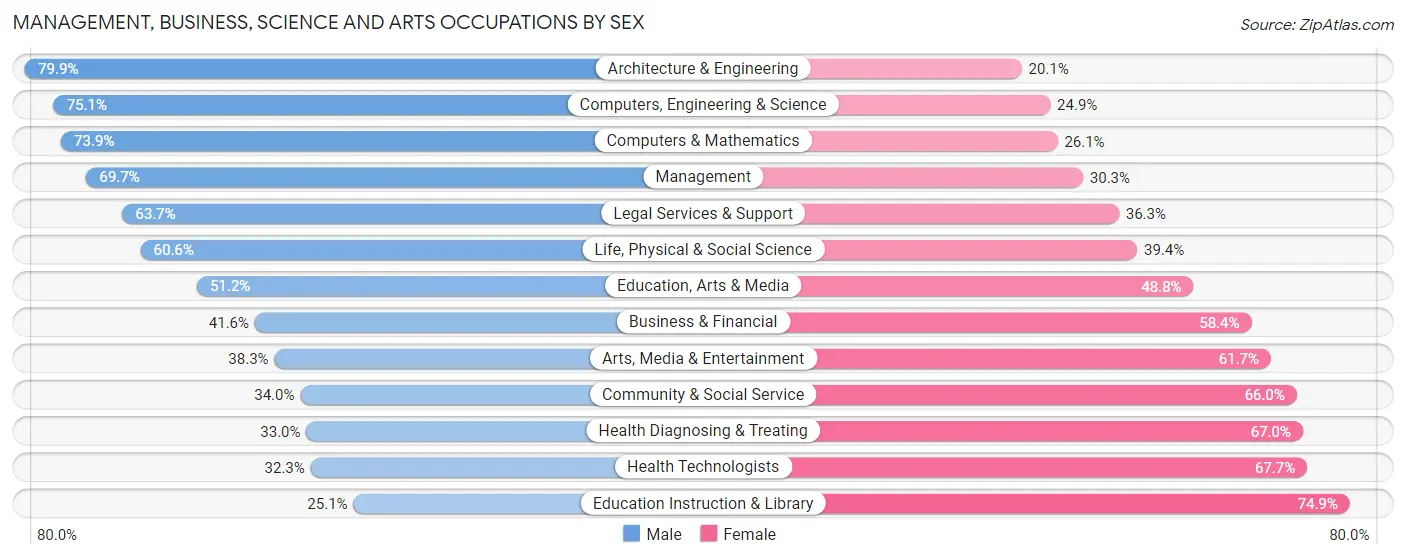
Management, Business, Science and Arts Occupations by Sex
Within the Management, Business, Science and Arts occupations in Cupertino, the most male-oriented occupations are Architecture & Engineering (79.9%), Computers, Engineering & Science (75.1%), and Computers & Mathematics (73.9%), while the most female-oriented occupations are Education Instruction & Library (74.9%), Health Technologists (67.7%), and Health Diagnosing & Treating (67.0%).
| Occupation | Male | Female |
| Management | 3,480 (69.7%) | 1,514 (30.3%) |
| Business & Financial | 1,107 (41.6%) | 1,556 (58.4%) |
| Computers, Engineering & Science | 8,599 (75.1%) | 2,845 (24.9%) |
| Computers & Mathematics | 5,076 (73.9%) | 1,791 (26.1%) |
| Architecture & Engineering | 3,101 (79.9%) | 780 (20.1%) |
| Life, Physical & Social Science | 422 (60.6%) | 274 (39.4%) |
| Community & Social Service | 879 (34.0%) | 1,707 (66.0%) |
| Education, Arts & Media | 125 (51.2%) | 119 (48.8%) |
| Legal Services & Support | 142 (63.7%) | 81 (36.3%) |
| Education Instruction & Library | 381 (25.1%) | 1,135 (74.9%) |
| Arts, Media & Entertainment | 231 (38.3%) | 372 (61.7%) |
| Health Diagnosing & Treating | 495 (33.0%) | 1,006 (67.0%) |
| Health Technologists | 433 (32.3%) | 909 (67.7%) |
| Total (Category) | 14,560 (62.8%) | 8,628 (37.2%) |
| Total (Overall) | 17,136 (60.9%) | 11,004 (39.1%) |
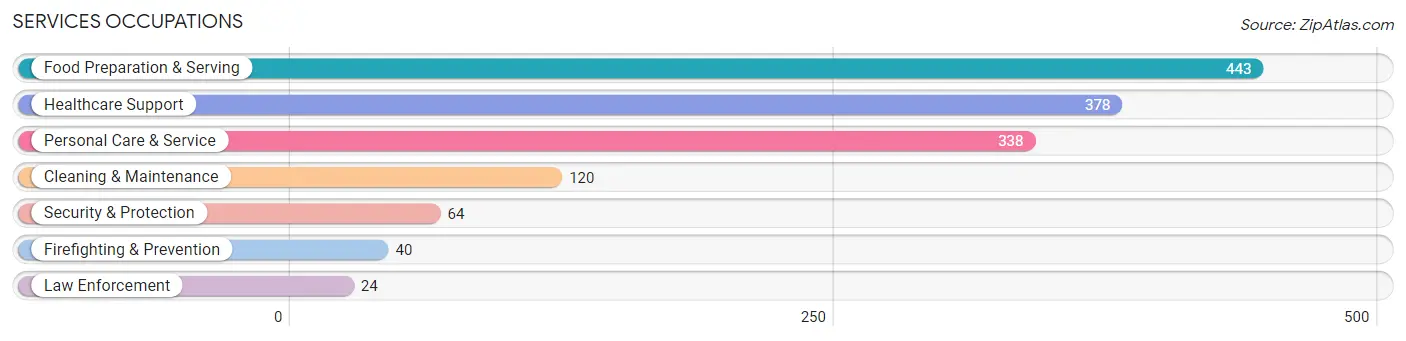
Services Occupations
The most common Services occupations in Cupertino are Food Preparation & Serving (443 | 1.6%), Healthcare Support (378 | 1.3%), Personal Care & Service (338 | 1.2%), Cleaning & Maintenance (120 | 0.4%), and Security & Protection (64 | 0.2%).
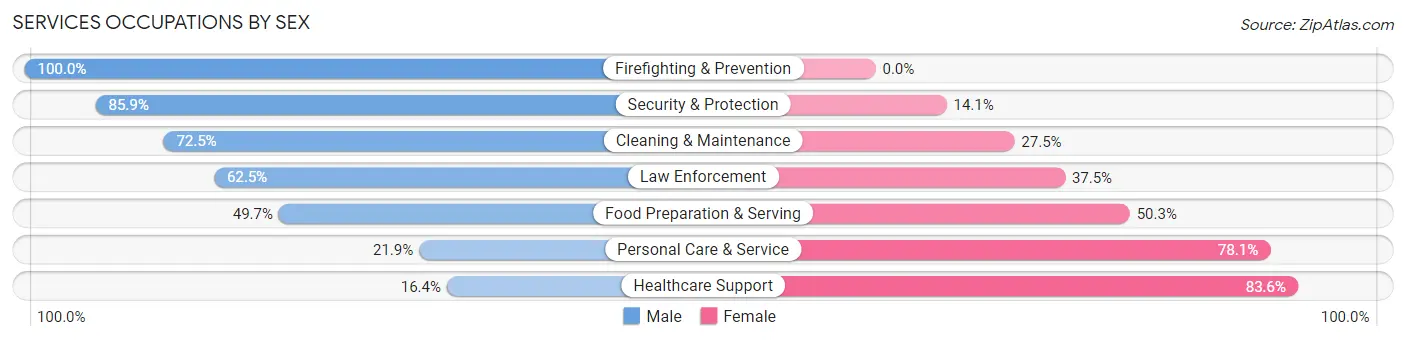
Services Occupations by Sex
Within the Services occupations in Cupertino, the most male-oriented occupations are Firefighting & Prevention (100.0%), Security & Protection (85.9%), and Cleaning & Maintenance (72.5%), while the most female-oriented occupations are Healthcare Support (83.6%), Personal Care & Service (78.1%), and Food Preparation & Serving (50.3%).
| Occupation | Male | Female |
| Healthcare Support | 62 (16.4%) | 316 (83.6%) |
| Security & Protection | 55 (85.9%) | 9 (14.1%) |
| Firefighting & Prevention | 40 (100.0%) | 0 (0.0%) |
| Law Enforcement | 15 (62.5%) | 9 (37.5%) |
| Food Preparation & Serving | 220 (49.7%) | 223 (50.3%) |
| Cleaning & Maintenance | 87 (72.5%) | 33 (27.5%) |
| Personal Care & Service | 74 (21.9%) | 264 (78.1%) |
| Total (Category) | 498 (37.1%) | 845 (62.9%) |
| Total (Overall) | 17,136 (60.9%) | 11,004 (39.1%) |
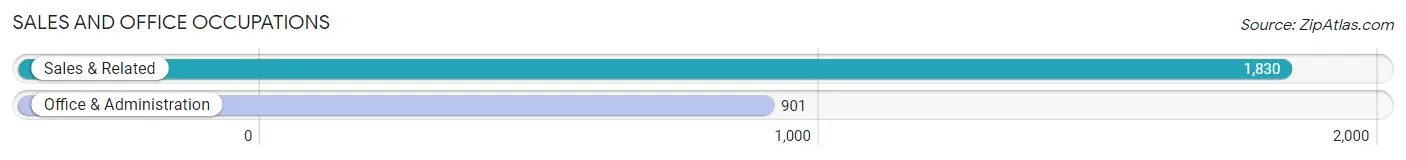
Sales and Office Occupations
The most common Sales and Office occupations in Cupertino are Sales & Related (1,830 | 6.5%), and Office & Administration (901 | 3.2%).
Sales and Office Occupations by Sex
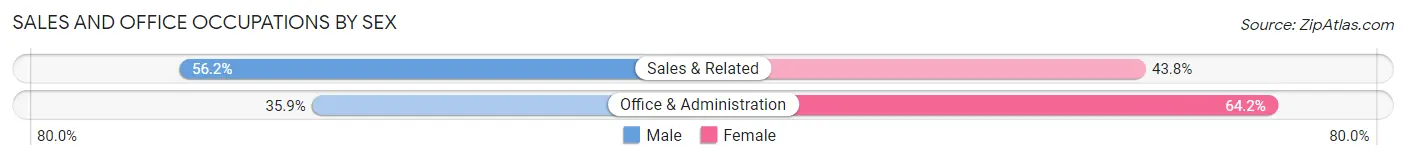
| Occupation | Male | Female |
| Sales & Related | 1,029 (56.2%) | 801 (43.8%) |
| Office & Administration | 323 (35.8%) | 578 (64.1%) |
| Total (Category) | 1,352 (49.5%) | 1,379 (50.5%) |
| Total (Overall) | 17,136 (60.9%) | 11,004 (39.1%) |
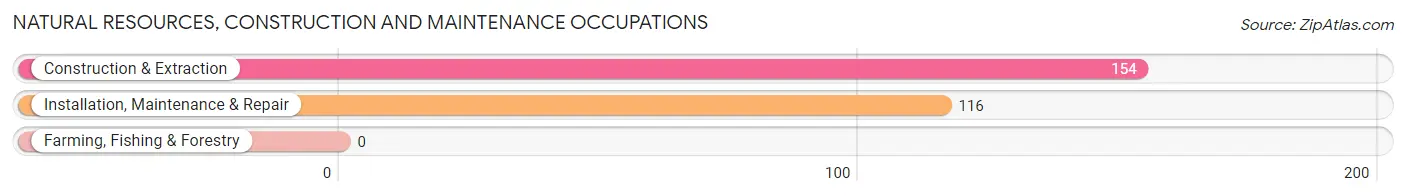
Natural Resources, Construction and Maintenance Occupations
The most common Natural Resources, Construction and Maintenance occupations in Cupertino are Construction & Extraction (154 | 0.5%), and Installation, Maintenance & Repair (116 | 0.4%).
Natural Resources, Construction and Maintenance Occupations by Sex
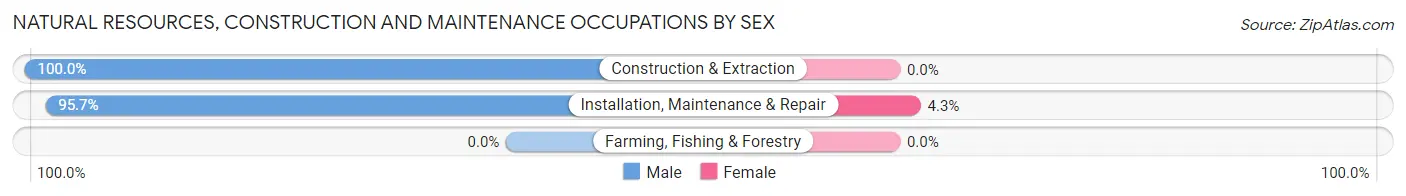
| Occupation | Male | Female |
| Farming, Fishing & Forestry | 0 (0.0%) | 0 (0.0%) |
| Construction & Extraction | 154 (100.0%) | 0 (0.0%) |
| Installation, Maintenance & Repair | 111 (95.7%) | 5 (4.3%) |
| Total (Category) | 265 (98.2%) | 5 (1.8%) |
| Total (Overall) | 17,136 (60.9%) | 11,004 (39.1%) |
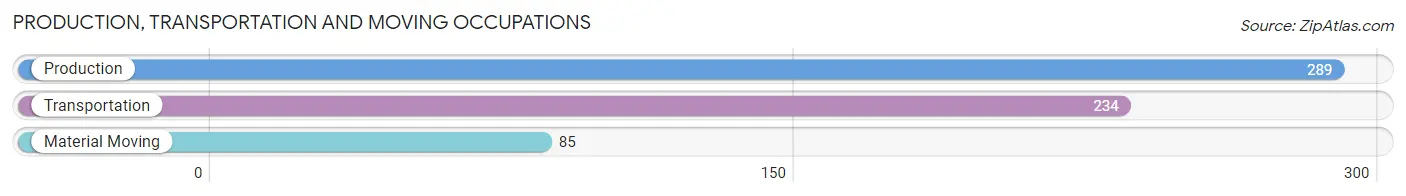
Production, Transportation and Moving Occupations
The most common Production, Transportation and Moving occupations in Cupertino are Production (289 | 1.0%), Transportation (234 | 0.8%), and Material Moving (85 | 0.3%).
Production, Transportation and Moving Occupations by Sex
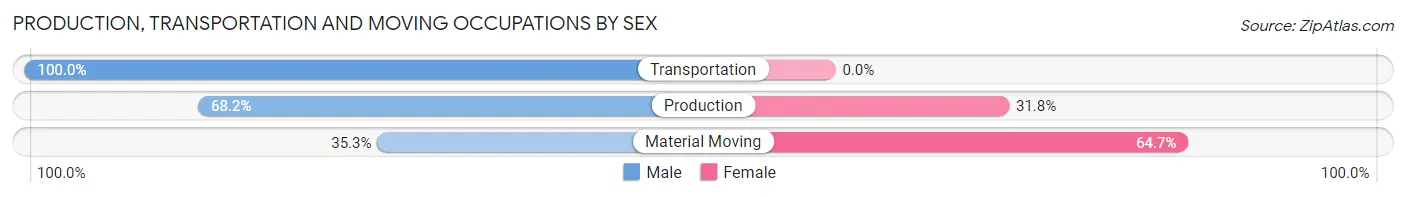
| Occupation | Male | Female |
| Production | 197 (68.2%) | 92 (31.8%) |
| Transportation | 234 (100.0%) | 0 (0.0%) |
| Material Moving | 30 (35.3%) | 55 (64.7%) |
| Total (Category) | 461 (75.8%) | 147 (24.2%) |
| Total (Overall) | 17,136 (60.9%) | 11,004 (39.1%) |
Employment Industries by Sex in Cupertino
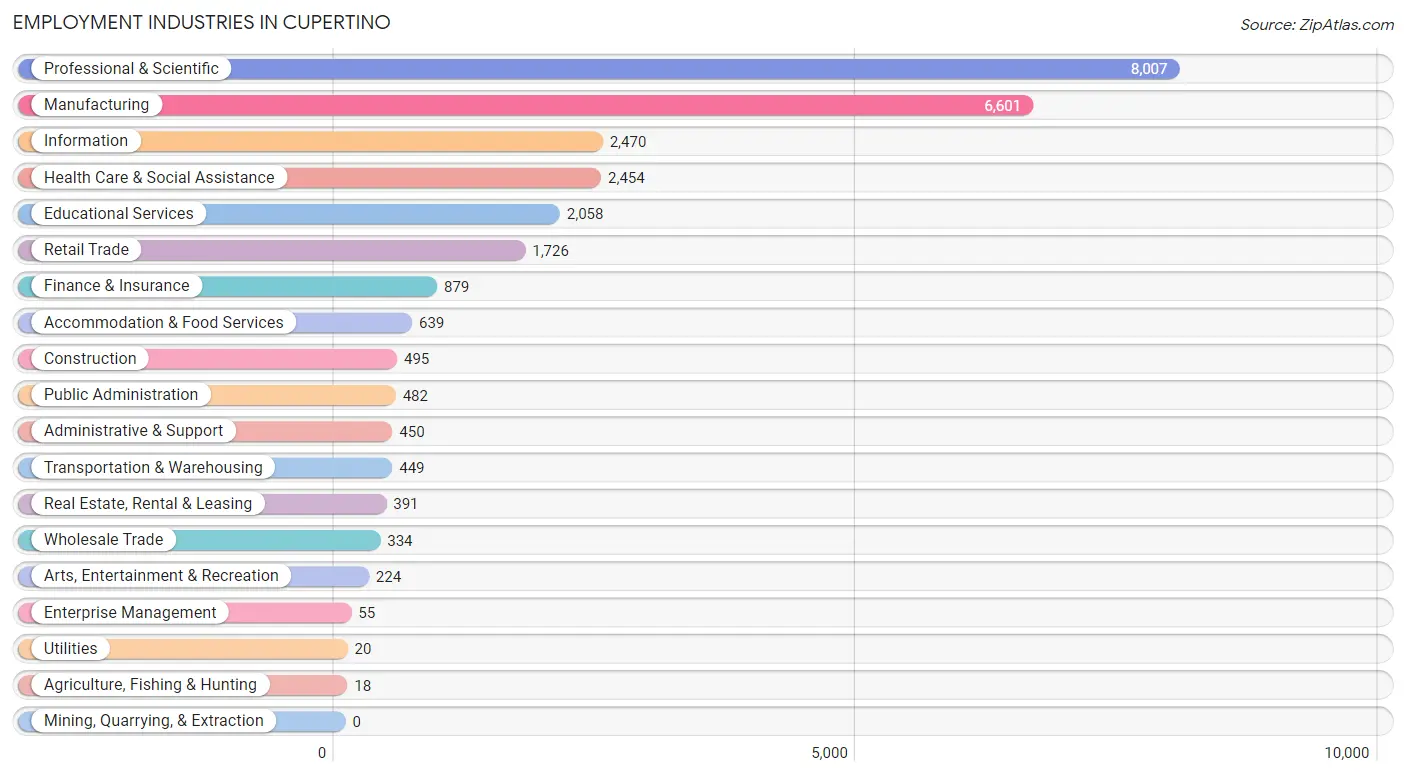
Employment Industries in Cupertino
The major employment industries in Cupertino include Professional & Scientific (8,007 | 28.4%), Manufacturing (6,601 | 23.5%), Information (2,470 | 8.8%), Health Care & Social Assistance (2,454 | 8.7%), and Educational Services (2,058 | 7.3%).
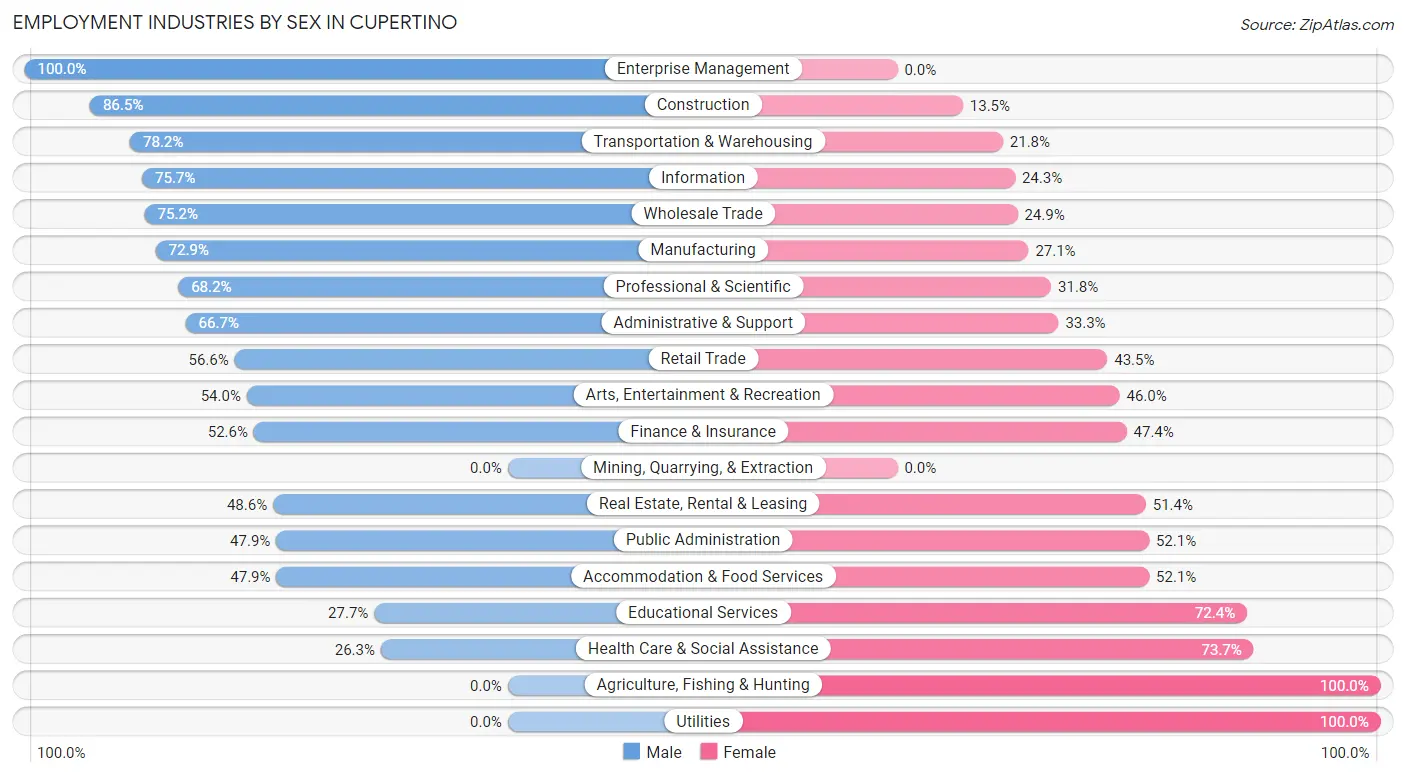
Employment Industries by Sex in Cupertino
The Cupertino industries that see more men than women are Enterprise Management (100.0%), Construction (86.5%), and Transportation & Warehousing (78.2%), whereas the industries that tend to have a higher number of women are Agriculture, Fishing & Hunting (100.0%), Utilities (100.0%), and Health Care & Social Assistance (73.7%).
| Industry | Male | Female |
| Agriculture, Fishing & Hunting | 0 (0.0%) | 18 (100.0%) |
| Mining, Quarrying, & Extraction | 0 (0.0%) | 0 (0.0%) |
| Construction | 428 (86.5%) | 67 (13.5%) |
| Manufacturing | 4,811 (72.9%) | 1,790 (27.1%) |
| Wholesale Trade | 251 (75.1%) | 83 (24.8%) |
| Retail Trade | 976 (56.6%) | 750 (43.4%) |
| Transportation & Warehousing | 351 (78.2%) | 98 (21.8%) |
| Utilities | 0 (0.0%) | 20 (100.0%) |
| Information | 1,869 (75.7%) | 601 (24.3%) |
| Finance & Insurance | 462 (52.6%) | 417 (47.4%) |
| Real Estate, Rental & Leasing | 190 (48.6%) | 201 (51.4%) |
| Professional & Scientific | 5,460 (68.2%) | 2,547 (31.8%) |
| Enterprise Management | 55 (100.0%) | 0 (0.0%) |
| Administrative & Support | 300 (66.7%) | 150 (33.3%) |
| Educational Services | 569 (27.7%) | 1,489 (72.4%) |
| Health Care & Social Assistance | 645 (26.3%) | 1,809 (73.7%) |
| Arts, Entertainment & Recreation | 121 (54.0%) | 103 (46.0%) |
| Accommodation & Food Services | 306 (47.9%) | 333 (52.1%) |
| Public Administration | 231 (47.9%) | 251 (52.1%) |
| Total | 17,136 (60.9%) | 11,004 (39.1%) |
Education in Cupertino
School Enrollment in Cupertino
The most common levels of schooling among the 17,305 students in Cupertino are middle school (4,127 | 23.8%), high school (3,995 | 23.1%), and college / undergraduate (3,290 | 19.0%).
| School Level | # Students | % Students |
| Nursery / Preschool | 943 | 5.4% |
| Kindergarten | 789 | 4.6% |
| Elementary School | 3,163 | 18.3% |
| Middle School | 4,127 | 23.8% |
| High School | 3,995 | 23.1% |
| College / Undergraduate | 3,290 | 19.0% |
| Graduate / Professional | 998 | 5.8% |
| Total | 17,305 | 100.0% |
School Enrollment by Age by Funding Source in Cupertino
Out of a total of 17,305 students who are enrolled in schools in Cupertino, 3,271 (18.9%) attend a private institution, while the remaining 14,034 (81.1%) are enrolled in public schools. The age group of 3 to 4 year olds has the highest likelihood of being enrolled in private schools, with 636 (81.3% in the age bracket) enrolled. Conversely, the age group of 18 to 19 year olds has the lowest likelihood of being enrolled in a private school, with 1,358 (90.6% in the age bracket) attending a public institution.
| Age Bracket | Public School | Private School |
| 3 to 4 Year Olds | 146 (18.7%) | 636 (81.3%) |
| 5 to 9 Year Old | 3,053 (84.1%) | 578 (15.9%) |
| 10 to 14 Year Olds | 4,659 (88.0%) | 638 (12.0%) |
| 15 to 17 Year Olds | 2,170 (81.6%) | 489 (18.4%) |
| 18 to 19 Year Olds | 1,358 (90.6%) | 141 (9.4%) |
| 20 to 24 Year Olds | 1,574 (87.3%) | 229 (12.7%) |
| 25 to 34 Year Olds | 562 (59.5%) | 382 (40.5%) |
| 35 Years and over | 517 (74.9%) | 173 (25.1%) |
| Total | 14,034 (81.1%) | 3,271 (18.9%) |
Educational Attainment by Field of Study in Cupertino
Engineering (11,314 | 31.8%), computers & mathematics (5,868 | 16.5%), business (3,910 | 11.0%), physical & health sciences (2,346 | 6.6%), and social sciences (2,307 | 6.5%) are the most common fields of study among 35,551 individuals in Cupertino who have obtained a bachelor's degree or higher.
| Field of Study | # Graduates | % Graduates |
| Computers & Mathematics | 5,868 | 16.5% |
| Bio, Nature & Agricultural | 1,766 | 5.0% |
| Physical & Health Sciences | 2,346 | 6.6% |
| Psychology | 815 | 2.3% |
| Social Sciences | 2,307 | 6.5% |
| Engineering | 11,314 | 31.8% |
| Multidisciplinary Studies | 333 | 0.9% |
| Science & Technology | 2,251 | 6.3% |
| Business | 3,910 | 11.0% |
| Education | 1,007 | 2.8% |
| Literature & Languages | 1,089 | 3.1% |
| Liberal Arts & History | 580 | 1.6% |
| Visual & Performing Arts | 819 | 2.3% |
| Communications | 675 | 1.9% |
| Arts & Humanities | 471 | 1.3% |
| Total | 35,551 | 100.0% |
Transportation & Commute in Cupertino
Vehicle Availability by Sex in Cupertino
The most prevalent vehicle ownership categories in Cupertino are males with 2 vehicles (7,734, accounting for 45.4%) and females with 2 vehicles (4,985, making up 72.3%).
| Vehicles Available | Male | Female |
| No Vehicle | 494 (2.9%) | 96 (0.9%) |
| 1 Vehicle | 2,932 (17.2%) | 1,585 (14.8%) |
| 2 Vehicles | 7,734 (45.4%) | 4,985 (46.6%) |
| 3 Vehicles | 3,931 (23.1%) | 3,078 (28.8%) |
| 4 Vehicles | 1,505 (8.8%) | 825 (7.7%) |
| 5 or more Vehicles | 458 (2.7%) | 130 (1.2%) |
| Total | 17,054 (100.0%) | 10,699 (100.0%) |
Commute Time in Cupertino
The most frequently occuring commute durations in Cupertino are 30 to 34 minutes (4,878 commuters, 23.3%), 20 to 24 minutes (3,871 commuters, 18.5%), and 15 to 19 minutes (2,579 commuters, 12.3%).
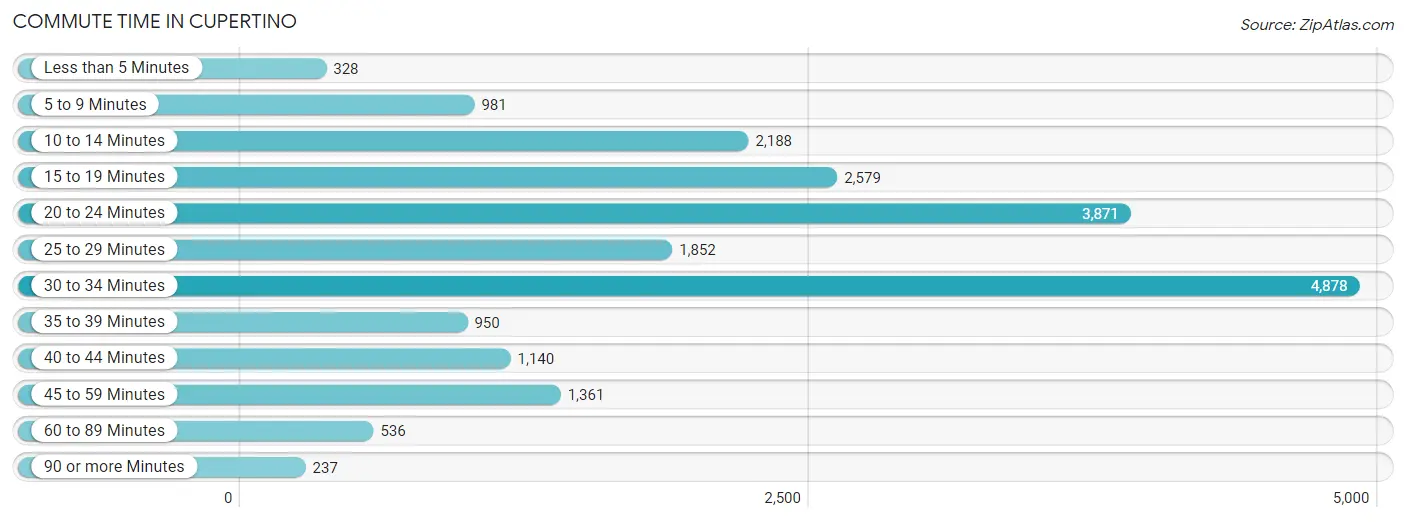
| Commute Time | # Commuters | % Commuters |
| Less than 5 Minutes | 328 | 1.6% |
| 5 to 9 Minutes | 981 | 4.7% |
| 10 to 14 Minutes | 2,188 | 10.5% |
| 15 to 19 Minutes | 2,579 | 12.3% |
| 20 to 24 Minutes | 3,871 | 18.5% |
| 25 to 29 Minutes | 1,852 | 8.9% |
| 30 to 34 Minutes | 4,878 | 23.3% |
| 35 to 39 Minutes | 950 | 4.5% |
| 40 to 44 Minutes | 1,140 | 5.4% |
| 45 to 59 Minutes | 1,361 | 6.5% |
| 60 to 89 Minutes | 536 | 2.6% |
| 90 or more Minutes | 237 | 1.1% |
Commute Time by Sex in Cupertino
The most common commute times in Cupertino are 30 to 34 minutes (3,328 commuters, 26.1%) for males and 20 to 24 minutes (1,570 commuters, 19.3%) for females.
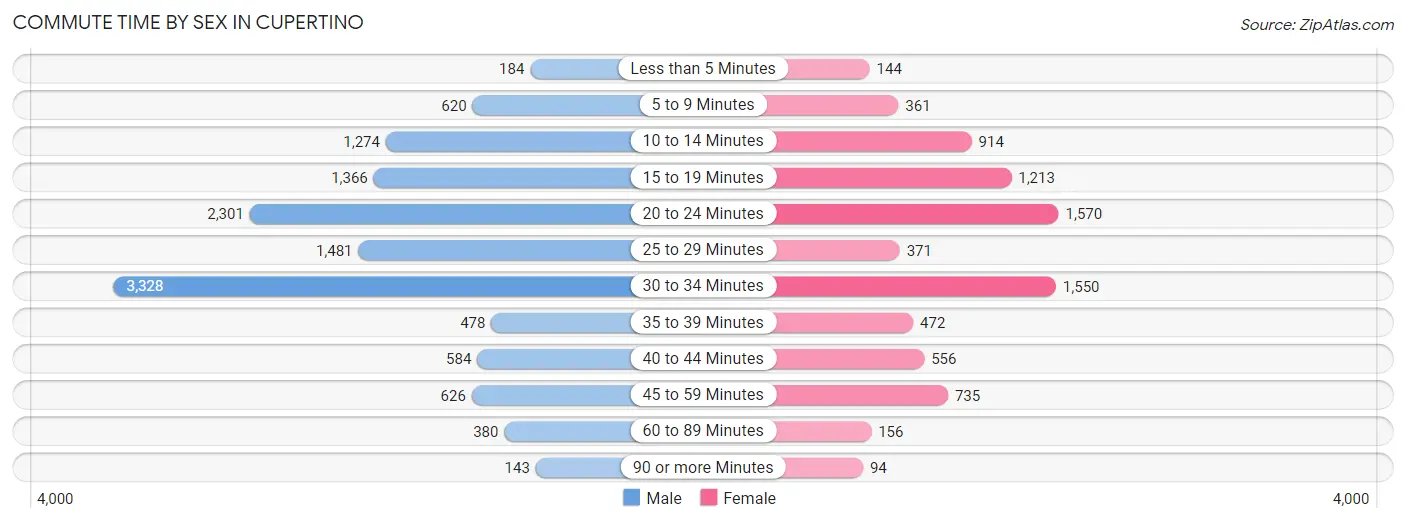
| Commute Time | Male | Female |
| Less than 5 Minutes | 184 (1.4%) | 144 (1.8%) |
| 5 to 9 Minutes | 620 (4.9%) | 361 (4.4%) |
| 10 to 14 Minutes | 1,274 (10.0%) | 914 (11.2%) |
| 15 to 19 Minutes | 1,366 (10.7%) | 1,213 (14.9%) |
| 20 to 24 Minutes | 2,301 (18.0%) | 1,570 (19.3%) |
| 25 to 29 Minutes | 1,481 (11.6%) | 371 (4.6%) |
| 30 to 34 Minutes | 3,328 (26.1%) | 1,550 (19.1%) |
| 35 to 39 Minutes | 478 (3.7%) | 472 (5.8%) |
| 40 to 44 Minutes | 584 (4.6%) | 556 (6.8%) |
| 45 to 59 Minutes | 626 (4.9%) | 735 (9.0%) |
| 60 to 89 Minutes | 380 (3.0%) | 156 (1.9%) |
| 90 or more Minutes | 143 (1.1%) | 94 (1.2%) |
Time of Departure to Work by Sex in Cupertino
The most frequent times of departure to work in Cupertino are 9:00 AM to 9:59 AM (3,546, 27.8%) for males and 9:00 AM to 9:59 AM (1,777, 21.8%) for females.
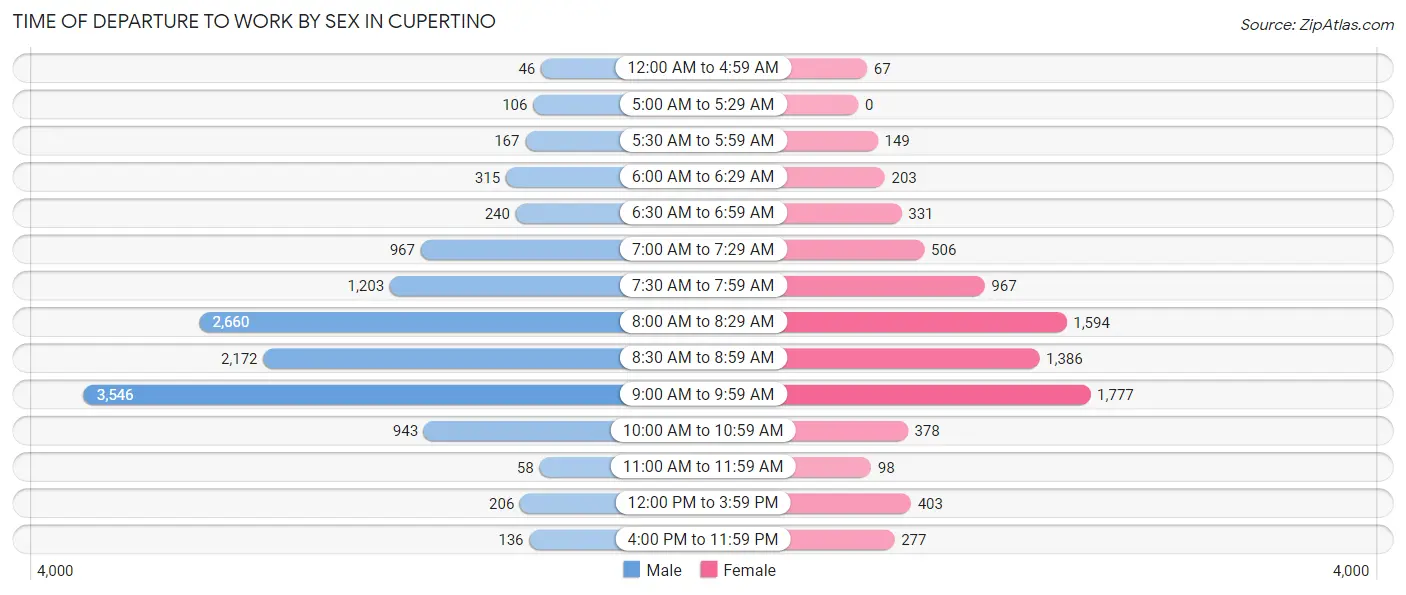
| Time of Departure | Male | Female |
| 12:00 AM to 4:59 AM | 46 (0.4%) | 67 (0.8%) |
| 5:00 AM to 5:29 AM | 106 (0.8%) | 0 (0.0%) |
| 5:30 AM to 5:59 AM | 167 (1.3%) | 149 (1.8%) |
| 6:00 AM to 6:29 AM | 315 (2.5%) | 203 (2.5%) |
| 6:30 AM to 6:59 AM | 240 (1.9%) | 331 (4.1%) |
| 7:00 AM to 7:29 AM | 967 (7.6%) | 506 (6.2%) |
| 7:30 AM to 7:59 AM | 1,203 (9.4%) | 967 (11.9%) |
| 8:00 AM to 8:29 AM | 2,660 (20.8%) | 1,594 (19.6%) |
| 8:30 AM to 8:59 AM | 2,172 (17.0%) | 1,386 (17.0%) |
| 9:00 AM to 9:59 AM | 3,546 (27.8%) | 1,777 (21.8%) |
| 10:00 AM to 10:59 AM | 943 (7.4%) | 378 (4.6%) |
| 11:00 AM to 11:59 AM | 58 (0.4%) | 98 (1.2%) |
| 12:00 PM to 3:59 PM | 206 (1.6%) | 403 (5.0%) |
| 4:00 PM to 11:59 PM | 136 (1.1%) | 277 (3.4%) |
| Total | 12,765 (100.0%) | 8,136 (100.0%) |
Housing Occupancy in Cupertino
Occupancy by Ownership in Cupertino
Of the total 20,744 dwellings in Cupertino, owner-occupied units account for 12,570 (60.6%), while renter-occupied units make up 8,174 (39.4%).
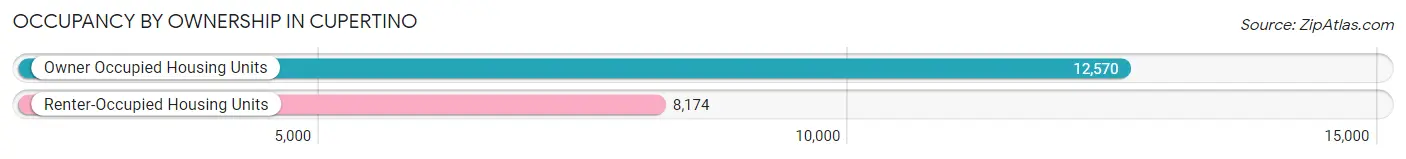
| Occupancy | # Housing Units | % Housing Units |
| Owner Occupied Housing Units | 12,570 | 60.6% |
| Renter-Occupied Housing Units | 8,174 | 39.4% |
| Total Occupied Housing Units | 20,744 | 100.0% |
Occupancy by Household Size in Cupertino
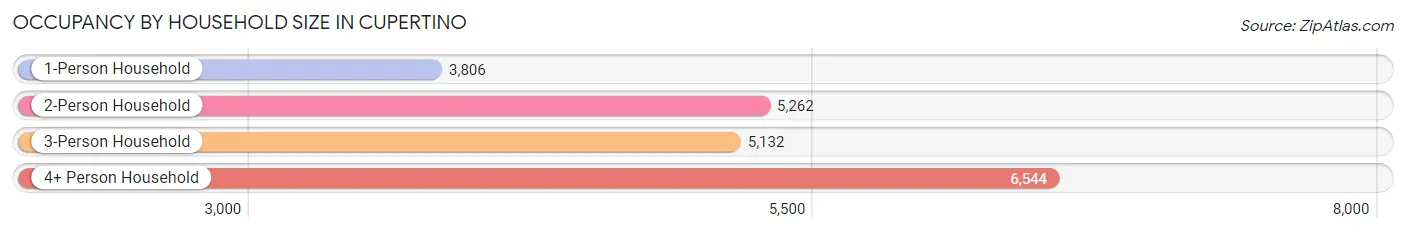
| Household Size | # Housing Units | % Housing Units |
| 1-Person Household | 3,806 | 18.3% |
| 2-Person Household | 5,262 | 25.4% |
| 3-Person Household | 5,132 | 24.7% |
| 4+ Person Household | 6,544 | 31.6% |
| Total Housing Units | 20,744 | 100.0% |
Occupancy by Ownership by Household Size in Cupertino
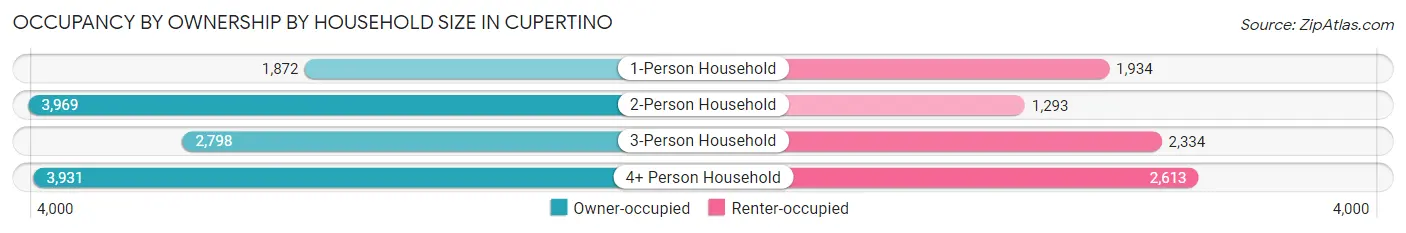
| Household Size | Owner-occupied | Renter-occupied |
| 1-Person Household | 1,872 (49.2%) | 1,934 (50.8%) |
| 2-Person Household | 3,969 (75.4%) | 1,293 (24.6%) |
| 3-Person Household | 2,798 (54.5%) | 2,334 (45.5%) |
| 4+ Person Household | 3,931 (60.1%) | 2,613 (39.9%) |
| Total Housing Units | 12,570 (60.6%) | 8,174 (39.4%) |
Occupancy by Educational Attainment in Cupertino
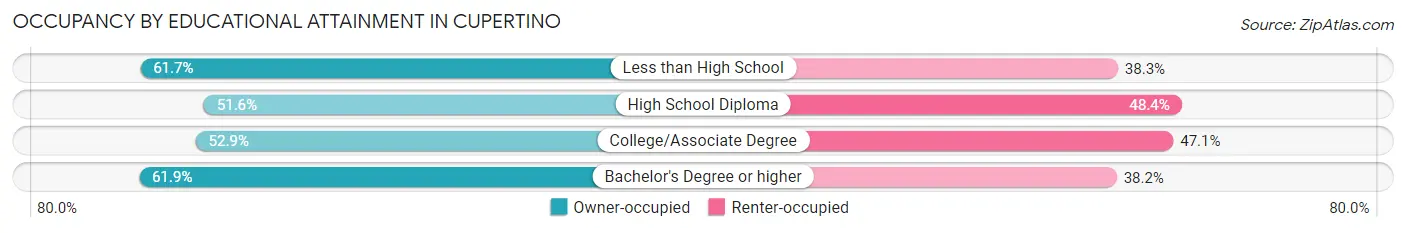
| Household Size | Owner-occupied | Renter-occupied |
| Less than High School | 119 (61.7%) | 74 (38.3%) |
| High School Diploma | 363 (51.6%) | 341 (48.4%) |
| College/Associate Degree | 1,104 (52.9%) | 984 (47.1%) |
| Bachelor's Degree or higher | 10,984 (61.9%) | 6,775 (38.2%) |
Occupancy by Age of Householder in Cupertino
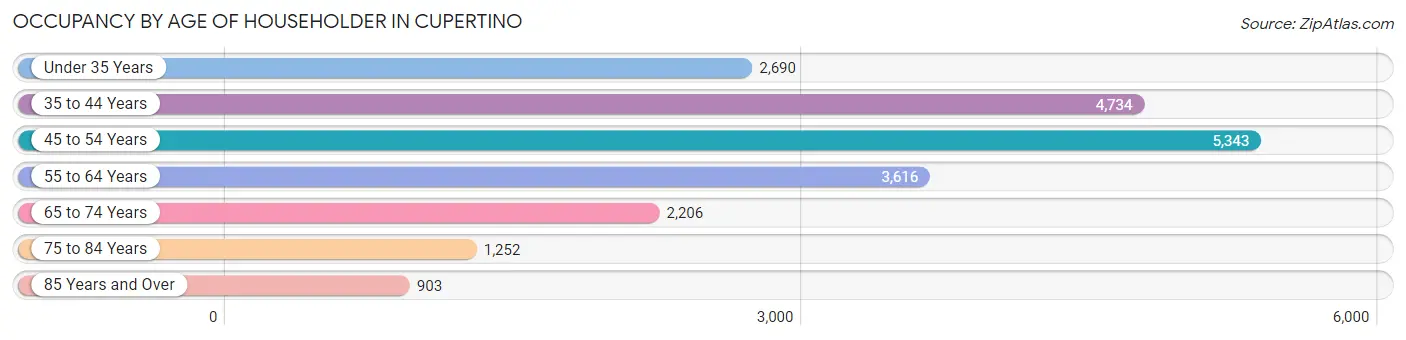
| Age Bracket | # Households | % Households |
| Under 35 Years | 2,690 | 13.0% |
| 35 to 44 Years | 4,734 | 22.8% |
| 45 to 54 Years | 5,343 | 25.8% |
| 55 to 64 Years | 3,616 | 17.4% |
| 65 to 74 Years | 2,206 | 10.6% |
| 75 to 84 Years | 1,252 | 6.0% |
| 85 Years and Over | 903 | 4.3% |
| Total | 20,744 | 100.0% |
Housing Finances in Cupertino
Median Income by Occupancy in Cupertino
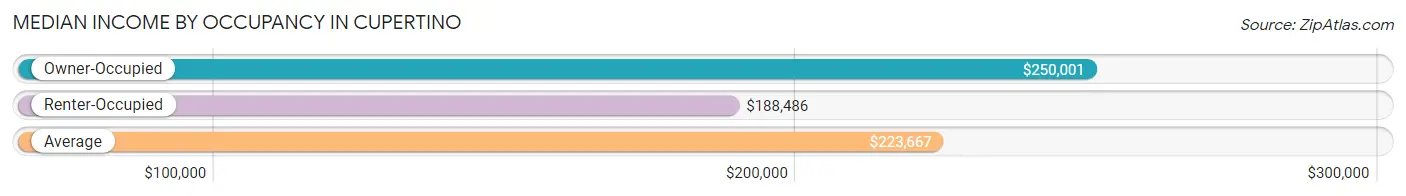
| Occupancy Type | # Households | Median Income |
| Owner-Occupied | 12,570 (60.6%) | $250,001 |
| Renter-Occupied | 8,174 (39.4%) | $188,486 |
| Average | 20,744 (100.0%) | $223,667 |
Occupancy by Householder Income Bracket in Cupertino
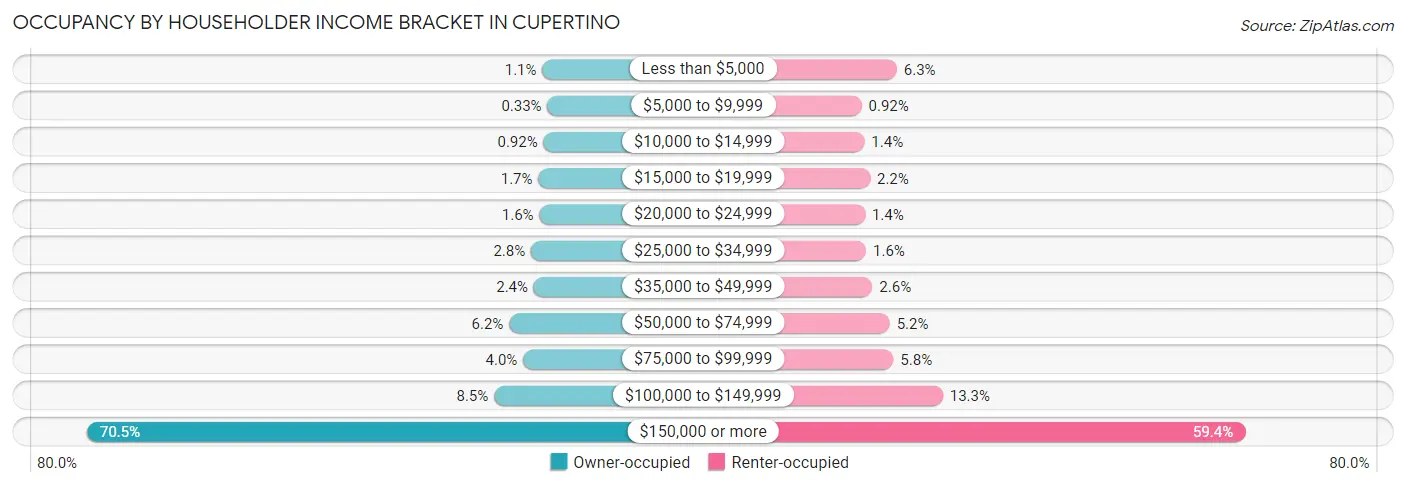
| Income Bracket | Owner-occupied | Renter-occupied |
| Less than $5,000 | 138 (1.1%) | 514 (6.3%) |
| $5,000 to $9,999 | 42 (0.3%) | 75 (0.9%) |
| $10,000 to $14,999 | 116 (0.9%) | 110 (1.3%) |
| $15,000 to $19,999 | 215 (1.7%) | 181 (2.2%) |
| $20,000 to $24,999 | 195 (1.5%) | 117 (1.4%) |
| $25,000 to $34,999 | 356 (2.8%) | 132 (1.6%) |
| $35,000 to $49,999 | 302 (2.4%) | 210 (2.6%) |
| $50,000 to $74,999 | 774 (6.2%) | 426 (5.2%) |
| $75,000 to $99,999 | 506 (4.0%) | 472 (5.8%) |
| $100,000 to $149,999 | 1,062 (8.5%) | 1,086 (13.3%) |
| $150,000 or more | 8,864 (70.5%) | 4,851 (59.4%) |
| Total | 12,570 (100.0%) | 8,174 (100.0%) |
Monthly Housing Cost Tiers in Cupertino
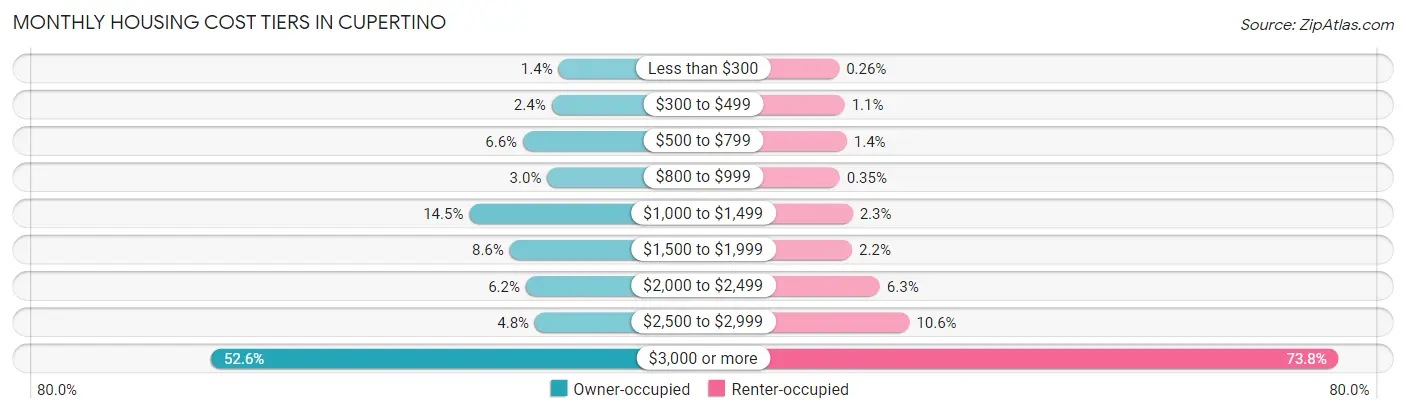
| Monthly Cost | Owner-occupied | Renter-occupied |
| Less than $300 | 171 (1.4%) | 21 (0.3%) |
| $300 to $499 | 301 (2.4%) | 88 (1.1%) |
| $500 to $799 | 829 (6.6%) | 114 (1.4%) |
| $800 to $999 | 380 (3.0%) | 29 (0.4%) |
| $1,000 to $1,499 | 1,824 (14.5%) | 184 (2.2%) |
| $1,500 to $1,999 | 1,076 (8.6%) | 177 (2.2%) |
| $2,000 to $2,499 | 777 (6.2%) | 512 (6.3%) |
| $2,500 to $2,999 | 607 (4.8%) | 867 (10.6%) |
| $3,000 or more | 6,605 (52.5%) | 6,033 (73.8%) |
| Total | 12,570 (100.0%) | 8,174 (100.0%) |
Physical Housing Characteristics in Cupertino
Housing Structures in Cupertino
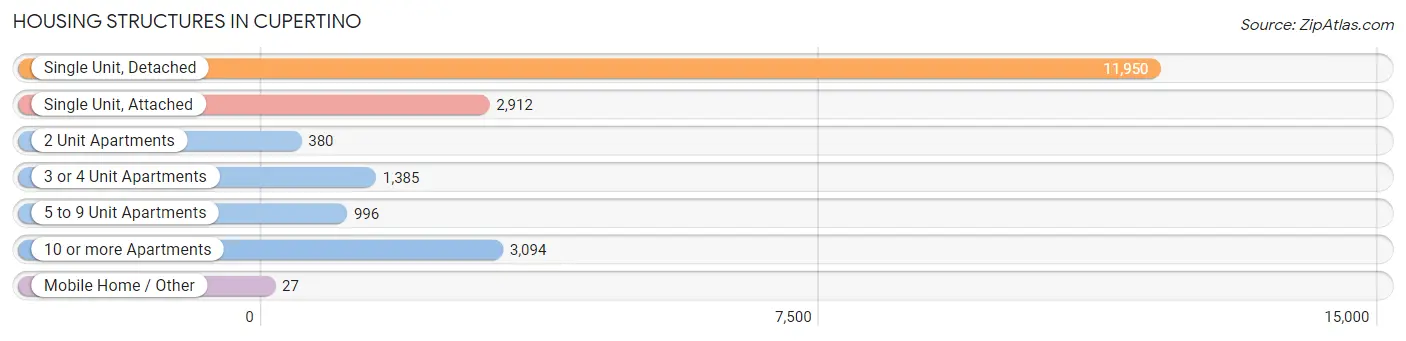
| Structure Type | # Housing Units | % Housing Units |
| Single Unit, Detached | 11,950 | 57.6% |
| Single Unit, Attached | 2,912 | 14.0% |
| 2 Unit Apartments | 380 | 1.8% |
| 3 or 4 Unit Apartments | 1,385 | 6.7% |
| 5 to 9 Unit Apartments | 996 | 4.8% |
| 10 or more Apartments | 3,094 | 14.9% |
| Mobile Home / Other | 27 | 0.1% |
| Total | 20,744 | 100.0% |
Housing Structures by Occupancy in Cupertino
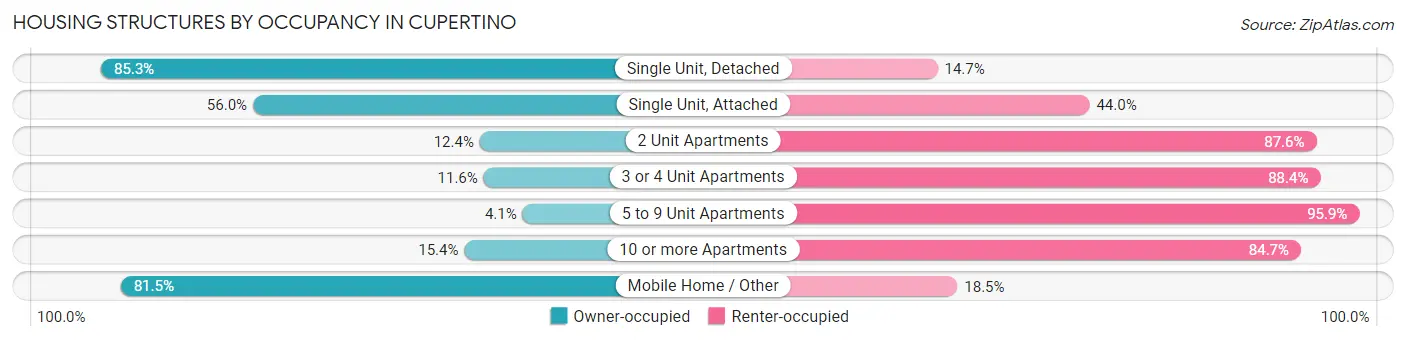
| Structure Type | Owner-occupied | Renter-occupied |
| Single Unit, Detached | 10,192 (85.3%) | 1,758 (14.7%) |
| Single Unit, Attached | 1,632 (56.0%) | 1,280 (44.0%) |
| 2 Unit Apartments | 47 (12.4%) | 333 (87.6%) |
| 3 or 4 Unit Apartments | 161 (11.6%) | 1,224 (88.4%) |
| 5 to 9 Unit Apartments | 41 (4.1%) | 955 (95.9%) |
| 10 or more Apartments | 475 (15.3%) | 2,619 (84.7%) |
| Mobile Home / Other | 22 (81.5%) | 5 (18.5%) |
| Total | 12,570 (60.6%) | 8,174 (39.4%) |
Housing Structures by Number of Rooms in Cupertino
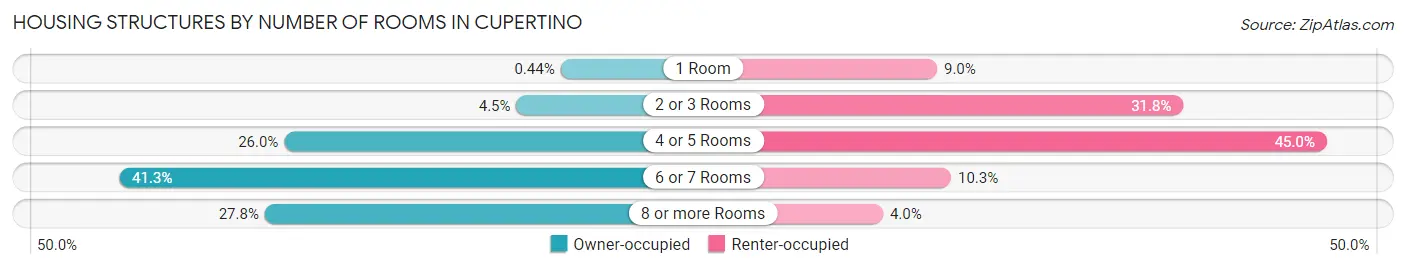
| Number of Rooms | Owner-occupied | Renter-occupied |
| 1 Room | 55 (0.4%) | 734 (9.0%) |
| 2 or 3 Rooms | 568 (4.5%) | 2,595 (31.8%) |
| 4 or 5 Rooms | 3,267 (26.0%) | 3,680 (45.0%) |
| 6 or 7 Rooms | 5,187 (41.3%) | 840 (10.3%) |
| 8 or more Rooms | 3,493 (27.8%) | 325 (4.0%) |
| Total | 12,570 (100.0%) | 8,174 (100.0%) |
Housing Structure by Heating Type in Cupertino
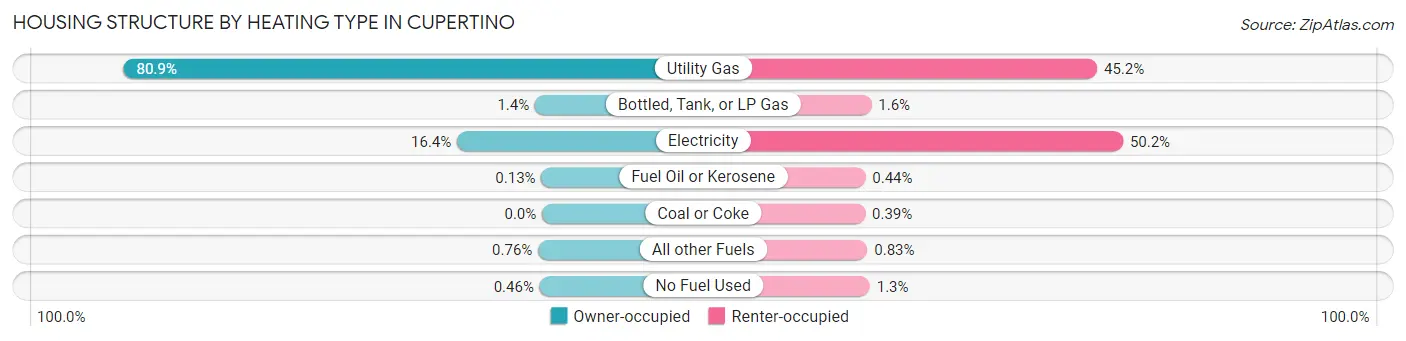
| Heating Type | Owner-occupied | Renter-occupied |
| Utility Gas | 10,166 (80.9%) | 3,696 (45.2%) |
| Bottled, Tank, or LP Gas | 171 (1.4%) | 131 (1.6%) |
| Electricity | 2,064 (16.4%) | 4,105 (50.2%) |
| Fuel Oil or Kerosene | 16 (0.1%) | 36 (0.4%) |
| Coal or Coke | 0 (0.0%) | 32 (0.4%) |
| All other Fuels | 95 (0.8%) | 68 (0.8%) |
| No Fuel Used | 58 (0.5%) | 106 (1.3%) |
| Total | 12,570 (100.0%) | 8,174 (100.0%) |
Household Vehicle Usage in Cupertino
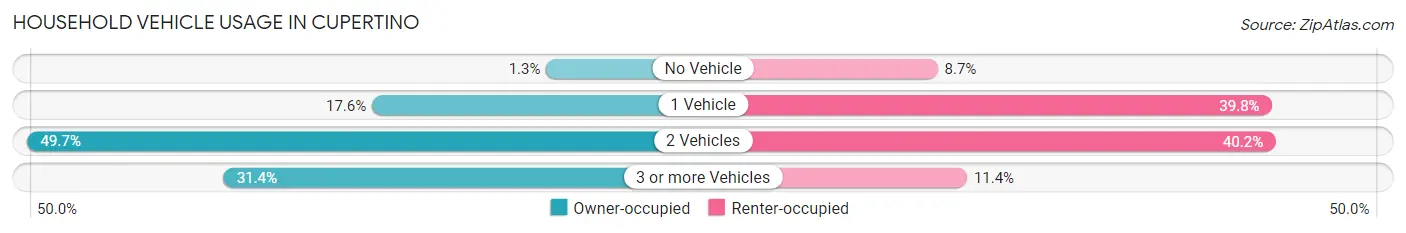
| Vehicles per Household | Owner-occupied | Renter-occupied |
| No Vehicle | 164 (1.3%) | 707 (8.6%) |
| 1 Vehicle | 2,208 (17.6%) | 3,254 (39.8%) |
| 2 Vehicles | 6,251 (49.7%) | 3,282 (40.2%) |
| 3 or more Vehicles | 3,947 (31.4%) | 931 (11.4%) |
| Total | 12,570 (100.0%) | 8,174 (100.0%) |
Real Estate & Mortgages in Cupertino
Real Estate and Mortgage Overview in Cupertino
| Characteristic | Without Mortgage | With Mortgage |
| Housing Units | 5,030 | 7,540 |
| Median Property Value | $2,000,001 | $2,000,001 |
| Median Household Income | $161,857 | $6,153 |
| Monthly Housing Costs | $1,252 | $6,372 |
| Real Estate Taxes | $9,804 | $67 |
Property Value by Mortgage Status in Cupertino
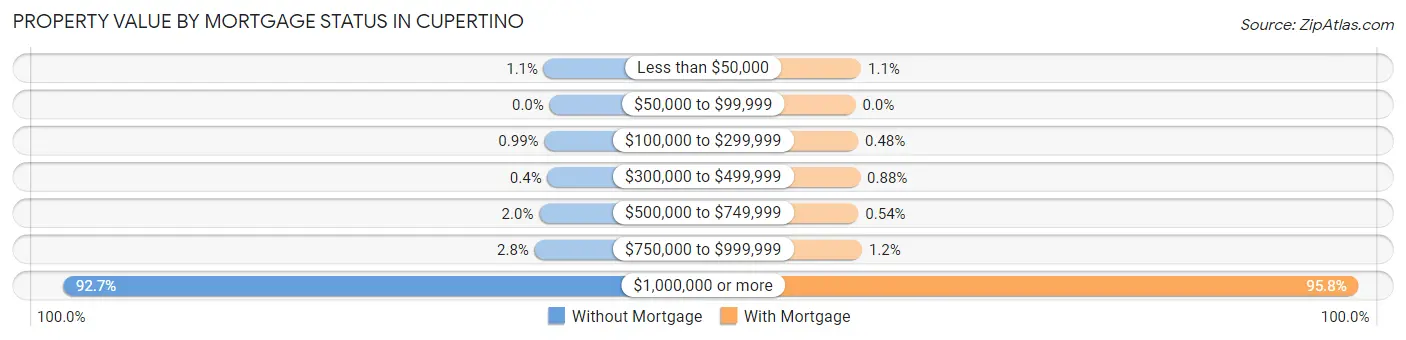
| Property Value | Without Mortgage | With Mortgage |
| Less than $50,000 | 55 (1.1%) | 80 (1.1%) |
| $50,000 to $99,999 | 0 (0.0%) | 0 (0.0%) |
| $100,000 to $299,999 | 50 (1.0%) | 36 (0.5%) |
| $300,000 to $499,999 | 20 (0.4%) | 66 (0.9%) |
| $500,000 to $749,999 | 99 (2.0%) | 41 (0.5%) |
| $750,000 to $999,999 | 143 (2.8%) | 93 (1.2%) |
| $1,000,000 or more | 4,663 (92.7%) | 7,224 (95.8%) |
| Total | 5,030 (100.0%) | 7,540 (100.0%) |
Household Income by Mortgage Status in Cupertino
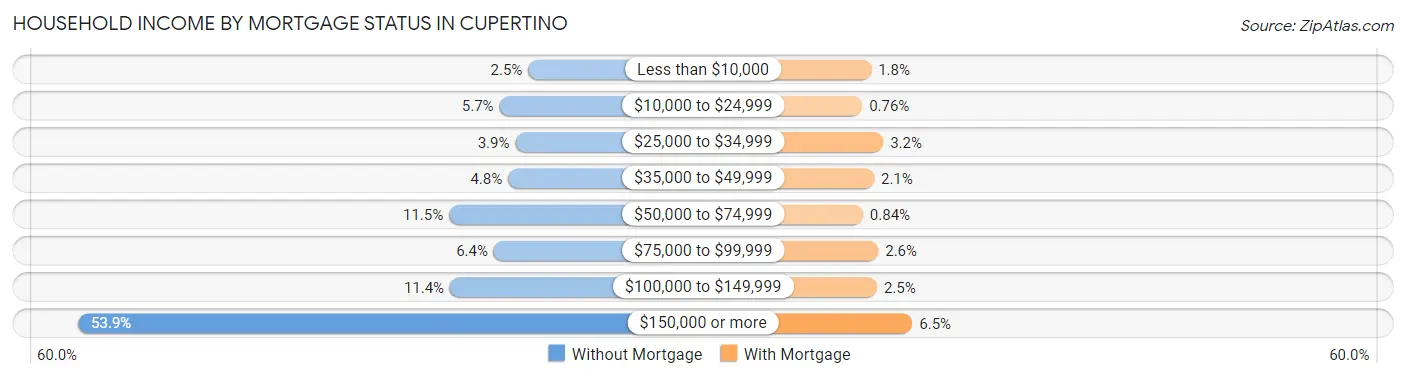
| Household Income | Without Mortgage | With Mortgage |
| Less than $10,000 | 123 (2.5%) | 135 (1.8%) |
| $10,000 to $24,999 | 288 (5.7%) | 57 (0.8%) |
| $25,000 to $34,999 | 197 (3.9%) | 238 (3.2%) |
| $35,000 to $49,999 | 239 (4.8%) | 159 (2.1%) |
| $50,000 to $74,999 | 578 (11.5%) | 63 (0.8%) |
| $75,000 to $99,999 | 321 (6.4%) | 196 (2.6%) |
| $100,000 to $149,999 | 573 (11.4%) | 185 (2.5%) |
| $150,000 or more | 2,711 (53.9%) | 489 (6.5%) |
| Total | 5,030 (100.0%) | 7,540 (100.0%) |
Property Value to Household Income Ratio in Cupertino
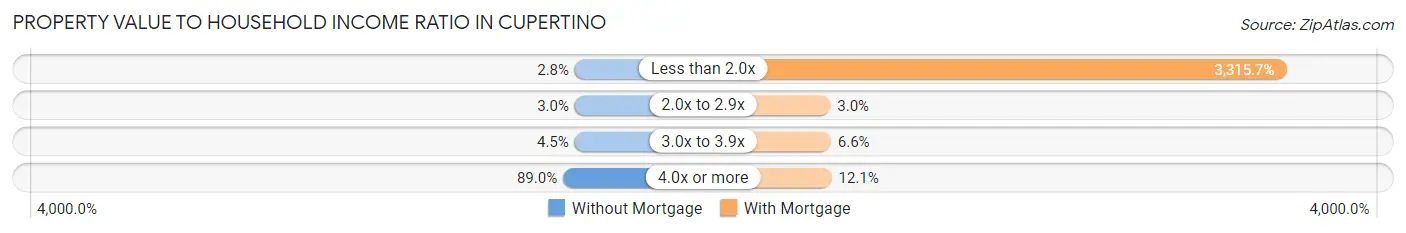
| Value-to-Income Ratio | Without Mortgage | With Mortgage |
| Less than 2.0x | 141 (2.8%) | 250,001 (3,315.7%) |
| 2.0x to 2.9x | 153 (3.0%) | 228 (3.0%) |
| 3.0x to 3.9x | 226 (4.5%) | 497 (6.6%) |
| 4.0x or more | 4,475 (89.0%) | 914 (12.1%) |
| Total | 5,030 (100.0%) | 7,540 (100.0%) |
Real Estate Taxes by Mortgage Status in Cupertino
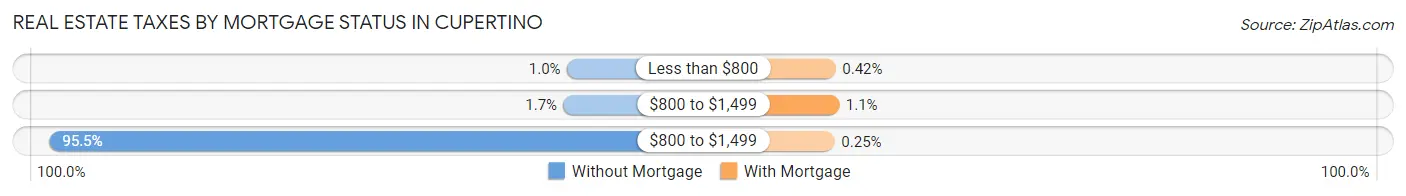
| Property Taxes | Without Mortgage | With Mortgage |
| Less than $800 | 52 (1.0%) | 32 (0.4%) |
| $800 to $1,499 | 84 (1.7%) | 80 (1.1%) |
| $800 to $1,499 | 4,802 (95.5%) | 19 (0.3%) |
| Total | 5,030 (100.0%) | 7,540 (100.0%) |
Health & Disability in Cupertino
Health Insurance Coverage by Age in Cupertino
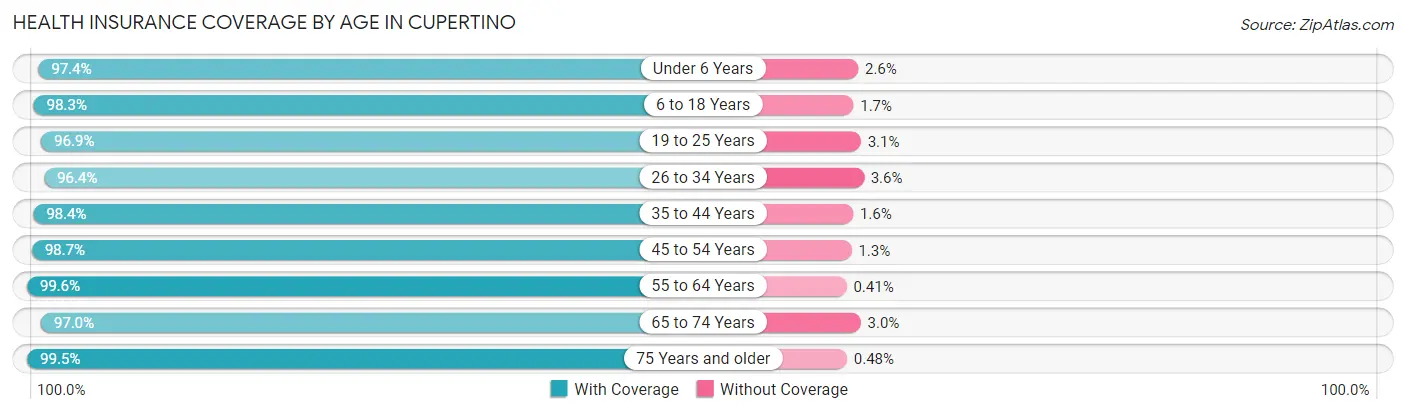
| Age Bracket | With Coverage | Without Coverage |
| Under 6 Years | 3,315 (97.4%) | 87 (2.6%) |
| 6 to 18 Years | 11,765 (98.3%) | 201 (1.7%) |
| 19 to 25 Years | 4,290 (96.9%) | 136 (3.1%) |
| 26 to 34 Years | 5,514 (96.4%) | 207 (3.6%) |
| 35 to 44 Years | 9,263 (98.4%) | 152 (1.6%) |
| 45 to 54 Years | 9,896 (98.7%) | 133 (1.3%) |
| 55 to 64 Years | 6,558 (99.6%) | 27 (0.4%) |
| 65 to 74 Years | 3,859 (97.0%) | 121 (3.0%) |
| 75 Years and older | 3,904 (99.5%) | 19 (0.5%) |
| Total | 58,364 (98.2%) | 1,083 (1.8%) |
Health Insurance Coverage by Citizenship Status in Cupertino
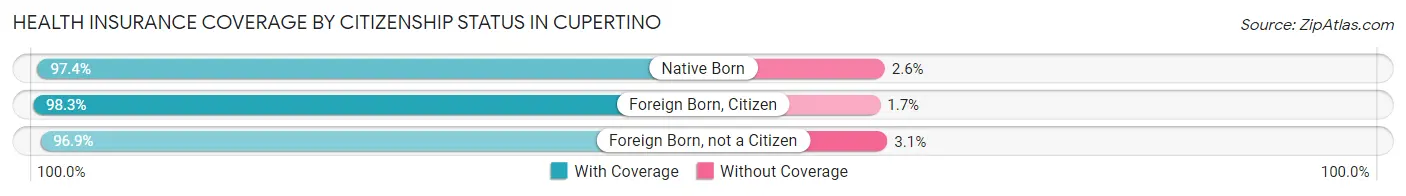
| Citizenship Status | With Coverage | Without Coverage |
| Native Born | 3,315 (97.4%) | 87 (2.6%) |
| Foreign Born, Citizen | 11,765 (98.3%) | 201 (1.7%) |
| Foreign Born, not a Citizen | 4,290 (96.9%) | 136 (3.1%) |
Health Insurance Coverage by Household Income in Cupertino
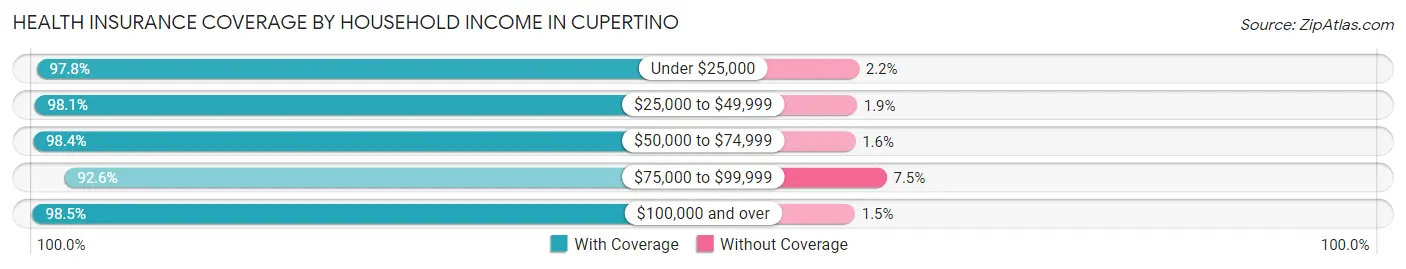
| Household Income | With Coverage | Without Coverage |
| Under $25,000 | 3,012 (97.8%) | 69 (2.2%) |
| $25,000 to $49,999 | 1,627 (98.1%) | 31 (1.9%) |
| $50,000 to $74,999 | 2,310 (98.4%) | 37 (1.6%) |
| $75,000 to $99,999 | 2,262 (92.5%) | 182 (7.4%) |
| $100,000 and over | 49,015 (98.5%) | 746 (1.5%) |
Public vs Private Health Insurance Coverage by Age in Cupertino
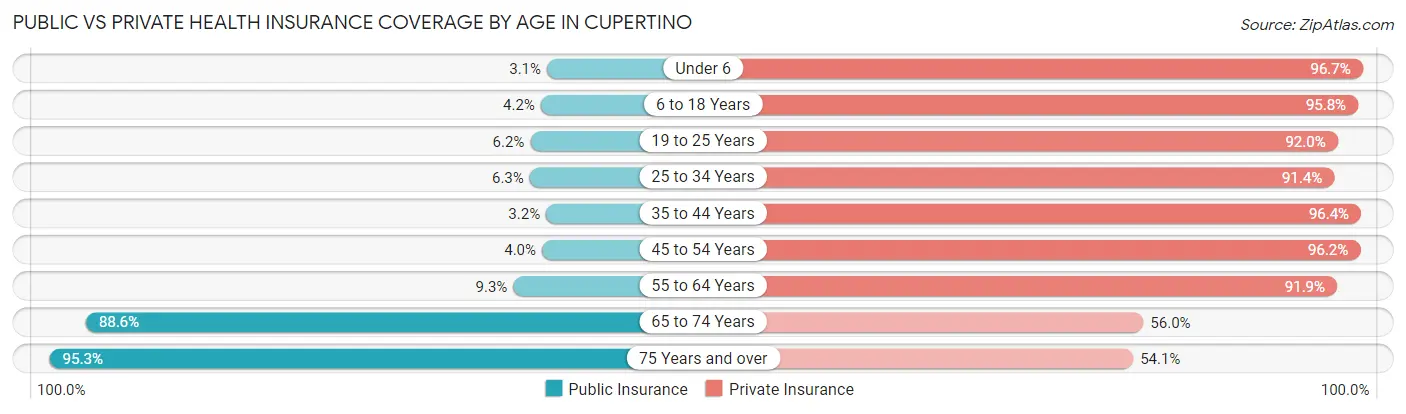
| Age Bracket | Public Insurance | Private Insurance |
| Under 6 | 104 (3.1%) | 3,288 (96.7%) |
| 6 to 18 Years | 504 (4.2%) | 11,464 (95.8%) |
| 19 to 25 Years | 272 (6.1%) | 4,072 (92.0%) |
| 25 to 34 Years | 358 (6.3%) | 5,228 (91.4%) |
| 35 to 44 Years | 303 (3.2%) | 9,072 (96.4%) |
| 45 to 54 Years | 400 (4.0%) | 9,648 (96.2%) |
| 55 to 64 Years | 614 (9.3%) | 6,050 (91.9%) |
| 65 to 74 Years | 3,527 (88.6%) | 2,228 (56.0%) |
| 75 Years and over | 3,740 (95.3%) | 2,122 (54.1%) |
| Total | 9,822 (16.5%) | 53,172 (89.4%) |
Disability Status by Sex by Age in Cupertino
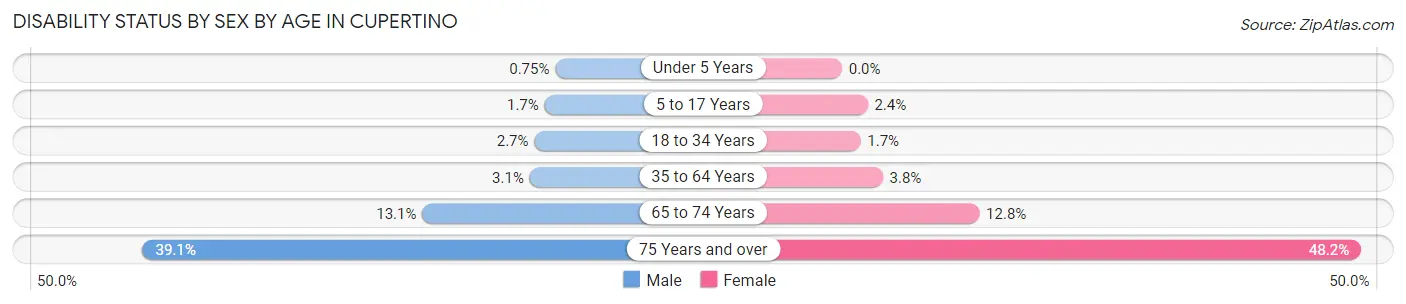
| Age Bracket | Male | Female |
| Under 5 Years | 11 (0.7%) | 0 (0.0%) |
| 5 to 17 Years | 106 (1.7%) | 134 (2.4%) |
| 18 to 34 Years | 179 (2.7%) | 76 (1.7%) |
| 35 to 64 Years | 422 (3.1%) | 474 (3.8%) |
| 65 to 74 Years | 251 (13.1%) | 263 (12.8%) |
| 75 Years and over | 617 (39.1%) | 1,129 (48.2%) |
Disability Class by Sex by Age in Cupertino
Disability Class: Hearing Difficulty
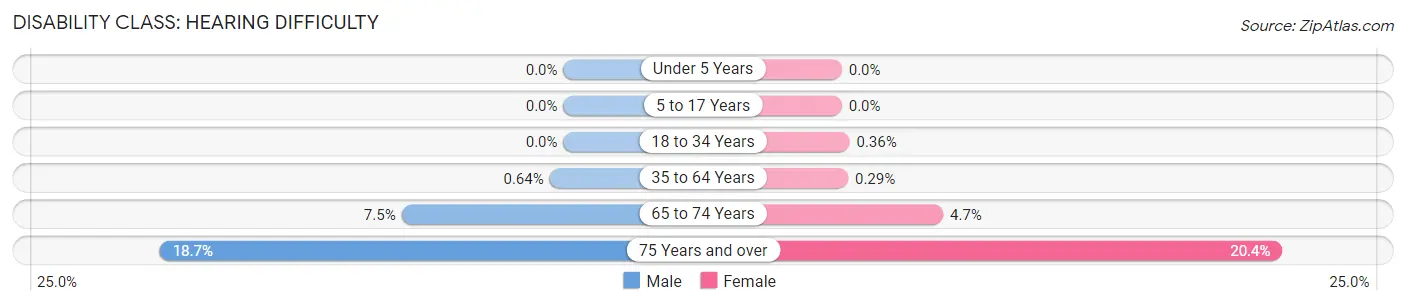
| Age Bracket | Male | Female |
| Under 5 Years | 0 (0.0%) | 0 (0.0%) |
| 5 to 17 Years | 0 (0.0%) | 0 (0.0%) |
| 18 to 34 Years | 0 (0.0%) | 16 (0.4%) |
| 35 to 64 Years | 87 (0.6%) | 36 (0.3%) |
| 65 to 74 Years | 144 (7.5%) | 97 (4.7%) |
| 75 Years and over | 296 (18.7%) | 479 (20.4%) |
Disability Class: Vision Difficulty
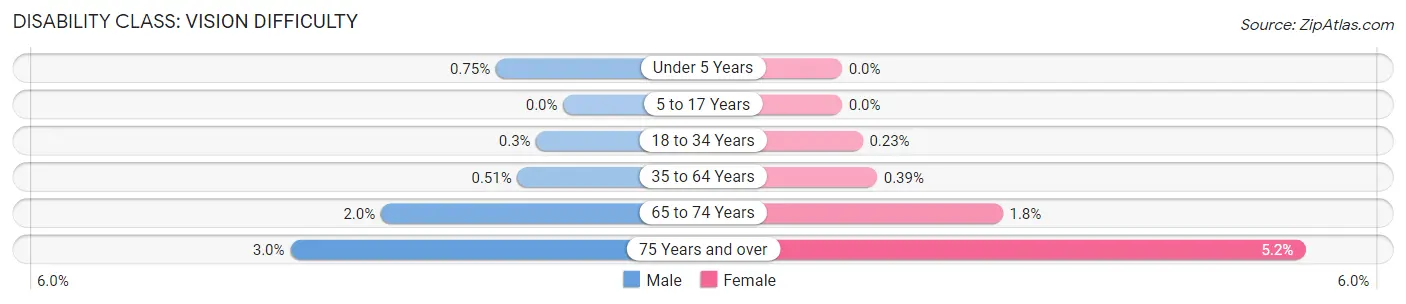
| Age Bracket | Male | Female |
| Under 5 Years | 11 (0.7%) | 0 (0.0%) |
| 5 to 17 Years | 0 (0.0%) | 0 (0.0%) |
| 18 to 34 Years | 20 (0.3%) | 10 (0.2%) |
| 35 to 64 Years | 69 (0.5%) | 49 (0.4%) |
| 65 to 74 Years | 39 (2.0%) | 37 (1.8%) |
| 75 Years and over | 48 (3.0%) | 121 (5.2%) |
Disability Class: Cognitive Difficulty
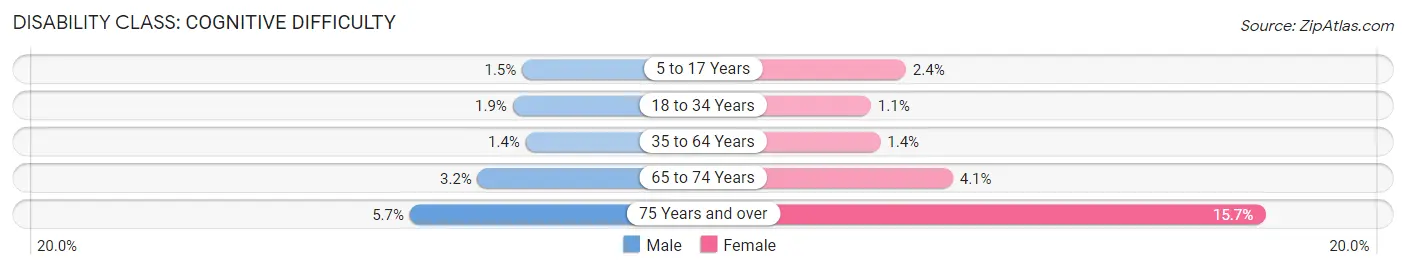
| Age Bracket | Male | Female |
| 5 to 17 Years | 93 (1.5%) | 134 (2.4%) |
| 18 to 34 Years | 125 (1.9%) | 48 (1.1%) |
| 35 to 64 Years | 190 (1.4%) | 179 (1.4%) |
| 65 to 74 Years | 61 (3.2%) | 85 (4.1%) |
| 75 Years and over | 90 (5.7%) | 368 (15.7%) |
Disability Class: Ambulatory Difficulty
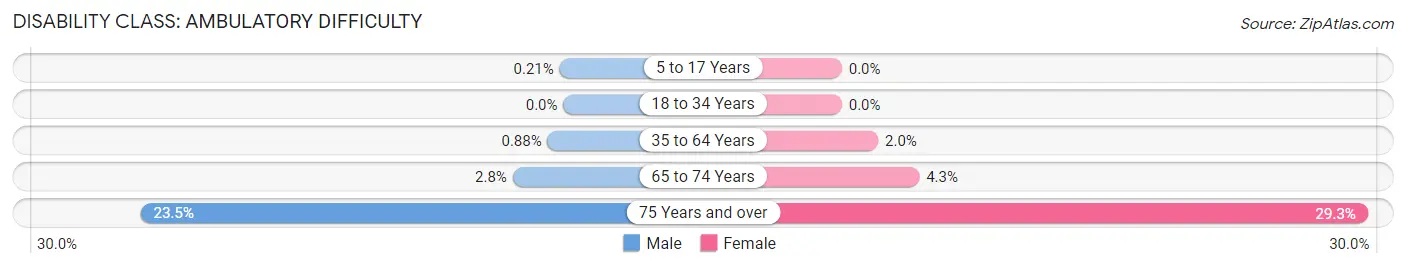
| Age Bracket | Male | Female |
| 5 to 17 Years | 13 (0.2%) | 0 (0.0%) |
| 18 to 34 Years | 0 (0.0%) | 0 (0.0%) |
| 35 to 64 Years | 119 (0.9%) | 253 (2.0%) |
| 65 to 74 Years | 54 (2.8%) | 89 (4.3%) |
| 75 Years and over | 372 (23.5%) | 686 (29.3%) |
Disability Class: Self-Care Difficulty
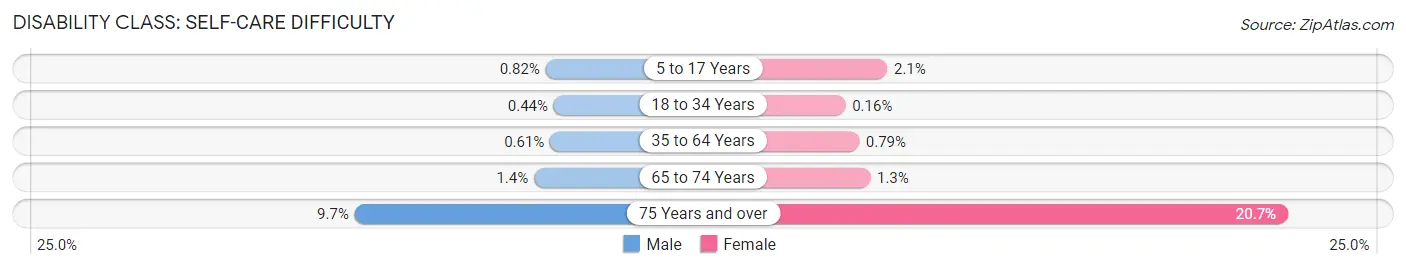
| Age Bracket | Male | Female |
| 5 to 17 Years | 50 (0.8%) | 118 (2.1%) |
| 18 to 34 Years | 29 (0.4%) | 7 (0.2%) |
| 35 to 64 Years | 82 (0.6%) | 99 (0.8%) |
| 65 to 74 Years | 26 (1.4%) | 27 (1.3%) |
| 75 Years and over | 153 (9.7%) | 485 (20.7%) |
Technology Access in Cupertino
Computing Device Access in Cupertino
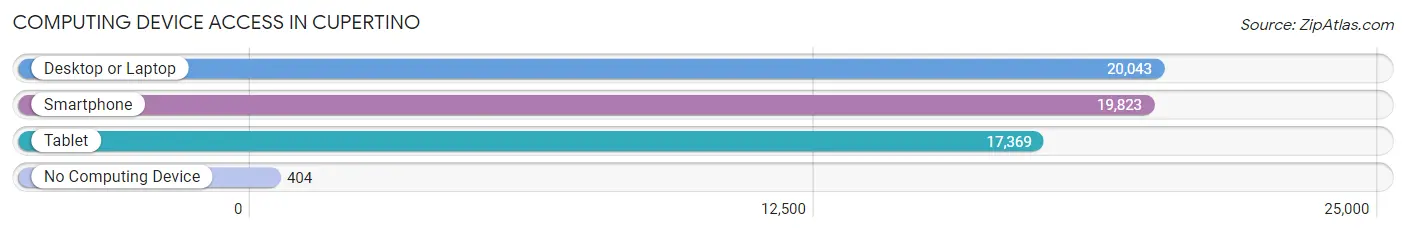
| Device Type | # Households | % Households |
| Desktop or Laptop | 20,043 | 96.6% |
| Smartphone | 19,823 | 95.6% |
| Tablet | 17,369 | 83.7% |
| No Computing Device | 404 | 1.9% |
| Total | 20,744 | 100.0% |
Internet Access in Cupertino
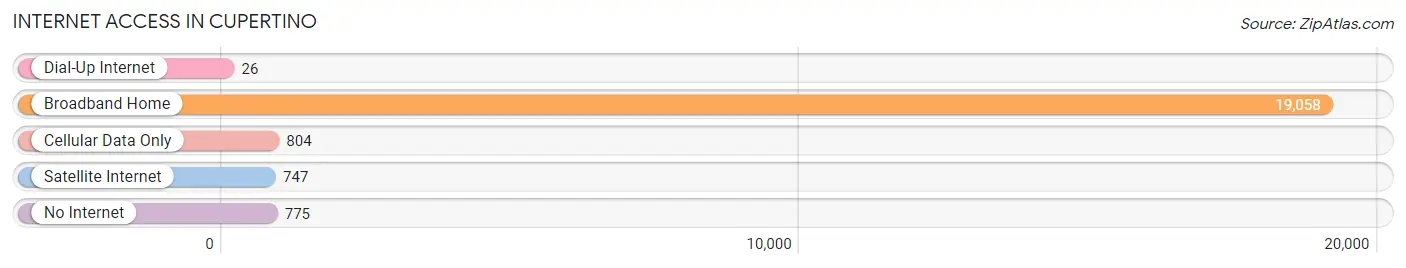
| Internet Type | # Households | % Households |
| Dial-Up Internet | 26 | 0.1% |
| Broadband Home | 19,058 | 91.9% |
| Cellular Data Only | 804 | 3.9% |
| Satellite Internet | 747 | 3.6% |
| No Internet | 775 | 3.7% |
| Total | 20,744 | 100.0% |
Cupertino Summary
Cupertino, California is a city located in the heart of Silicon Valley, in Santa Clara County. It is bordered by San Jose to the north, Los Altos to the south, and Sunnyvale to the east. Cupertino is home to Apple Inc., and is known for its high-tech industry and its high-performing schools.
History
Cupertino was originally inhabited by the Ohlone Native Americans, who lived in the area for thousands of years. In the late 1700s, Spanish explorers arrived in the area and began to settle the land. In the mid-1800s, the area was known as the Rancho San Antonio, and was owned by the Cupertino family. In the early 1900s, the area was developed as an agricultural community, and the first post office was established in 1906.
In the 1950s, the area began to experience rapid growth due to the influx of high-tech companies, such as Hewlett-Packard and Apple Inc. In the 1970s, Cupertino was incorporated as a city, and the population continued to grow. Today, Cupertino is a thriving city with a population of over 60,000 people.
Geography
Cupertino is located in the Santa Clara Valley, in the San Francisco Bay Area. The city is situated between the Santa Cruz Mountains to the west and the Diablo Range to the east. The city is approximately 10 miles from San Jose, and is bordered by Los Altos, Sunnyvale, and Santa Clara.
Cupertino has a Mediterranean climate, with mild winters and warm summers. The average temperature in the summer is around 75 degrees Fahrenheit, and the average temperature in the winter is around 55 degrees Fahrenheit.
Economy
Cupertino is home to many high-tech companies, including Apple Inc., Hewlett-Packard, and Oracle. The city is also home to several shopping centers, including the Cupertino Square Mall and the Vallco Shopping Mall.
Cupertino is also home to several educational institutions, including De Anza College, Foothill College, and the University of California, Santa Cruz. The city is also home to several parks, including the Cupertino Memorial Park and the Rancho San Antonio County Park.
Demographics
As of the 2010 census, the population of Cupertino was 58,302. The racial makeup of the city was 57.2% White, 2.3% African American, 0.3% Native American, 35.2% Asian, 0.1% Pacific Islander, 2.7% from other races, and 2.4% from two or more races. The median household income was $118,871, and the median family income was $138,945.
Cupertino is a diverse city, with a large Asian population. The city is home to many immigrants from China, India, and other countries. The city is also home to a large Jewish population, and is home to several synagogues.
Cupertino is a vibrant city, with a strong economy and a diverse population. The city is home to many high-tech companies, and is known for its excellent schools. Cupertino is a great place to live, work, and play.
Common Questions
What is Per Capita Income in Cupertino?
Per Capita income in Cupertino is $99,138.
What is the Median Family Income in Cupertino?
Median Family Income in Cupertino is $250,001.
What is the Median Household income in Cupertino?
Median Household Income in Cupertino is $223,667.
What is Income or Wage Gap in Cupertino?
Income or Wage Gap in Cupertino is 45.6%.
Women in Cupertino earn 54.4 cents for every dollar earned by a man.
What is Family Income Deficit in Cupertino?
Family Income Deficit in Cupertino is $11,958.
Families that are below poverty line in Cupertino earn $11,958 less on average than the poverty threshold level.
What is Inequality or Gini Index in Cupertino?
Inequality or Gini Index in Cupertino is 0.45.
What is the Total Population of Cupertino?
Total Population of Cupertino is 59,763.
What is the Total Male Population of Cupertino?
Total Male Population of Cupertino is 31,431.
What is the Total Female Population of Cupertino?
Total Female Population of Cupertino is 28,332.
What is the Ratio of Males per 100 Females in Cupertino?
There are 110.94 Males per 100 Females in Cupertino.
What is the Ratio of Females per 100 Males in Cupertino?
There are 90.14 Females per 100 Males in Cupertino.
What is the Median Population Age in Cupertino?
Median Population Age in Cupertino is 40.4 Years.
What is the Average Family Size in Cupertino
Average Family Size in Cupertino is 3.2 People.
What is the Average Household Size in Cupertino
Average Household Size in Cupertino is 2.9 People.
How Large is the Labor Force in Cupertino?
There are 29,023 People in the Labor Forcein in Cupertino.
What is the Percentage of People in the Labor Force in Cupertino?
61.5% of People are in the Labor Force in Cupertino.
What is the Unemployment Rate in Cupertino?
Unemployment Rate in Cupertino is 3.0%.