Cities with the Highest Percentage of Population Employed in Architecture & Engineering in Hawaii
RELATED REPORTS & OPTIONS
Architecture & Engineering
Hawaii
Compare Cities
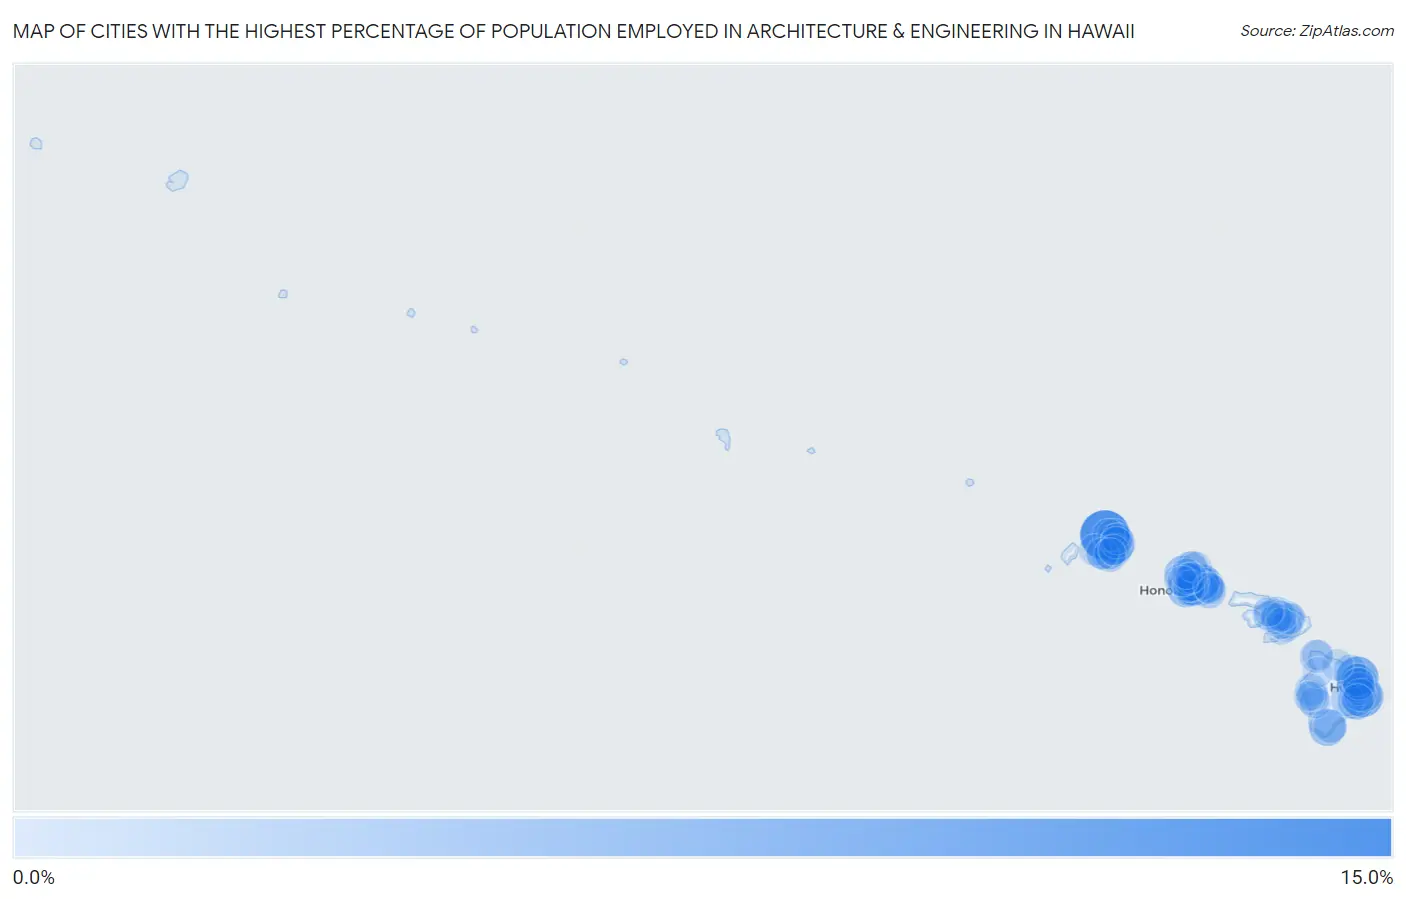
Map of Cities with the Highest Percentage of Population Employed in Architecture & Engineering in Hawaii
0.0%
15.0%
Cities with the Highest Percentage of Population Employed in Architecture & Engineering in Hawaii
| City | % Employed | vs State | vs National | |
| 1. | Wainiha | 12.7% | 1.7%(+11.0)#1 | 2.1%(+10.6)#320 |
| 2. | Honomu | 7.7% | 1.7%(+5.91)#2 | 2.1%(+5.51)#779 |
| 3. | Orchidlands Estates | 7.6% | 1.7%(+5.81)#3 | 2.1%(+5.41)#798 |
| 4. | Wailua Homesteads | 6.2% | 1.7%(+4.45)#4 | 2.1%(+4.06)#1,161 |
| 5. | Papaikou | 5.7% | 1.7%(+3.98)#5 | 2.1%(+3.58)#1,376 |
| 6. | East Kapolei | 5.1% | 1.7%(+3.32)#6 | 2.1%(+2.92)#1,784 |
| 7. | Ko Olina | 4.6% | 1.7%(+2.90)#7 | 2.1%(+2.50)#2,102 |
| 8. | Discovery Harbour | 4.3% | 1.7%(+2.55)#8 | 2.1%(+2.15)#2,399 |
| 9. | Fern Forest | 4.3% | 1.7%(+2.54)#9 | 2.1%(+2.14)#2,417 |
| 10. | Mokuleia | 3.8% | 1.7%(+2.07)#10 | 2.1%(+1.67)#2,986 |
| 11. | Waimalu | 3.8% | 1.7%(+2.03)#11 | 2.1%(+1.63)#3,051 |
| 12. | Maunawili | 3.7% | 1.7%(+1.91)#12 | 2.1%(+1.51)#3,241 |
| 13. | Royal Kunia | 3.5% | 1.7%(+1.76)#13 | 2.1%(+1.36)#3,521 |
| 14. | Wailua | 3.5% | 1.7%(+1.76)#14 | 2.1%(+1.36)#3,523 |
| 15. | Waipio | 3.4% | 1.7%(+1.64)#15 | 2.1%(+1.24)#3,725 |
| 16. | Kaneohe | 3.3% | 1.7%(+1.53)#16 | 2.1%(+1.13)#3,937 |
| 17. | Aiea | 3.2% | 1.7%(+1.44)#17 | 2.1%(+1.04)#4,122 |
| 18. | Ahuimanu | 3.1% | 1.7%(+1.33)#18 | 2.1%(+0.935)#4,364 |
| 19. | Kahaluu | 2.8% | 1.7%(+1.10)#19 | 2.1%(+0.698)#4,992 |
| 20. | East Honolulu | 2.7% | 1.7%(+0.994)#20 | 2.1%(+0.594)#5,281 |
| 21. | Wainaku | 2.7% | 1.7%(+0.984)#21 | 2.1%(+0.584)#5,311 |
| 22. | Mililani Mauka | 2.7% | 1.7%(+0.972)#22 | 2.1%(+0.573)#5,356 |
| 23. | Pupukea | 2.7% | 1.7%(+0.966)#23 | 2.1%(+0.566)#5,382 |
| 24. | Halawa | 2.6% | 1.7%(+0.900)#24 | 2.1%(+0.500)#5,581 |
| 25. | Omao | 2.6% | 1.7%(+0.842)#25 | 2.1%(+0.442)#5,756 |
| 26. | Pearl City | 2.5% | 1.7%(+0.730)#26 | 2.1%(+0.330)#6,093 |
| 27. | Ocean Pointe | 2.5% | 1.7%(+0.724)#27 | 2.1%(+0.324)#6,115 |
| 28. | Kailua Cdp Honolulu County | 2.4% | 1.7%(+0.695)#28 | 2.1%(+0.295)#6,210 |
| 29. | Waihee Waiehu | 2.4% | 1.7%(+0.664)#29 | 2.1%(+0.264)#6,331 |
| 30. | Iroquois Point | 2.4% | 1.7%(+0.636)#30 | 2.1%(+0.236)#6,425 |
| 31. | Poipu | 2.4% | 1.7%(+0.617)#31 | 2.1%(+0.218)#6,486 |
| 32. | Laupahoehoe | 2.2% | 1.7%(+0.465)#32 | 2.1%(+0.066)#7,062 |
| 33. | Urban Honolulu | 2.2% | 1.7%(+0.443)#33 | 2.1%(+0.043)#7,155 |
| 34. | Waipio Acres | 2.2% | 1.7%(+0.420)#34 | 2.1%(+0.020)#7,259 |
| 35. | Naalehu | 2.1% | 1.7%(+0.385)#35 | 2.1%(-0.014)#7,386 |
| 36. | Waikele | 2.1% | 1.7%(+0.348)#36 | 2.1%(-0.051)#7,530 |
| 37. | Kaneohe Base | 2.1% | 1.7%(+0.309)#37 | 2.1%(-0.091)#7,709 |
| 38. | Hawaiian Paradise Park | 2.0% | 1.7%(+0.285)#38 | 2.1%(-0.114)#7,799 |
| 39. | Volcano | 2.0% | 1.7%(+0.284)#39 | 2.1%(-0.115)#7,802 |
| 40. | Kealakekua | 2.0% | 1.7%(+0.283)#40 | 2.1%(-0.117)#7,805 |
| 41. | Hawi | 2.0% | 1.7%(+0.208)#41 | 2.1%(-0.192)#8,083 |
| 42. | Hanapepe | 1.9% | 1.7%(+0.154)#42 | 2.1%(-0.246)#8,303 |
| 43. | Lihue | 1.9% | 1.7%(+0.111)#43 | 2.1%(-0.289)#8,495 |
| 44. | Ewa Gentry | 1.7% | 1.7%(-0.001)#44 | 2.1%(-0.400)#8,989 |
| 45. | Mililani Town | 1.7% | 1.7%(-0.038)#45 | 2.1%(-0.438)#9,172 |
| 46. | Hilo | 1.7% | 1.7%(-0.048)#46 | 2.1%(-0.447)#9,215 |
| 47. | Kilauea | 1.6% | 1.7%(-0.123)#47 | 2.1%(-0.523)#9,579 |
| 48. | Holualoa | 1.6% | 1.7%(-0.147)#48 | 2.1%(-0.547)#9,714 |
| 49. | Pepeekeo | 1.6% | 1.7%(-0.185)#49 | 2.1%(-0.584)#9,872 |
| 50. | Kurtistown | 1.5% | 1.7%(-0.206)#50 | 2.1%(-0.605)#10,002 |
| 51. | Kapolei | 1.5% | 1.7%(-0.220)#51 | 2.1%(-0.619)#10,075 |
| 52. | Princeville | 1.5% | 1.7%(-0.224)#52 | 2.1%(-0.623)#10,101 |
| 53. | Ewa Beach | 1.5% | 1.7%(-0.240)#53 | 2.1%(-0.639)#10,163 |
| 54. | Makawao | 1.4% | 1.7%(-0.324)#54 | 2.1%(-0.723)#10,593 |
| 55. | Makaha | 1.3% | 1.7%(-0.465)#55 | 2.1%(-0.864)#11,326 |
| 56. | Wailea | 1.3% | 1.7%(-0.494)#56 | 2.1%(-0.893)#11,480 |
| 57. | Heeia | 1.3% | 1.7%(-0.496)#57 | 2.1%(-0.895)#11,490 |
| 58. | Waipahu | 1.2% | 1.7%(-0.513)#58 | 2.1%(-0.912)#11,568 |
| 59. | Kekaha | 1.2% | 1.7%(-0.515)#59 | 2.1%(-0.915)#11,581 |
| 60. | Eleele | 1.2% | 1.7%(-0.543)#60 | 2.1%(-0.942)#11,737 |
| 61. | Wahiawa | 1.2% | 1.7%(-0.559)#61 | 2.1%(-0.958)#11,817 |
| 62. | Paukaa | 1.2% | 1.7%(-0.564)#62 | 2.1%(-0.963)#11,852 |
| 63. | Honaunau Napoopoo | 1.2% | 1.7%(-0.582)#63 | 2.1%(-0.981)#11,942 |
| 64. | Eden Roc | 1.2% | 1.7%(-0.587)#64 | 2.1%(-0.986)#11,972 |
| 65. | Kahuku | 1.1% | 1.7%(-0.611)#65 | 2.1%(-1.01)#12,083 |
| 66. | Pukalani | 1.1% | 1.7%(-0.658)#66 | 2.1%(-1.06)#12,337 |
| 67. | Kapaa | 1.1% | 1.7%(-0.669)#67 | 2.1%(-1.07)#12,403 |
| 68. | Honokaa | 1.0% | 1.7%(-0.702)#68 | 2.1%(-1.10)#12,577 |
| 69. | Waimea Cdp Hawaii County | 1.0% | 1.7%(-0.711)#69 | 2.1%(-1.11)#12,627 |
| 70. | Kalaeloa | 1.0% | 1.7%(-0.720)#70 | 2.1%(-1.12)#12,683 |
| 71. | Kaiminani | 1.0% | 1.7%(-0.727)#71 | 2.1%(-1.13)#12,718 |
| 72. | West Loch Estate | 1.0% | 1.7%(-0.736)#72 | 2.1%(-1.14)#12,766 |
| 73. | Wailuku | 0.95% | 1.7%(-0.802)#73 | 2.1%(-1.20)#13,135 |
| 74. | Keokea | 0.95% | 1.7%(-0.803)#74 | 2.1%(-1.20)#13,146 |
| 75. | Makakilo | 0.93% | 1.7%(-0.818)#75 | 2.1%(-1.22)#13,233 |
| 76. | Waiahole-Waikane | 0.87% | 1.7%(-0.875)#76 | 2.1%(-1.27)#13,542 |
| 77. | Olinda | 0.87% | 1.7%(-0.877)#77 | 2.1%(-1.28)#13,553 |
| 78. | Kaanapali | 0.84% | 1.7%(-0.914)#78 | 2.1%(-1.31)#13,780 |
| 79. | Schofield Barracks | 0.83% | 1.7%(-0.923)#79 | 2.1%(-1.32)#13,831 |
| 80. | Waimea Cdp Kauai County | 0.78% | 1.7%(-0.968)#80 | 2.1%(-1.37)#14,096 |
| 81. | Honalo | 0.76% | 1.7%(-0.989)#81 | 2.1%(-1.39)#14,222 |
| 82. | Waimanalo Beach | 0.73% | 1.7%(-1.01)#82 | 2.1%(-1.41)#14,375 |
| 83. | Anahola | 0.72% | 1.7%(-1.03)#83 | 2.1%(-1.43)#14,464 |
| 84. | Koloa | 0.68% | 1.7%(-1.07)#84 | 2.1%(-1.47)#14,660 |
| 85. | Lahaina | 0.68% | 1.7%(-1.07)#85 | 2.1%(-1.47)#14,702 |
| 86. | Waikapu | 0.66% | 1.7%(-1.09)#86 | 2.1%(-1.49)#14,796 |
| 87. | Kihei | 0.65% | 1.7%(-1.10)#87 | 2.1%(-1.50)#14,838 |
| 88. | Kahului | 0.64% | 1.7%(-1.11)#88 | 2.1%(-1.51)#14,898 |
| 89. | Kapaau | 0.58% | 1.7%(-1.17)#89 | 2.1%(-1.57)#15,206 |
| 90. | Kawela Bay | 0.57% | 1.7%(-1.18)#90 | 2.1%(-1.58)#15,256 |
| 91. | Kaloko | 0.42% | 1.7%(-1.33)#91 | 2.1%(-1.73)#15,968 |
| 92. | Whitmore Village | 0.41% | 1.7%(-1.34)#92 | 2.1%(-1.74)#16,030 |
| 93. | Waimanalo | 0.38% | 1.7%(-1.37)#93 | 2.1%(-1.77)#16,172 |
| 94. | Waikoloa Village | 0.38% | 1.7%(-1.37)#94 | 2.1%(-1.77)#16,175 |
| 95. | Waialua | 0.34% | 1.7%(-1.41)#95 | 2.1%(-1.81)#16,344 |
| 96. | Waianae | 0.34% | 1.7%(-1.41)#96 | 2.1%(-1.81)#16,360 |
| 97. | Mahinahina | 0.31% | 1.7%(-1.44)#97 | 2.1%(-1.84)#16,448 |
| 98. | Puhi | 0.21% | 1.7%(-1.54)#98 | 2.1%(-1.93)#16,695 |
| 99. | Kailua Cdp Hawaii County | 0.17% | 1.7%(-1.58)#99 | 2.1%(-1.98)#16,758 |
| 100. | Kahaluu Keauhou | 0.13% | 1.7%(-1.62)#100 | 2.1%(-2.02)#16,808 |
1
2Common Questions
What are the Top 10 Cities with the Highest Percentage of Population Employed in Architecture & Engineering in Hawaii?
Top 10 Cities with the Highest Percentage of Population Employed in Architecture & Engineering in Hawaii are:
#1
12.7%
#2
7.7%
#3
7.6%
#4
6.2%
#5
5.7%
#6
4.6%
#7
4.3%
#8
4.3%
#9
3.8%
#10
3.8%
What city has the Highest Percentage of Population Employed in Architecture & Engineering in Hawaii?
Wainiha has the Highest Percentage of Population Employed in Architecture & Engineering in Hawaii with 12.7%.
What is the Percentage of Population Employed in Architecture & Engineering in the State of Hawaii?
Percentage of Population Employed in Architecture & Engineering in Hawaii is 1.7%.
What is the Percentage of Population Employed in Architecture & Engineering in the United States?
Percentage of Population Employed in Architecture & Engineering in the United States is 2.1%.