Honcut, CA Map & Demographics
Honcut Map
Honcut Overview
$41,233
PER CAPITA INCOME
$161,250
AVG FAMILY INCOME
$161,250
AVG HOUSEHOLD INCOME
0.54
INEQUALITY / GINI INDEX
313
TOTAL POPULATION
126
MALE POPULATION
187
FEMALE POPULATION
67.38
MALES / 100 FEMALES
148.41
FEMALES / 100 MALES
42.3
MEDIAN AGE
3.2
AVG FAMILY SIZE
3.2
AVG HOUSEHOLD SIZE
81
LABOR FORCE [ PEOPLE ]
31.0%
PERCENT IN LABOR FORCE
40.7%
UNEMPLOYMENT RATE
Income in Honcut
Income Overview in Honcut
Per Capita Income in Honcut is $41,233, while median incomes of families and households are $161,250 and $161,250 respectively.
| Characteristic | Number | Measure |
| Per Capita Income | 313 | $41,233 |
| Median Family Income | 99 | $161,250 |
| Mean Family Income | 99 | $165,161 |
| Median Household Income | 99 | $161,250 |
| Mean Household Income | 99 | $165,161 |
| Income Deficit | 99 | $0 |
| Wage / Income Gap (%) | 313 | 0.00% |
| Wage / Income Gap ($) | 313 | 100.00¢ per $1 |
| Gini / Inequality Index | 313 | 0.54 |
Earnings by Sex in Honcut
| Sex | Number | Average Earnings |
| Male | 26 (32.1%) | $0 |
| Female | 55 (67.9%) | $0 |
| Total | 81 (100.0%) | $0 |
Earnings by Sex by Income Bracket in Honcut
The most common earnings brackets in Honcut are $50,000 to $54,999 for men (13 | 50.0%) and $12,500 to $14,999 for women (33 | 60.0%).
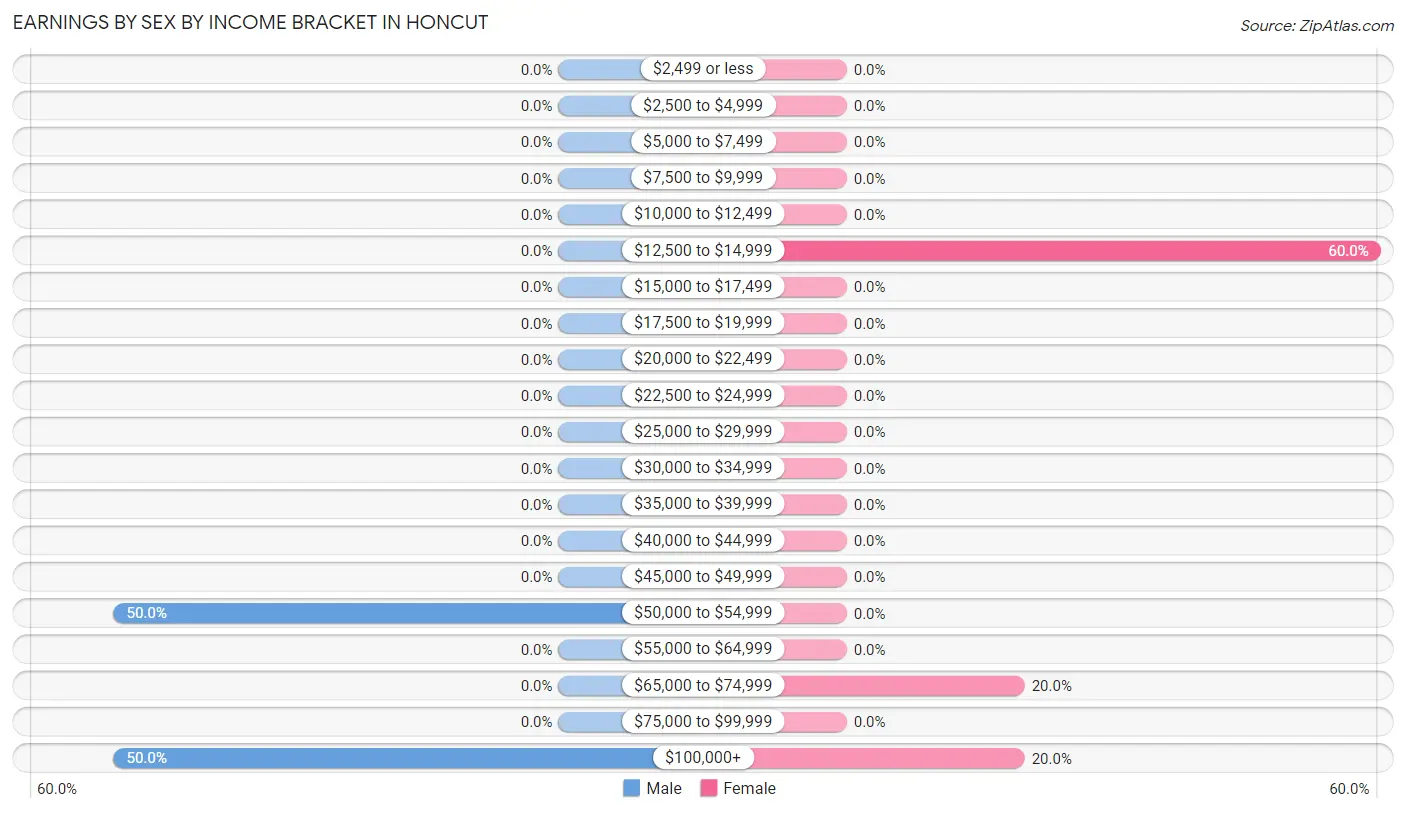
| Income | Male | Female |
| $2,499 or less | 0 (0.0%) | 0 (0.0%) |
| $2,500 to $4,999 | 0 (0.0%) | 0 (0.0%) |
| $5,000 to $7,499 | 0 (0.0%) | 0 (0.0%) |
| $7,500 to $9,999 | 0 (0.0%) | 0 (0.0%) |
| $10,000 to $12,499 | 0 (0.0%) | 0 (0.0%) |
| $12,500 to $14,999 | 0 (0.0%) | 33 (60.0%) |
| $15,000 to $17,499 | 0 (0.0%) | 0 (0.0%) |
| $17,500 to $19,999 | 0 (0.0%) | 0 (0.0%) |
| $20,000 to $22,499 | 0 (0.0%) | 0 (0.0%) |
| $22,500 to $24,999 | 0 (0.0%) | 0 (0.0%) |
| $25,000 to $29,999 | 0 (0.0%) | 0 (0.0%) |
| $30,000 to $34,999 | 0 (0.0%) | 0 (0.0%) |
| $35,000 to $39,999 | 0 (0.0%) | 0 (0.0%) |
| $40,000 to $44,999 | 0 (0.0%) | 0 (0.0%) |
| $45,000 to $49,999 | 0 (0.0%) | 0 (0.0%) |
| $50,000 to $54,999 | 13 (50.0%) | 0 (0.0%) |
| $55,000 to $64,999 | 0 (0.0%) | 0 (0.0%) |
| $65,000 to $74,999 | 0 (0.0%) | 11 (20.0%) |
| $75,000 to $99,999 | 0 (0.0%) | 0 (0.0%) |
| $100,000+ | 13 (50.0%) | 11 (20.0%) |
| Total | 26 (100.0%) | 55 (100.0%) |
Earnings by Sex by Educational Attainment in Honcut
| Educational Attainment | Male Income | Female Income |
| Less than High School | - | - |
| High School Diploma | - | - |
| College or Associate's Degree | - | - |
| Bachelor's Degree | - | - |
| Graduate Degree | - | - |
| Total | - | - |
Family Income in Honcut
Family Income Brackets in Honcut
According to the Honcut family income data, there are 44 families falling into the $150,000 to $199,999 income range, which is the most common income bracket and makes up 44.4% of all families.
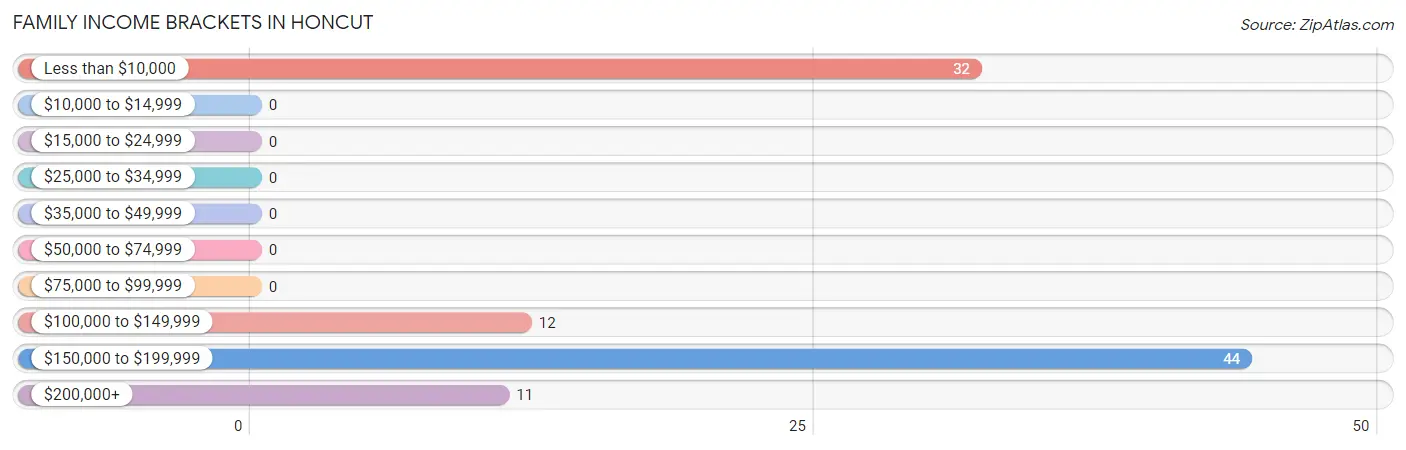
| Income Bracket | # Families | % Families |
| Less than $10,000 | 32 | 32.3% |
| $10,000 to $14,999 | 0 | 0.0% |
| $15,000 to $24,999 | 0 | 0.0% |
| $25,000 to $34,999 | 0 | 0.0% |
| $35,000 to $49,999 | 0 | 0.0% |
| $50,000 to $74,999 | 0 | 0.0% |
| $75,000 to $99,999 | 0 | 0.0% |
| $100,000 to $149,999 | 12 | 12.1% |
| $150,000 to $199,999 | 44 | 44.4% |
| $200,000+ | 11 | 11.1% |
Family Income by Famaliy Size in Honcut
| Income Bracket | # Families | Median Income |
| 2-Person Families | 22 (22.2%) | $0 |
| 3-Person Families | 33 (33.3%) | $0 |
| 4-Person Families | 12 (12.1%) | $0 |
| 5-Person Families | 32 (32.3%) | $0 |
| 6-Person Families | 0 (0.0%) | $0 |
| 7+ Person Families | 0 (0.0%) | $0 |
| Total | 99 (100.0%) | $161,250 |
Family Income by Number of Earners in Honcut
| Number of Earners | # Families | Median Income |
| No Earners | 32 (32.3%) | $0 |
| 1 Earner | 45 (45.5%) | $0 |
| 2 Earners | 22 (22.2%) | $0 |
| 3+ Earners | 0 (0.0%) | $0 |
| Total | 99 (100.0%) | $161,250 |
Household Income in Honcut
Household Income Brackets in Honcut
With 44 households falling in the category, the $150,000 to $199,999 income range is the most frequent in Honcut, accounting for 44.4% of all households.
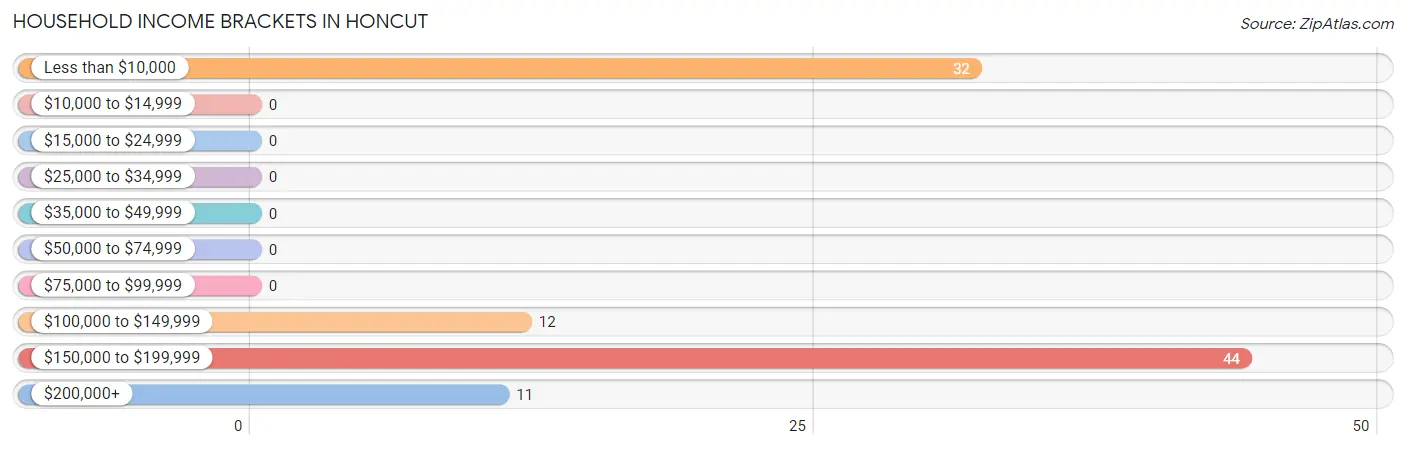
| Income Bracket | # Households | % Households |
| Less than $10,000 | 32 | 32.3% |
| $10,000 to $14,999 | 0 | 0.0% |
| $15,000 to $24,999 | 0 | 0.0% |
| $25,000 to $34,999 | 0 | 0.0% |
| $35,000 to $49,999 | 0 | 0.0% |
| $50,000 to $74,999 | 0 | 0.0% |
| $75,000 to $99,999 | 0 | 0.0% |
| $100,000 to $149,999 | 12 | 12.1% |
| $150,000 to $199,999 | 44 | 44.4% |
| $200,000+ | 11 | 11.1% |
Household Income by Householder Age in Honcut
| Income Bracket | # Households | Median Income |
| 15 to 24 Years | 0 (0.0%) | $0 |
| 25 to 44 Years | 43 (43.4%) | $0 |
| 45 to 64 Years | 44 (44.4%) | $0 |
| 65+ Years | 12 (12.1%) | $0 |
| Total | 99 (100.0%) | $161,250 |
Poverty in Honcut
Income Below Poverty by Sex and Age in Honcut
With 18.2% poverty level for males and 64.2% for females among the residents of Honcut, 45 to 54 year old males and 12 to 14 year old females are the most vulnerable to poverty, with 23 males (36.5%) and 28 females (100.0%) in their respective age groups living below the poverty level.
| Age Bracket | Male | Female |
| Under 5 Years | 0 (0.0%) | 0 (0.0%) |
| 5 Years | 0 (0.0%) | 0 (0.0%) |
| 6 to 11 Years | 0 (0.0%) | 0 (0.0%) |
| 12 to 14 Years | 0 (0.0%) | 28 (100.0%) |
| 15 Years | 0 (0.0%) | 0 (0.0%) |
| 16 and 17 Years | 0 (0.0%) | 33 (100.0%) |
| 18 to 24 Years | 0 (0.0%) | 0 (0.0%) |
| 25 to 34 Years | 0 (0.0%) | 27 (71.1%) |
| 35 to 44 Years | 0 (0.0%) | 32 (49.2%) |
| 45 to 54 Years | 23 (36.5%) | 0 (0.0%) |
| 55 to 64 Years | 0 (0.0%) | 0 (0.0%) |
| 65 to 74 Years | 0 (0.0%) | 0 (0.0%) |
| 75 Years and over | 0 (0.0%) | 0 (0.0%) |
| Total | 23 (18.2%) | 120 (64.2%) |
Income Above Poverty by Sex and Age in Honcut
According to the poverty statistics in Honcut, males aged 6 to 11 years and females aged 55 to 64 years are the age groups that are most secure financially, with 100.0% of males and 100.0% of females in these age groups living above the poverty line.
| Age Bracket | Male | Female |
| Under 5 Years | 0 (0.0%) | 0 (0.0%) |
| 5 Years | 0 (0.0%) | 0 (0.0%) |
| 6 to 11 Years | 24 (100.0%) | 0 (0.0%) |
| 12 to 14 Years | 0 (0.0%) | 0 (0.0%) |
| 15 Years | 0 (0.0%) | 0 (0.0%) |
| 16 and 17 Years | 0 (0.0%) | 0 (0.0%) |
| 18 to 24 Years | 0 (0.0%) | 0 (0.0%) |
| 25 to 34 Years | 0 (0.0%) | 11 (28.9%) |
| 35 to 44 Years | 25 (100.0%) | 33 (50.8%) |
| 45 to 54 Years | 40 (63.5%) | 0 (0.0%) |
| 55 to 64 Years | 14 (100.0%) | 11 (100.0%) |
| 65 to 74 Years | 0 (0.0%) | 12 (100.0%) |
| 75 Years and over | 0 (0.0%) | 0 (0.0%) |
| Total | 103 (81.8%) | 67 (35.8%) |
Income Below Poverty Among Married-Couple Families in Honcut
The poverty statistics for married-couple families in Honcut show that 36.8% or 32 of the total 87 families live below the poverty line. Families with 1 or 2 children have the highest poverty rate of 49.2%, comprising of 32 families. On the other hand, families with no children have the lowest poverty rate of 0.0%, which includes 0 families.
| Children | Above Poverty | Below Poverty |
| No Children | 22 (100.0%) | 0 (0.0%) |
| 1 or 2 Children | 33 (50.8%) | 32 (49.2%) |
| 3 or 4 Children | 0 (0.0%) | 0 (0.0%) |
| 5 or more Children | 0 (0.0%) | 0 (0.0%) |
| Total | 55 (63.2%) | 32 (36.8%) |
Income Below Poverty Among Single-Parent Households in Honcut
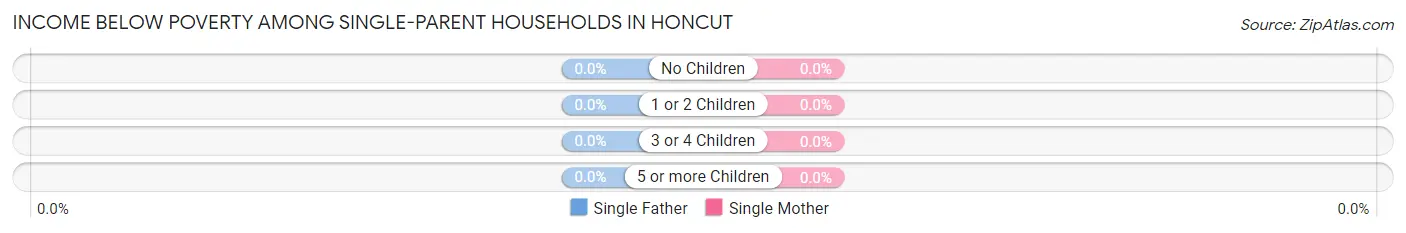
| Children | Single Father | Single Mother |
| No Children | 0 (0.0%) | 0 (0.0%) |
| 1 or 2 Children | 0 (0.0%) | 0 (0.0%) |
| 3 or 4 Children | 0 (0.0%) | 0 (0.0%) |
| 5 or more Children | 0 (0.0%) | 0 (0.0%) |
| Total | 0 (0.0%) | 0 (0.0%) |
Income Below Poverty Among Married-Couple vs Single-Parent Households in Honcut
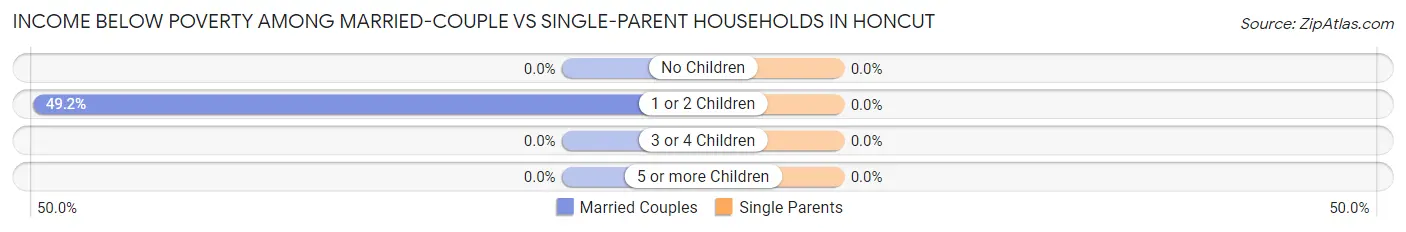
| Children | Married-Couple Families | Single-Parent Households |
| No Children | 0 (0.0%) | 0 (0.0%) |
| 1 or 2 Children | 32 (49.2%) | 0 (0.0%) |
| 3 or 4 Children | 0 (0.0%) | 0 (0.0%) |
| 5 or more Children | 0 (0.0%) | 0 (0.0%) |
| Total | 32 (36.8%) | 0 (0.0%) |
Race in Honcut
The most populous races in Honcut are Hispanic or Latino (204 | 65.2%), Some other Race (101 | 32.3%), and White / Caucasian (90 | 28.7%).
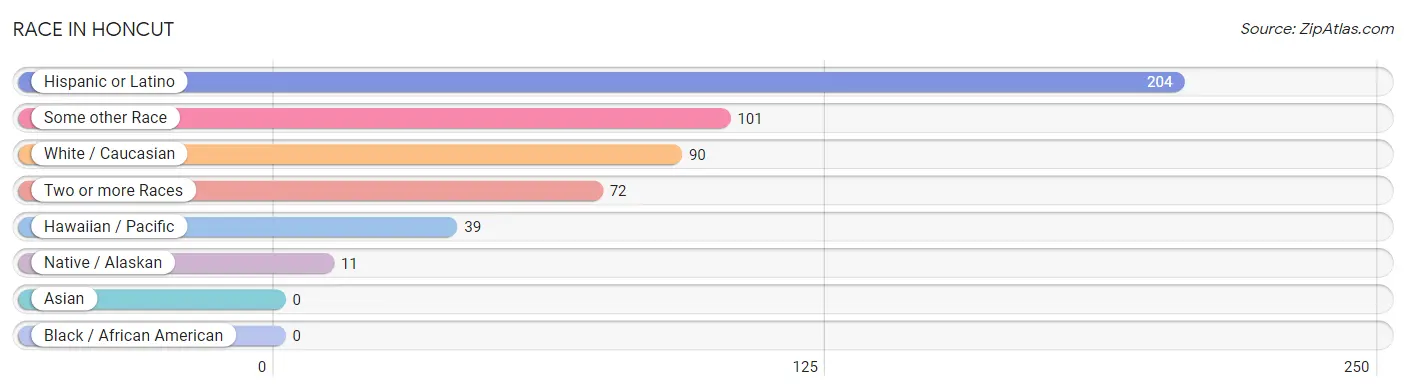
| Race | # Population | % Population |
| Asian | 0 | 0.0% |
| Black / African American | 0 | 0.0% |
| Hawaiian / Pacific | 39 | 12.5% |
| Hispanic or Latino | 204 | 65.2% |
| Native / Alaskan | 11 | 3.5% |
| White / Caucasian | 90 | 28.7% |
| Two or more Races | 72 | 23.0% |
| Some other Race | 101 | 32.3% |
| Total | 313 | 100.0% |
Ancestry in Honcut
The most populous ancestries reported in Honcut are Mexican (204 | 65.2%), and Guamanian / Chamorro (39 | 12.5%), together accounting for 77.6% of all Honcut residents.
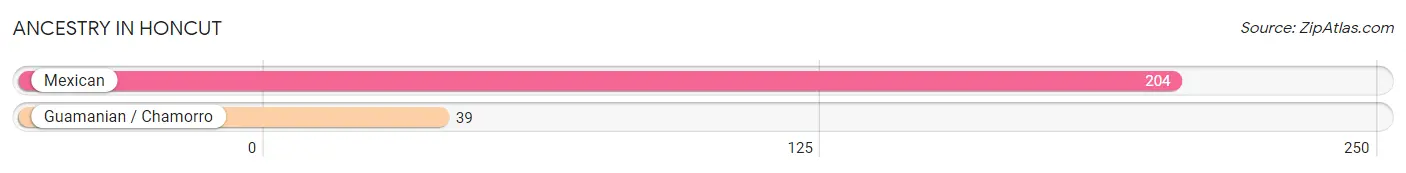
| Ancestry | # Population | % Population |
| Guamanian / Chamorro | 39 | 12.5% |
| Mexican | 204 | 65.2% | View All 2 Rows |
Immigrants in Honcut
The most numerous immigrant groups reported in Honcut came from Central America (44 | 14.1%), Latin America (44 | 14.1%), and Mexico (44 | 14.1%), together accounting for 42.2% of all Honcut residents.
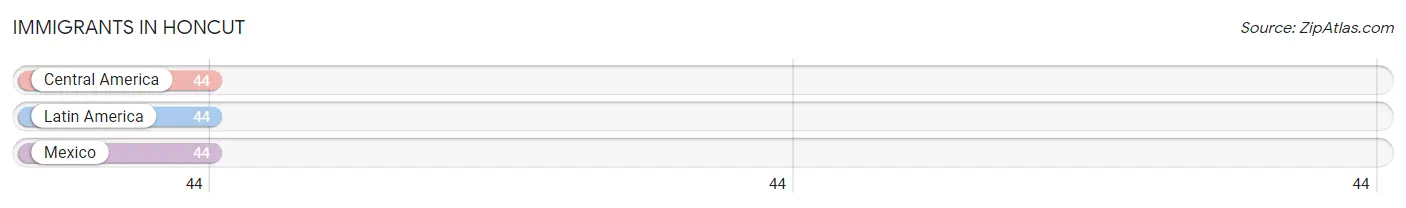
| Immigration Origin | # Population | % Population |
| Central America | 44 | 14.1% |
| Latin America | 44 | 14.1% |
| Mexico | 44 | 14.1% | View All 3 Rows |
Sex and Age in Honcut
Sex and Age in Honcut
The most populous age groups in Honcut are 45 to 49 Years (56 | 44.4%) for men and 40 to 44 Years (65 | 34.8%) for women.
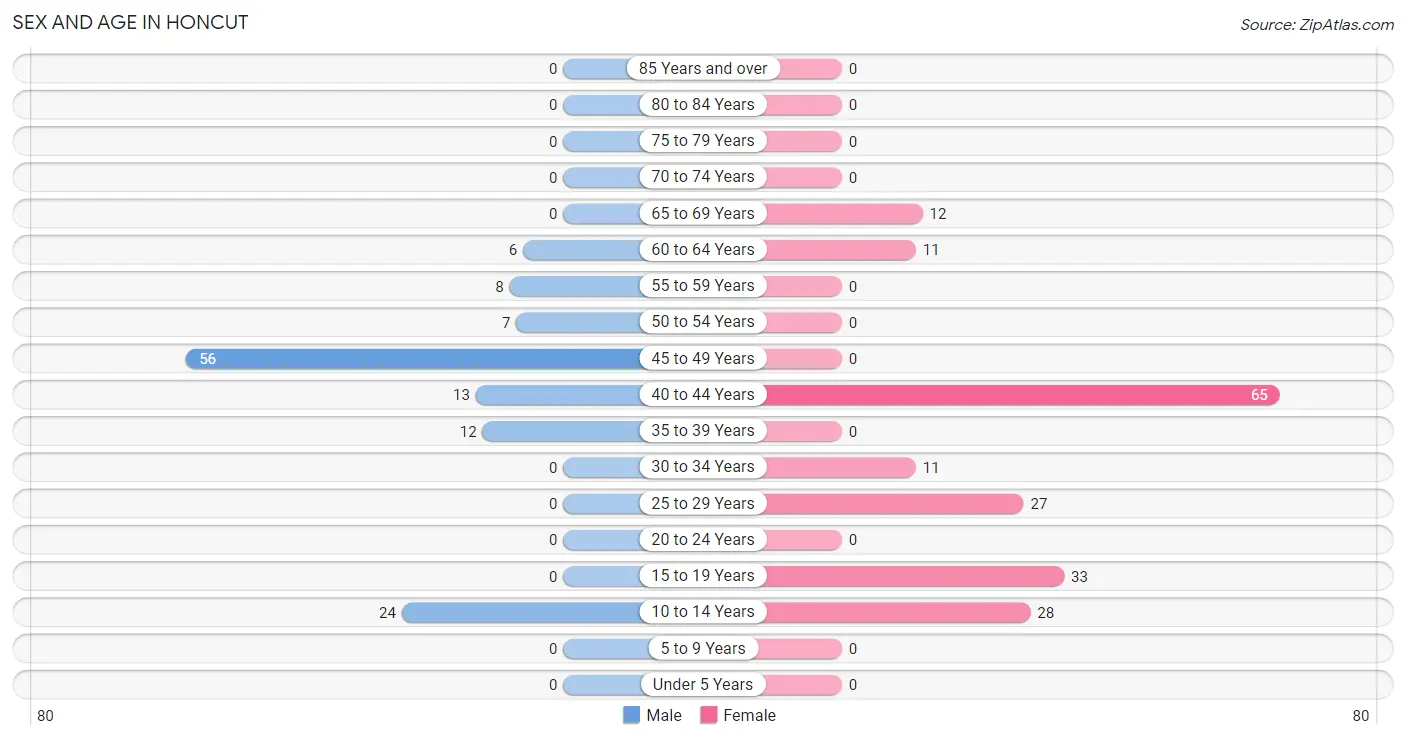
| Age Bracket | Male | Female |
| Under 5 Years | 0 (0.0%) | 0 (0.0%) |
| 5 to 9 Years | 0 (0.0%) | 0 (0.0%) |
| 10 to 14 Years | 24 (19.1%) | 28 (15.0%) |
| 15 to 19 Years | 0 (0.0%) | 33 (17.6%) |
| 20 to 24 Years | 0 (0.0%) | 0 (0.0%) |
| 25 to 29 Years | 0 (0.0%) | 27 (14.4%) |
| 30 to 34 Years | 0 (0.0%) | 11 (5.9%) |
| 35 to 39 Years | 12 (9.5%) | 0 (0.0%) |
| 40 to 44 Years | 13 (10.3%) | 65 (34.8%) |
| 45 to 49 Years | 56 (44.4%) | 0 (0.0%) |
| 50 to 54 Years | 7 (5.6%) | 0 (0.0%) |
| 55 to 59 Years | 8 (6.4%) | 0 (0.0%) |
| 60 to 64 Years | 6 (4.8%) | 11 (5.9%) |
| 65 to 69 Years | 0 (0.0%) | 12 (6.4%) |
| 70 to 74 Years | 0 (0.0%) | 0 (0.0%) |
| 75 to 79 Years | 0 (0.0%) | 0 (0.0%) |
| 80 to 84 Years | 0 (0.0%) | 0 (0.0%) |
| 85 Years and over | 0 (0.0%) | 0 (0.0%) |
| Total | 126 (100.0%) | 187 (100.0%) |
Families and Households in Honcut
Median Family Size in Honcut
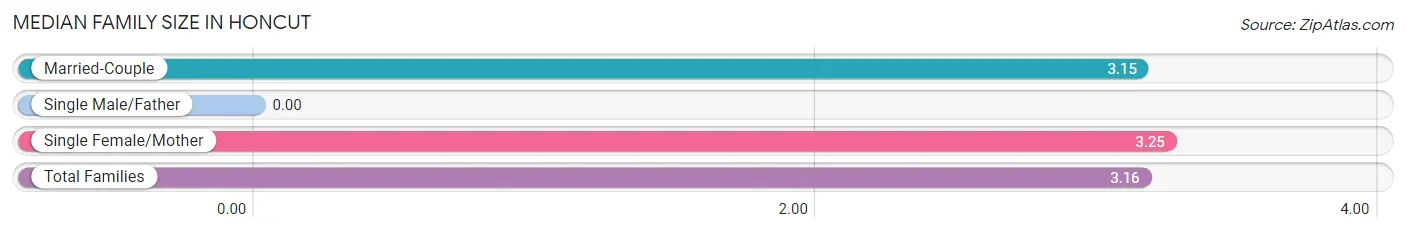
| Family Type | # Families | Family Size |
| Married-Couple | 87 (87.9%) | 3.15 |
| Single Male/Father | 0 (0.0%) | - |
| Single Female/Mother | 12 (12.1%) | 3.25 |
| Total Families | 99 (100.0%) | 3.16 |
Median Household Size in Honcut
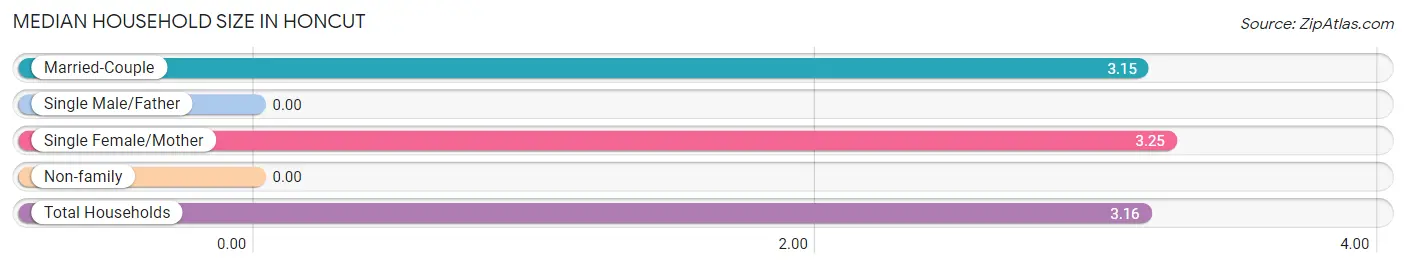
| Household Type | # Households | Household Size |
| Married-Couple | 87 (87.9%) | 3.15 |
| Single Male/Father | 0 (0.0%) | - |
| Single Female/Mother | 12 (12.1%) | 3.25 |
| Non-family | 0 (0.0%) | - |
| Total Households | 99 (100.0%) | 3.16 |
Household Size by Marriage Status in Honcut
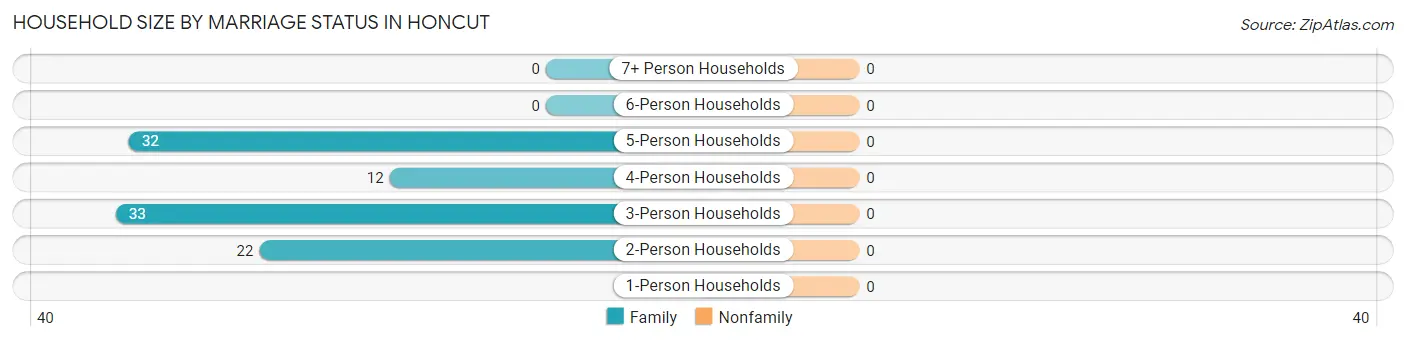
| Household Size | Family Households | Nonfamily Households |
| 1-Person Households | - | 0 (0.0%) |
| 2-Person Households | 22 (22.2%) | 0 (0.0%) |
| 3-Person Households | 33 (33.3%) | 0 (0.0%) |
| 4-Person Households | 12 (12.1%) | 0 (0.0%) |
| 5-Person Households | 32 (32.3%) | 0 (0.0%) |
| 6-Person Households | 0 (0.0%) | 0 (0.0%) |
| 7+ Person Households | 0 (0.0%) | 0 (0.0%) |
| Total | 99 (100.0%) | 0 (0.0%) |
Female Fertility in Honcut
Fertility by Age in Honcut
| Age Bracket | Women with Births | Births / 1,000 Women |
| 15 to 19 years | 0 (0.0%) | 0.0 |
| 20 to 34 years | 0 (0.0%) | 0.0 |
| 35 to 50 years | 0 (0.0%) | 0.0 |
| Total | 0 (0.0%) | 0.0 |
Fertility by Age by Marriage Status in Honcut
| Age Bracket | Married | Unmarried |
| 15 to 19 years | 0 (0.0%) | 0 (0.0%) |
| 20 to 34 years | 0 (0.0%) | 0 (0.0%) |
| 35 to 50 years | 0 (0.0%) | 0 (0.0%) |
| Total | 0 (0.0%) | 0 (0.0%) |
Fertility by Education in Honcut
| Educational Attainment | Women with Births | Births / 1,000 Women |
| Less than High School | 0 (0.0%) | 0.0 |
| High School Diploma | 0 (0.0%) | 0.0 |
| College or Associate's Degree | 0 (0.0%) | 0.0 |
| Bachelor's Degree | 0 (0.0%) | 0.0 |
| Graduate Degree | 0 (0.0%) | 0.0 |
| Total | 0 (0.0%) | 0.0 |
Fertility by Education by Marriage Status in Honcut
| Educational Attainment | Married | Unmarried |
| Less than High School | 0 (0.0%) | 0 (0.0%) |
| High School Diploma | 0 (0.0%) | 0 (0.0%) |
| College or Associate's Degree | 0 (0.0%) | 0 (0.0%) |
| Bachelor's Degree | 0 (0.0%) | 0 (0.0%) |
| Graduate Degree | 0 (0.0%) | 0 (0.0%) |
| Total | 0 (0.0%) | 0 (0.0%) |
Employment Characteristics in Honcut
Employment by Class of Employer in Honcut
Among the 48 employed individuals in Honcut, private company employees (31 | 64.6%), state government employees (11 | 22.9%), and self-employed (not incorporated) (6 | 12.5%) make up the most common classes of employment.
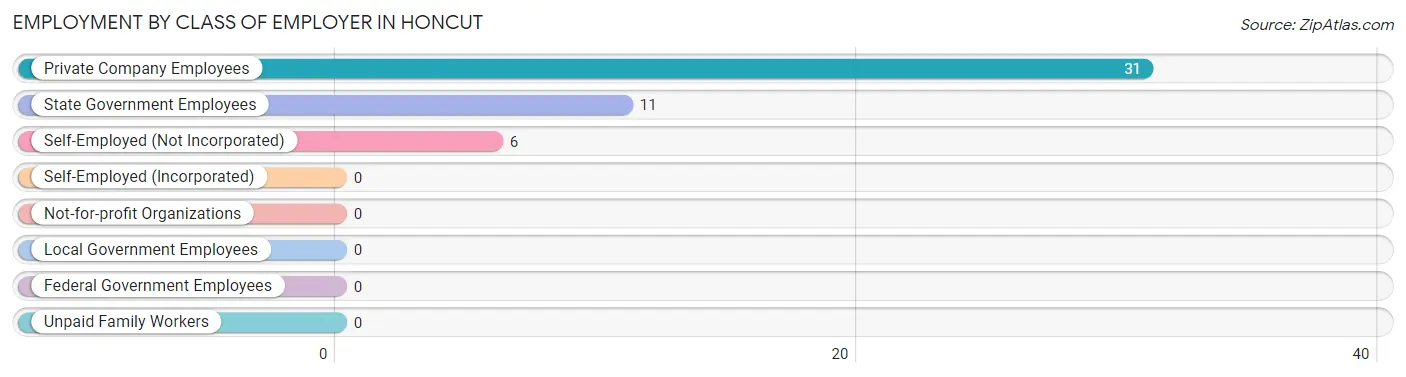
| Employer Class | # Employees | % Employees |
| Private Company Employees | 31 | 64.6% |
| Self-Employed (Incorporated) | 0 | 0.0% |
| Self-Employed (Not Incorporated) | 6 | 12.5% |
| Not-for-profit Organizations | 0 | 0.0% |
| Local Government Employees | 0 | 0.0% |
| State Government Employees | 11 | 22.9% |
| Federal Government Employees | 0 | 0.0% |
| Unpaid Family Workers | 0 | 0.0% |
| Total | 48 | 100.0% |
Employment Status by Age in Honcut
According to the labor force statistics for Honcut, out of the total population over 16 years of age (261), 31.0% or 81 individuals are in the labor force, with 40.7% or 33 of them unemployed. The age group with the highest labor force participation rate is 30 to 34 years, with 100.0% or 11 individuals in the labor force. Within the labor force, the 35 to 44 years age range has the highest percentage of unemployed individuals, with 71.7% or 33 of them being unemployed.
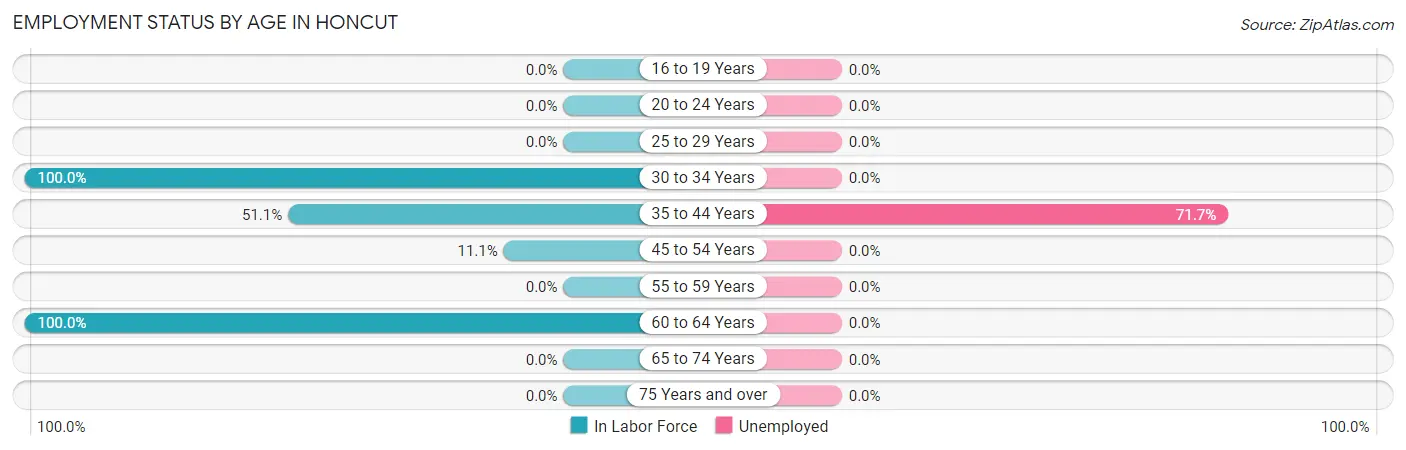
| Age Bracket | In Labor Force | Unemployed |
| 16 to 19 Years | 0 (0.0%) | 0 (0.0%) |
| 20 to 24 Years | 0 (0.0%) | 0 (0.0%) |
| 25 to 29 Years | 0 (0.0%) | 0 (0.0%) |
| 30 to 34 Years | 11 (100.0%) | 0 (0.0%) |
| 35 to 44 Years | 46 (51.1%) | 33 (71.7%) |
| 45 to 54 Years | 7 (11.1%) | 0 (0.0%) |
| 55 to 59 Years | 0 (0.0%) | 0 (0.0%) |
| 60 to 64 Years | 17 (100.0%) | 0 (0.0%) |
| 65 to 74 Years | 0 (0.0%) | 0 (0.0%) |
| 75 Years and over | 0 (0.0%) | 0 (0.0%) |
| Total | 81 (31.0%) | 33 (40.7%) |
Employment Status by Educational Attainment in Honcut
According to labor force statistics for Honcut, 37.5% of individuals (81) out of the total population between 25 and 64 years of age (216) are in the labor force, with 40.7% or 33 of them being unemployed. The group with the highest labor force participation rate are those with the educational attainment of bachelor's degree or higher, with 100.0% or 7 individuals in the labor force. Within the labor force, individuals with less than high school education have the highest percentage of unemployment, with 48.5% or 33 of them being unemployed.
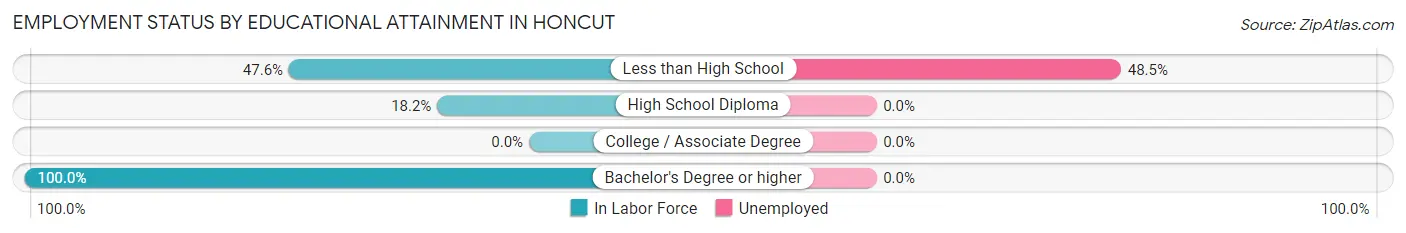
| Educational Attainment | In Labor Force | Unemployed |
| Less than High School | 68 (47.6%) | 69 (48.5%) |
| High School Diploma | 6 (18.2%) | 0 (0.0%) |
| College / Associate Degree | 0 (0.0%) | 0 (0.0%) |
| Bachelor's Degree or higher | 7 (100.0%) | 0 (0.0%) |
| Total | 81 (37.5%) | 88 (40.7%) |
Employment Occupations by Sex in Honcut
Management, Business, Science and Arts Occupations
The most common Management, Business, Science and Arts occupations in Honcut are Community & Social Service (11 | 22.9%), Education Instruction & Library (11 | 22.9%), Computers, Engineering & Science (7 | 14.6%), Architecture & Engineering (7 | 14.6%), and Management (6 | 12.5%).
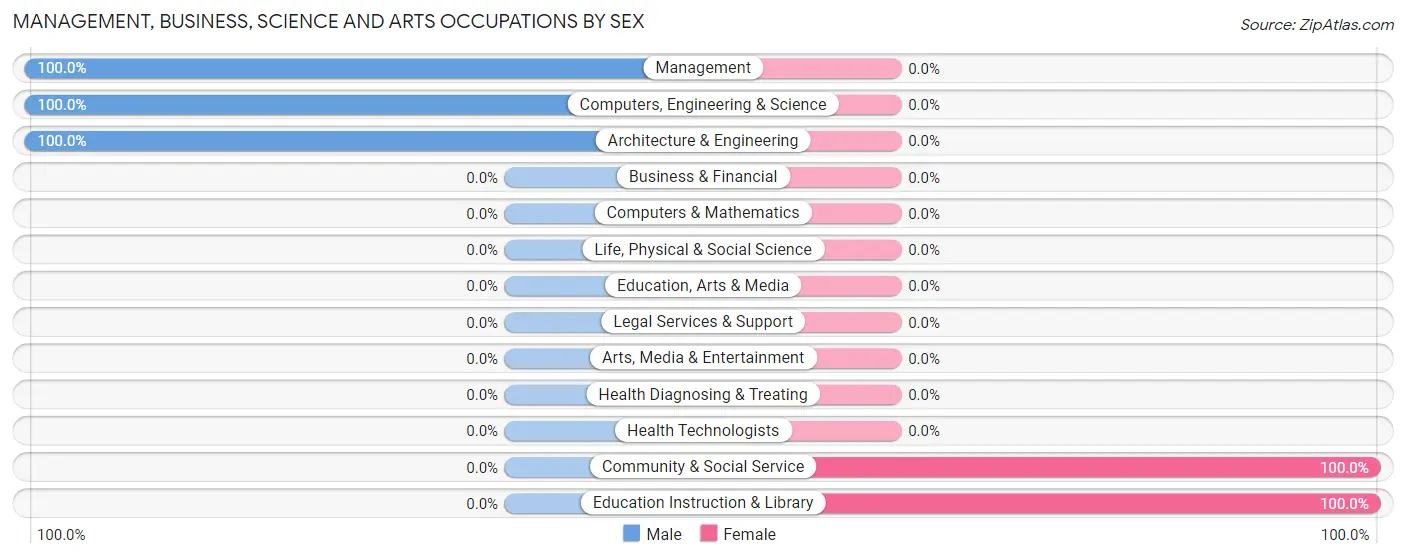
Management, Business, Science and Arts Occupations by Sex
Within the Management, Business, Science and Arts occupations in Honcut, the most male-oriented occupations are Management (100.0%), Computers, Engineering & Science (100.0%), and Architecture & Engineering (100.0%), while the most female-oriented occupations are Community & Social Service (100.0%), and Education Instruction & Library (100.0%).
| Occupation | Male | Female |
| Management | 6 (100.0%) | 0 (0.0%) |
| Business & Financial | 0 (0.0%) | 0 (0.0%) |
| Computers, Engineering & Science | 7 (100.0%) | 0 (0.0%) |
| Computers & Mathematics | 0 (0.0%) | 0 (0.0%) |
| Architecture & Engineering | 7 (100.0%) | 0 (0.0%) |
| Life, Physical & Social Science | 0 (0.0%) | 0 (0.0%) |
| Community & Social Service | 0 (0.0%) | 11 (100.0%) |
| Education, Arts & Media | 0 (0.0%) | 0 (0.0%) |
| Legal Services & Support | 0 (0.0%) | 0 (0.0%) |
| Education Instruction & Library | 0 (0.0%) | 11 (100.0%) |
| Arts, Media & Entertainment | 0 (0.0%) | 0 (0.0%) |
| Health Diagnosing & Treating | 0 (0.0%) | 0 (0.0%) |
| Health Technologists | 0 (0.0%) | 0 (0.0%) |
| Total (Category) | 13 (54.2%) | 11 (45.8%) |
| Total (Overall) | 26 (54.2%) | 22 (45.8%) |
Services Occupations
Services Occupations by Sex
| Occupation | Male | Female |
| Healthcare Support | 0 (0.0%) | 0 (0.0%) |
| Security & Protection | 0 (0.0%) | 0 (0.0%) |
| Firefighting & Prevention | 0 (0.0%) | 0 (0.0%) |
| Law Enforcement | 0 (0.0%) | 0 (0.0%) |
| Food Preparation & Serving | 0 (0.0%) | 0 (0.0%) |
| Cleaning & Maintenance | 0 (0.0%) | 0 (0.0%) |
| Personal Care & Service | 0 (0.0%) | 0 (0.0%) |
| Total (Category) | 0 (0.0%) | 0 (0.0%) |
| Total (Overall) | 26 (54.2%) | 22 (45.8%) |
Sales and Office Occupations
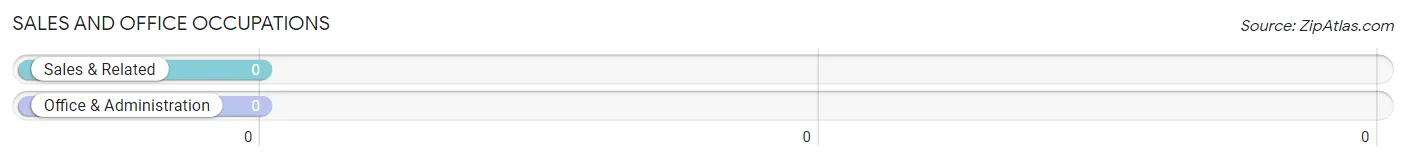
Sales and Office Occupations by Sex
| Occupation | Male | Female |
| Sales & Related | 0 (0.0%) | 0 (0.0%) |
| Office & Administration | 0 (0.0%) | 0 (0.0%) |
| Total (Category) | 0 (0.0%) | 0 (0.0%) |
| Total (Overall) | 26 (54.2%) | 22 (45.8%) |
Natural Resources, Construction and Maintenance Occupations
The most common Natural Resources, Construction and Maintenance occupations in Honcut are , and Construction & Extraction (24 | 50.0%).
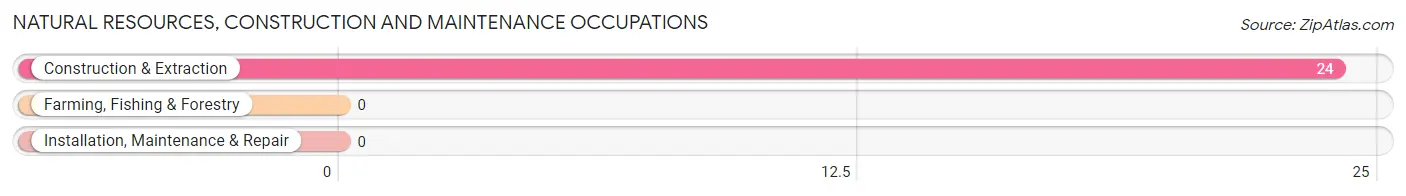
Natural Resources, Construction and Maintenance Occupations by Sex
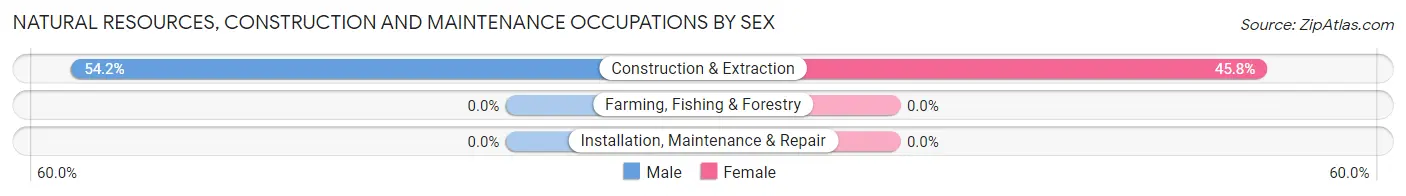
| Occupation | Male | Female |
| Farming, Fishing & Forestry | 0 (0.0%) | 0 (0.0%) |
| Construction & Extraction | 13 (54.2%) | 11 (45.8%) |
| Installation, Maintenance & Repair | 0 (0.0%) | 0 (0.0%) |
| Total (Category) | 13 (54.2%) | 11 (45.8%) |
| Total (Overall) | 26 (54.2%) | 22 (45.8%) |
Production, Transportation and Moving Occupations
Production, Transportation and Moving Occupations by Sex
| Occupation | Male | Female |
| Production | 0 (0.0%) | 0 (0.0%) |
| Transportation | 0 (0.0%) | 0 (0.0%) |
| Material Moving | 0 (0.0%) | 0 (0.0%) |
| Total (Category) | 0 (0.0%) | 0 (0.0%) |
| Total (Overall) | 26 (54.2%) | 22 (45.8%) |
Employment Industries by Sex in Honcut
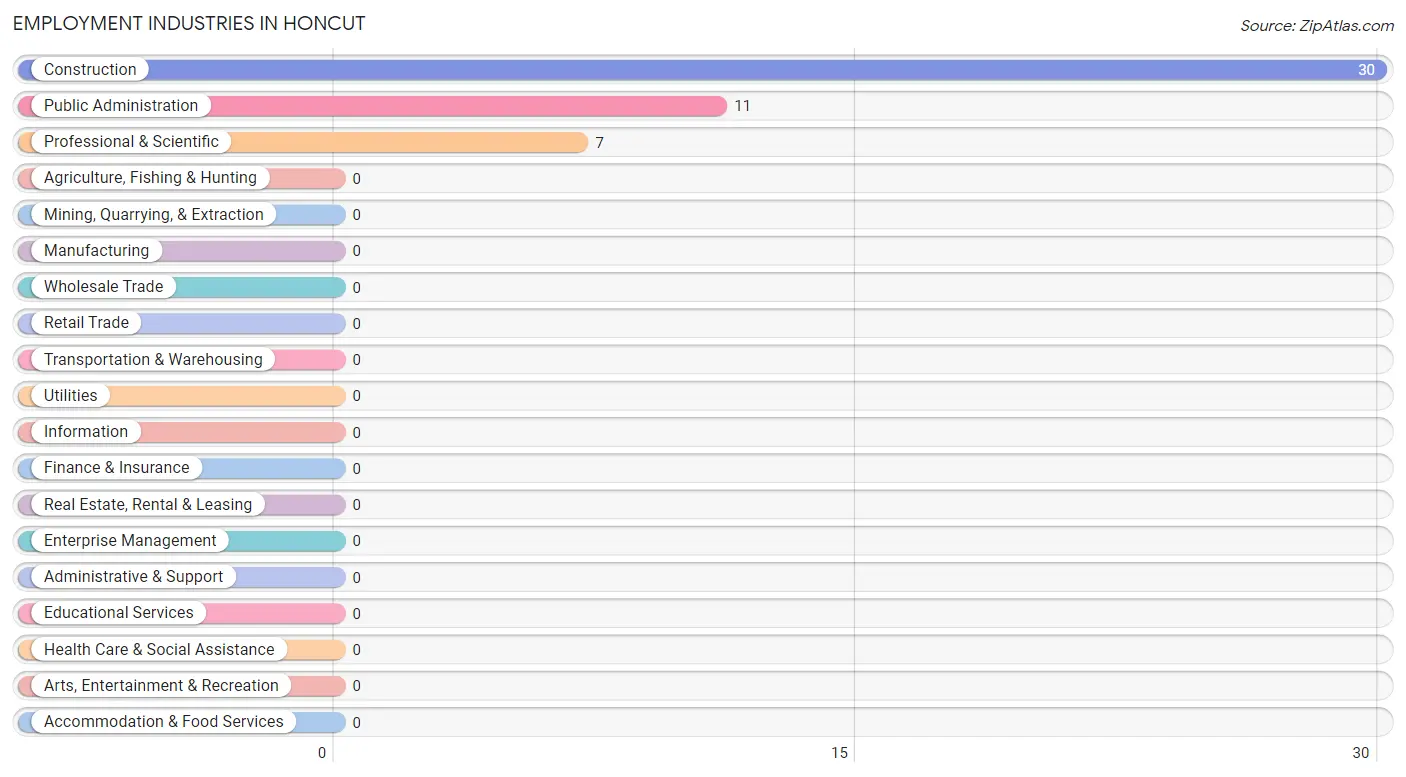
Employment Industries in Honcut
The major employment industries in Honcut include Construction (30 | 62.5%), Public Administration (11 | 22.9%), and Professional & Scientific (7 | 14.6%).
Employment Industries by Sex in Honcut
The Honcut industries that see more men than women are Professional & Scientific (100.0%), and Construction (63.3%), whereas the industries that tend to have a higher number of women are Public Administration (100.0%), and Construction (36.7%).
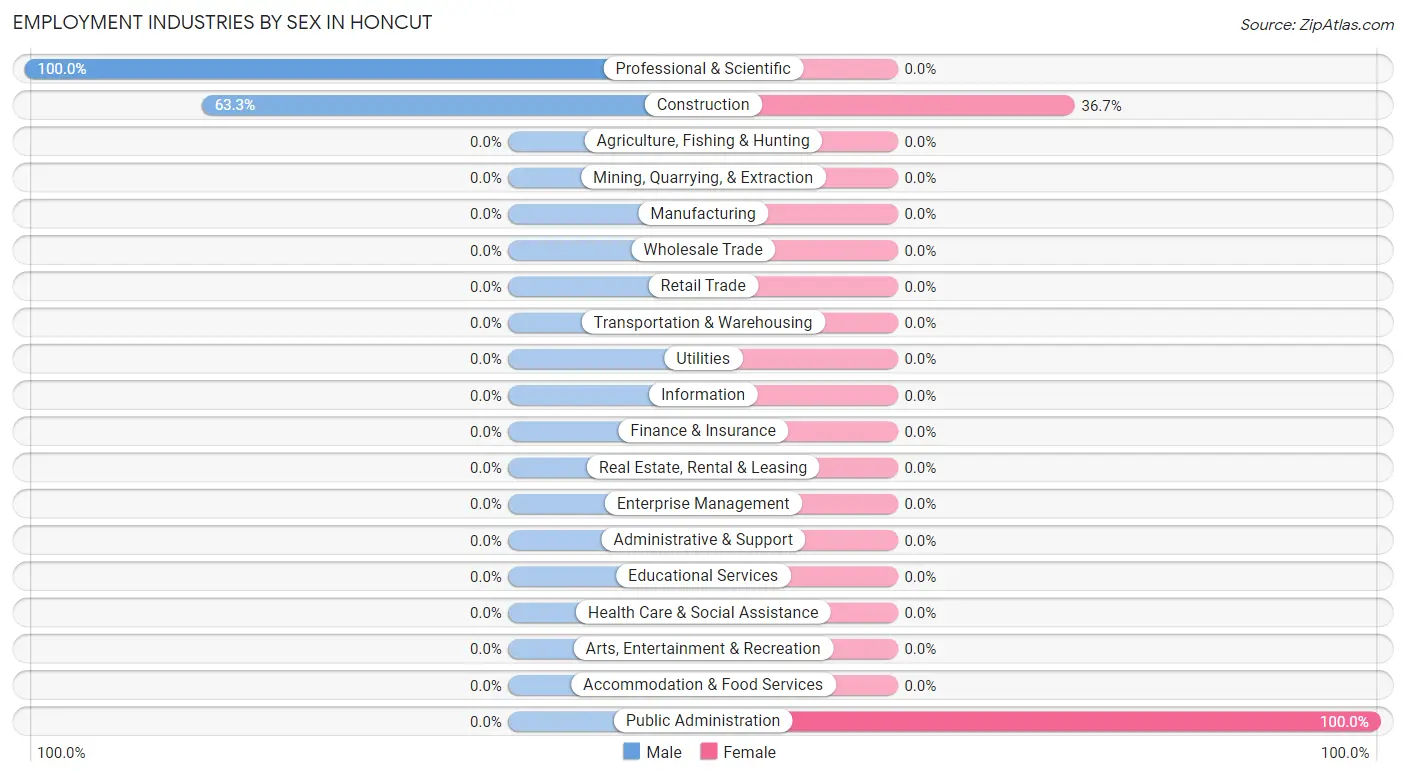
| Industry | Male | Female |
| Agriculture, Fishing & Hunting | 0 (0.0%) | 0 (0.0%) |
| Mining, Quarrying, & Extraction | 0 (0.0%) | 0 (0.0%) |
| Construction | 19 (63.3%) | 11 (36.7%) |
| Manufacturing | 0 (0.0%) | 0 (0.0%) |
| Wholesale Trade | 0 (0.0%) | 0 (0.0%) |
| Retail Trade | 0 (0.0%) | 0 (0.0%) |
| Transportation & Warehousing | 0 (0.0%) | 0 (0.0%) |
| Utilities | 0 (0.0%) | 0 (0.0%) |
| Information | 0 (0.0%) | 0 (0.0%) |
| Finance & Insurance | 0 (0.0%) | 0 (0.0%) |
| Real Estate, Rental & Leasing | 0 (0.0%) | 0 (0.0%) |
| Professional & Scientific | 7 (100.0%) | 0 (0.0%) |
| Enterprise Management | 0 (0.0%) | 0 (0.0%) |
| Administrative & Support | 0 (0.0%) | 0 (0.0%) |
| Educational Services | 0 (0.0%) | 0 (0.0%) |
| Health Care & Social Assistance | 0 (0.0%) | 0 (0.0%) |
| Arts, Entertainment & Recreation | 0 (0.0%) | 0 (0.0%) |
| Accommodation & Food Services | 0 (0.0%) | 0 (0.0%) |
| Public Administration | 0 (0.0%) | 11 (100.0%) |
| Total | 26 (54.2%) | 22 (45.8%) |
Education in Honcut
School Enrollment in Honcut
The most common levels of schooling among the 85 students in Honcut are high school (33 | 38.8%), middle school (28 | 32.9%), and elementary school (24 | 28.2%).
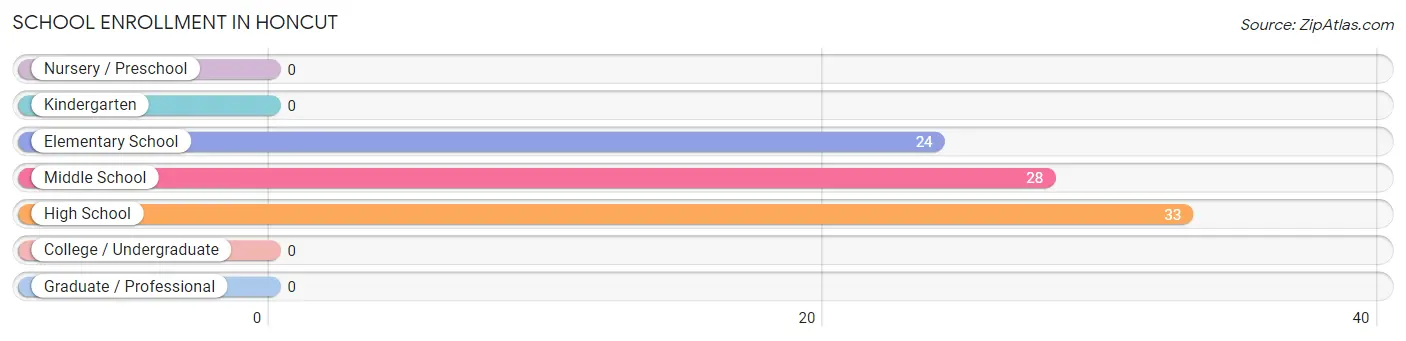
| School Level | # Students | % Students |
| Nursery / Preschool | 0 | 0.0% |
| Kindergarten | 0 | 0.0% |
| Elementary School | 24 | 28.2% |
| Middle School | 28 | 32.9% |
| High School | 33 | 38.8% |
| College / Undergraduate | 0 | 0.0% |
| Graduate / Professional | 0 | 0.0% |
| Total | 85 | 100.0% |
School Enrollment by Age by Funding Source in Honcut
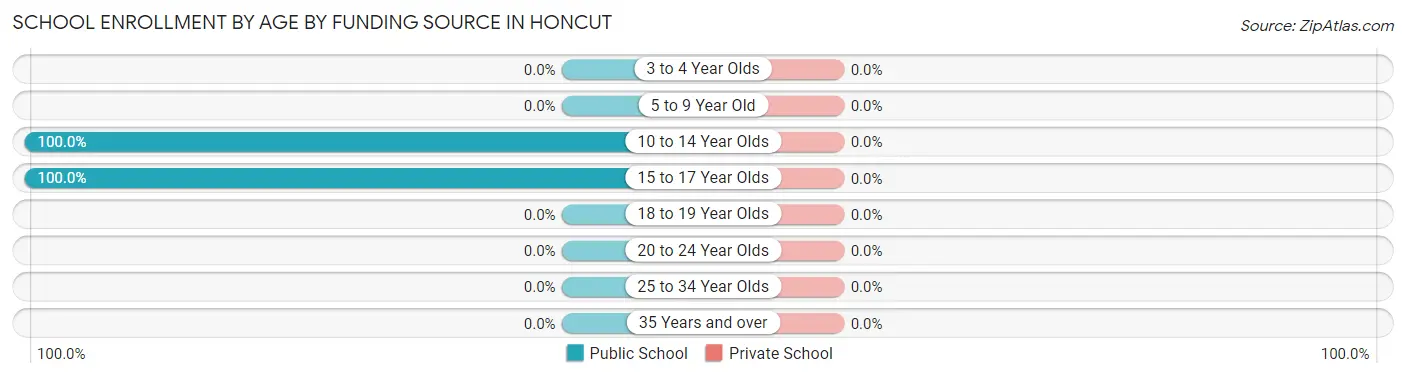
| Age Bracket | Public School | Private School |
| 3 to 4 Year Olds | 0 (0.0%) | 0 (0.0%) |
| 5 to 9 Year Old | 0 (0.0%) | 0 (0.0%) |
| 10 to 14 Year Olds | 52 (100.0%) | 0 (0.0%) |
| 15 to 17 Year Olds | 33 (100.0%) | 0 (0.0%) |
| 18 to 19 Year Olds | 0 (0.0%) | 0 (0.0%) |
| 20 to 24 Year Olds | 0 (0.0%) | 0 (0.0%) |
| 25 to 34 Year Olds | 0 (0.0%) | 0 (0.0%) |
| 35 Years and over | 0 (0.0%) | 0 (0.0%) |
| Total | 85 (100.0%) | 0 (0.0%) |
Educational Attainment by Field of Study in Honcut
Psychology (12 | 63.2%), and engineering (7 | 36.8%) are the most common fields of study among 19 individuals in Honcut who have obtained a bachelor's degree or higher.
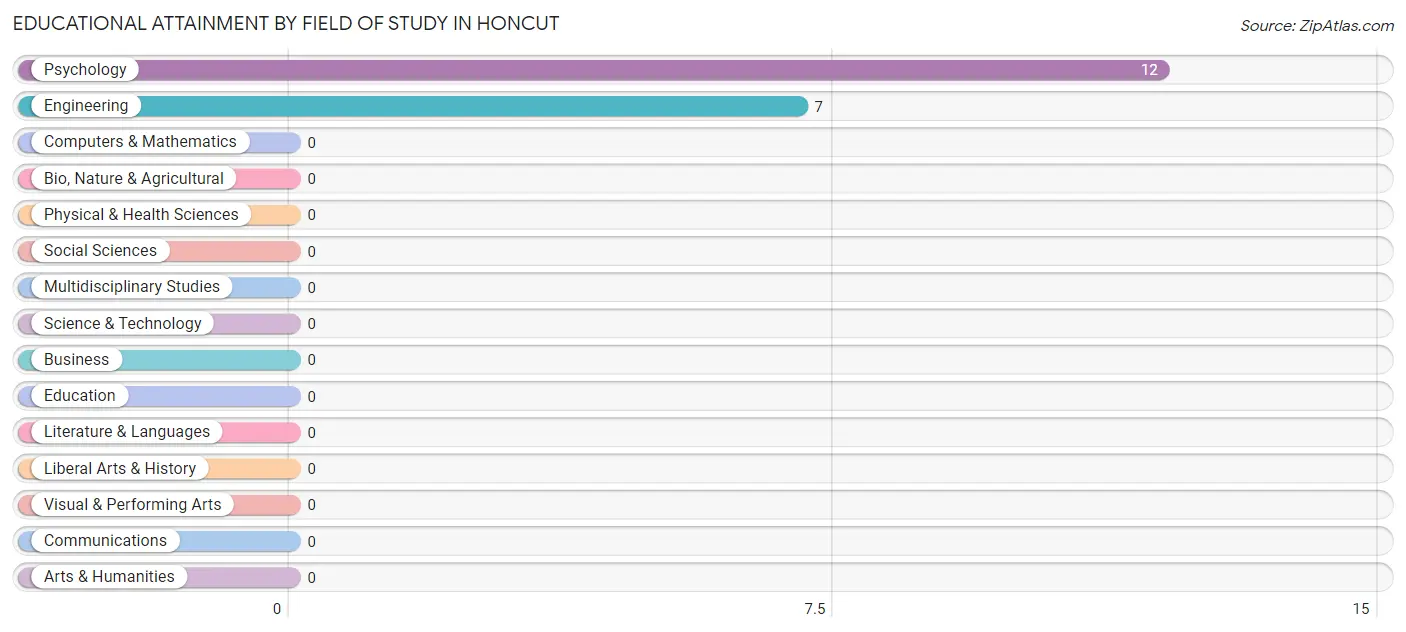
| Field of Study | # Graduates | % Graduates |
| Computers & Mathematics | 0 | 0.0% |
| Bio, Nature & Agricultural | 0 | 0.0% |
| Physical & Health Sciences | 0 | 0.0% |
| Psychology | 12 | 63.2% |
| Social Sciences | 0 | 0.0% |
| Engineering | 7 | 36.8% |
| Multidisciplinary Studies | 0 | 0.0% |
| Science & Technology | 0 | 0.0% |
| Business | 0 | 0.0% |
| Education | 0 | 0.0% |
| Literature & Languages | 0 | 0.0% |
| Liberal Arts & History | 0 | 0.0% |
| Visual & Performing Arts | 0 | 0.0% |
| Communications | 0 | 0.0% |
| Arts & Humanities | 0 | 0.0% |
| Total | 19 | 100.0% |
Transportation & Commute in Honcut
Vehicle Availability by Sex in Honcut
The most prevalent vehicle ownership categories in Honcut are males with 4 vehicles (19, accounting for 73.1%) and females with 4 vehicles (22, making up 86.4%).
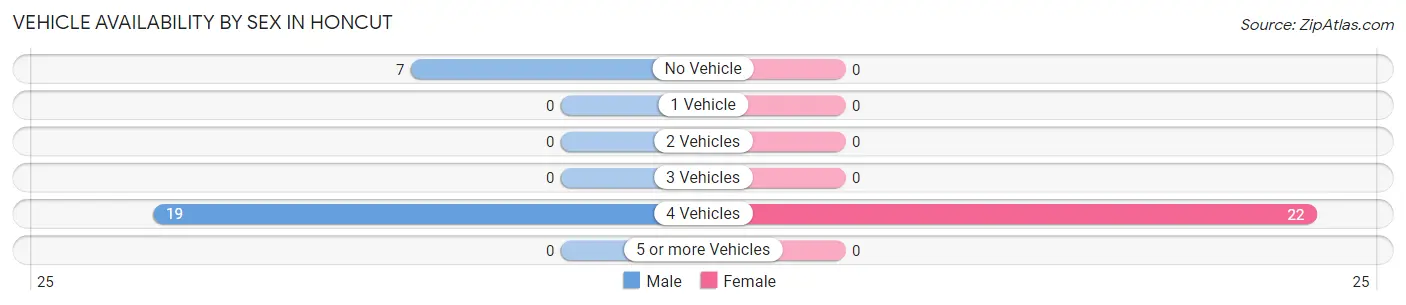
| Vehicles Available | Male | Female |
| No Vehicle | 7 (26.9%) | 0 (0.0%) |
| 1 Vehicle | 0 (0.0%) | 0 (0.0%) |
| 2 Vehicles | 0 (0.0%) | 0 (0.0%) |
| 3 Vehicles | 0 (0.0%) | 0 (0.0%) |
| 4 Vehicles | 19 (73.1%) | 22 (100.0%) |
| 5 or more Vehicles | 0 (0.0%) | 0 (0.0%) |
| Total | 26 (100.0%) | 22 (100.0%) |
Commute Time in Honcut
The most frequently occuring commute durations in Honcut are 60 to 89 minutes (24 commuters, 77.4%), 45 to 59 minutes (7 commuters, 22.6%), and less than 5 minutes (0 commuters, 0.0%).
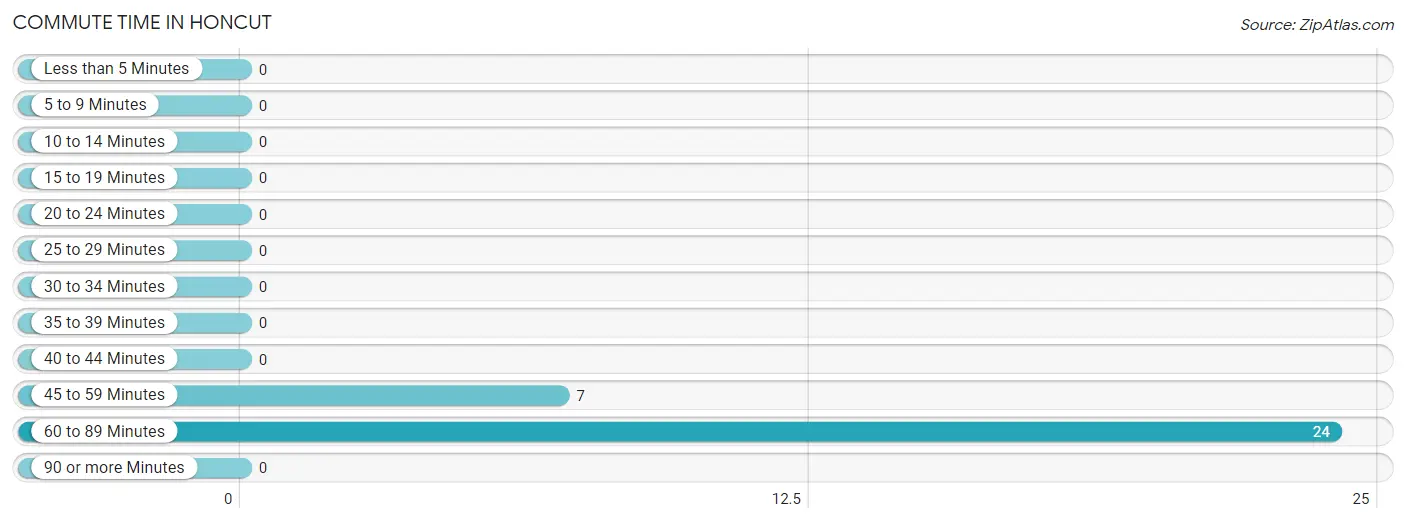
| Commute Time | # Commuters | % Commuters |
| Less than 5 Minutes | 0 | 0.0% |
| 5 to 9 Minutes | 0 | 0.0% |
| 10 to 14 Minutes | 0 | 0.0% |
| 15 to 19 Minutes | 0 | 0.0% |
| 20 to 24 Minutes | 0 | 0.0% |
| 25 to 29 Minutes | 0 | 0.0% |
| 30 to 34 Minutes | 0 | 0.0% |
| 35 to 39 Minutes | 0 | 0.0% |
| 40 to 44 Minutes | 0 | 0.0% |
| 45 to 59 Minutes | 7 | 22.6% |
| 60 to 89 Minutes | 24 | 77.4% |
| 90 or more Minutes | 0 | 0.0% |
Commute Time by Sex in Honcut
The most common commute times in Honcut are 60 to 89 minutes (13 commuters, 65.0%) for males and 60 to 89 minutes (11 commuters, 100.0%) for females.
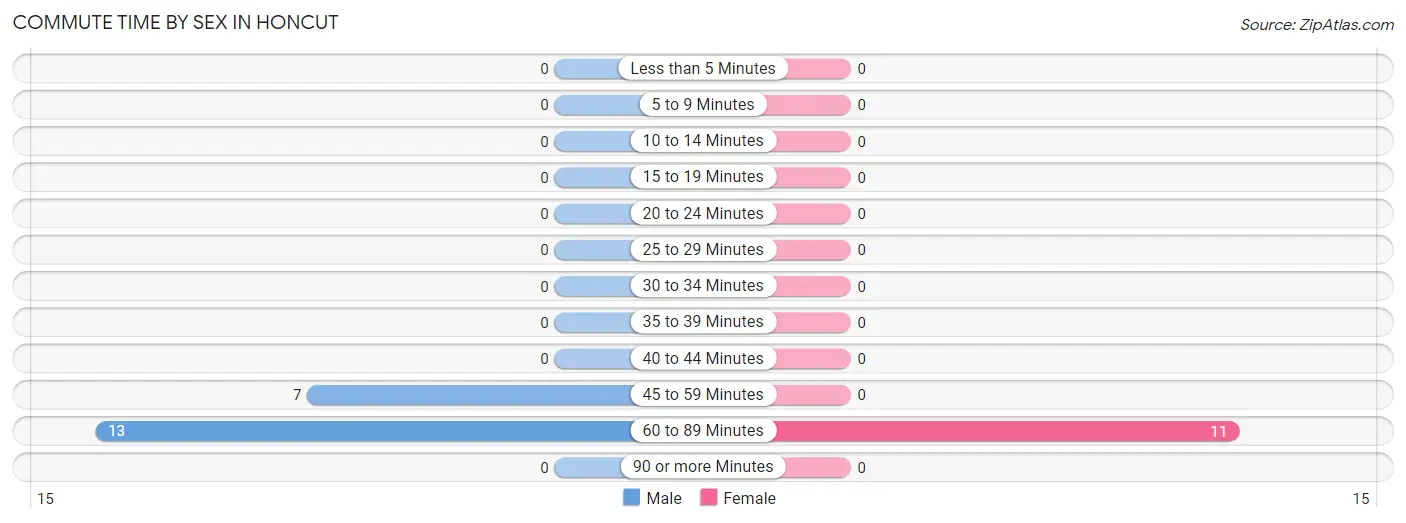
| Commute Time | Male | Female |
| Less than 5 Minutes | 0 (0.0%) | 0 (0.0%) |
| 5 to 9 Minutes | 0 (0.0%) | 0 (0.0%) |
| 10 to 14 Minutes | 0 (0.0%) | 0 (0.0%) |
| 15 to 19 Minutes | 0 (0.0%) | 0 (0.0%) |
| 20 to 24 Minutes | 0 (0.0%) | 0 (0.0%) |
| 25 to 29 Minutes | 0 (0.0%) | 0 (0.0%) |
| 30 to 34 Minutes | 0 (0.0%) | 0 (0.0%) |
| 35 to 39 Minutes | 0 (0.0%) | 0 (0.0%) |
| 40 to 44 Minutes | 0 (0.0%) | 0 (0.0%) |
| 45 to 59 Minutes | 7 (35.0%) | 0 (0.0%) |
| 60 to 89 Minutes | 13 (65.0%) | 11 (100.0%) |
| 90 or more Minutes | 0 (0.0%) | 0 (0.0%) |
Time of Departure to Work by Sex in Honcut
The most frequent times of departure to work in Honcut are 12:00 AM to 4:59 AM (13, 65.0%) for males and 5:00 AM to 5:29 AM (11, 100.0%) for females.
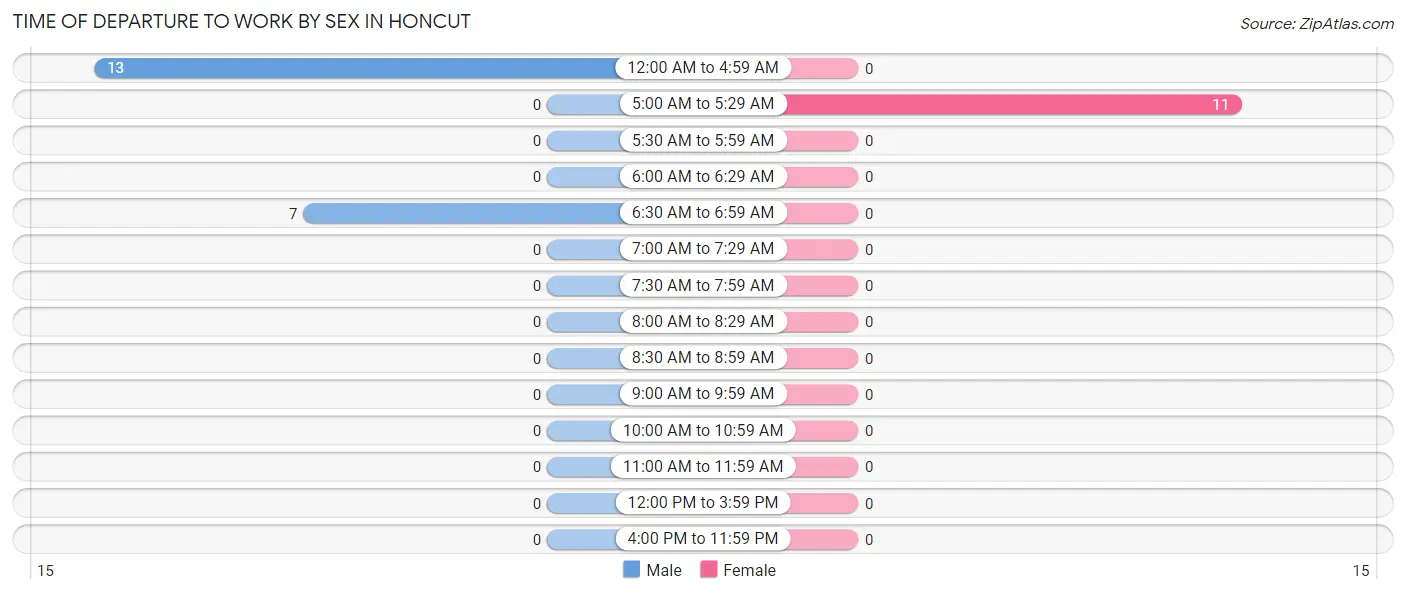
| Time of Departure | Male | Female |
| 12:00 AM to 4:59 AM | 13 (65.0%) | 0 (0.0%) |
| 5:00 AM to 5:29 AM | 0 (0.0%) | 11 (100.0%) |
| 5:30 AM to 5:59 AM | 0 (0.0%) | 0 (0.0%) |
| 6:00 AM to 6:29 AM | 0 (0.0%) | 0 (0.0%) |
| 6:30 AM to 6:59 AM | 7 (35.0%) | 0 (0.0%) |
| 7:00 AM to 7:29 AM | 0 (0.0%) | 0 (0.0%) |
| 7:30 AM to 7:59 AM | 0 (0.0%) | 0 (0.0%) |
| 8:00 AM to 8:29 AM | 0 (0.0%) | 0 (0.0%) |
| 8:30 AM to 8:59 AM | 0 (0.0%) | 0 (0.0%) |
| 9:00 AM to 9:59 AM | 0 (0.0%) | 0 (0.0%) |
| 10:00 AM to 10:59 AM | 0 (0.0%) | 0 (0.0%) |
| 11:00 AM to 11:59 AM | 0 (0.0%) | 0 (0.0%) |
| 12:00 PM to 3:59 PM | 0 (0.0%) | 0 (0.0%) |
| 4:00 PM to 11:59 PM | 0 (0.0%) | 0 (0.0%) |
| Total | 20 (100.0%) | 11 (100.0%) |
Housing Occupancy in Honcut
Occupancy by Ownership in Honcut
Of the total 99 dwellings in Honcut, owner-occupied units account for 44 (44.4%), while renter-occupied units make up 55 (55.6%).
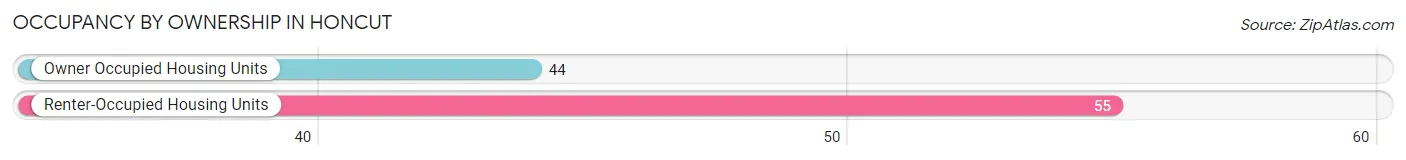
| Occupancy | # Housing Units | % Housing Units |
| Owner Occupied Housing Units | 44 | 44.4% |
| Renter-Occupied Housing Units | 55 | 55.6% |
| Total Occupied Housing Units | 99 | 100.0% |
Occupancy by Household Size in Honcut
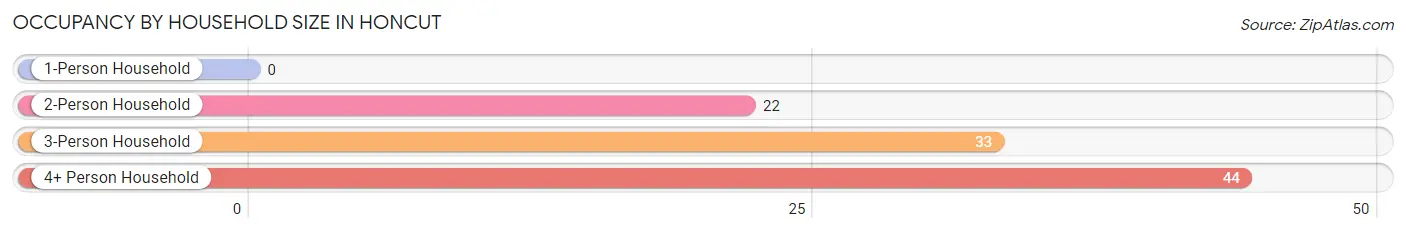
| Household Size | # Housing Units | % Housing Units |
| 1-Person Household | 0 | 0.0% |
| 2-Person Household | 22 | 22.2% |
| 3-Person Household | 33 | 33.3% |
| 4+ Person Household | 44 | 44.4% |
| Total Housing Units | 99 | 100.0% |
Occupancy by Ownership by Household Size in Honcut
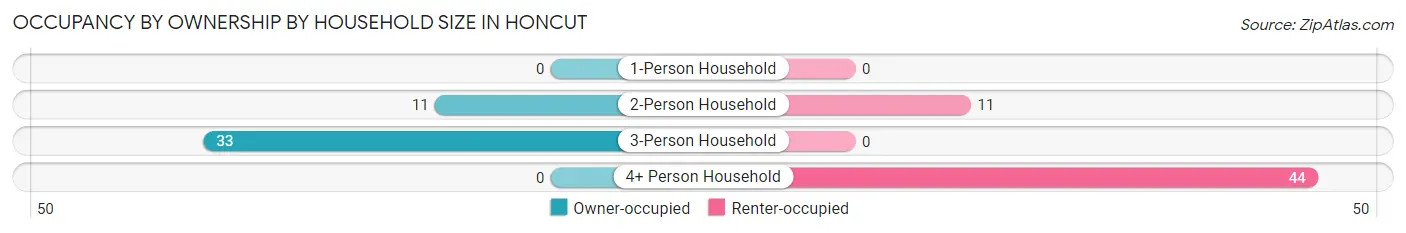
| Household Size | Owner-occupied | Renter-occupied |
| 1-Person Household | 0 (0.0%) | 0 (0.0%) |
| 2-Person Household | 11 (50.0%) | 11 (50.0%) |
| 3-Person Household | 33 (100.0%) | 0 (0.0%) |
| 4+ Person Household | 0 (0.0%) | 44 (100.0%) |
| Total Housing Units | 44 (44.4%) | 55 (55.6%) |
Occupancy by Educational Attainment in Honcut
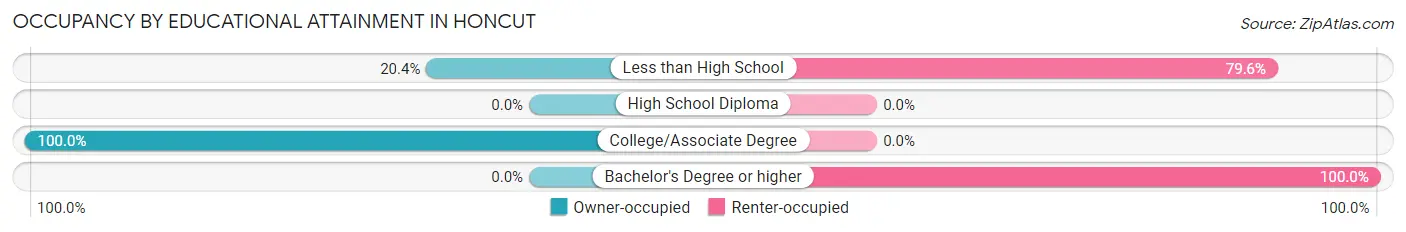
| Household Size | Owner-occupied | Renter-occupied |
| Less than High School | 11 (20.4%) | 43 (79.6%) |
| High School Diploma | 0 (0.0%) | 0 (0.0%) |
| College/Associate Degree | 33 (100.0%) | 0 (0.0%) |
| Bachelor's Degree or higher | 0 (0.0%) | 12 (100.0%) |
Occupancy by Age of Householder in Honcut
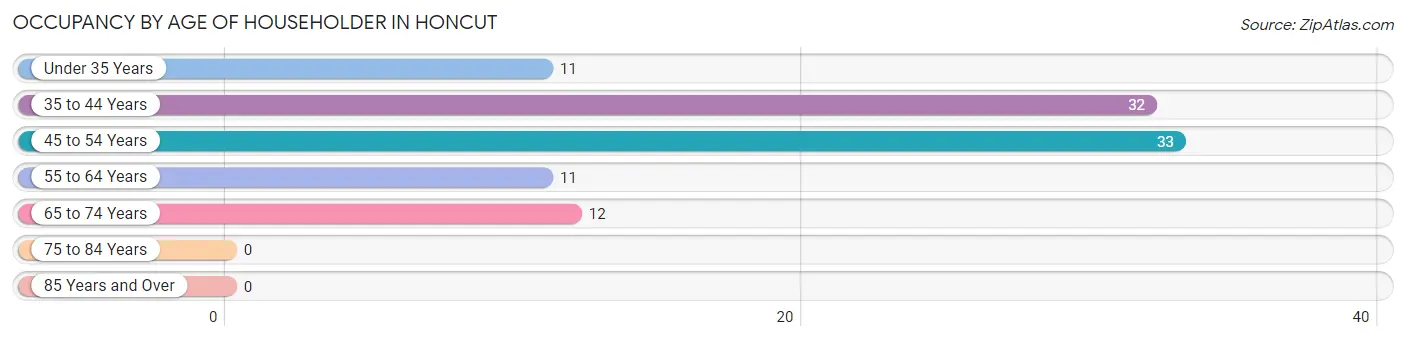
| Age Bracket | # Households | % Households |
| Under 35 Years | 11 | 11.1% |
| 35 to 44 Years | 32 | 32.3% |
| 45 to 54 Years | 33 | 33.3% |
| 55 to 64 Years | 11 | 11.1% |
| 65 to 74 Years | 12 | 12.1% |
| 75 to 84 Years | 0 | 0.0% |
| 85 Years and Over | 0 | 0.0% |
| Total | 99 | 100.0% |
Housing Finances in Honcut
Median Income by Occupancy in Honcut
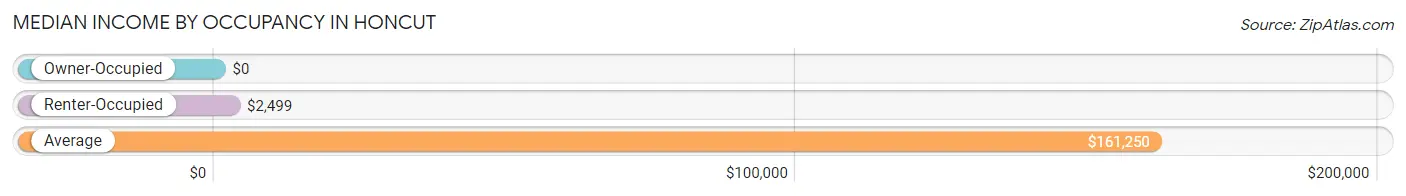
| Occupancy Type | # Households | Median Income |
| Owner-Occupied | 44 (44.4%) | $0 |
| Renter-Occupied | 55 (55.6%) | $2,499 |
| Average | 99 (100.0%) | $161,250 |
Occupancy by Householder Income Bracket in Honcut
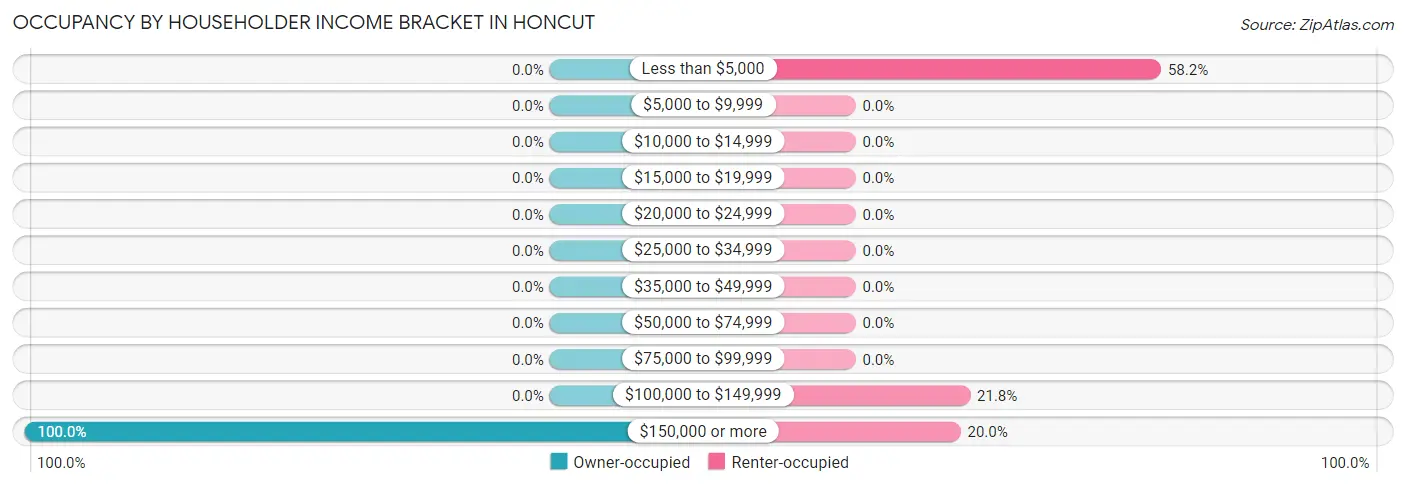
| Income Bracket | Owner-occupied | Renter-occupied |
| Less than $5,000 | 0 (0.0%) | 32 (58.2%) |
| $5,000 to $9,999 | 0 (0.0%) | 0 (0.0%) |
| $10,000 to $14,999 | 0 (0.0%) | 0 (0.0%) |
| $15,000 to $19,999 | 0 (0.0%) | 0 (0.0%) |
| $20,000 to $24,999 | 0 (0.0%) | 0 (0.0%) |
| $25,000 to $34,999 | 0 (0.0%) | 0 (0.0%) |
| $35,000 to $49,999 | 0 (0.0%) | 0 (0.0%) |
| $50,000 to $74,999 | 0 (0.0%) | 0 (0.0%) |
| $75,000 to $99,999 | 0 (0.0%) | 0 (0.0%) |
| $100,000 to $149,999 | 0 (0.0%) | 12 (21.8%) |
| $150,000 or more | 44 (100.0%) | 11 (20.0%) |
| Total | 44 (100.0%) | 55 (100.0%) |
Monthly Housing Cost Tiers in Honcut
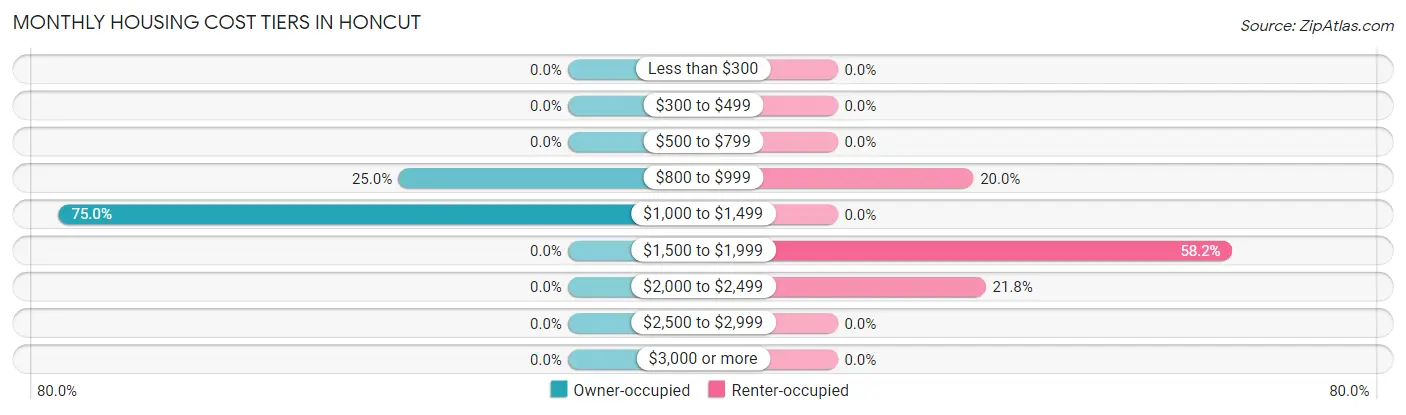
| Monthly Cost | Owner-occupied | Renter-occupied |
| Less than $300 | 0 (0.0%) | 0 (0.0%) |
| $300 to $499 | 0 (0.0%) | 0 (0.0%) |
| $500 to $799 | 0 (0.0%) | 0 (0.0%) |
| $800 to $999 | 11 (25.0%) | 11 (20.0%) |
| $1,000 to $1,499 | 33 (75.0%) | 0 (0.0%) |
| $1,500 to $1,999 | 0 (0.0%) | 32 (58.2%) |
| $2,000 to $2,499 | 0 (0.0%) | 12 (21.8%) |
| $2,500 to $2,999 | 0 (0.0%) | 0 (0.0%) |
| $3,000 or more | 0 (0.0%) | 0 (0.0%) |
| Total | 44 (100.0%) | 55 (100.0%) |
Physical Housing Characteristics in Honcut
Housing Structures in Honcut
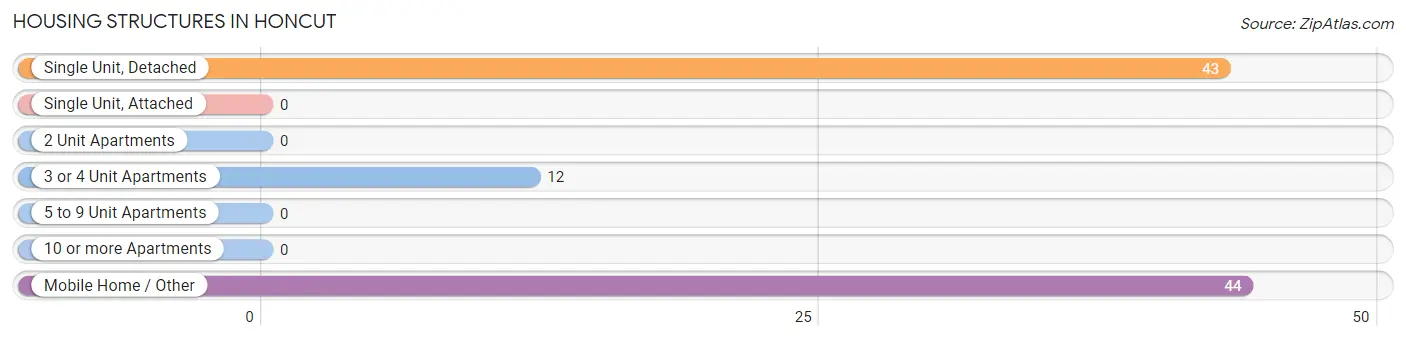
| Structure Type | # Housing Units | % Housing Units |
| Single Unit, Detached | 43 | 43.4% |
| Single Unit, Attached | 0 | 0.0% |
| 2 Unit Apartments | 0 | 0.0% |
| 3 or 4 Unit Apartments | 12 | 12.1% |
| 5 to 9 Unit Apartments | 0 | 0.0% |
| 10 or more Apartments | 0 | 0.0% |
| Mobile Home / Other | 44 | 44.4% |
| Total | 99 | 100.0% |
Housing Structures by Occupancy in Honcut
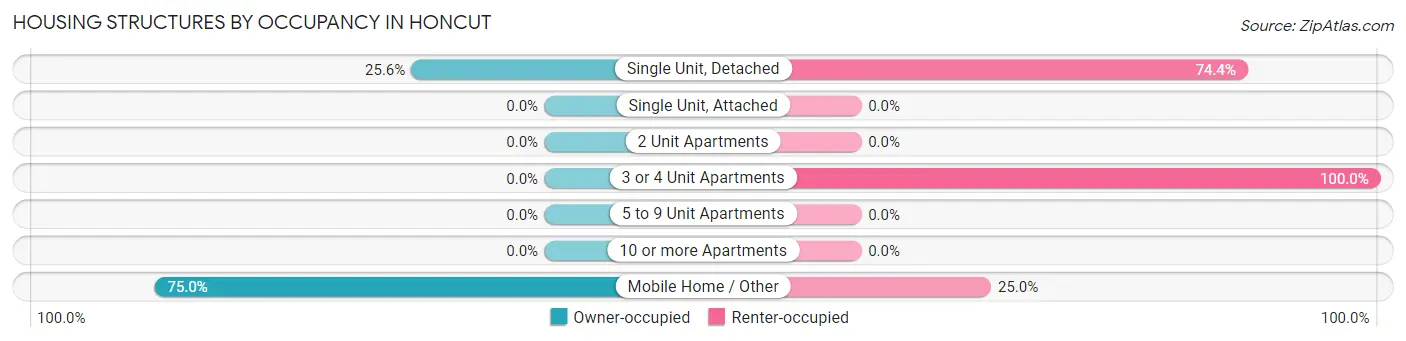
| Structure Type | Owner-occupied | Renter-occupied |
| Single Unit, Detached | 11 (25.6%) | 32 (74.4%) |
| Single Unit, Attached | 0 (0.0%) | 0 (0.0%) |
| 2 Unit Apartments | 0 (0.0%) | 0 (0.0%) |
| 3 or 4 Unit Apartments | 0 (0.0%) | 12 (100.0%) |
| 5 to 9 Unit Apartments | 0 (0.0%) | 0 (0.0%) |
| 10 or more Apartments | 0 (0.0%) | 0 (0.0%) |
| Mobile Home / Other | 33 (75.0%) | 11 (25.0%) |
| Total | 44 (44.4%) | 55 (55.6%) |
Housing Structures by Number of Rooms in Honcut
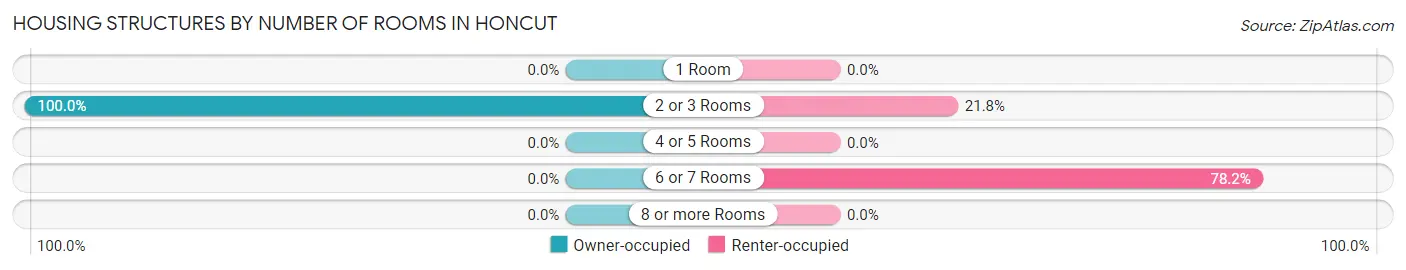
| Number of Rooms | Owner-occupied | Renter-occupied |
| 1 Room | 0 (0.0%) | 0 (0.0%) |
| 2 or 3 Rooms | 44 (100.0%) | 12 (21.8%) |
| 4 or 5 Rooms | 0 (0.0%) | 0 (0.0%) |
| 6 or 7 Rooms | 0 (0.0%) | 43 (78.2%) |
| 8 or more Rooms | 0 (0.0%) | 0 (0.0%) |
| Total | 44 (100.0%) | 55 (100.0%) |
Housing Structure by Heating Type in Honcut
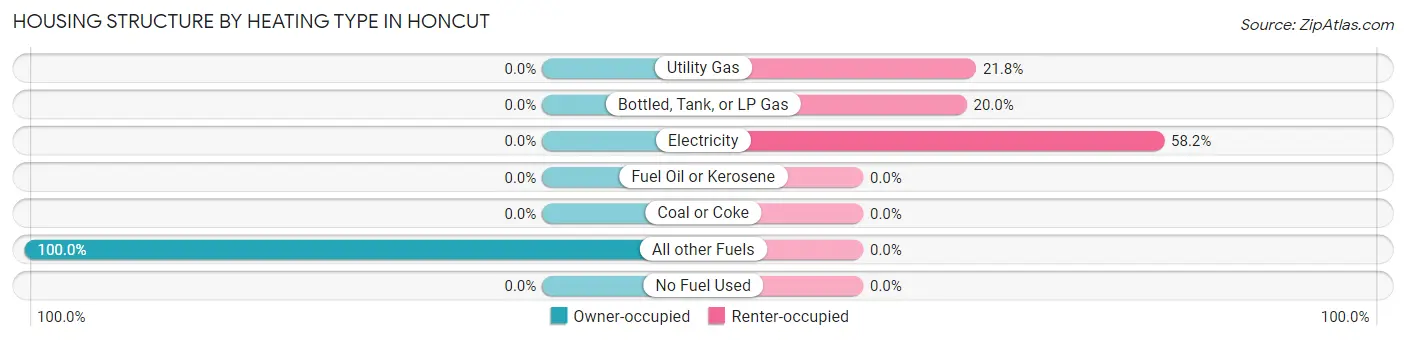
| Heating Type | Owner-occupied | Renter-occupied |
| Utility Gas | 0 (0.0%) | 12 (21.8%) |
| Bottled, Tank, or LP Gas | 0 (0.0%) | 11 (20.0%) |
| Electricity | 0 (0.0%) | 32 (58.2%) |
| Fuel Oil or Kerosene | 0 (0.0%) | 0 (0.0%) |
| Coal or Coke | 0 (0.0%) | 0 (0.0%) |
| All other Fuels | 44 (100.0%) | 0 (0.0%) |
| No Fuel Used | 0 (0.0%) | 0 (0.0%) |
| Total | 44 (100.0%) | 55 (100.0%) |
Household Vehicle Usage in Honcut
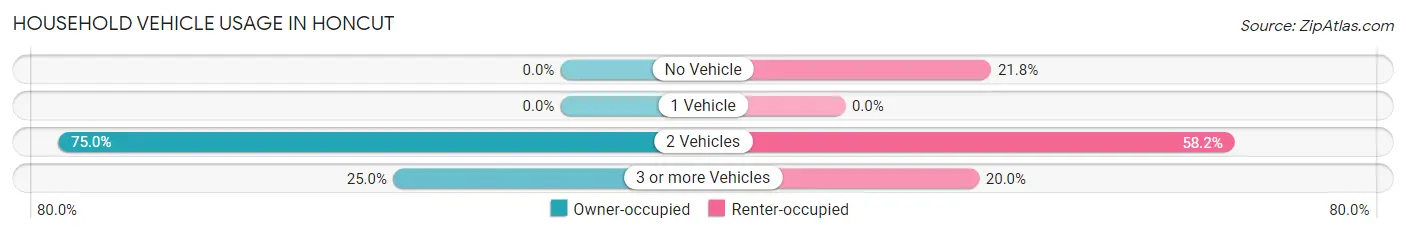
| Vehicles per Household | Owner-occupied | Renter-occupied |
| No Vehicle | 0 (0.0%) | 12 (21.8%) |
| 1 Vehicle | 0 (0.0%) | 0 (0.0%) |
| 2 Vehicles | 33 (75.0%) | 32 (58.2%) |
| 3 or more Vehicles | 11 (25.0%) | 11 (20.0%) |
| Total | 44 (100.0%) | 55 (100.0%) |
Real Estate & Mortgages in Honcut
Real Estate and Mortgage Overview in Honcut
| Characteristic | Without Mortgage | With Mortgage |
| Housing Units | 44 | 0 |
| Median Property Value | - | - |
| Median Household Income | - | - |
| Monthly Housing Costs | - | - |
| Real Estate Taxes | - | - |
Property Value by Mortgage Status in Honcut
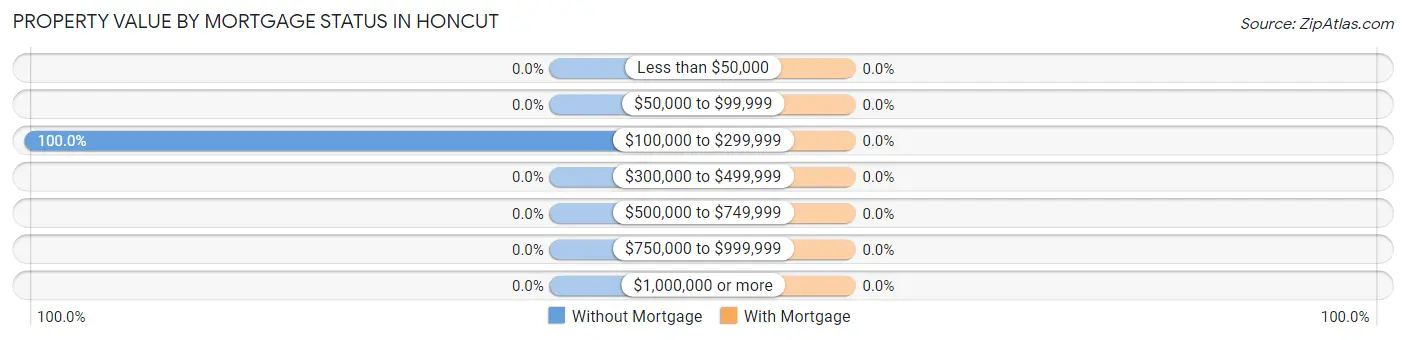
| Property Value | Without Mortgage | With Mortgage |
| Less than $50,000 | 0 (0.0%) | 0 (0.0%) |
| $50,000 to $99,999 | 0 (0.0%) | 0 (0.0%) |
| $100,000 to $299,999 | 44 (100.0%) | 0 (0.0%) |
| $300,000 to $499,999 | 0 (0.0%) | 0 (0.0%) |
| $500,000 to $749,999 | 0 (0.0%) | 0 (0.0%) |
| $750,000 to $999,999 | 0 (0.0%) | 0 (0.0%) |
| $1,000,000 or more | 0 (0.0%) | 0 (0.0%) |
| Total | 44 (100.0%) | 0 (0.0%) |
Household Income by Mortgage Status in Honcut
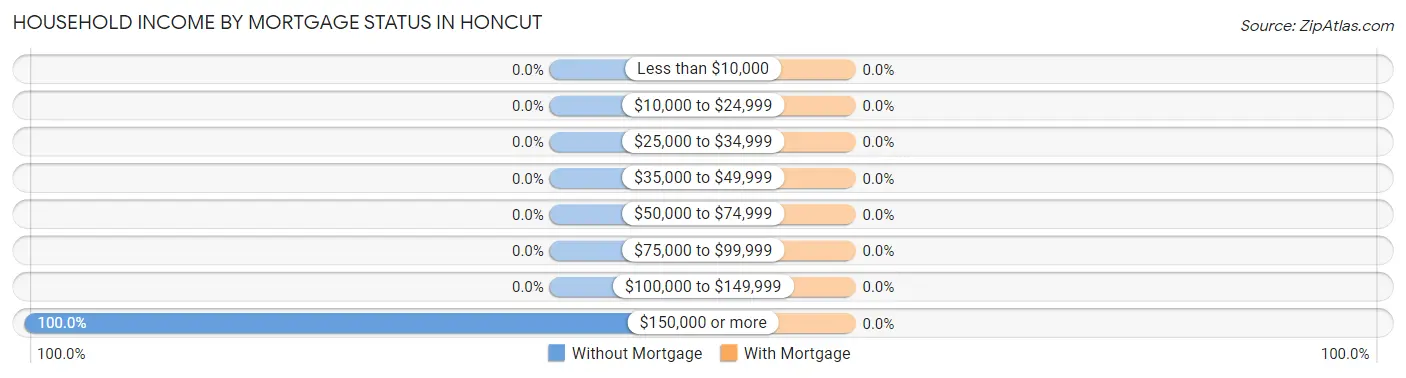
| Household Income | Without Mortgage | With Mortgage |
| Less than $10,000 | 0 (0.0%) | 0 (0.0%) |
| $10,000 to $24,999 | 0 (0.0%) | 0 (0.0%) |
| $25,000 to $34,999 | 0 (0.0%) | 0 (0.0%) |
| $35,000 to $49,999 | 0 (0.0%) | 0 (0.0%) |
| $50,000 to $74,999 | 0 (0.0%) | 0 (0.0%) |
| $75,000 to $99,999 | 0 (0.0%) | 0 (0.0%) |
| $100,000 to $149,999 | 0 (0.0%) | 0 (0.0%) |
| $150,000 or more | 44 (100.0%) | 0 (0.0%) |
| Total | 44 (100.0%) | 0 (0.0%) |
Property Value to Household Income Ratio in Honcut
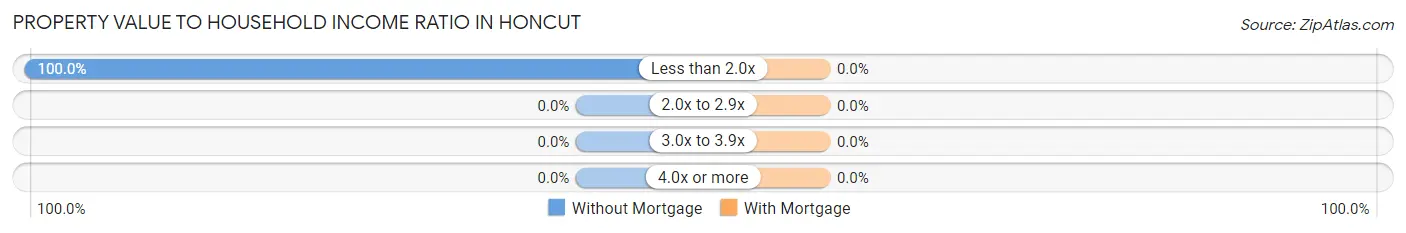
| Value-to-Income Ratio | Without Mortgage | With Mortgage |
| Less than 2.0x | 44 (100.0%) | 0 (0.0%) |
| 2.0x to 2.9x | 0 (0.0%) | 0 (0.0%) |
| 3.0x to 3.9x | 0 (0.0%) | 0 (0.0%) |
| 4.0x or more | 0 (0.0%) | 0 (0.0%) |
| Total | 44 (100.0%) | 0 (0.0%) |
Real Estate Taxes by Mortgage Status in Honcut
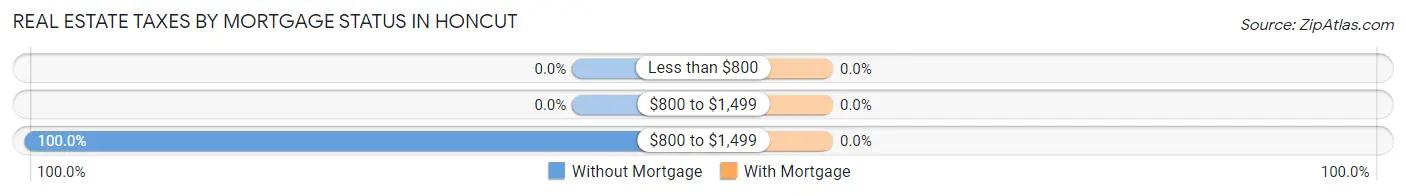
| Property Taxes | Without Mortgage | With Mortgage |
| Less than $800 | 0 (0.0%) | 0 (0.0%) |
| $800 to $1,499 | 0 (0.0%) | 0 (0.0%) |
| $800 to $1,499 | 44 (100.0%) | 0 (0.0%) |
| Total | 44 (100.0%) | 0 (0.0%) |
Health & Disability in Honcut
Health Insurance Coverage by Age in Honcut
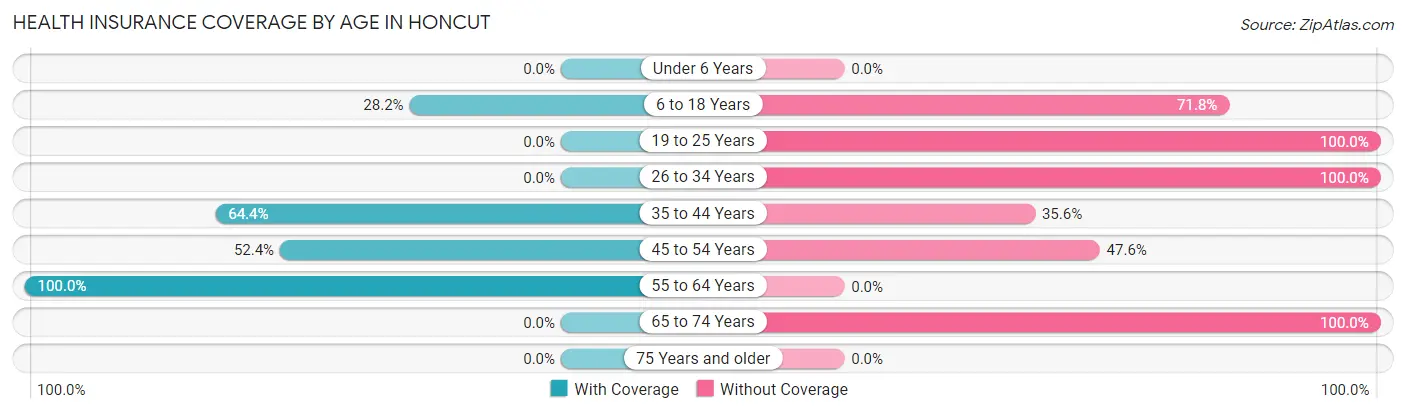
| Age Bracket | With Coverage | Without Coverage |
| Under 6 Years | 0 (0.0%) | 0 (0.0%) |
| 6 to 18 Years | 24 (28.2%) | 61 (71.8%) |
| 19 to 25 Years | 0 (0.0%) | 27 (100.0%) |
| 26 to 34 Years | 0 (0.0%) | 11 (100.0%) |
| 35 to 44 Years | 58 (64.4%) | 32 (35.6%) |
| 45 to 54 Years | 33 (52.4%) | 30 (47.6%) |
| 55 to 64 Years | 25 (100.0%) | 0 (0.0%) |
| 65 to 74 Years | 0 (0.0%) | 12 (100.0%) |
| 75 Years and older | 0 (0.0%) | 0 (0.0%) |
| Total | 140 (44.7%) | 173 (55.3%) |
Health Insurance Coverage by Citizenship Status in Honcut
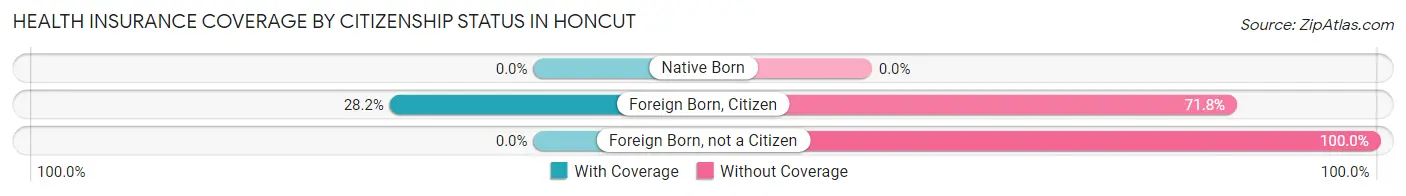
| Citizenship Status | With Coverage | Without Coverage |
| Native Born | 0 (0.0%) | 0 (0.0%) |
| Foreign Born, Citizen | 24 (28.2%) | 61 (71.8%) |
| Foreign Born, not a Citizen | 0 (0.0%) | 27 (100.0%) |
Health Insurance Coverage by Household Income in Honcut
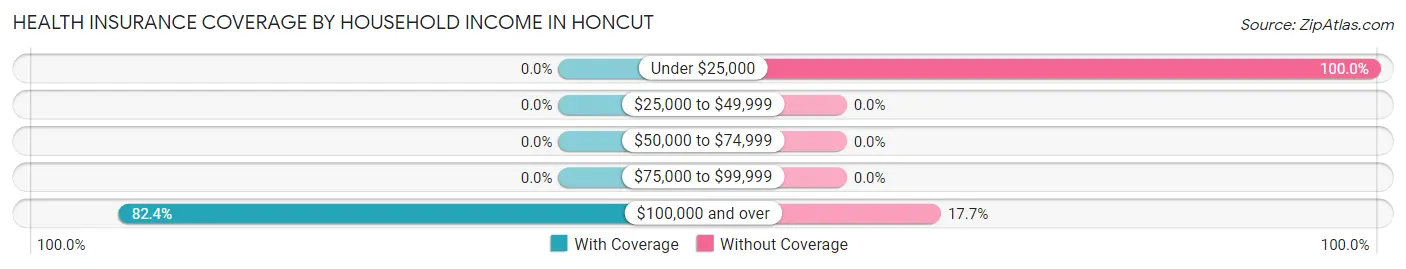
| Household Income | With Coverage | Without Coverage |
| Under $25,000 | 0 (0.0%) | 143 (100.0%) |
| $25,000 to $49,999 | 0 (0.0%) | 0 (0.0%) |
| $50,000 to $74,999 | 0 (0.0%) | 0 (0.0%) |
| $75,000 to $99,999 | 0 (0.0%) | 0 (0.0%) |
| $100,000 and over | 140 (82.4%) | 30 (17.6%) |
Public vs Private Health Insurance Coverage by Age in Honcut
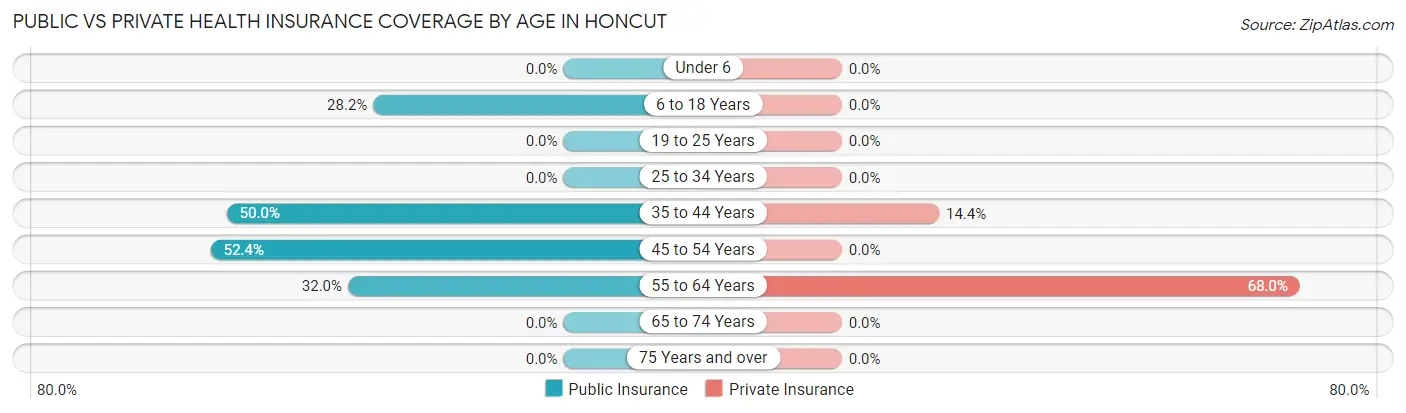
| Age Bracket | Public Insurance | Private Insurance |
| Under 6 | 0 (0.0%) | 0 (0.0%) |
| 6 to 18 Years | 24 (28.2%) | 0 (0.0%) |
| 19 to 25 Years | 0 (0.0%) | 0 (0.0%) |
| 25 to 34 Years | 0 (0.0%) | 0 (0.0%) |
| 35 to 44 Years | 45 (50.0%) | 13 (14.4%) |
| 45 to 54 Years | 33 (52.4%) | 0 (0.0%) |
| 55 to 64 Years | 8 (32.0%) | 17 (68.0%) |
| 65 to 74 Years | 0 (0.0%) | 0 (0.0%) |
| 75 Years and over | 0 (0.0%) | 0 (0.0%) |
| Total | 110 (35.1%) | 30 (9.6%) |
Disability Status by Sex by Age in Honcut
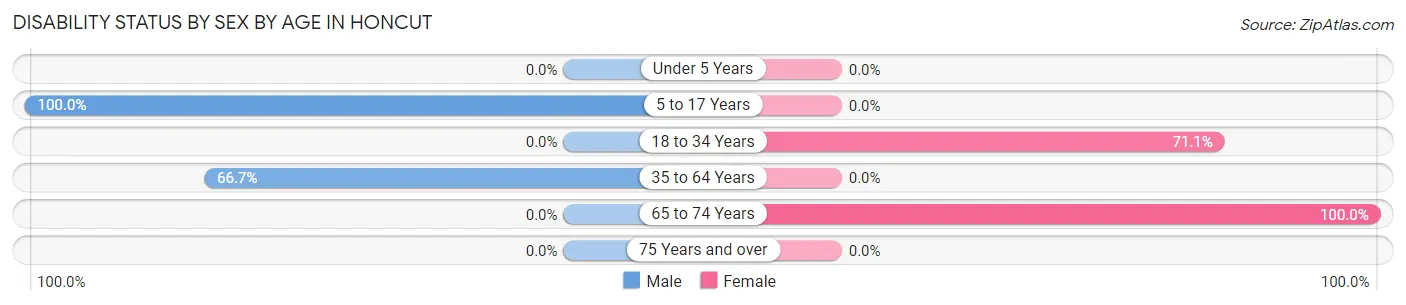
| Age Bracket | Male | Female |
| Under 5 Years | 0 (0.0%) | 0 (0.0%) |
| 5 to 17 Years | 24 (100.0%) | 0 (0.0%) |
| 18 to 34 Years | 0 (0.0%) | 27 (71.1%) |
| 35 to 64 Years | 68 (66.7%) | 0 (0.0%) |
| 65 to 74 Years | 0 (0.0%) | 12 (100.0%) |
| 75 Years and over | 0 (0.0%) | 0 (0.0%) |
Disability Class by Sex by Age in Honcut
Disability Class: Hearing Difficulty
| Age Bracket | Male | Female |
| Under 5 Years | 0 (0.0%) | 0 (0.0%) |
| 5 to 17 Years | 0 (0.0%) | 0 (0.0%) |
| 18 to 34 Years | 0 (0.0%) | 0 (0.0%) |
| 35 to 64 Years | 0 (0.0%) | 0 (0.0%) |
| 65 to 74 Years | 0 (0.0%) | 0 (0.0%) |
| 75 Years and over | 0 (0.0%) | 0 (0.0%) |
Disability Class: Vision Difficulty
| Age Bracket | Male | Female |
| Under 5 Years | 0 (0.0%) | 0 (0.0%) |
| 5 to 17 Years | 0 (0.0%) | 0 (0.0%) |
| 18 to 34 Years | 0 (0.0%) | 0 (0.0%) |
| 35 to 64 Years | 0 (0.0%) | 0 (0.0%) |
| 65 to 74 Years | 0 (0.0%) | 0 (0.0%) |
| 75 Years and over | 0 (0.0%) | 0 (0.0%) |
Disability Class: Cognitive Difficulty
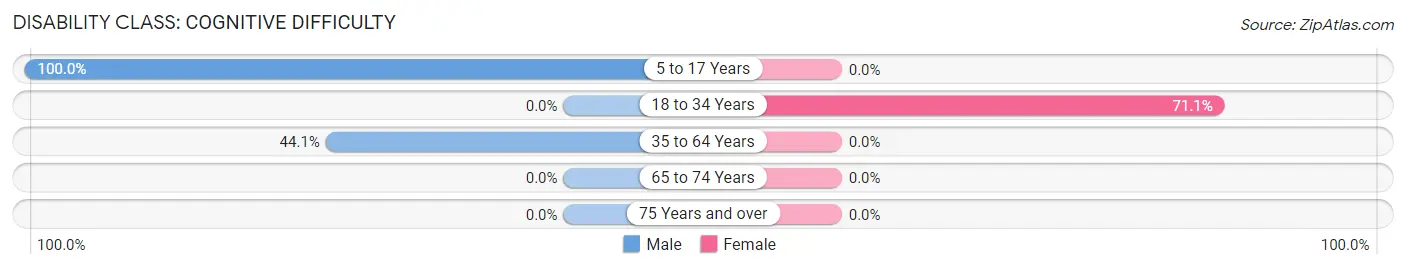
| Age Bracket | Male | Female |
| 5 to 17 Years | 24 (100.0%) | 0 (0.0%) |
| 18 to 34 Years | 0 (0.0%) | 27 (71.1%) |
| 35 to 64 Years | 45 (44.1%) | 0 (0.0%) |
| 65 to 74 Years | 0 (0.0%) | 0 (0.0%) |
| 75 Years and over | 0 (0.0%) | 0 (0.0%) |
Disability Class: Ambulatory Difficulty
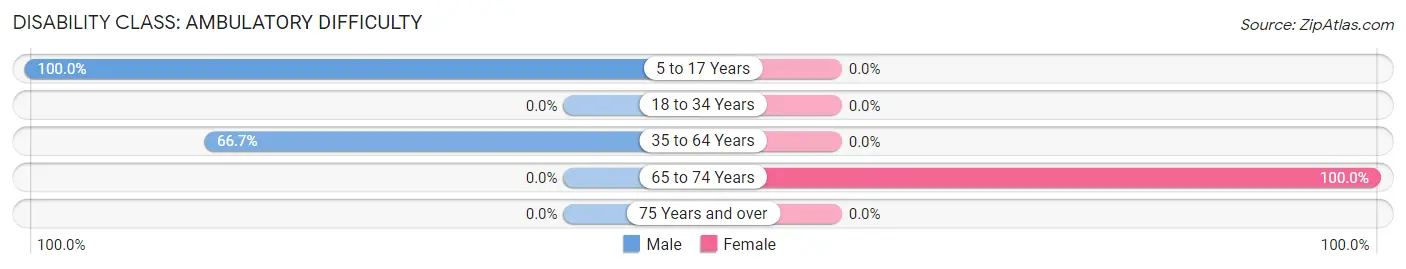
| Age Bracket | Male | Female |
| 5 to 17 Years | 24 (100.0%) | 0 (0.0%) |
| 18 to 34 Years | 0 (0.0%) | 0 (0.0%) |
| 35 to 64 Years | 68 (66.7%) | 0 (0.0%) |
| 65 to 74 Years | 0 (0.0%) | 12 (100.0%) |
| 75 Years and over | 0 (0.0%) | 0 (0.0%) |
Disability Class: Self-Care Difficulty
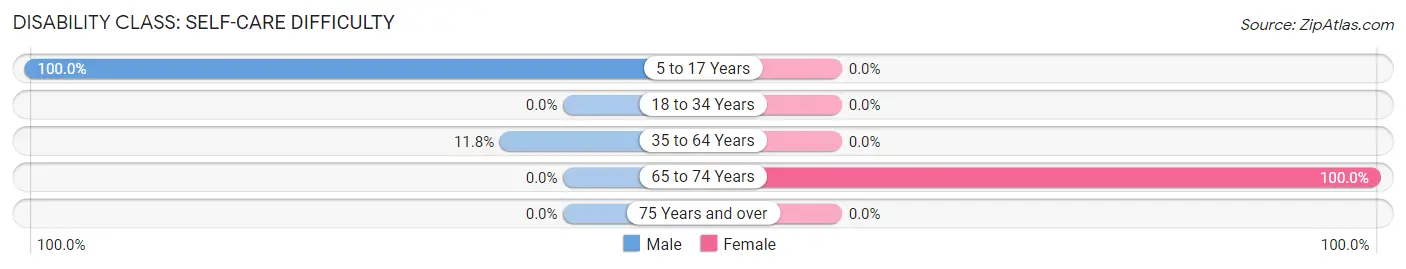
| Age Bracket | Male | Female |
| 5 to 17 Years | 24 (100.0%) | 0 (0.0%) |
| 18 to 34 Years | 0 (0.0%) | 0 (0.0%) |
| 35 to 64 Years | 12 (11.8%) | 0 (0.0%) |
| 65 to 74 Years | 0 (0.0%) | 12 (100.0%) |
| 75 Years and over | 0 (0.0%) | 0 (0.0%) |
Technology Access in Honcut
Computing Device Access in Honcut
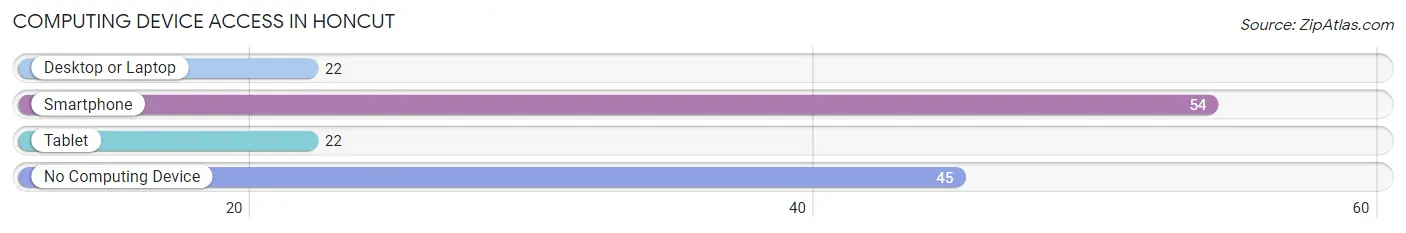
| Device Type | # Households | % Households |
| Desktop or Laptop | 22 | 22.2% |
| Smartphone | 54 | 54.5% |
| Tablet | 22 | 22.2% |
| No Computing Device | 45 | 45.5% |
| Total | 99 | 100.0% |
Internet Access in Honcut
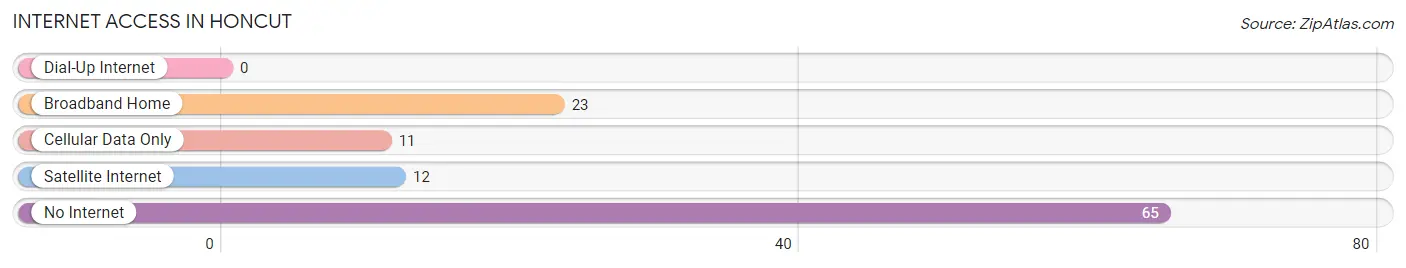
| Internet Type | # Households | % Households |
| Dial-Up Internet | 0 | 0.0% |
| Broadband Home | 23 | 23.2% |
| Cellular Data Only | 11 | 11.1% |
| Satellite Internet | 12 | 12.1% |
| No Internet | 65 | 65.7% |
| Total | 99 | 100.0% |
Honcut Summary
HONCUT CALIFORNIA
Honcut is an unincorporated community in Butte County, California, United States. It is located on the western edge of the Sacramento Valley, about 10 miles (16 km) south of Oroville. The population was 1,845 at the 2010 census.
History
Honcut was originally a mining camp established in the 1850s. It was named after the Honcut Mining Company, which was formed in 1854. The company was formed by a group of miners from the nearby town of Bidwell Bar. The miners were looking for gold and other minerals in the area. The company was successful and the town of Honcut grew up around it.
In the late 1800s, the town was a bustling center of commerce and industry. It had a post office, a general store, a blacksmith shop, a hotel, and several saloons. The town also had a school, a church, and a cemetery.
In the early 1900s, the town began to decline as the mining industry in the area declined. By the 1950s, the town was mostly abandoned.
Geography
Honcut is located at 39 35 25 North 121 30 45 West 39 590278 121 5125
The town is situated in the western foothills of the Sierra Nevada mountain range. It is located in the Sacramento Valley, about 10 miles (16 km) south of Oroville. The town is surrounded by rolling hills and open farmland.
The climate in Honcut is hot and dry in the summer, and mild and wet in the winter. The average annual temperature is about 60°F (15°C). The average annual precipitation is about 20 inches (51 cm).
Economy
The economy of Honcut is largely based on agriculture. The town is surrounded by open farmland, and many of the residents are involved in farming and ranching. The town also has a few small businesses, including a gas station, a convenience store, and a few restaurants.
Demographics
As of the 2010 census, there were 1,845 people, 690 households, and 486 families living in Honcut. The population density was 545.3 people per square mile (210.9/km2). There were 745 housing units at an average density of 221.3 per square mile (85.4/km2). The racial makeup of the town was 87.2% White, 0.7% African American, 1.2% Native American, 0.7% Asian, 0.1% Pacific Islander, 7.2% from other races, and 3.0% from two or more races. Hispanic or Latino of any race were 16.2% of the population.
There were 690 households, out of which 33.3% had children under the age of 18 living with them, 51.3% were married couples living together, 11.3% had a female householder with no husband present, and 30.3% were non-families. 24.3% of all households were made up of individuals, and 10.1% had someone living alone who was 65 years of age or older. The average household size was 2.67 and the average family size was 3.17.
In the town, the population was spread out, with 28.2% under the age of 18, 8.2% from 18 to 24, 25.2% from 25 to 44, 25.2% from 45 to 64, and 13.2% who were 65 years of age or older. The median age was 37 years. For every 100 females, there were 97.2 males. For every 100 females age 18 and over, there were 94.2 males.
The median income for a household in the town was $35,000, and the median income for a family was $41,250. Males had a median income of $31,250 versus $25,000 for females. The per capita income for the town was $17,845. About 11.2% of families and 14.2% of the population were below the poverty line, including 19.2% of those under age 18 and 8.2% of those age 65 or over.
Common Questions
What is Per Capita Income in Honcut?
Per Capita income in Honcut is $41,233.
What is the Median Family Income in Honcut?
Median Family Income in Honcut is $161,250.
What is the Median Household income in Honcut?
Median Household Income in Honcut is $161,250.
What is Inequality or Gini Index in Honcut?
Inequality or Gini Index in Honcut is 0.54.
What is the Total Population of Honcut?
Total Population of Honcut is 313.
What is the Total Male Population of Honcut?
Total Male Population of Honcut is 126.
What is the Total Female Population of Honcut?
Total Female Population of Honcut is 187.
What is the Ratio of Males per 100 Females in Honcut?
There are 67.38 Males per 100 Females in Honcut.
What is the Ratio of Females per 100 Males in Honcut?
There are 148.41 Females per 100 Males in Honcut.
What is the Median Population Age in Honcut?
Median Population Age in Honcut is 42.3 Years.
What is the Average Family Size in Honcut
Average Family Size in Honcut is 3.2 People.
What is the Average Household Size in Honcut
Average Household Size in Honcut is 3.2 People.
How Large is the Labor Force in Honcut?
There are 81 People in the Labor Forcein in Honcut.
What is the Percentage of People in the Labor Force in Honcut?
31.0% of People are in the Labor Force in Honcut.
What is the Unemployment Rate in Honcut?
Unemployment Rate in Honcut is 40.7%.