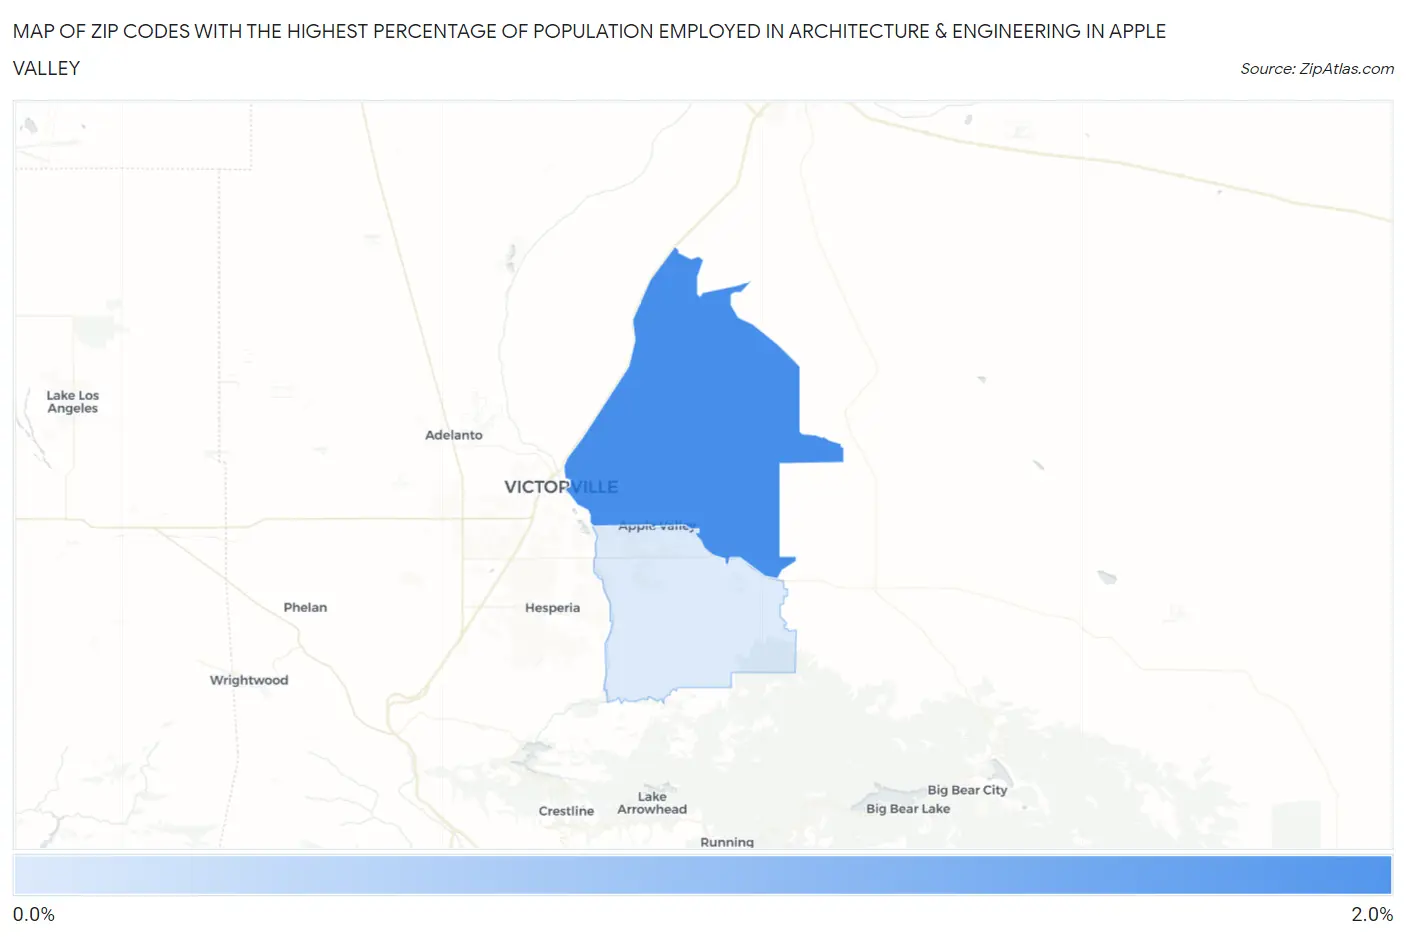
Zip Codes with the Highest Percentage of Population Employed in Architecture & Engineering in Apple Valley, CA
RELATED REPORTS & OPTIONS
Architecture & Engineering
Apple Valley
Compare Zip Codes
Map of Zip Codes with the Highest Percentage of Population Employed in Architecture & Engineering in Apple Valley
0.35%
1.6%
Zip Codes with the Highest Percentage of Population Employed in Architecture & Engineering in Apple Valley, CA
| Zip Code | % Employed | vs State | vs National | |
| 1. | 92307 | 1.6% | 2.6%(-0.905)#808 | 2.1%(-0.500)#11,834 |
| 2. | 92308 | 0.35% | 2.6%(-2.20)#1,266 | 2.1%(-1.80)#21,276 |
1
Common Questions
What are the Top Zip Codes with the Highest Percentage of Population Employed in Architecture & Engineering in Apple Valley, CA?
Top Zip Codes with the Highest Percentage of Population Employed in Architecture & Engineering in Apple Valley, CA are:
What zip code has the Highest Percentage of Population Employed in Architecture & Engineering in Apple Valley, CA?
92307 has the Highest Percentage of Population Employed in Architecture & Engineering in Apple Valley, CA with 1.6%.
What is the Percentage of Population Employed in Architecture & Engineering in Apple Valley, CA?
Percentage of Population Employed in Architecture & Engineering in Apple Valley is 1.1%.
What is the Percentage of Population Employed in Architecture & Engineering in California?
Percentage of Population Employed in Architecture & Engineering in California is 2.6%.
What is the Percentage of Population Employed in Architecture & Engineering in the United States?
Percentage of Population Employed in Architecture & Engineering in the United States is 2.1%.