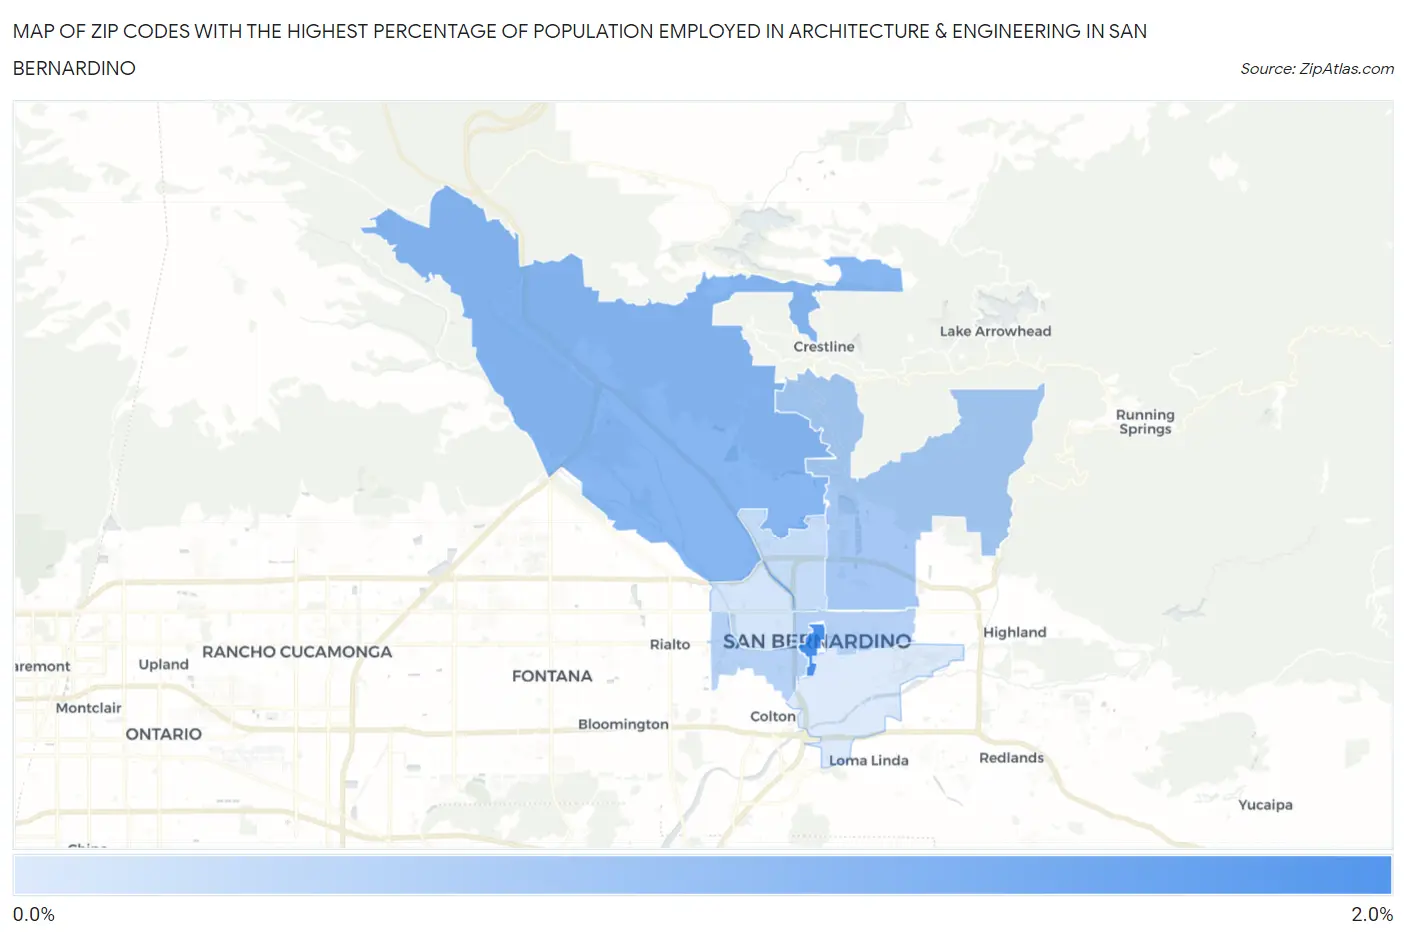
Zip Codes with the Highest Percentage of Population Employed in Architecture & Engineering in San Bernardino, CA
RELATED REPORTS & OPTIONS
Architecture & Engineering
San Bernardino
Compare Zip Codes
Map of Zip Codes with the Highest Percentage of Population Employed in Architecture & Engineering in San Bernardino
0.35%
1.6%
Zip Codes with the Highest Percentage of Population Employed in Architecture & Engineering in San Bernardino, CA
| Zip Code | % Employed | vs State | vs National | |
| 1. | 92401 | 1.6% | 2.6%(-0.981)#838 | 2.1%(-0.576)#12,355 |
| 2. | 92407 | 1.0% | 2.6%(-1.51)#1,022 | 2.1%(-1.10)#16,271 |
| 3. | 92404 | 0.80% | 2.6%(-1.76)#1,126 | 2.1%(-1.35)#18,168 |
| 4. | 92410 | 0.66% | 2.6%(-1.89)#1,162 | 2.1%(-1.49)#19,171 |
| 5. | 92405 | 0.54% | 2.6%(-2.01)#1,208 | 2.1%(-1.61)#20,028 |
| 6. | 92411 | 0.42% | 2.6%(-2.13)#1,241 | 2.1%(-1.73)#20,816 |
| 7. | 92408 | 0.35% | 2.6%(-2.20)#1,267 | 2.1%(-1.80)#21,281 |
1
Common Questions
What are the Top 5 Zip Codes with the Highest Percentage of Population Employed in Architecture & Engineering in San Bernardino, CA?
Top 5 Zip Codes with the Highest Percentage of Population Employed in Architecture & Engineering in San Bernardino, CA are:
What zip code has the Highest Percentage of Population Employed in Architecture & Engineering in San Bernardino, CA?
92401 has the Highest Percentage of Population Employed in Architecture & Engineering in San Bernardino, CA with 1.6%.
What is the Percentage of Population Employed in Architecture & Engineering in San Bernardino, CA?
Percentage of Population Employed in Architecture & Engineering in San Bernardino is 0.66%.
What is the Percentage of Population Employed in Architecture & Engineering in California?
Percentage of Population Employed in Architecture & Engineering in California is 2.6%.
What is the Percentage of Population Employed in Architecture & Engineering in the United States?
Percentage of Population Employed in Architecture & Engineering in the United States is 2.1%.