Zip Codes with the Highest Percentage of Population Employed in Architecture & Engineering in Alameda, CA
RELATED REPORTS & OPTIONS
Architecture & Engineering
Alameda
Compare Zip Codes
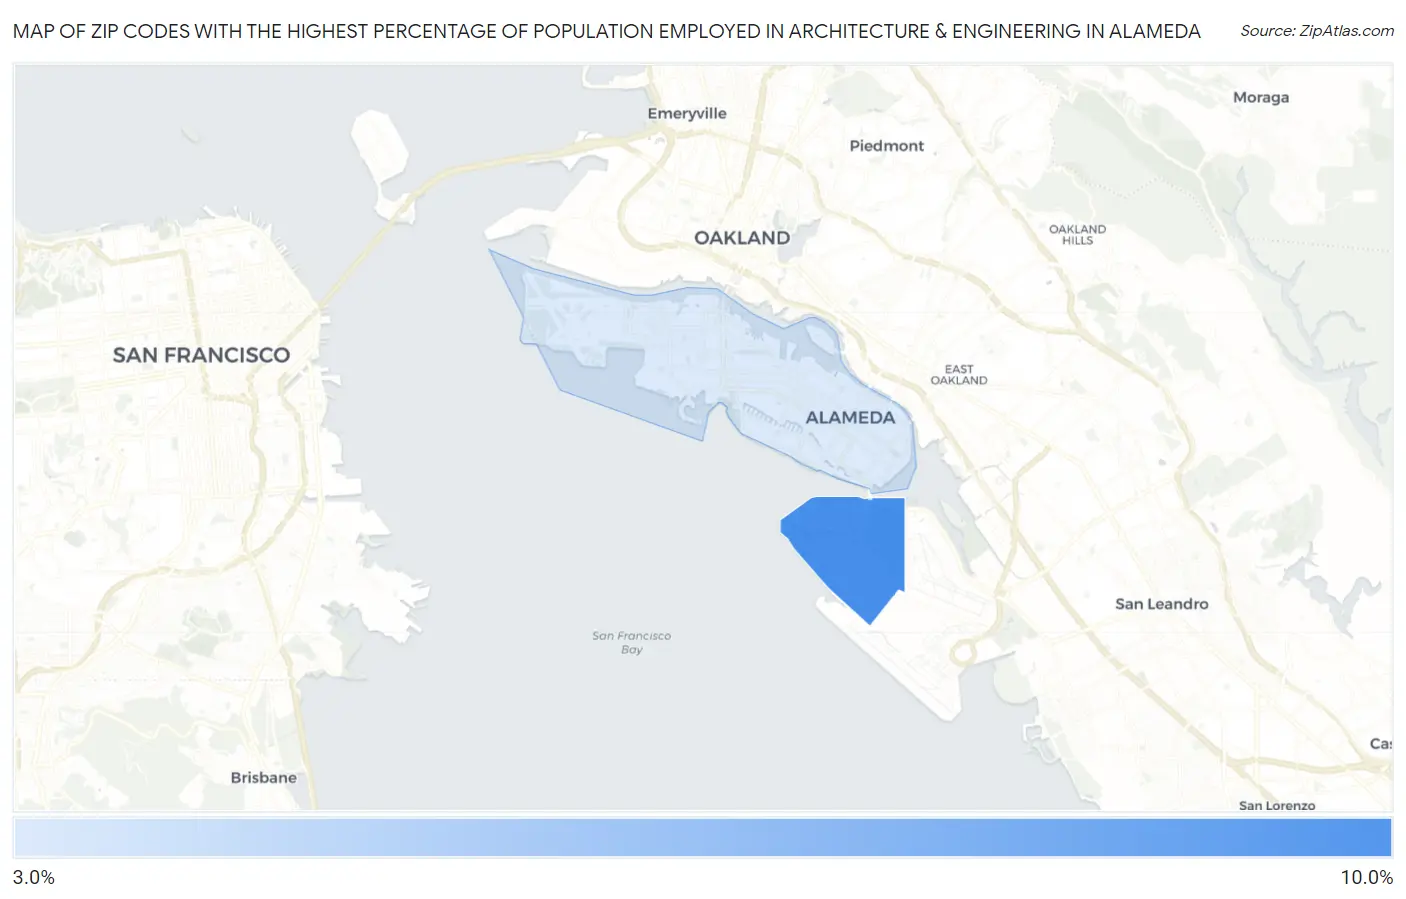
Map of Zip Codes with the Highest Percentage of Population Employed in Architecture & Engineering in Alameda
3.8%
8.7%
Zip Codes with the Highest Percentage of Population Employed in Architecture & Engineering in Alameda, CA
| Zip Code | % Employed | vs State | vs National | |
| 1. | 94502 | 8.7% | 2.6%(+6.17)#44 | 2.1%(+6.57)#456 |
| 2. | 94501 | 3.8% | 2.6%(+1.23)#268 | 2.1%(+1.63)#3,136 |
1
Common Questions
What are the Top Zip Codes with the Highest Percentage of Population Employed in Architecture & Engineering in Alameda, CA?
Top Zip Codes with the Highest Percentage of Population Employed in Architecture & Engineering in Alameda, CA are:
What zip code has the Highest Percentage of Population Employed in Architecture & Engineering in Alameda, CA?
94502 has the Highest Percentage of Population Employed in Architecture & Engineering in Alameda, CA with 8.7%.
What is the Percentage of Population Employed in Architecture & Engineering in Alameda, CA?
Percentage of Population Employed in Architecture & Engineering in Alameda is 4.7%.
What is the Percentage of Population Employed in Architecture & Engineering in California?
Percentage of Population Employed in Architecture & Engineering in California is 2.6%.
What is the Percentage of Population Employed in Architecture & Engineering in the United States?
Percentage of Population Employed in Architecture & Engineering in the United States is 2.1%.