Del Aire, CA Map & Demographics
Del Aire Map
Del Aire Overview
$51,927
PER CAPITA INCOME
$146,491
AVG FAMILY INCOME
$132,114
AVG HOUSEHOLD INCOME
35.0%
WAGE / INCOME GAP [ % ]
65.0¢/ $1
WAGE / INCOME GAP [ $ ]
0.41
INEQUALITY / GINI INDEX
10,756
TOTAL POPULATION
5,001
MALE POPULATION
5,755
FEMALE POPULATION
86.90
MALES / 100 FEMALES
115.08
FEMALES / 100 MALES
36.8
MEDIAN AGE
3.7
AVG FAMILY SIZE
3.1
AVG HOUSEHOLD SIZE
5,617
LABOR FORCE [ PEOPLE ]
67.1%
PERCENT IN LABOR FORCE
2.8%
UNEMPLOYMENT RATE
Income in Del Aire
Income Overview in Del Aire
Per Capita Income in Del Aire is $51,927, while median incomes of families and households are $146,491 and $132,114 respectively.
| Characteristic | Number | Measure |
| Per Capita Income | 10,756 | $51,927 |
| Median Family Income | 2,539 | $146,491 |
| Mean Family Income | 2,539 | $172,376 |
| Median Household Income | 3,467 | $132,114 |
| Mean Household Income | 3,467 | $156,700 |
| Income Deficit | 2,539 | $0 |
| Wage / Income Gap (%) | 10,756 | 35.03% |
| Wage / Income Gap ($) | 10,756 | 64.97¢ per $1 |
| Gini / Inequality Index | 10,756 | 0.41 |
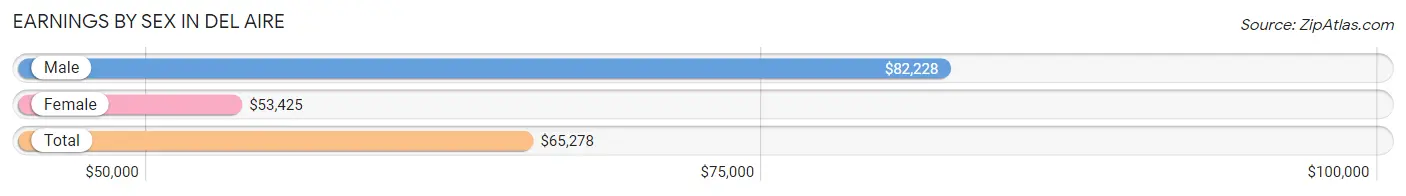
Earnings by Sex in Del Aire
Average Earnings in Del Aire are $65,278, $82,228 for men and $53,425 for women, a difference of 35.0%.
| Sex | Number | Average Earnings |
| Male | 3,103 (53.6%) | $82,228 |
| Female | 2,685 (46.4%) | $53,425 |
| Total | 5,788 (100.0%) | $65,278 |
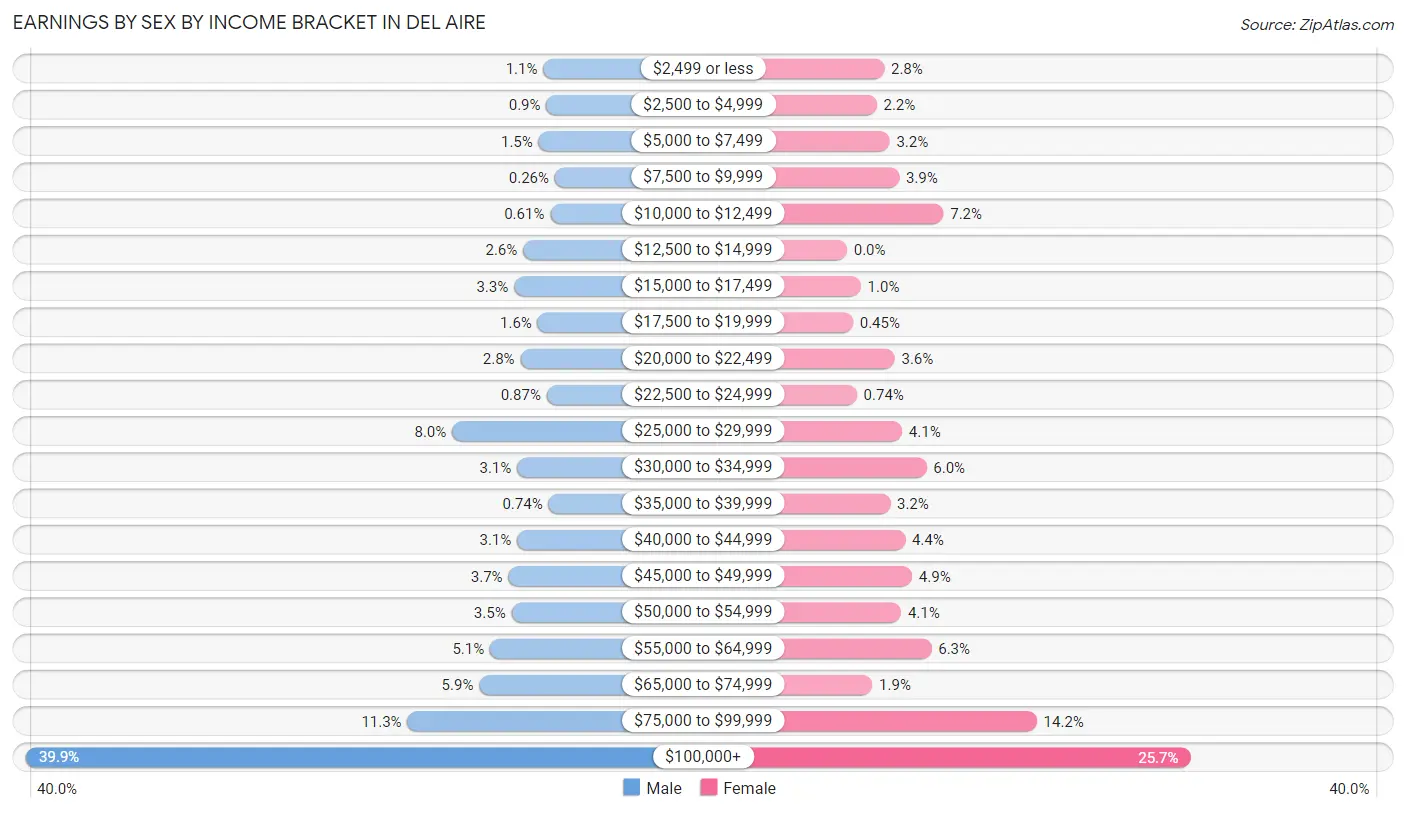
Earnings by Sex by Income Bracket in Del Aire
The most common earnings brackets in Del Aire are $100,000+ for men (1,238 | 39.9%) and $100,000+ for women (691 | 25.7%).
| Income | Male | Female |
| $2,499 or less | 35 (1.1%) | 75 (2.8%) |
| $2,500 to $4,999 | 28 (0.9%) | 60 (2.2%) |
| $5,000 to $7,499 | 46 (1.5%) | 86 (3.2%) |
| $7,500 to $9,999 | 8 (0.3%) | 105 (3.9%) |
| $10,000 to $12,499 | 19 (0.6%) | 194 (7.2%) |
| $12,500 to $14,999 | 82 (2.6%) | 0 (0.0%) |
| $15,000 to $17,499 | 103 (3.3%) | 28 (1.0%) |
| $17,500 to $19,999 | 48 (1.5%) | 12 (0.4%) |
| $20,000 to $22,499 | 88 (2.8%) | 96 (3.6%) |
| $22,500 to $24,999 | 27 (0.9%) | 20 (0.7%) |
| $25,000 to $29,999 | 247 (8.0%) | 111 (4.1%) |
| $30,000 to $34,999 | 96 (3.1%) | 160 (6.0%) |
| $35,000 to $39,999 | 23 (0.7%) | 87 (3.2%) |
| $40,000 to $44,999 | 96 (3.1%) | 117 (4.4%) |
| $45,000 to $49,999 | 116 (3.7%) | 131 (4.9%) |
| $50,000 to $54,999 | 109 (3.5%) | 109 (4.1%) |
| $55,000 to $64,999 | 159 (5.1%) | 170 (6.3%) |
| $65,000 to $74,999 | 184 (5.9%) | 51 (1.9%) |
| $75,000 to $99,999 | 351 (11.3%) | 382 (14.2%) |
| $100,000+ | 1,238 (39.9%) | 691 (25.7%) |
| Total | 3,103 (100.0%) | 2,685 (100.0%) |
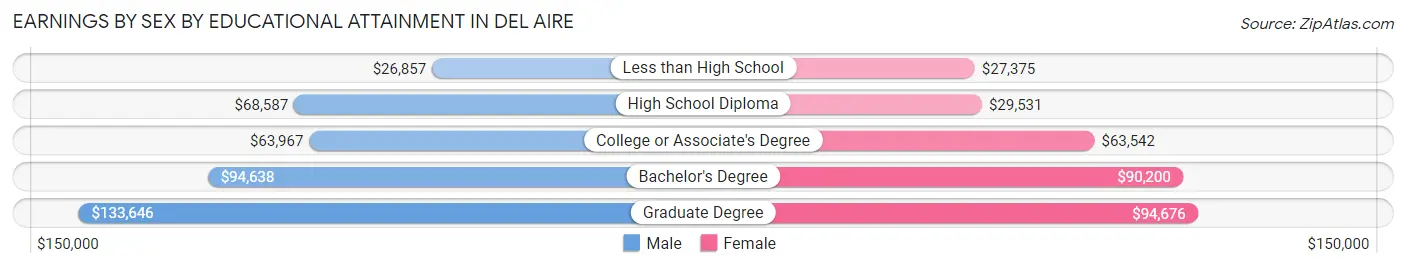
Earnings by Sex by Educational Attainment in Del Aire
Average earnings in Del Aire are $89,167 for men and $59,539 for women, a difference of 33.2%. Men with an educational attainment of graduate degree enjoy the highest average annual earnings of $133,646, while those with less than high school education earn the least with $26,857. Women with an educational attainment of graduate degree earn the most with the average annual earnings of $94,676, while those with less than high school education have the smallest earnings of $27,375.
| Educational Attainment | Male Income | Female Income |
| Less than High School | $26,857 | $27,375 |
| High School Diploma | $68,587 | $29,531 |
| College or Associate's Degree | $63,967 | $63,542 |
| Bachelor's Degree | $94,638 | $90,200 |
| Graduate Degree | $133,646 | $94,676 |
| Total | $89,167 | $59,539 |
Family Income in Del Aire
Family Income Brackets in Del Aire
According to the Del Aire family income data, there are 825 families falling into the $200,000+ income range, which is the most common income bracket and makes up 32.5% of all families. Conversely, the $15,000 to $24,999 income bracket is the least frequent group with only 56 families (2.2%) belonging to this category.
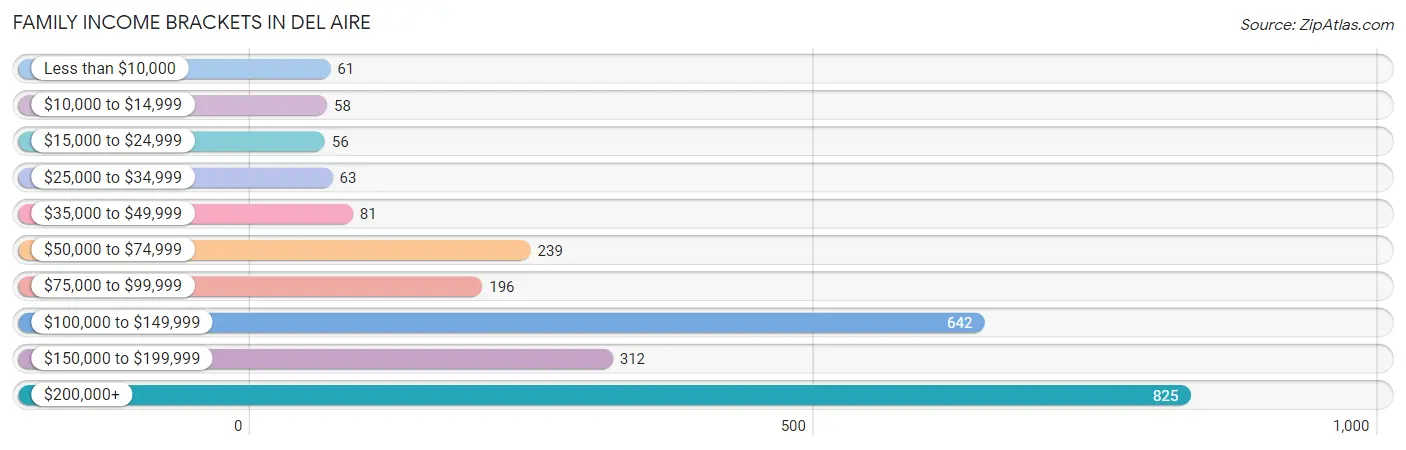
| Income Bracket | # Families | % Families |
| Less than $10,000 | 61 | 2.4% |
| $10,000 to $14,999 | 58 | 2.3% |
| $15,000 to $24,999 | 56 | 2.2% |
| $25,000 to $34,999 | 63 | 2.5% |
| $35,000 to $49,999 | 81 | 3.2% |
| $50,000 to $74,999 | 239 | 9.4% |
| $75,000 to $99,999 | 196 | 7.7% |
| $100,000 to $149,999 | 642 | 25.3% |
| $150,000 to $199,999 | 312 | 12.3% |
| $200,000+ | 825 | 32.5% |
Family Income by Famaliy Size in Del Aire
7+ person families (76 | 3.0%) account for the highest median family income in Del Aire with $250,001 per family, while 2-person families (871 | 34.3%) have the highest median income of $66,016 per family member.
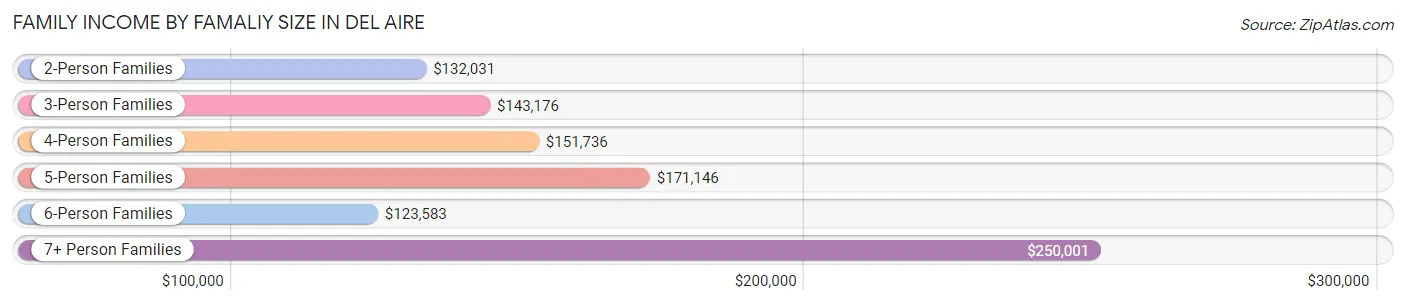
| Income Bracket | # Families | Median Income |
| 2-Person Families | 871 (34.3%) | $132,031 |
| 3-Person Families | 476 (18.8%) | $143,176 |
| 4-Person Families | 641 (25.3%) | $151,736 |
| 5-Person Families | 354 (13.9%) | $171,146 |
| 6-Person Families | 121 (4.8%) | $123,583 |
| 7+ Person Families | 76 (3.0%) | $250,001 |
| Total | 2,539 (100.0%) | $146,491 |
Family Income by Number of Earners in Del Aire
The median family income in Del Aire is $146,491, with families comprising 2 earners (1,295) having the highest median family income of $189,250, while families with no earners (200) have the lowest median family income of $30,391, accounting for 51.0% and 7.9% of families, respectively.
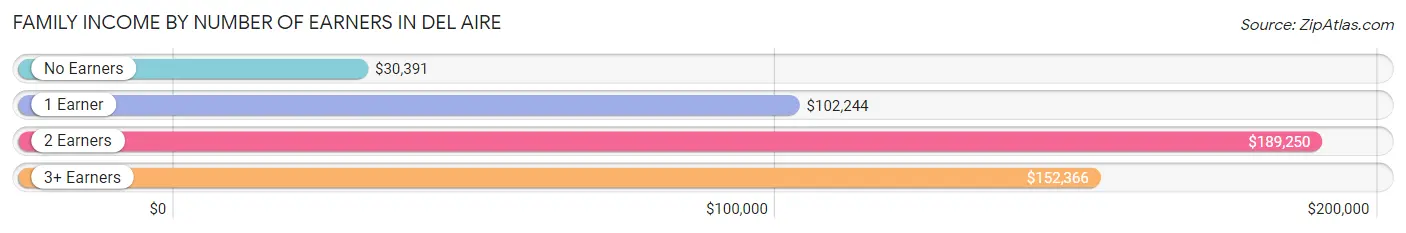
| Number of Earners | # Families | Median Income |
| No Earners | 200 (7.9%) | $30,391 |
| 1 Earner | 713 (28.1%) | $102,244 |
| 2 Earners | 1,295 (51.0%) | $189,250 |
| 3+ Earners | 331 (13.0%) | $152,366 |
| Total | 2,539 (100.0%) | $146,491 |
Household Income in Del Aire
Household Income Brackets in Del Aire
With 946 households falling in the category, the $100,000 to $149,999 income range is the most frequent in Del Aire, accounting for 27.3% of all households. In contrast, only 66 households (1.9%) fall into the $15,000 to $24,999 income bracket, making it the least populous group.
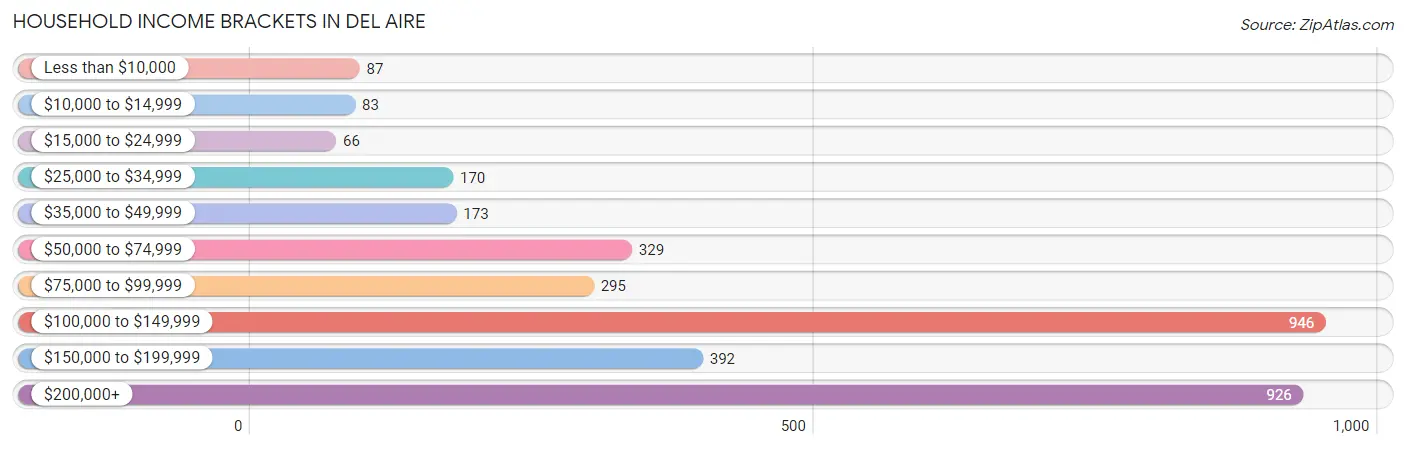
| Income Bracket | # Households | % Households |
| Less than $10,000 | 87 | 2.5% |
| $10,000 to $14,999 | 83 | 2.4% |
| $15,000 to $24,999 | 66 | 1.9% |
| $25,000 to $34,999 | 170 | 4.9% |
| $35,000 to $49,999 | 173 | 5.0% |
| $50,000 to $74,999 | 329 | 9.5% |
| $75,000 to $99,999 | 295 | 8.5% |
| $100,000 to $149,999 | 946 | 27.3% |
| $150,000 to $199,999 | 392 | 11.3% |
| $200,000+ | 926 | 26.7% |
Household Income by Householder Age in Del Aire
The median household income in Del Aire is $132,114, with the highest median household income of $154,643 found in the 25 to 44 years age bracket for the primary householder. A total of 1,374 households (39.6%) fall into this category. Meanwhile, the 65+ years age bracket for the primary householder has the lowest median household income of $66,618, with 742 households (21.4%) in this group.
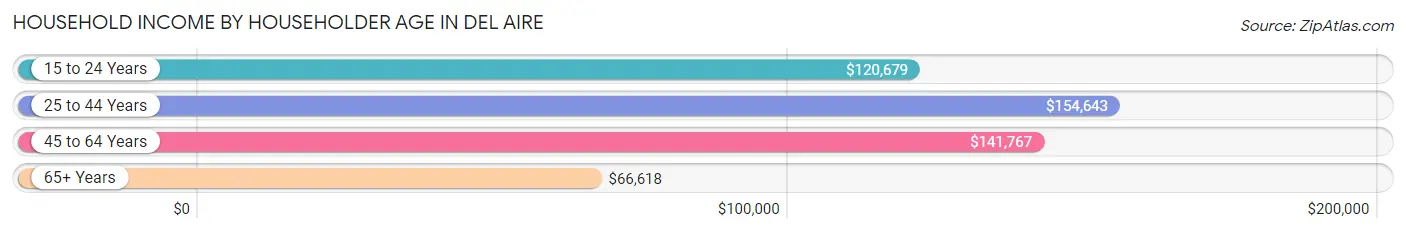
| Income Bracket | # Households | Median Income |
| 15 to 24 Years | 67 (1.9%) | $120,679 |
| 25 to 44 Years | 1,374 (39.6%) | $154,643 |
| 45 to 64 Years | 1,284 (37.0%) | $141,767 |
| 65+ Years | 742 (21.4%) | $66,618 |
| Total | 3,467 (100.0%) | $132,114 |
Poverty in Del Aire
Income Below Poverty by Sex and Age in Del Aire
With 7.9% poverty level for males and 6.8% for females among the residents of Del Aire, 5 year old males and 16 and 17 year old females are the most vulnerable to poverty, with 32 males (44.4%) and 28 females (31.8%) in their respective age groups living below the poverty level.
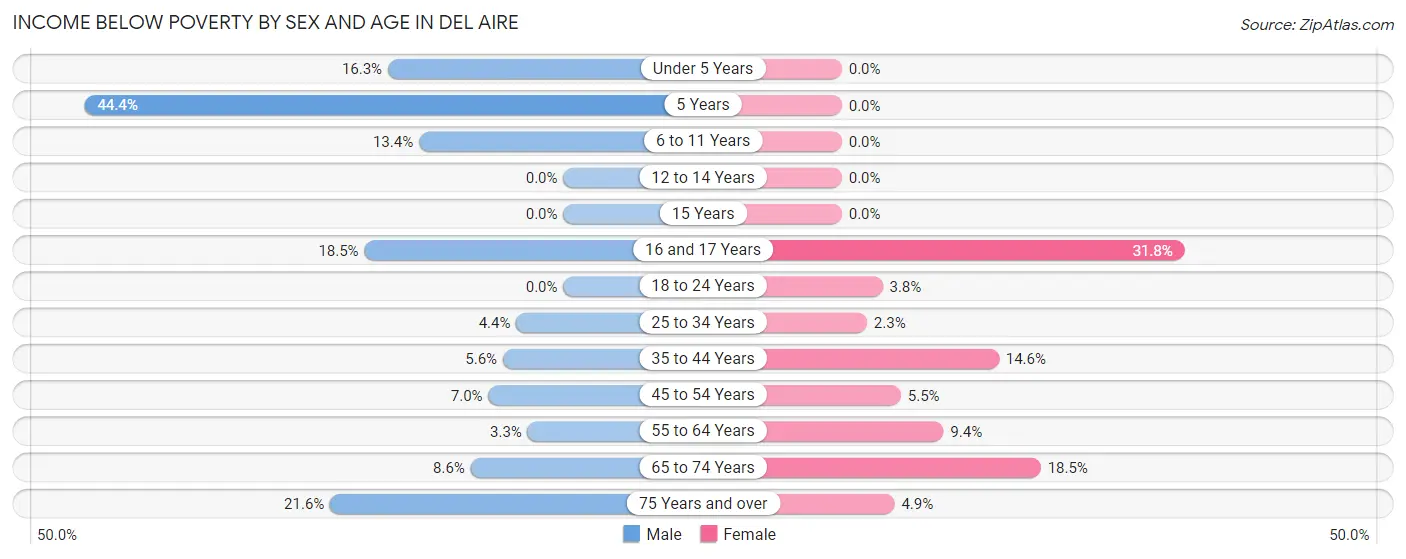
| Age Bracket | Male | Female |
| Under 5 Years | 49 (16.3%) | 0 (0.0%) |
| 5 Years | 32 (44.4%) | 0 (0.0%) |
| 6 to 11 Years | 63 (13.4%) | 0 (0.0%) |
| 12 to 14 Years | 0 (0.0%) | 0 (0.0%) |
| 15 Years | 0 (0.0%) | 0 (0.0%) |
| 16 and 17 Years | 12 (18.5%) | 28 (31.8%) |
| 18 to 24 Years | 0 (0.0%) | 18 (3.8%) |
| 25 to 34 Years | 40 (4.4%) | 18 (2.3%) |
| 35 to 44 Years | 49 (5.6%) | 126 (14.6%) |
| 45 to 54 Years | 46 (7.0%) | 43 (5.5%) |
| 55 to 64 Years | 16 (3.3%) | 38 (9.4%) |
| 65 to 74 Years | 30 (8.6%) | 98 (18.5%) |
| 75 Years and over | 58 (21.6%) | 24 (4.9%) |
| Total | 395 (7.9%) | 393 (6.8%) |
Income Above Poverty by Sex and Age in Del Aire
According to the poverty statistics in Del Aire, males aged 12 to 14 years and females aged under 5 years are the age groups that are most secure financially, with 100.0% of males and 100.0% of females in these age groups living above the poverty line.
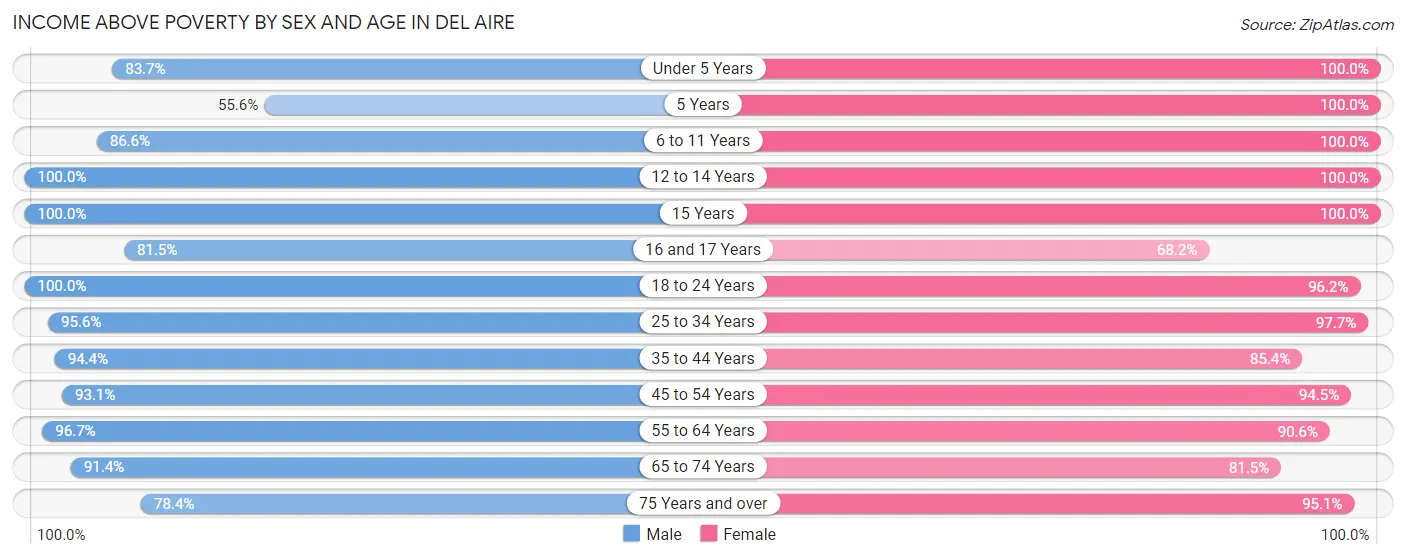
| Age Bracket | Male | Female |
| Under 5 Years | 252 (83.7%) | 422 (100.0%) |
| 5 Years | 40 (55.6%) | 148 (100.0%) |
| 6 to 11 Years | 407 (86.6%) | 611 (100.0%) |
| 12 to 14 Years | 146 (100.0%) | 62 (100.0%) |
| 15 Years | 34 (100.0%) | 93 (100.0%) |
| 16 and 17 Years | 53 (81.5%) | 60 (68.2%) |
| 18 to 24 Years | 341 (100.0%) | 458 (96.2%) |
| 25 to 34 Years | 875 (95.6%) | 754 (97.7%) |
| 35 to 44 Years | 824 (94.4%) | 739 (85.4%) |
| 45 to 54 Years | 616 (93.0%) | 741 (94.5%) |
| 55 to 64 Years | 467 (96.7%) | 365 (90.6%) |
| 65 to 74 Years | 319 (91.4%) | 433 (81.5%) |
| 75 Years and over | 210 (78.4%) | 467 (95.1%) |
| Total | 4,584 (92.1%) | 5,353 (93.2%) |
Income Below Poverty Among Married-Couple Families in Del Aire
The poverty statistics for married-couple families in Del Aire show that 5.0% or 101 of the total 2,014 families live below the poverty line. Families with no children have the highest poverty rate of 6.0%, comprising of 58 families. On the other hand, families with 1 or 2 children have the lowest poverty rate of 3.9%, which includes 34 families.
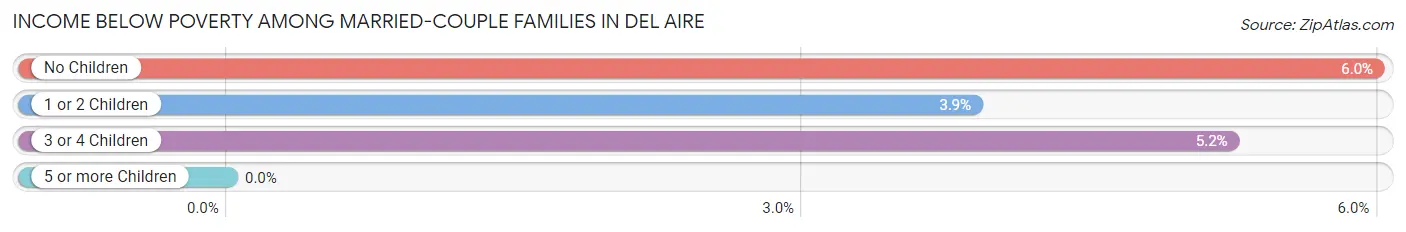
| Children | Above Poverty | Below Poverty |
| No Children | 911 (94.0%) | 58 (6.0%) |
| 1 or 2 Children | 839 (96.1%) | 34 (3.9%) |
| 3 or 4 Children | 163 (94.8%) | 9 (5.2%) |
| 5 or more Children | 0 (0.0%) | 0 (0.0%) |
| Total | 1,913 (95.0%) | 101 (5.0%) |
Income Below Poverty Among Single-Parent Households in Del Aire
According to the poverty data in Del Aire, 5.8% or 7 single-father households and 20.8% or 84 single-mother households are living below the poverty line. Among single-father households, those with no children have the highest poverty rate, with 7 households (8.5%) experiencing poverty. Likewise, among single-mother households, those with 1 or 2 children have the highest poverty rate, with 70 households (31.2%) falling below the poverty line.
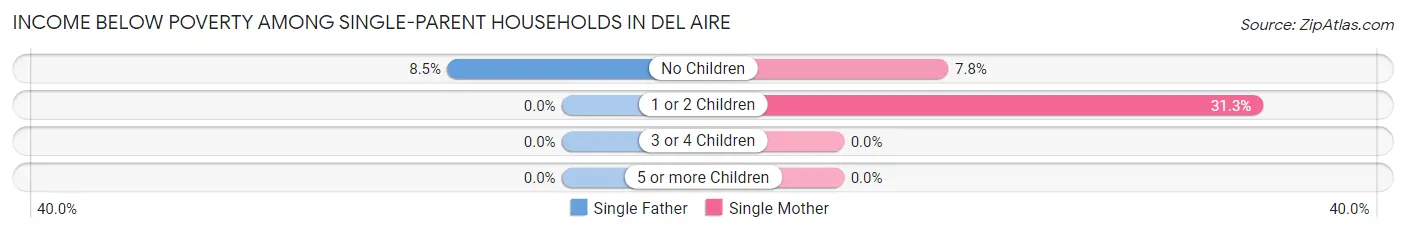
| Children | Single Father | Single Mother |
| No Children | 7 (8.5%) | 14 (7.8%) |
| 1 or 2 Children | 0 (0.0%) | 70 (31.2%) |
| 3 or 4 Children | 0 (0.0%) | 0 (0.0%) |
| 5 or more Children | 0 (0.0%) | 0 (0.0%) |
| Total | 7 (5.8%) | 84 (20.8%) |
Income Below Poverty Among Married-Couple vs Single-Parent Households in Del Aire
The poverty data for Del Aire shows that 101 of the married-couple family households (5.0%) and 91 of the single-parent households (17.3%) are living below the poverty level. Within the married-couple family households, those with no children have the highest poverty rate, with 58 households (6.0%) falling below the poverty line. Among the single-parent households, those with 1 or 2 children have the highest poverty rate, with 70 household (26.6%) living below poverty.
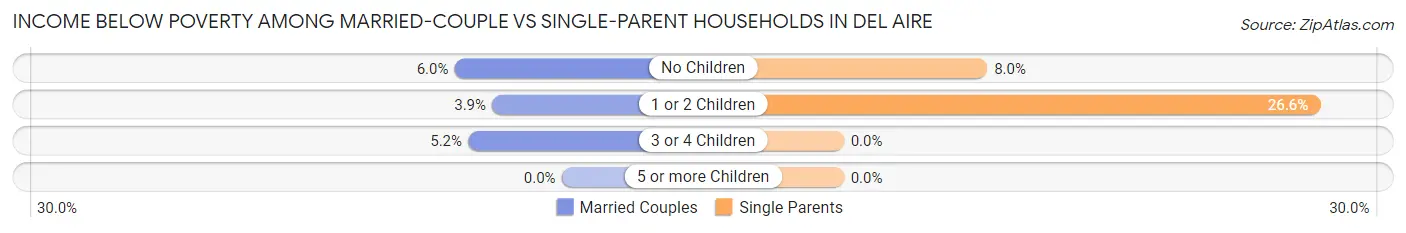
| Children | Married-Couple Families | Single-Parent Households |
| No Children | 58 (6.0%) | 21 (8.0%) |
| 1 or 2 Children | 34 (3.9%) | 70 (26.6%) |
| 3 or 4 Children | 9 (5.2%) | 0 (0.0%) |
| 5 or more Children | 0 (0.0%) | 0 (0.0%) |
| Total | 101 (5.0%) | 91 (17.3%) |
Race in Del Aire
The most populous races in Del Aire are White / Caucasian (5,309 | 49.4%), Hispanic or Latino (4,861 | 45.2%), and Two or more Races (2,153 | 20.0%).
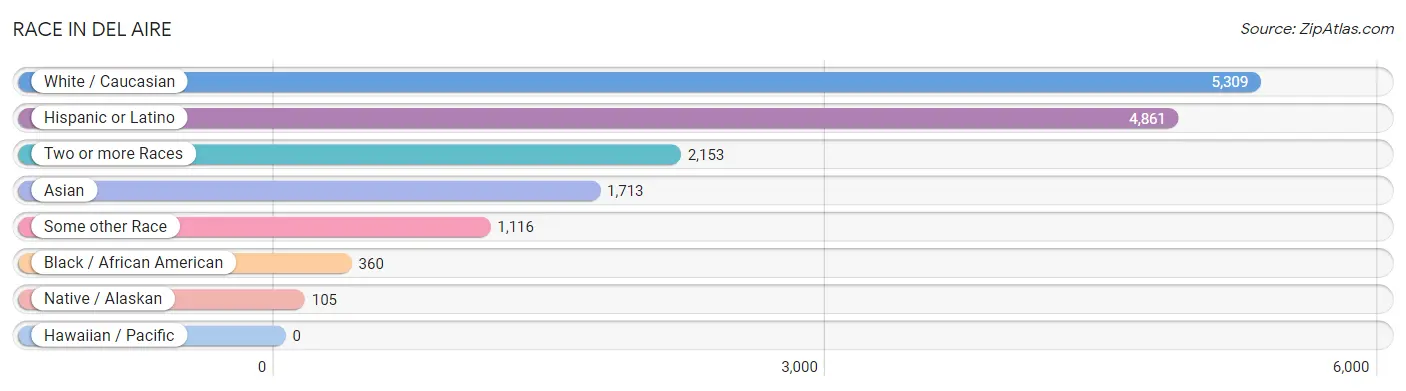
| Race | # Population | % Population |
| Asian | 1,713 | 15.9% |
| Black / African American | 360 | 3.4% |
| Hawaiian / Pacific | 0 | 0.0% |
| Hispanic or Latino | 4,861 | 45.2% |
| Native / Alaskan | 105 | 1.0% |
| White / Caucasian | 5,309 | 49.4% |
| Two or more Races | 2,153 | 20.0% |
| Some other Race | 1,116 | 10.4% |
| Total | 10,756 | 100.0% |
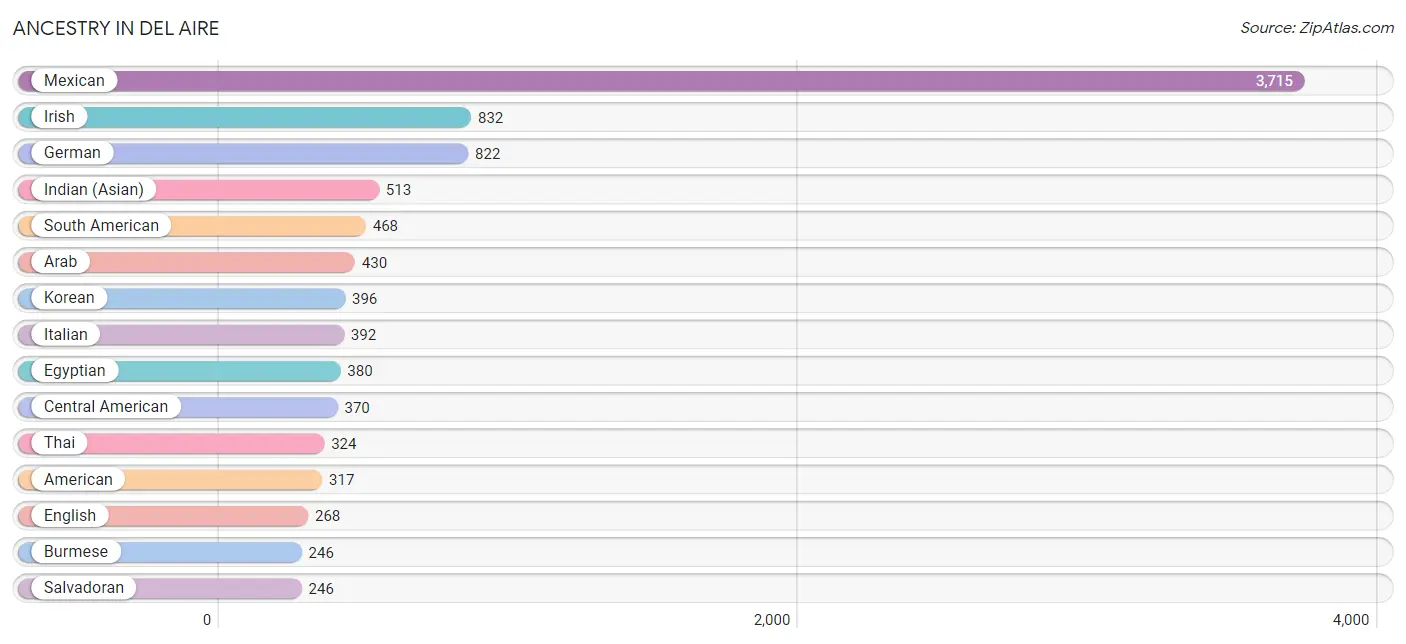
Ancestry in Del Aire
The most populous ancestries reported in Del Aire are Mexican (3,715 | 34.5%), Irish (832 | 7.7%), German (822 | 7.6%), Indian (Asian) (513 | 4.8%), and South American (468 | 4.3%), together accounting for 59.0% of all Del Aire residents.
| Ancestry | # Population | % Population |
| African | 6 | 0.1% |
| Albanian | 12 | 0.1% |
| American | 317 | 2.9% |
| Apache | 48 | 0.4% |
| Arab | 430 | 4.0% |
| Argentinean | 195 | 1.8% |
| Austrian | 11 | 0.1% |
| Belgian | 74 | 0.7% |
| Bhutanese | 219 | 2.0% |
| British | 33 | 0.3% |
| Burmese | 246 | 2.3% |
| Central American | 370 | 3.4% |
| Cherokee | 20 | 0.2% |
| Chilean | 10 | 0.1% |
| Colombian | 154 | 1.4% |
| Costa Rican | 6 | 0.1% |
| Cuban | 121 | 1.1% |
| Czech | 6 | 0.1% |
| Danish | 21 | 0.2% |
| Dutch | 71 | 0.7% |
| Eastern European | 17 | 0.2% |
| Ecuadorian | 38 | 0.4% |
| Egyptian | 380 | 3.5% |
| English | 268 | 2.5% |
| European | 186 | 1.7% |
| Filipino | 49 | 0.5% |
| Finnish | 26 | 0.2% |
| French | 233 | 2.2% |
| French Canadian | 60 | 0.6% |
| German | 822 | 7.6% |
| Guatemalan | 35 | 0.3% |
| Honduran | 35 | 0.3% |
| Hungarian | 49 | 0.5% |
| Indian (Asian) | 513 | 4.8% |
| Irish | 832 | 7.7% |
| Israeli | 41 | 0.4% |
| Italian | 392 | 3.6% |
| Jamaican | 97 | 0.9% |
| Korean | 396 | 3.7% |
| Lebanese | 10 | 0.1% |
| Malaysian | 69 | 0.6% |
| Mexican | 3,715 | 34.5% |
| Mexican American Indian | 76 | 0.7% |
| Mongolian | 8 | 0.1% |
| Native Hawaiian | 43 | 0.4% |
| Nicaraguan | 48 | 0.4% |
| Northern European | 29 | 0.3% |
| Norwegian | 57 | 0.5% |
| Pakistani | 27 | 0.3% |
| Pennsylvania German | 25 | 0.2% |
| Peruvian | 71 | 0.7% |
| Polish | 175 | 1.6% |
| Pueblo | 87 | 0.8% |
| Puerto Rican | 53 | 0.5% |
| Romanian | 8 | 0.1% |
| Russian | 103 | 1.0% |
| Salvadoran | 246 | 2.3% |
| Scandinavian | 16 | 0.2% |
| Scotch-Irish | 57 | 0.5% |
| Scottish | 27 | 0.3% |
| South American | 468 | 4.3% |
| Spanish | 48 | 0.4% |
| Sri Lankan | 177 | 1.7% |
| Subsaharan African | 6 | 0.1% |
| Swedish | 21 | 0.2% |
| Swiss | 40 | 0.4% |
| Syrian | 40 | 0.4% |
| Thai | 324 | 3.0% |
| Tongan | 13 | 0.1% |
| Turkish | 51 | 0.5% |
| Ukrainian | 1 | 0.0% |
| Welsh | 34 | 0.3% | View All 72 Rows |
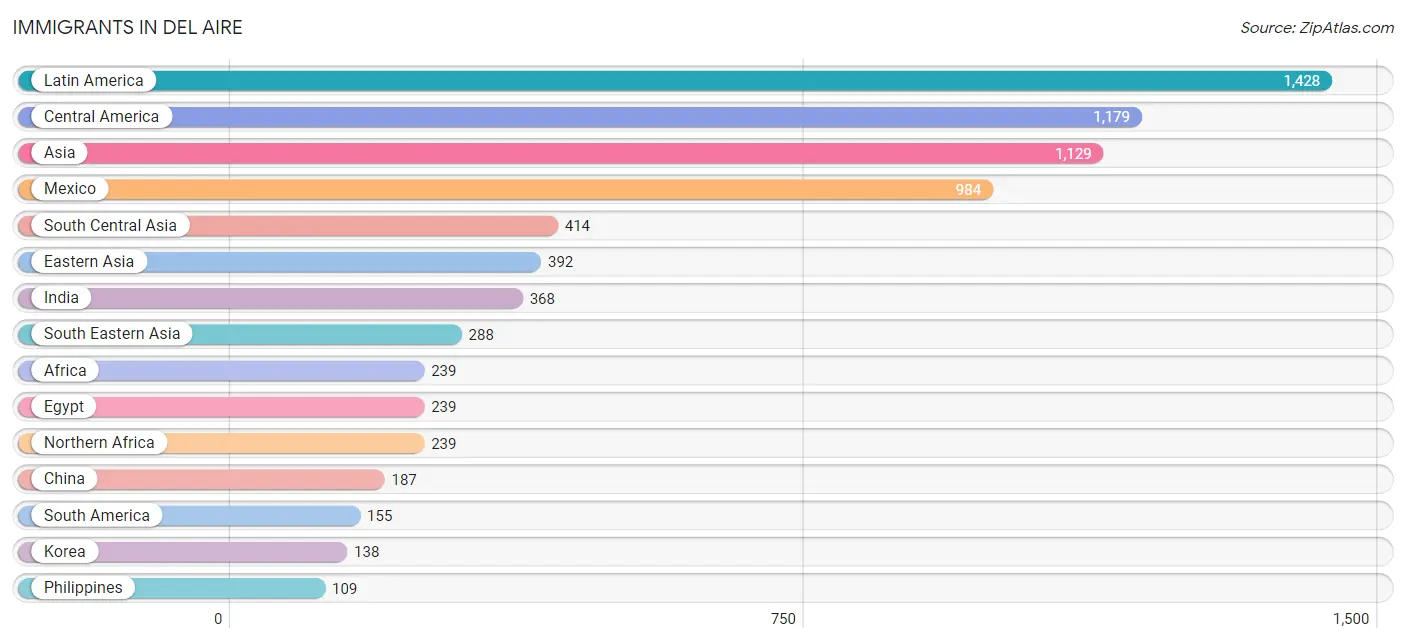
Immigrants in Del Aire
The most numerous immigrant groups reported in Del Aire came from Latin America (1,428 | 13.3%), Central America (1,179 | 11.0%), Asia (1,129 | 10.5%), Mexico (984 | 9.1%), and South Central Asia (414 | 3.8%), together accounting for 47.7% of all Del Aire residents.
| Immigration Origin | # Population | % Population |
| Africa | 239 | 2.2% |
| Argentina | 39 | 0.4% |
| Asia | 1,129 | 10.5% |
| Canada | 57 | 0.5% |
| Caribbean | 94 | 0.9% |
| Central America | 1,179 | 11.0% |
| Chile | 10 | 0.1% |
| China | 187 | 1.7% |
| Colombia | 97 | 0.9% |
| Costa Rica | 6 | 0.1% |
| Cuba | 75 | 0.7% |
| Czechoslovakia | 6 | 0.1% |
| Eastern Asia | 392 | 3.6% |
| Eastern Europe | 21 | 0.2% |
| Ecuador | 9 | 0.1% |
| Egypt | 239 | 2.2% |
| El Salvador | 37 | 0.3% |
| England | 17 | 0.2% |
| Europe | 74 | 0.7% |
| Guatemala | 53 | 0.5% |
| Honduras | 35 | 0.3% |
| Hong Kong | 16 | 0.2% |
| Hungary | 15 | 0.1% |
| India | 368 | 3.4% |
| Japan | 67 | 0.6% |
| Korea | 138 | 1.3% |
| Latin America | 1,428 | 13.3% |
| Malaysia | 19 | 0.2% |
| Mexico | 984 | 9.1% |
| Nepal | 23 | 0.2% |
| Nicaragua | 64 | 0.6% |
| Northern Africa | 239 | 2.2% |
| Northern Europe | 53 | 0.5% |
| Pakistan | 23 | 0.2% |
| Philippines | 109 | 1.0% |
| Singapore | 8 | 0.1% |
| South America | 155 | 1.4% |
| South Central Asia | 414 | 3.8% |
| South Eastern Asia | 288 | 2.7% |
| Taiwan | 21 | 0.2% |
| Thailand | 12 | 0.1% |
| Trinidad and Tobago | 19 | 0.2% |
| Turkey | 35 | 0.3% |
| Vietnam | 103 | 1.0% |
| Western Asia | 35 | 0.3% | View All 45 Rows |
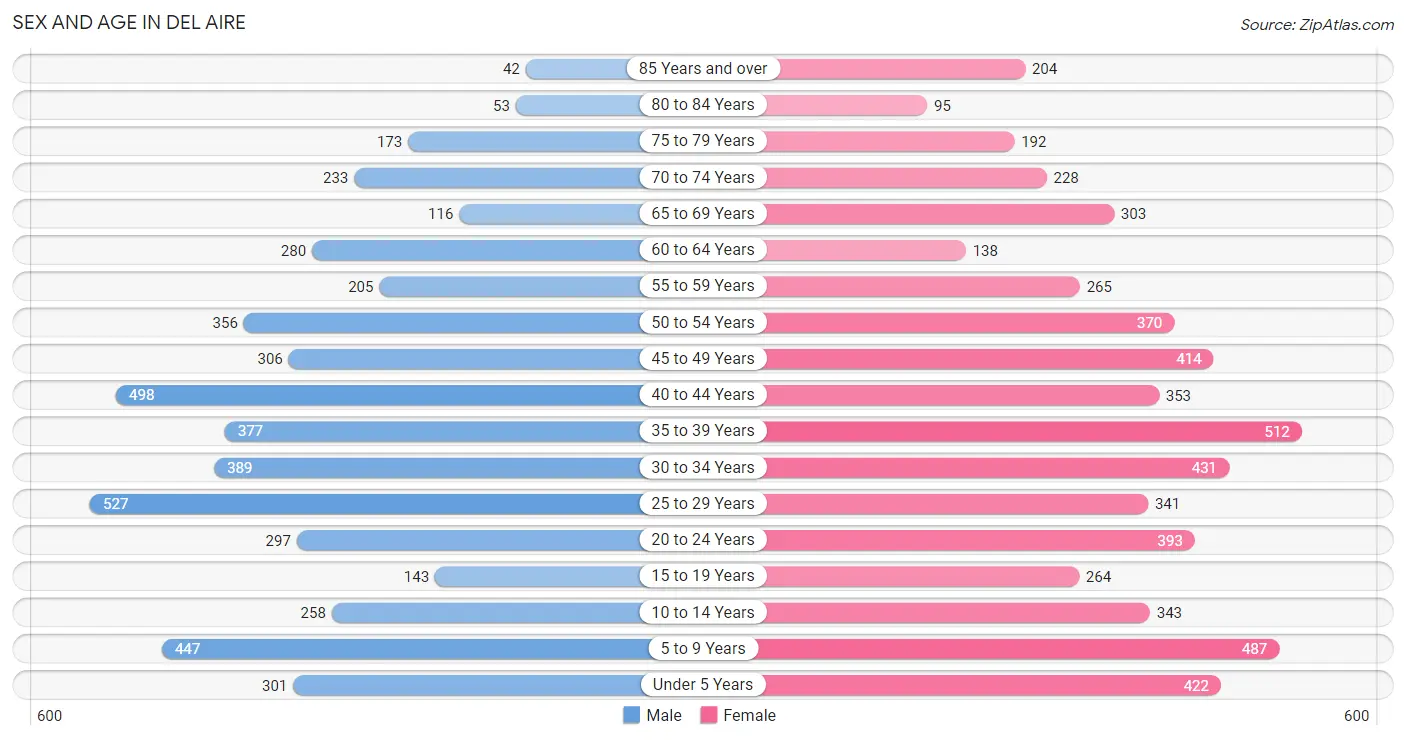
Sex and Age in Del Aire
Sex and Age in Del Aire
The most populous age groups in Del Aire are 25 to 29 Years (527 | 10.5%) for men and 35 to 39 Years (512 | 8.9%) for women.
| Age Bracket | Male | Female |
| Under 5 Years | 301 (6.0%) | 422 (7.3%) |
| 5 to 9 Years | 447 (8.9%) | 487 (8.5%) |
| 10 to 14 Years | 258 (5.2%) | 343 (6.0%) |
| 15 to 19 Years | 143 (2.9%) | 264 (4.6%) |
| 20 to 24 Years | 297 (5.9%) | 393 (6.8%) |
| 25 to 29 Years | 527 (10.5%) | 341 (5.9%) |
| 30 to 34 Years | 389 (7.8%) | 431 (7.5%) |
| 35 to 39 Years | 377 (7.5%) | 512 (8.9%) |
| 40 to 44 Years | 498 (10.0%) | 353 (6.1%) |
| 45 to 49 Years | 306 (6.1%) | 414 (7.2%) |
| 50 to 54 Years | 356 (7.1%) | 370 (6.4%) |
| 55 to 59 Years | 205 (4.1%) | 265 (4.6%) |
| 60 to 64 Years | 280 (5.6%) | 138 (2.4%) |
| 65 to 69 Years | 116 (2.3%) | 303 (5.3%) |
| 70 to 74 Years | 233 (4.7%) | 228 (4.0%) |
| 75 to 79 Years | 173 (3.5%) | 192 (3.3%) |
| 80 to 84 Years | 53 (1.1%) | 95 (1.7%) |
| 85 Years and over | 42 (0.8%) | 204 (3.5%) |
| Total | 5,001 (100.0%) | 5,755 (100.0%) |
Families and Households in Del Aire
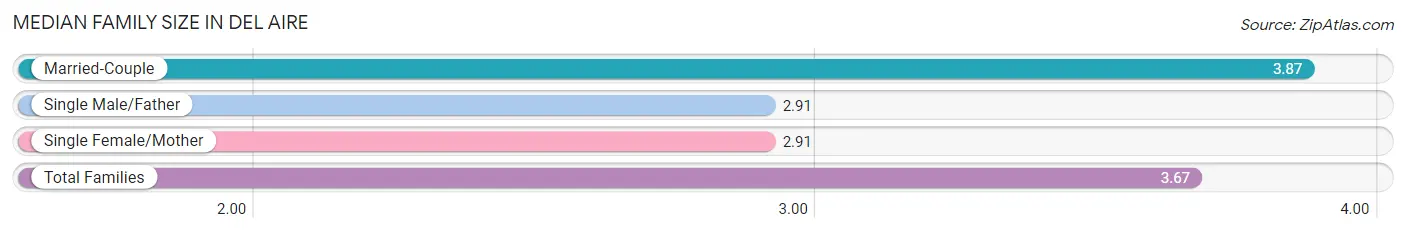
Median Family Size in Del Aire
The median family size in Del Aire is 3.67 persons per family, with married-couple families (2,014 | 79.3%) accounting for the largest median family size of 3.87 persons per family. On the other hand, single male/father families (121 | 4.8%) represent the smallest median family size with 2.91 persons per family.
| Family Type | # Families | Family Size |
| Married-Couple | 2,014 (79.3%) | 3.87 |
| Single Male/Father | 121 (4.8%) | 2.91 |
| Single Female/Mother | 404 (15.9%) | 2.91 |
| Total Families | 2,539 (100.0%) | 3.67 |
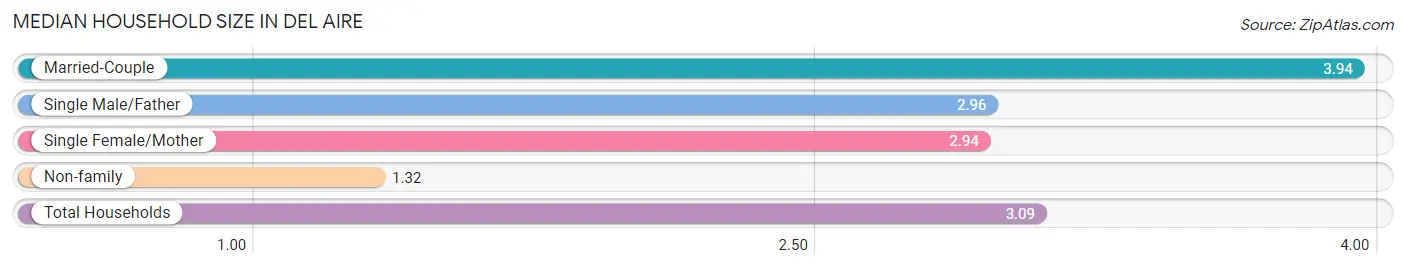
Median Household Size in Del Aire
The median household size in Del Aire is 3.09 persons per household, with married-couple households (2,014 | 58.1%) accounting for the largest median household size of 3.94 persons per household. non-family households (928 | 26.8%) represent the smallest median household size with 1.32 persons per household.
| Household Type | # Households | Household Size |
| Married-Couple | 2,014 (58.1%) | 3.94 |
| Single Male/Father | 121 (3.5%) | 2.96 |
| Single Female/Mother | 404 (11.7%) | 2.94 |
| Non-family | 928 (26.8%) | 1.32 |
| Total Households | 3,467 (100.0%) | 3.09 |
Household Size by Marriage Status in Del Aire
Out of a total of 3,467 households in Del Aire, 2,539 (73.2%) are family households, while 928 (26.8%) are nonfamily households. The most numerous type of family households are 2-person households, comprising 829, and the most common type of nonfamily households are 1-person households, comprising 669.
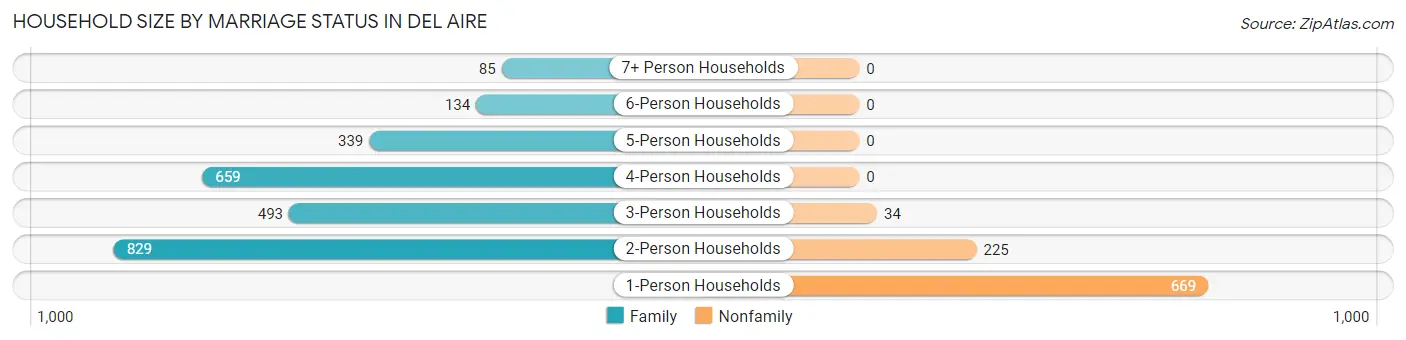
| Household Size | Family Households | Nonfamily Households |
| 1-Person Households | - | 669 (19.3%) |
| 2-Person Households | 829 (23.9%) | 225 (6.5%) |
| 3-Person Households | 493 (14.2%) | 34 (1.0%) |
| 4-Person Households | 659 (19.0%) | 0 (0.0%) |
| 5-Person Households | 339 (9.8%) | 0 (0.0%) |
| 6-Person Households | 134 (3.9%) | 0 (0.0%) |
| 7+ Person Households | 85 (2.5%) | 0 (0.0%) |
| Total | 2,539 (73.2%) | 928 (26.8%) |
Female Fertility in Del Aire
Fertility by Age in Del Aire
Average fertility rate in Del Aire is 99.0 births per 1,000 women. Women in the age bracket of 20 to 34 years have the highest fertility rate with 127.0 births per 1,000 women. Women in the age bracket of 20 to 34 years acount for 53.8% of all women with births.
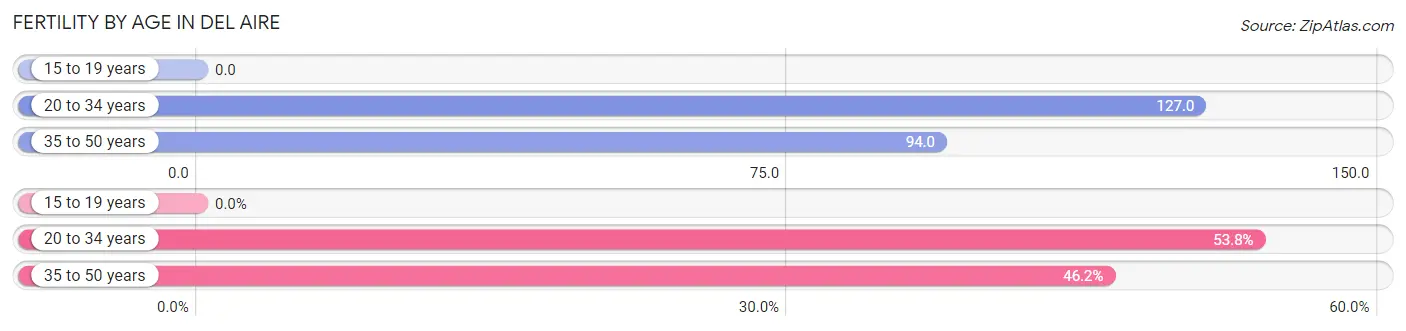
| Age Bracket | Women with Births | Births / 1,000 Women |
| 15 to 19 years | 0 (0.0%) | 0.0 |
| 20 to 34 years | 148 (53.8%) | 127.0 |
| 35 to 50 years | 127 (46.2%) | 94.0 |
| Total | 275 (100.0%) | 99.0 |
Fertility by Age by Marriage Status in Del Aire
70.2% of women with births (275) in Del Aire are married. The highest percentage of unmarried women with births falls into 20 to 34 years age bracket with 48.6% of them unmarried at the time of birth, while the lowest percentage of unmarried women with births belong to 35 to 50 years age bracket with 7.9% of them unmarried.
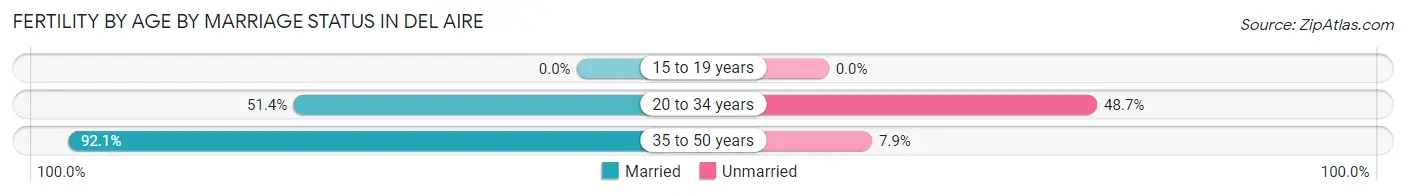
| Age Bracket | Married | Unmarried |
| 15 to 19 years | 0 (0.0%) | 0 (0.0%) |
| 20 to 34 years | 76 (51.3%) | 72 (48.6%) |
| 35 to 50 years | 117 (92.1%) | 10 (7.9%) |
| Total | 193 (70.2%) | 82 (29.8%) |
Fertility by Education in Del Aire
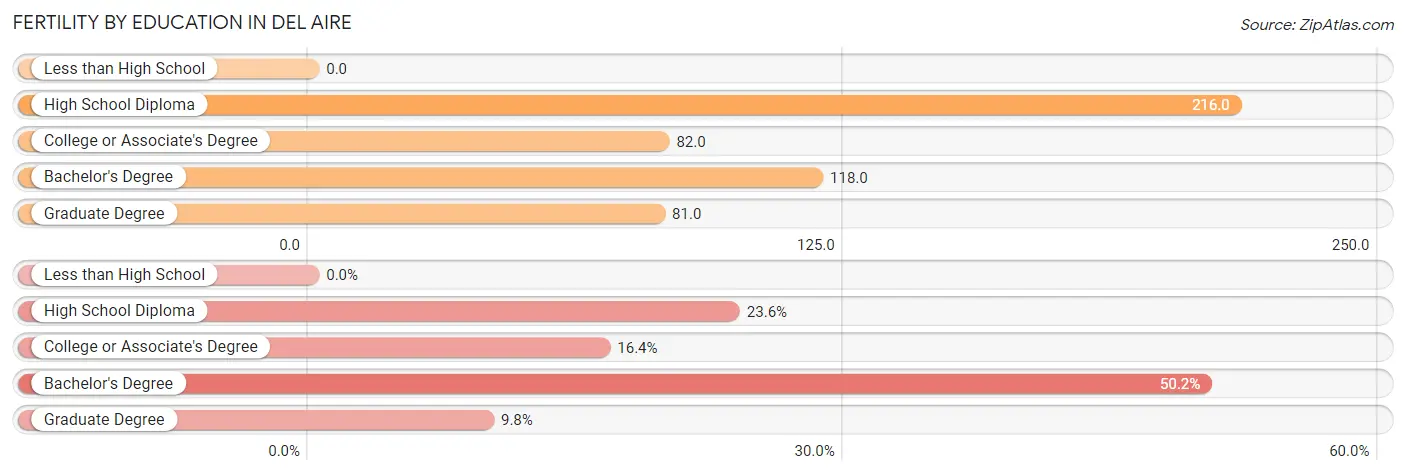
| Educational Attainment | Women with Births | Births / 1,000 Women |
| Less than High School | 0 (0.0%) | 0.0 |
| High School Diploma | 65 (23.6%) | 216.0 |
| College or Associate's Degree | 45 (16.4%) | 82.0 |
| Bachelor's Degree | 138 (50.2%) | 118.0 |
| Graduate Degree | 27 (9.8%) | 81.0 |
| Total | 275 (100.0%) | 99.0 |
Fertility by Education by Marriage Status in Del Aire
29.8% of women with births in Del Aire are unmarried. Women with the educational attainment of high school diploma are most likely to be married with 100.0% of them married at childbirth, while women with the educational attainment of college or associate's degree are least likely to be married with 57.8% of them unmarried at childbirth.
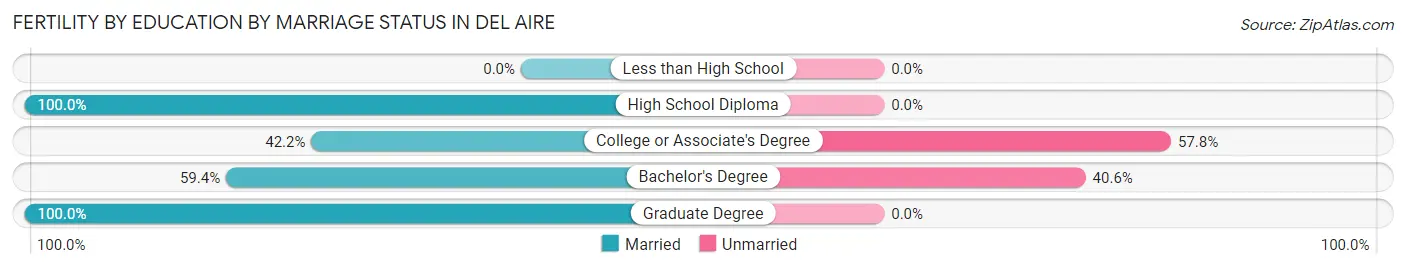
| Educational Attainment | Married | Unmarried |
| Less than High School | 0 (0.0%) | 0 (0.0%) |
| High School Diploma | 65 (100.0%) | 0 (0.0%) |
| College or Associate's Degree | 19 (42.2%) | 26 (57.8%) |
| Bachelor's Degree | 82 (59.4%) | 56 (40.6%) |
| Graduate Degree | 27 (100.0%) | 0 (0.0%) |
| Total | 193 (70.2%) | 82 (29.8%) |
Employment Characteristics in Del Aire
Employment by Class of Employer in Del Aire
Among the 5,221 employed individuals in Del Aire, private company employees (3,456 | 66.2%), local government employees (521 | 10.0%), and not-for-profit organizations (487 | 9.3%) make up the most common classes of employment.
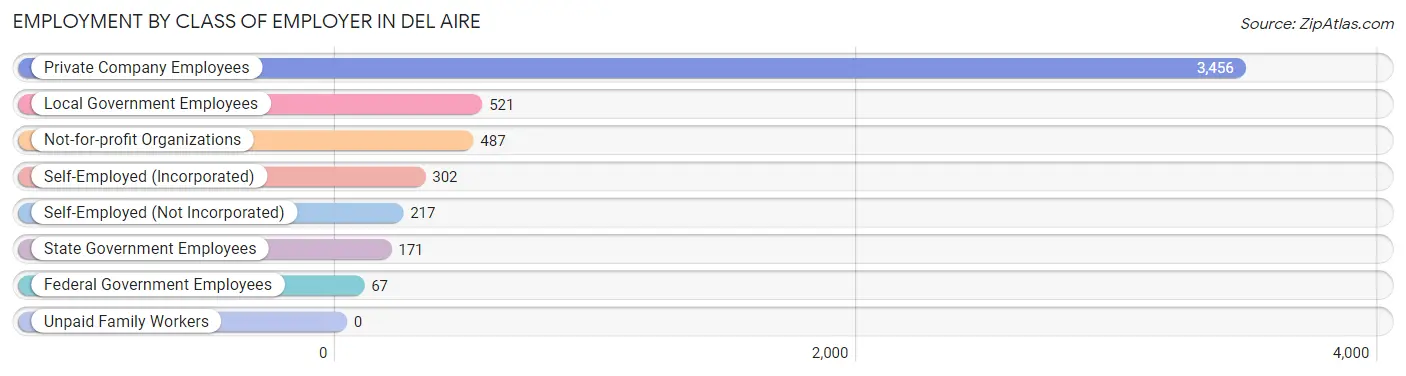
| Employer Class | # Employees | % Employees |
| Private Company Employees | 3,456 | 66.2% |
| Self-Employed (Incorporated) | 302 | 5.8% |
| Self-Employed (Not Incorporated) | 217 | 4.2% |
| Not-for-profit Organizations | 487 | 9.3% |
| Local Government Employees | 521 | 10.0% |
| State Government Employees | 171 | 3.3% |
| Federal Government Employees | 67 | 1.3% |
| Unpaid Family Workers | 0 | 0.0% |
| Total | 5,221 | 100.0% |
Employment Status by Age in Del Aire
According to the labor force statistics for Del Aire, out of the total population over 16 years of age (8,371), 67.1% or 5,617 individuals are in the labor force, with 2.8% or 157 of them unemployed. The age group with the highest labor force participation rate is 30 to 34 years, with 97.0% or 795 individuals in the labor force. Within the labor force, the 75 years and over age range has the highest percentage of unemployed individuals, with 11.8% or 9 of them being unemployed.
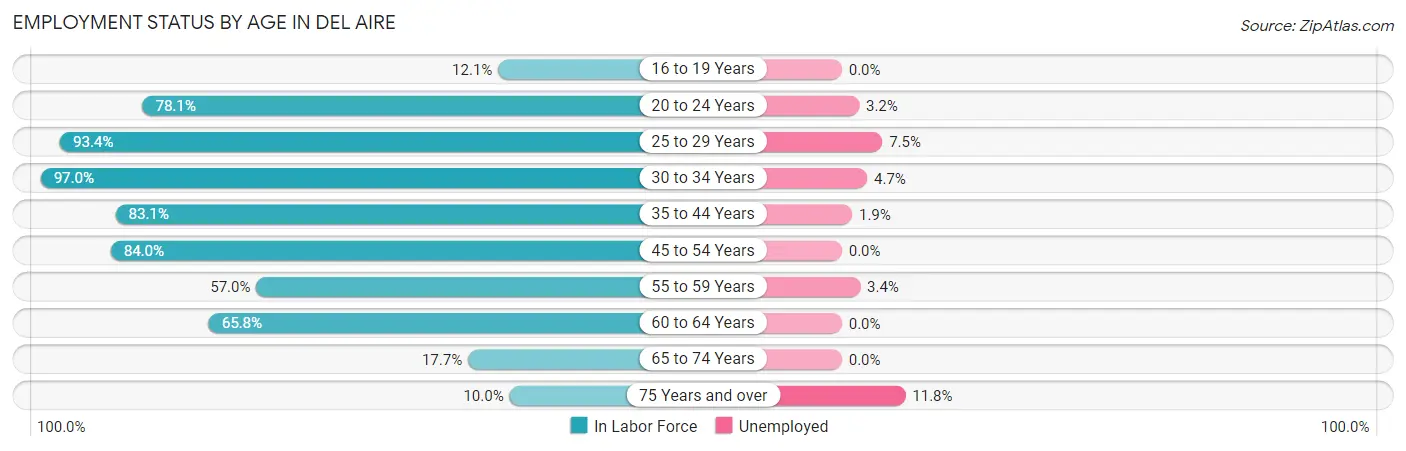
| Age Bracket | In Labor Force | Unemployed |
| 16 to 19 Years | 34 (12.1%) | 0 (0.0%) |
| 20 to 24 Years | 539 (78.1%) | 17 (3.2%) |
| 25 to 29 Years | 811 (93.4%) | 61 (7.5%) |
| 30 to 34 Years | 795 (97.0%) | 37 (4.7%) |
| 35 to 44 Years | 1,446 (83.1%) | 27 (1.9%) |
| 45 to 54 Years | 1,215 (84.0%) | 0 (0.0%) |
| 55 to 59 Years | 268 (57.0%) | 9 (3.4%) |
| 60 to 64 Years | 275 (65.8%) | 0 (0.0%) |
| 65 to 74 Years | 156 (17.7%) | 0 (0.0%) |
| 75 Years and over | 76 (10.0%) | 9 (11.8%) |
| Total | 5,617 (67.1%) | 157 (2.8%) |
Employment Status by Educational Attainment in Del Aire
According to labor force statistics for Del Aire, 83.5% of individuals (4,811) out of the total population between 25 and 64 years of age (5,762) are in the labor force, with 2.8% or 135 of them being unemployed. The group with the highest labor force participation rate are those with the educational attainment of bachelor's degree or higher, with 94.0% or 2,502 individuals in the labor force. Within the labor force, individuals with high school diploma education have the highest percentage of unemployment, with 6.5% or 38 of them being unemployed.
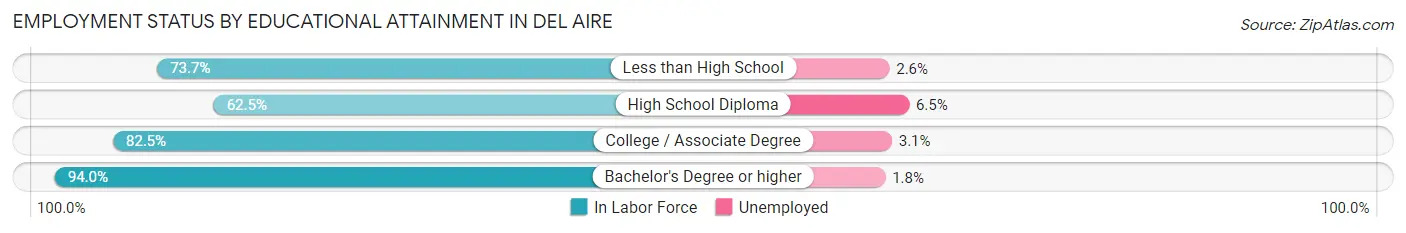
| Educational Attainment | In Labor Force | Unemployed |
| Less than High School | 509 (73.7%) | 18 (2.6%) |
| High School Diploma | 584 (62.5%) | 61 (6.5%) |
| College / Associate Degree | 1,216 (82.5%) | 46 (3.1%) |
| Bachelor's Degree or higher | 2,502 (94.0%) | 48 (1.8%) |
| Total | 4,811 (83.5%) | 161 (2.8%) |
Employment Occupations by Sex in Del Aire
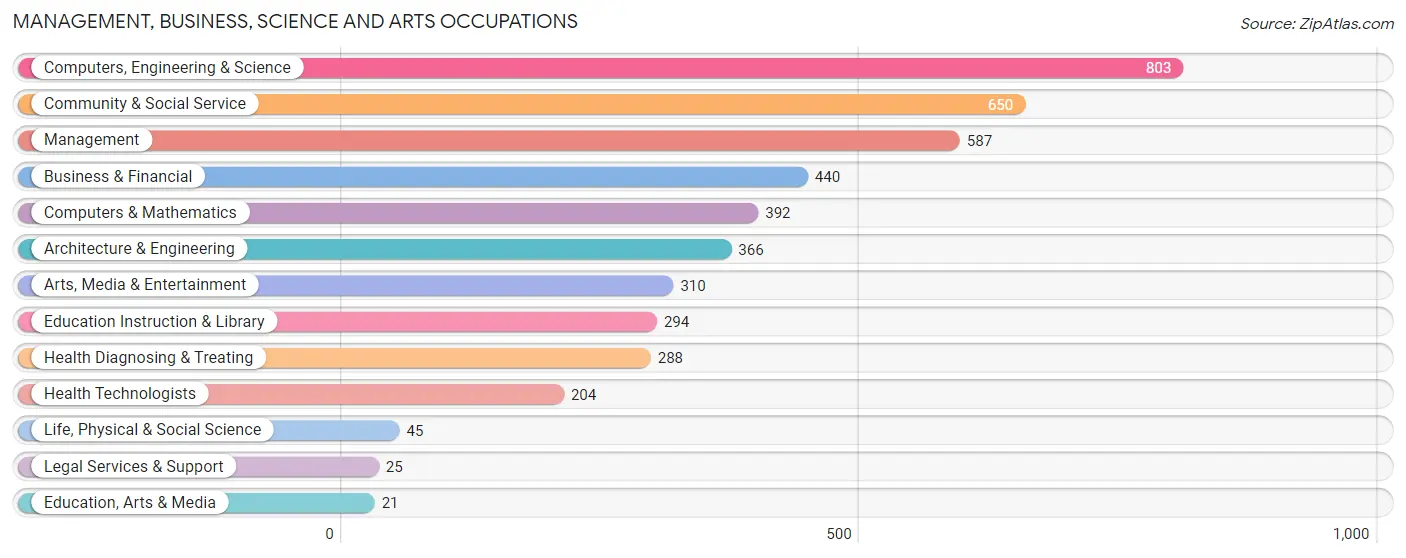
Management, Business, Science and Arts Occupations
The most common Management, Business, Science and Arts occupations in Del Aire are Computers, Engineering & Science (803 | 14.8%), Community & Social Service (650 | 12.0%), Management (587 | 10.8%), Business & Financial (440 | 8.1%), and Computers & Mathematics (392 | 7.2%).
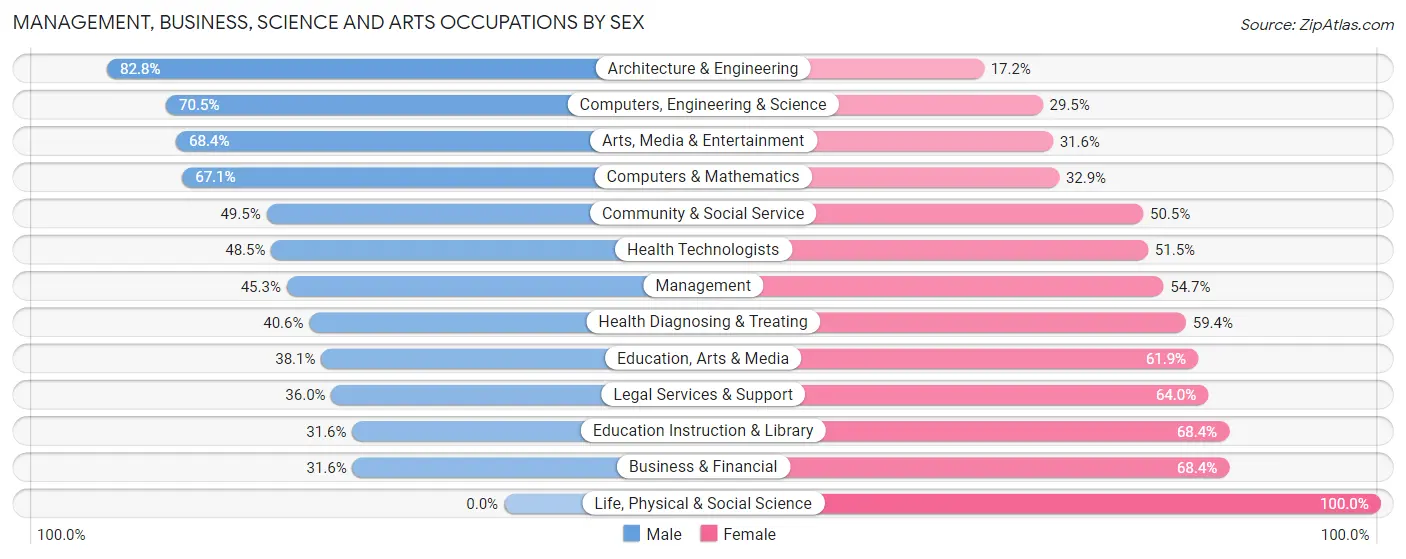
Management, Business, Science and Arts Occupations by Sex
Within the Management, Business, Science and Arts occupations in Del Aire, the most male-oriented occupations are Architecture & Engineering (82.8%), Computers, Engineering & Science (70.5%), and Arts, Media & Entertainment (68.4%), while the most female-oriented occupations are Life, Physical & Social Science (100.0%), Business & Financial (68.4%), and Education Instruction & Library (68.4%).
| Occupation | Male | Female |
| Management | 266 (45.3%) | 321 (54.7%) |
| Business & Financial | 139 (31.6%) | 301 (68.4%) |
| Computers, Engineering & Science | 566 (70.5%) | 237 (29.5%) |
| Computers & Mathematics | 263 (67.1%) | 129 (32.9%) |
| Architecture & Engineering | 303 (82.8%) | 63 (17.2%) |
| Life, Physical & Social Science | 0 (0.0%) | 45 (100.0%) |
| Community & Social Service | 322 (49.5%) | 328 (50.5%) |
| Education, Arts & Media | 8 (38.1%) | 13 (61.9%) |
| Legal Services & Support | 9 (36.0%) | 16 (64.0%) |
| Education Instruction & Library | 93 (31.6%) | 201 (68.4%) |
| Arts, Media & Entertainment | 212 (68.4%) | 98 (31.6%) |
| Health Diagnosing & Treating | 117 (40.6%) | 171 (59.4%) |
| Health Technologists | 99 (48.5%) | 105 (51.5%) |
| Total (Category) | 1,410 (50.9%) | 1,358 (49.1%) |
| Total (Overall) | 2,947 (54.2%) | 2,487 (45.8%) |
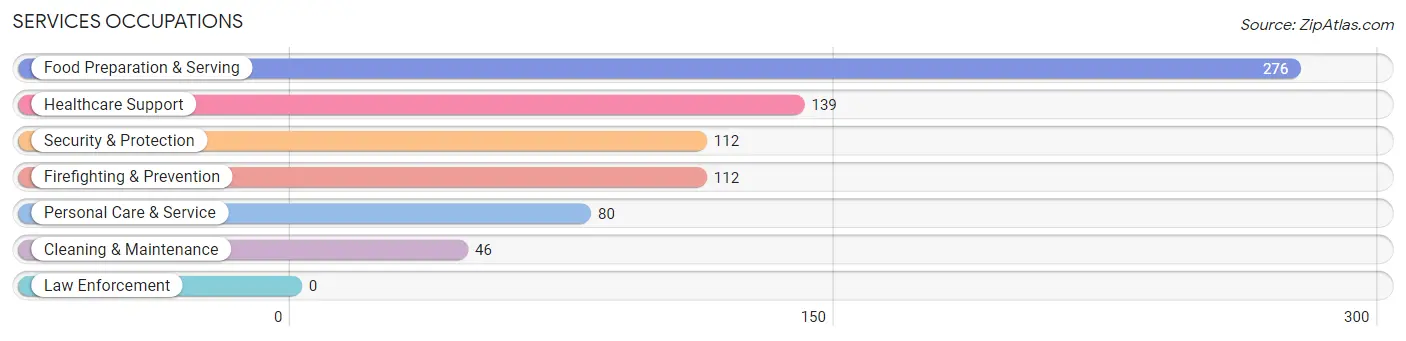
Services Occupations
The most common Services occupations in Del Aire are Food Preparation & Serving (276 | 5.1%), Healthcare Support (139 | 2.6%), Security & Protection (112 | 2.1%), Firefighting & Prevention (112 | 2.1%), and Personal Care & Service (80 | 1.5%).
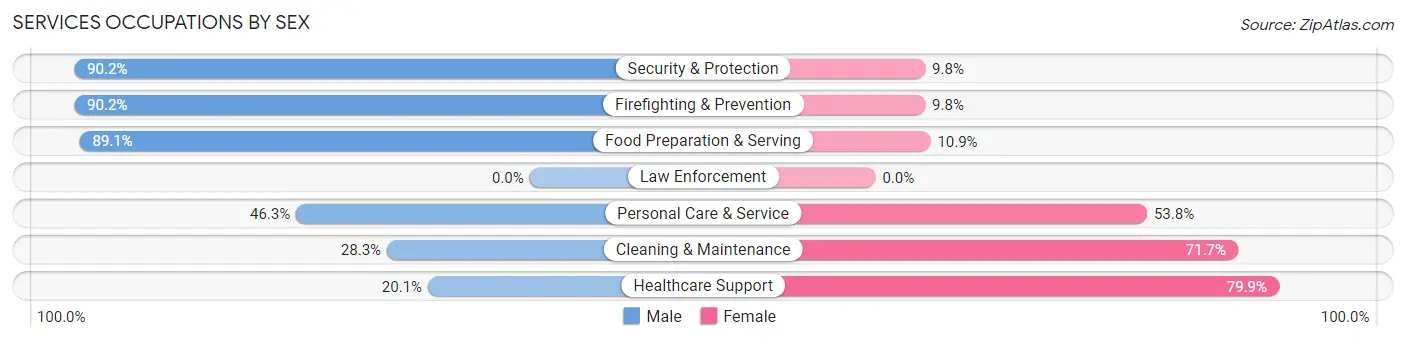
Services Occupations by Sex
Within the Services occupations in Del Aire, the most male-oriented occupations are Security & Protection (90.2%), Firefighting & Prevention (90.2%), and Food Preparation & Serving (89.1%), while the most female-oriented occupations are Healthcare Support (79.9%), Cleaning & Maintenance (71.7%), and Personal Care & Service (53.7%).
| Occupation | Male | Female |
| Healthcare Support | 28 (20.1%) | 111 (79.9%) |
| Security & Protection | 101 (90.2%) | 11 (9.8%) |
| Firefighting & Prevention | 101 (90.2%) | 11 (9.8%) |
| Law Enforcement | 0 (0.0%) | 0 (0.0%) |
| Food Preparation & Serving | 246 (89.1%) | 30 (10.9%) |
| Cleaning & Maintenance | 13 (28.3%) | 33 (71.7%) |
| Personal Care & Service | 37 (46.3%) | 43 (53.7%) |
| Total (Category) | 425 (65.1%) | 228 (34.9%) |
| Total (Overall) | 2,947 (54.2%) | 2,487 (45.8%) |
Sales and Office Occupations
The most common Sales and Office occupations in Del Aire are Office & Administration (707 | 13.0%), and Sales & Related (545 | 10.0%).

Sales and Office Occupations by Sex
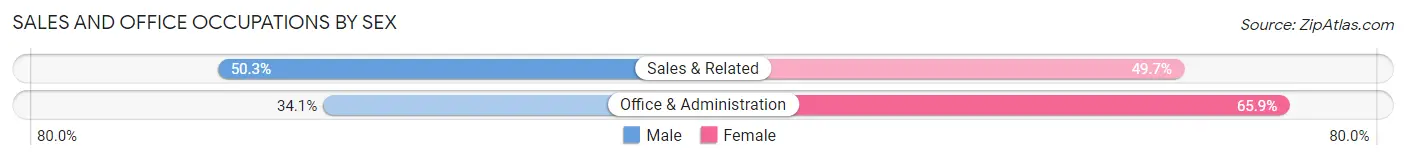
| Occupation | Male | Female |
| Sales & Related | 274 (50.3%) | 271 (49.7%) |
| Office & Administration | 241 (34.1%) | 466 (65.9%) |
| Total (Category) | 515 (41.1%) | 737 (58.9%) |
| Total (Overall) | 2,947 (54.2%) | 2,487 (45.8%) |
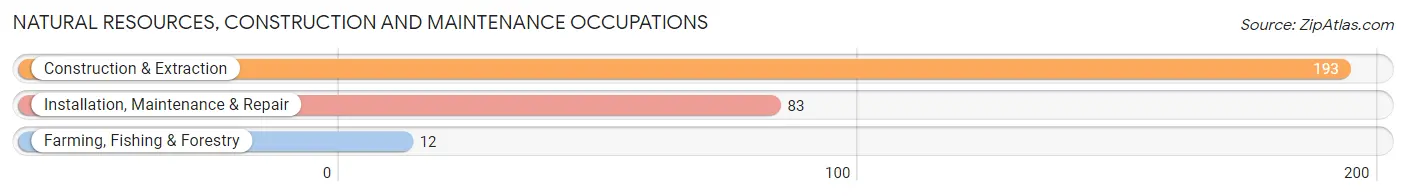
Natural Resources, Construction and Maintenance Occupations
The most common Natural Resources, Construction and Maintenance occupations in Del Aire are Construction & Extraction (193 | 3.5%), Installation, Maintenance & Repair (83 | 1.5%), and Farming, Fishing & Forestry (12 | 0.2%).
Natural Resources, Construction and Maintenance Occupations by Sex
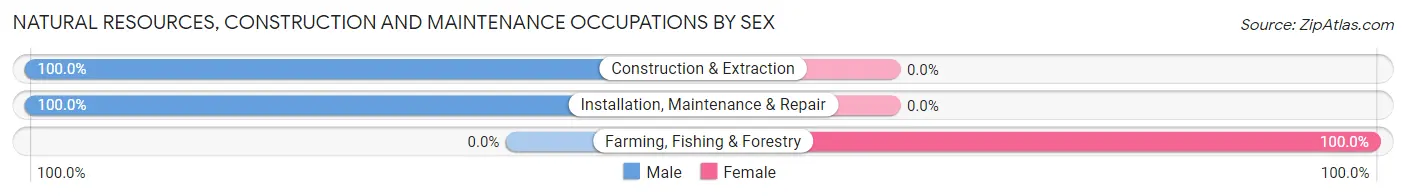
| Occupation | Male | Female |
| Farming, Fishing & Forestry | 0 (0.0%) | 12 (100.0%) |
| Construction & Extraction | 193 (100.0%) | 0 (0.0%) |
| Installation, Maintenance & Repair | 83 (100.0%) | 0 (0.0%) |
| Total (Category) | 276 (95.8%) | 12 (4.2%) |
| Total (Overall) | 2,947 (54.2%) | 2,487 (45.8%) |
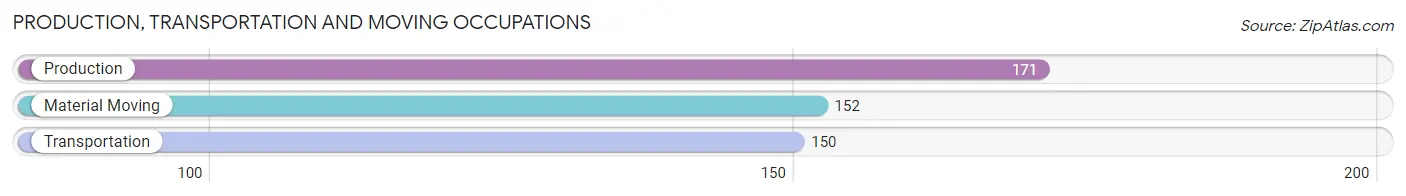
Production, Transportation and Moving Occupations
The most common Production, Transportation and Moving occupations in Del Aire are Production (171 | 3.2%), Material Moving (152 | 2.8%), and Transportation (150 | 2.8%).
Production, Transportation and Moving Occupations by Sex
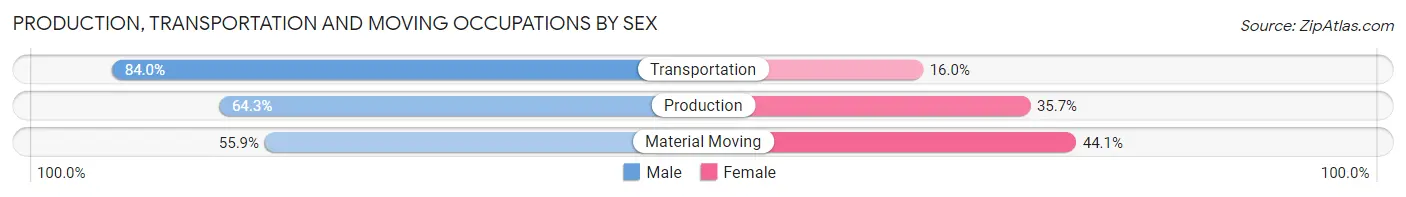
| Occupation | Male | Female |
| Production | 110 (64.3%) | 61 (35.7%) |
| Transportation | 126 (84.0%) | 24 (16.0%) |
| Material Moving | 85 (55.9%) | 67 (44.1%) |
| Total (Category) | 321 (67.9%) | 152 (32.1%) |
| Total (Overall) | 2,947 (54.2%) | 2,487 (45.8%) |
Employment Industries by Sex in Del Aire
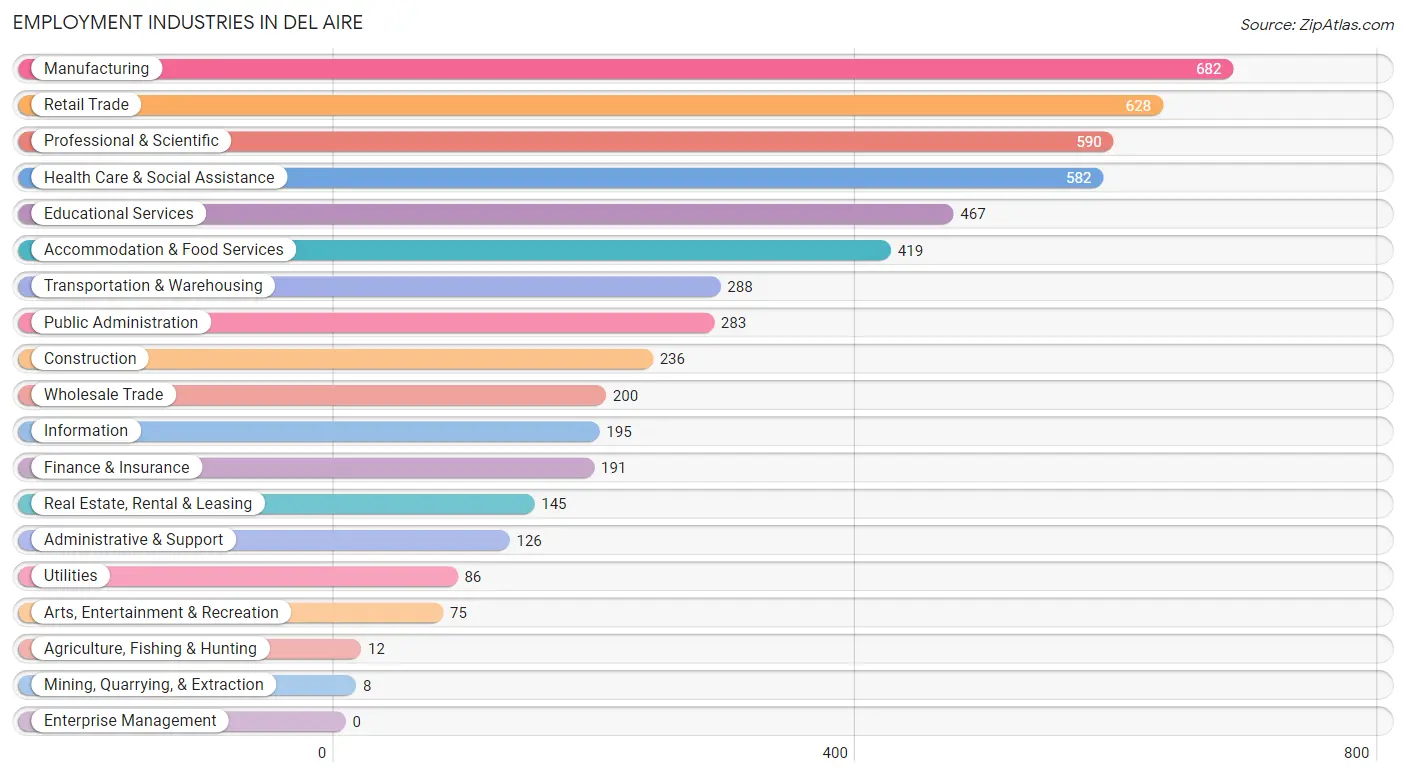
Employment Industries in Del Aire
The major employment industries in Del Aire include Manufacturing (682 | 12.6%), Retail Trade (628 | 11.6%), Professional & Scientific (590 | 10.9%), Health Care & Social Assistance (582 | 10.7%), and Educational Services (467 | 8.6%).
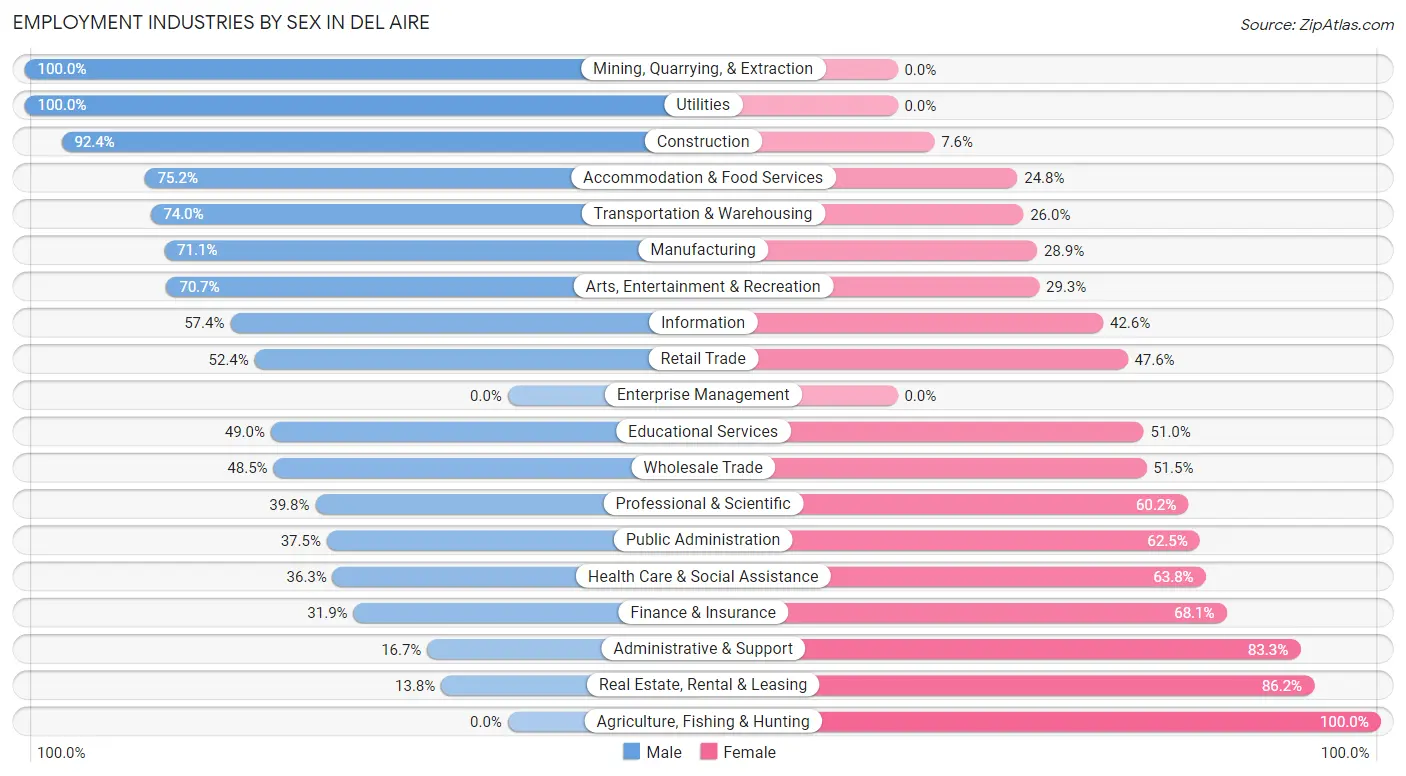
Employment Industries by Sex in Del Aire
The Del Aire industries that see more men than women are Mining, Quarrying, & Extraction (100.0%), Utilities (100.0%), and Construction (92.4%), whereas the industries that tend to have a higher number of women are Agriculture, Fishing & Hunting (100.0%), Real Estate, Rental & Leasing (86.2%), and Administrative & Support (83.3%).
| Industry | Male | Female |
| Agriculture, Fishing & Hunting | 0 (0.0%) | 12 (100.0%) |
| Mining, Quarrying, & Extraction | 8 (100.0%) | 0 (0.0%) |
| Construction | 218 (92.4%) | 18 (7.6%) |
| Manufacturing | 485 (71.1%) | 197 (28.9%) |
| Wholesale Trade | 97 (48.5%) | 103 (51.5%) |
| Retail Trade | 329 (52.4%) | 299 (47.6%) |
| Transportation & Warehousing | 213 (74.0%) | 75 (26.0%) |
| Utilities | 86 (100.0%) | 0 (0.0%) |
| Information | 112 (57.4%) | 83 (42.6%) |
| Finance & Insurance | 61 (31.9%) | 130 (68.1%) |
| Real Estate, Rental & Leasing | 20 (13.8%) | 125 (86.2%) |
| Professional & Scientific | 235 (39.8%) | 355 (60.2%) |
| Enterprise Management | 0 (0.0%) | 0 (0.0%) |
| Administrative & Support | 21 (16.7%) | 105 (83.3%) |
| Educational Services | 229 (49.0%) | 238 (51.0%) |
| Health Care & Social Assistance | 211 (36.2%) | 371 (63.7%) |
| Arts, Entertainment & Recreation | 53 (70.7%) | 22 (29.3%) |
| Accommodation & Food Services | 315 (75.2%) | 104 (24.8%) |
| Public Administration | 106 (37.5%) | 177 (62.5%) |
| Total | 2,947 (54.2%) | 2,487 (45.8%) |
Education in Del Aire
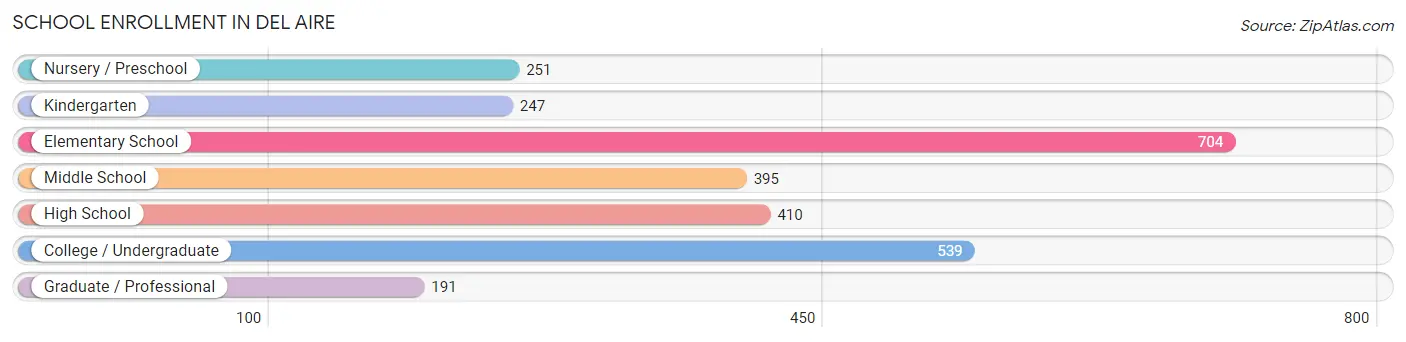
School Enrollment in Del Aire
The most common levels of schooling among the 2,737 students in Del Aire are elementary school (704 | 25.7%), college / undergraduate (539 | 19.7%), and high school (410 | 15.0%).
| School Level | # Students | % Students |
| Nursery / Preschool | 251 | 9.2% |
| Kindergarten | 247 | 9.0% |
| Elementary School | 704 | 25.7% |
| Middle School | 395 | 14.4% |
| High School | 410 | 15.0% |
| College / Undergraduate | 539 | 19.7% |
| Graduate / Professional | 191 | 7.0% |
| Total | 2,737 | 100.0% |
School Enrollment by Age by Funding Source in Del Aire
Out of a total of 2,737 students who are enrolled in schools in Del Aire, 438 (16.0%) attend a private institution, while the remaining 2,299 (84.0%) are enrolled in public schools. The age group of 25 to 34 year olds has the highest likelihood of being enrolled in private schools, with 116 (46.2% in the age bracket) enrolled. Conversely, the age group of 15 to 17 year olds has the lowest likelihood of being enrolled in a private school, with 253 (96.2% in the age bracket) attending a public institution.
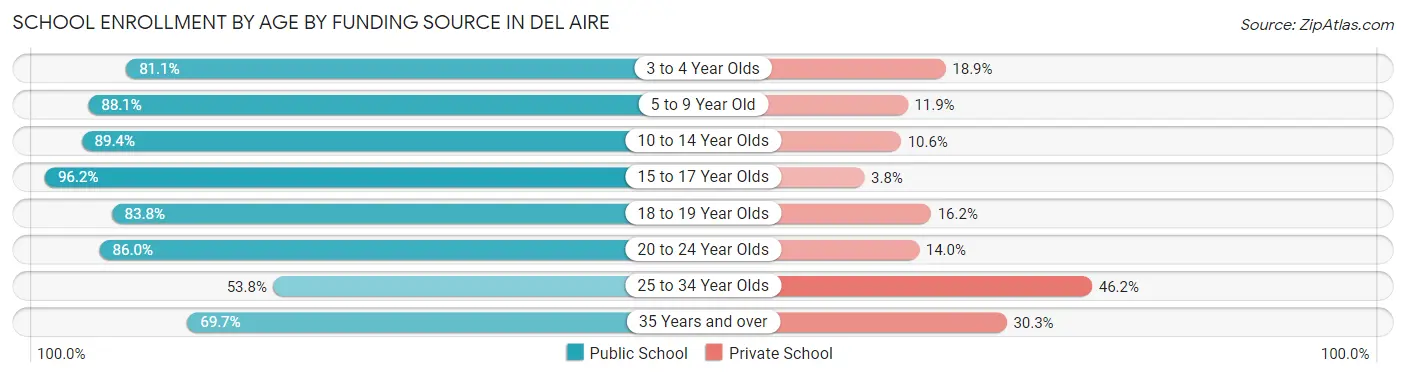
| Age Bracket | Public School | Private School |
| 3 to 4 Year Olds | 107 (81.1%) | 25 (18.9%) |
| 5 to 9 Year Old | 823 (88.1%) | 111 (11.9%) |
| 10 to 14 Year Olds | 505 (89.4%) | 60 (10.6%) |
| 15 to 17 Year Olds | 253 (96.2%) | 10 (3.8%) |
| 18 to 19 Year Olds | 93 (83.8%) | 18 (16.2%) |
| 20 to 24 Year Olds | 252 (86.0%) | 41 (14.0%) |
| 25 to 34 Year Olds | 135 (53.8%) | 116 (46.2%) |
| 35 Years and over | 131 (69.7%) | 57 (30.3%) |
| Total | 2,299 (84.0%) | 438 (16.0%) |
Educational Attainment by Field of Study in Del Aire
Business (779 | 23.6%), engineering (362 | 11.0%), computers & mathematics (341 | 10.3%), social sciences (274 | 8.3%), and communications (247 | 7.5%) are the most common fields of study among 3,302 individuals in Del Aire who have obtained a bachelor's degree or higher.
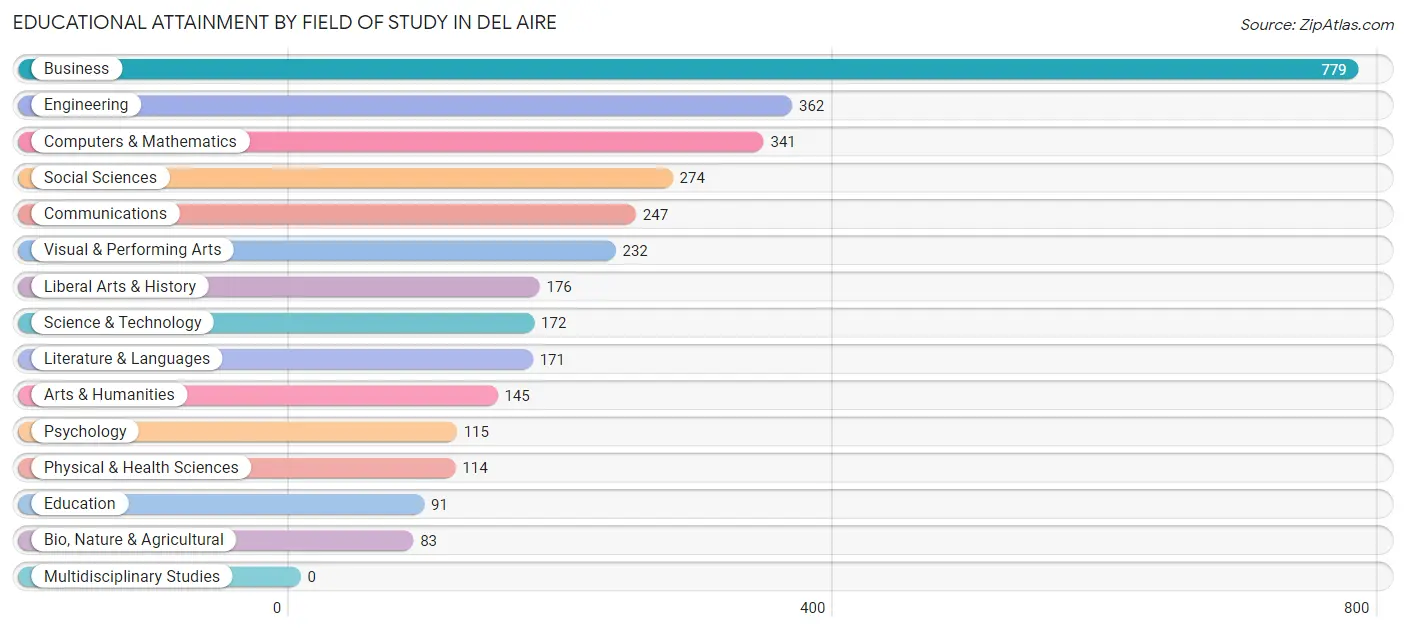
| Field of Study | # Graduates | % Graduates |
| Computers & Mathematics | 341 | 10.3% |
| Bio, Nature & Agricultural | 83 | 2.5% |
| Physical & Health Sciences | 114 | 3.5% |
| Psychology | 115 | 3.5% |
| Social Sciences | 274 | 8.3% |
| Engineering | 362 | 11.0% |
| Multidisciplinary Studies | 0 | 0.0% |
| Science & Technology | 172 | 5.2% |
| Business | 779 | 23.6% |
| Education | 91 | 2.8% |
| Literature & Languages | 171 | 5.2% |
| Liberal Arts & History | 176 | 5.3% |
| Visual & Performing Arts | 232 | 7.0% |
| Communications | 247 | 7.5% |
| Arts & Humanities | 145 | 4.4% |
| Total | 3,302 | 100.0% |
Transportation & Commute in Del Aire
Vehicle Availability by Sex in Del Aire
The most prevalent vehicle ownership categories in Del Aire are males with 2 vehicles (1,029, accounting for 35.7%) and females with 2 vehicles (948, making up 44.4%).
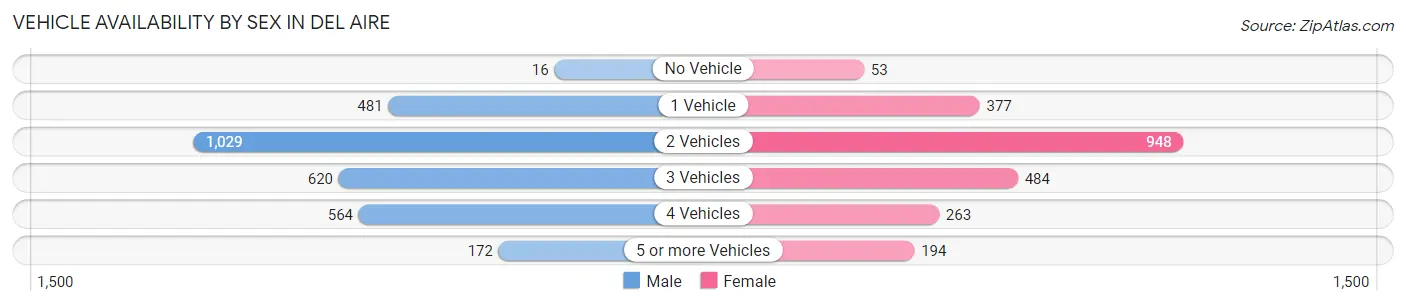
| Vehicles Available | Male | Female |
| No Vehicle | 16 (0.6%) | 53 (2.3%) |
| 1 Vehicle | 481 (16.7%) | 377 (16.3%) |
| 2 Vehicles | 1,029 (35.7%) | 948 (40.9%) |
| 3 Vehicles | 620 (21.5%) | 484 (20.9%) |
| 4 Vehicles | 564 (19.6%) | 263 (11.3%) |
| 5 or more Vehicles | 172 (6.0%) | 194 (8.4%) |
| Total | 2,882 (100.0%) | 2,319 (100.0%) |
Commute Time in Del Aire
The most frequently occuring commute durations in Del Aire are 15 to 19 minutes (790 commuters, 17.9%), 10 to 14 minutes (691 commuters, 15.6%), and 20 to 24 minutes (690 commuters, 15.6%).
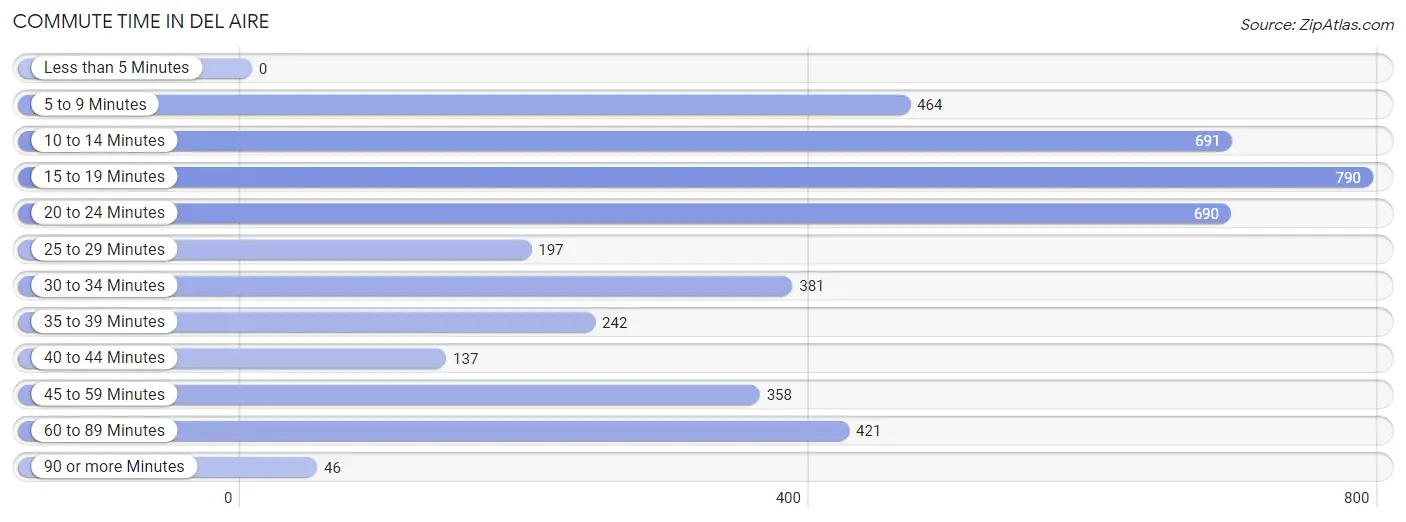
| Commute Time | # Commuters | % Commuters |
| Less than 5 Minutes | 0 | 0.0% |
| 5 to 9 Minutes | 464 | 10.5% |
| 10 to 14 Minutes | 691 | 15.6% |
| 15 to 19 Minutes | 790 | 17.9% |
| 20 to 24 Minutes | 690 | 15.6% |
| 25 to 29 Minutes | 197 | 4.5% |
| 30 to 34 Minutes | 381 | 8.6% |
| 35 to 39 Minutes | 242 | 5.5% |
| 40 to 44 Minutes | 137 | 3.1% |
| 45 to 59 Minutes | 358 | 8.1% |
| 60 to 89 Minutes | 421 | 9.5% |
| 90 or more Minutes | 46 | 1.0% |
Commute Time by Sex in Del Aire
The most common commute times in Del Aire are 20 to 24 minutes (461 commuters, 18.2%) for males and 15 to 19 minutes (419 commuters, 22.3%) for females.
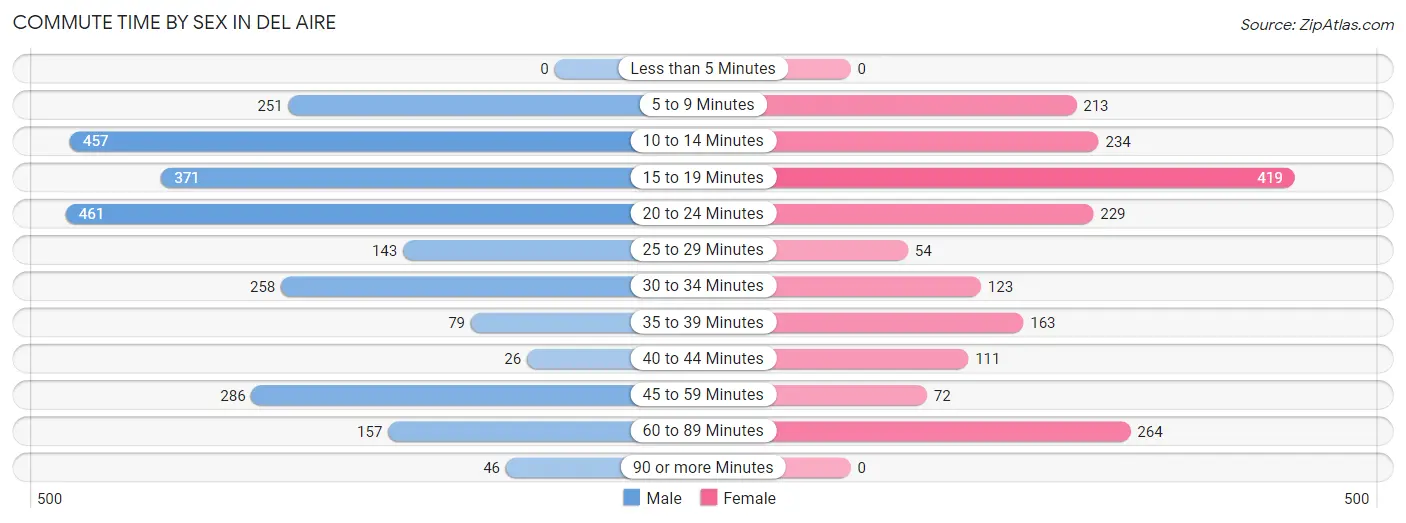
| Commute Time | Male | Female |
| Less than 5 Minutes | 0 (0.0%) | 0 (0.0%) |
| 5 to 9 Minutes | 251 (9.9%) | 213 (11.3%) |
| 10 to 14 Minutes | 457 (18.0%) | 234 (12.4%) |
| 15 to 19 Minutes | 371 (14.6%) | 419 (22.3%) |
| 20 to 24 Minutes | 461 (18.2%) | 229 (12.2%) |
| 25 to 29 Minutes | 143 (5.6%) | 54 (2.9%) |
| 30 to 34 Minutes | 258 (10.2%) | 123 (6.5%) |
| 35 to 39 Minutes | 79 (3.1%) | 163 (8.7%) |
| 40 to 44 Minutes | 26 (1.0%) | 111 (5.9%) |
| 45 to 59 Minutes | 286 (11.3%) | 72 (3.8%) |
| 60 to 89 Minutes | 157 (6.2%) | 264 (14.0%) |
| 90 or more Minutes | 46 (1.8%) | 0 (0.0%) |
Time of Departure to Work by Sex in Del Aire
The most frequent times of departure to work in Del Aire are 8:00 AM to 8:29 AM (311, 12.3%) for males and 8:00 AM to 8:29 AM (414, 22.0%) for females.
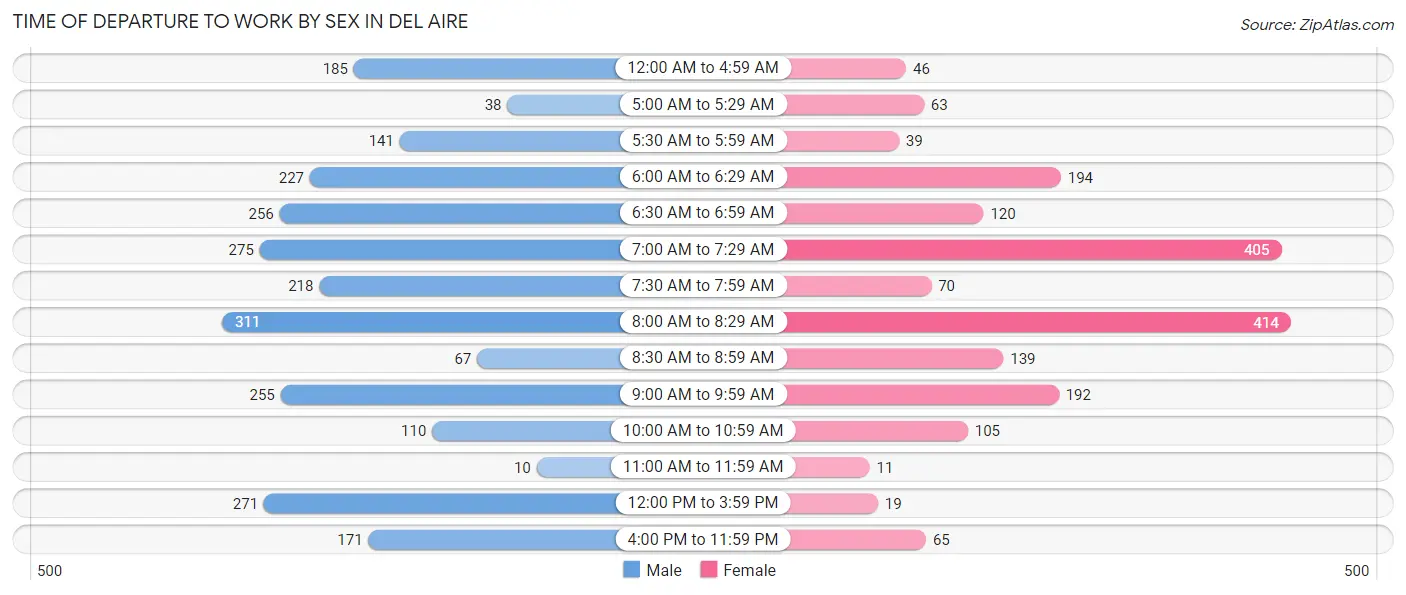
| Time of Departure | Male | Female |
| 12:00 AM to 4:59 AM | 185 (7.3%) | 46 (2.4%) |
| 5:00 AM to 5:29 AM | 38 (1.5%) | 63 (3.4%) |
| 5:30 AM to 5:59 AM | 141 (5.6%) | 39 (2.1%) |
| 6:00 AM to 6:29 AM | 227 (8.9%) | 194 (10.3%) |
| 6:30 AM to 6:59 AM | 256 (10.1%) | 120 (6.4%) |
| 7:00 AM to 7:29 AM | 275 (10.8%) | 405 (21.5%) |
| 7:30 AM to 7:59 AM | 218 (8.6%) | 70 (3.7%) |
| 8:00 AM to 8:29 AM | 311 (12.3%) | 414 (22.0%) |
| 8:30 AM to 8:59 AM | 67 (2.6%) | 139 (7.4%) |
| 9:00 AM to 9:59 AM | 255 (10.1%) | 192 (10.2%) |
| 10:00 AM to 10:59 AM | 110 (4.3%) | 105 (5.6%) |
| 11:00 AM to 11:59 AM | 10 (0.4%) | 11 (0.6%) |
| 12:00 PM to 3:59 PM | 271 (10.7%) | 19 (1.0%) |
| 4:00 PM to 11:59 PM | 171 (6.8%) | 65 (3.5%) |
| Total | 2,535 (100.0%) | 1,882 (100.0%) |
Housing Occupancy in Del Aire
Occupancy by Ownership in Del Aire
Of the total 3,467 dwellings in Del Aire, owner-occupied units account for 2,392 (69.0%), while renter-occupied units make up 1,075 (31.0%).
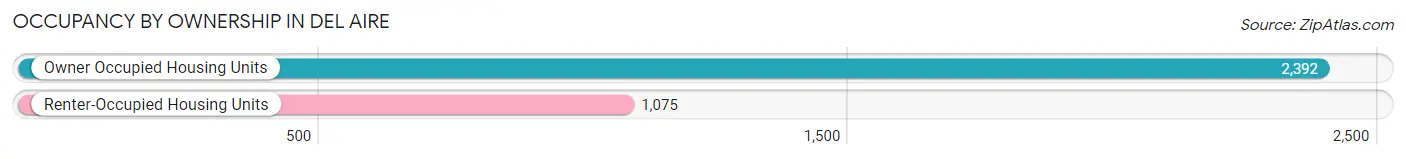
| Occupancy | # Housing Units | % Housing Units |
| Owner Occupied Housing Units | 2,392 | 69.0% |
| Renter-Occupied Housing Units | 1,075 | 31.0% |
| Total Occupied Housing Units | 3,467 | 100.0% |
Occupancy by Household Size in Del Aire
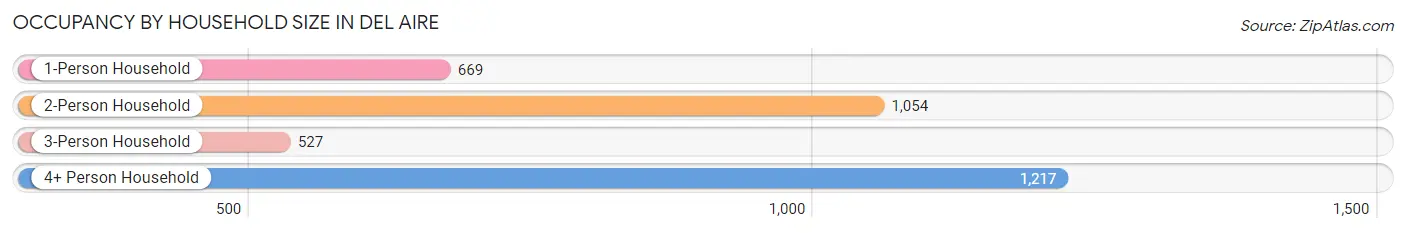
| Household Size | # Housing Units | % Housing Units |
| 1-Person Household | 669 | 19.3% |
| 2-Person Household | 1,054 | 30.4% |
| 3-Person Household | 527 | 15.2% |
| 4+ Person Household | 1,217 | 35.1% |
| Total Housing Units | 3,467 | 100.0% |
Occupancy by Ownership by Household Size in Del Aire
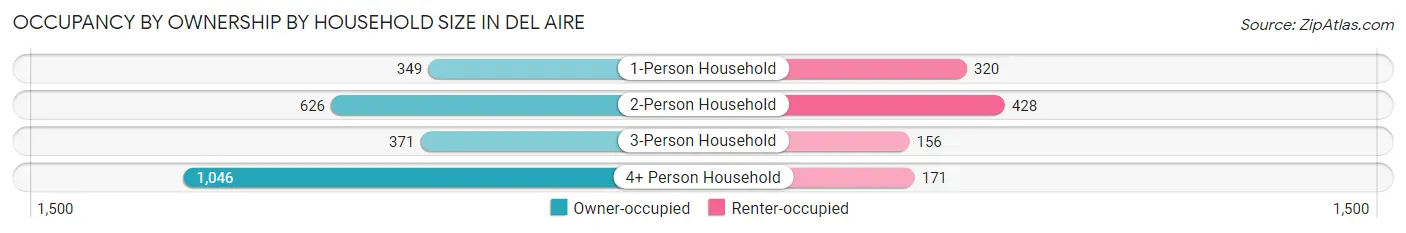
| Household Size | Owner-occupied | Renter-occupied |
| 1-Person Household | 349 (52.2%) | 320 (47.8%) |
| 2-Person Household | 626 (59.4%) | 428 (40.6%) |
| 3-Person Household | 371 (70.4%) | 156 (29.6%) |
| 4+ Person Household | 1,046 (86.0%) | 171 (14.1%) |
| Total Housing Units | 2,392 (69.0%) | 1,075 (31.0%) |
Occupancy by Educational Attainment in Del Aire
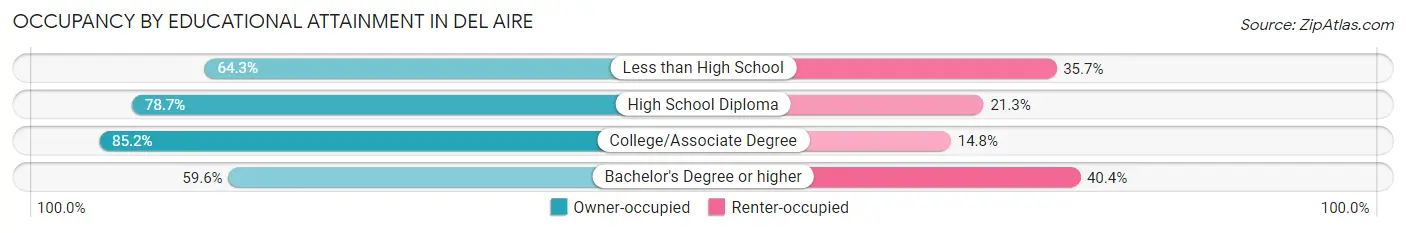
| Household Size | Owner-occupied | Renter-occupied |
| Less than High School | 317 (64.3%) | 176 (35.7%) |
| High School Diploma | 270 (78.7%) | 73 (21.3%) |
| College/Associate Degree | 789 (85.2%) | 137 (14.8%) |
| Bachelor's Degree or higher | 1,016 (59.6%) | 689 (40.4%) |
Occupancy by Age of Householder in Del Aire
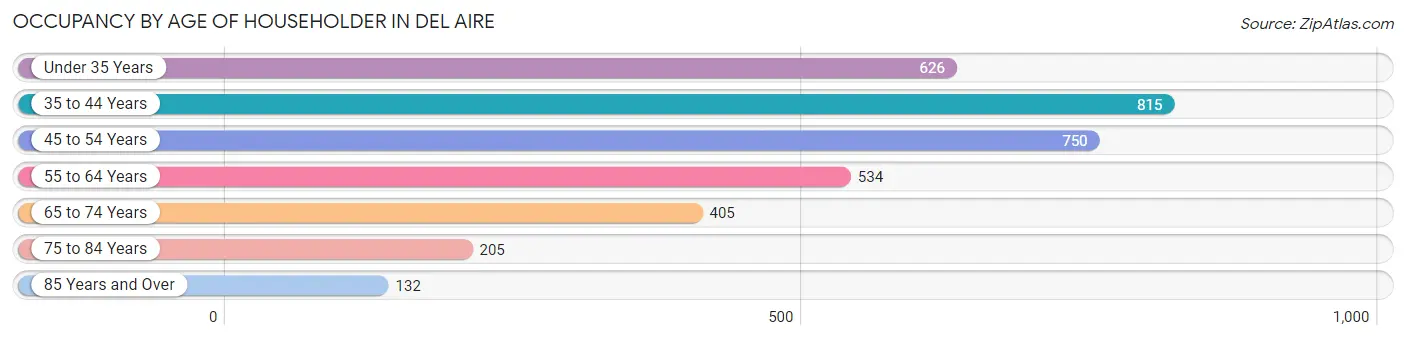
| Age Bracket | # Households | % Households |
| Under 35 Years | 626 | 18.1% |
| 35 to 44 Years | 815 | 23.5% |
| 45 to 54 Years | 750 | 21.6% |
| 55 to 64 Years | 534 | 15.4% |
| 65 to 74 Years | 405 | 11.7% |
| 75 to 84 Years | 205 | 5.9% |
| 85 Years and Over | 132 | 3.8% |
| Total | 3,467 | 100.0% |
Housing Finances in Del Aire
Median Income by Occupancy in Del Aire
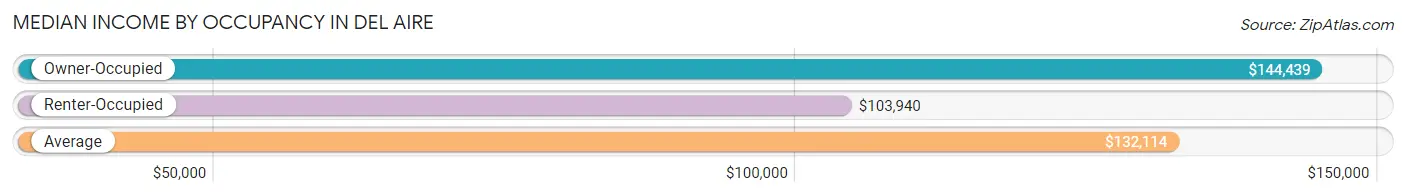
| Occupancy Type | # Households | Median Income |
| Owner-Occupied | 2,392 (69.0%) | $144,439 |
| Renter-Occupied | 1,075 (31.0%) | $103,940 |
| Average | 3,467 (100.0%) | $132,114 |
Occupancy by Householder Income Bracket in Del Aire
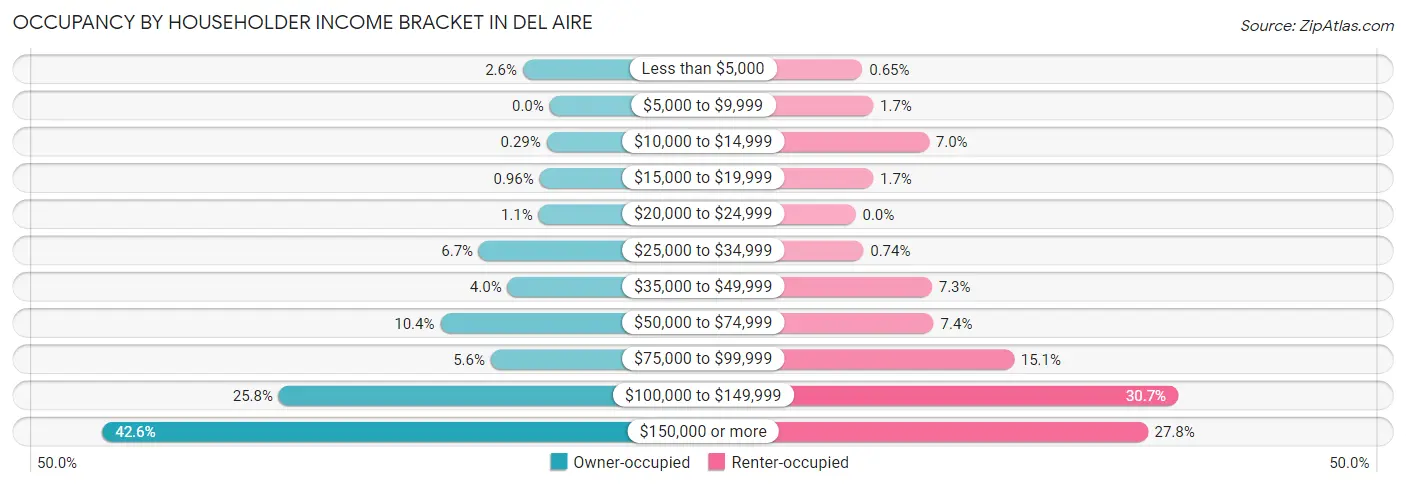
| Income Bracket | Owner-occupied | Renter-occupied |
| Less than $5,000 | 61 (2.5%) | 7 (0.6%) |
| $5,000 to $9,999 | 0 (0.0%) | 18 (1.7%) |
| $10,000 to $14,999 | 7 (0.3%) | 75 (7.0%) |
| $15,000 to $19,999 | 23 (1.0%) | 18 (1.7%) |
| $20,000 to $24,999 | 25 (1.1%) | 0 (0.0%) |
| $25,000 to $34,999 | 161 (6.7%) | 8 (0.7%) |
| $35,000 to $49,999 | 96 (4.0%) | 78 (7.3%) |
| $50,000 to $74,999 | 249 (10.4%) | 80 (7.4%) |
| $75,000 to $99,999 | 134 (5.6%) | 162 (15.1%) |
| $100,000 to $149,999 | 617 (25.8%) | 330 (30.7%) |
| $150,000 or more | 1,019 (42.6%) | 299 (27.8%) |
| Total | 2,392 (100.0%) | 1,075 (100.0%) |
Monthly Housing Cost Tiers in Del Aire
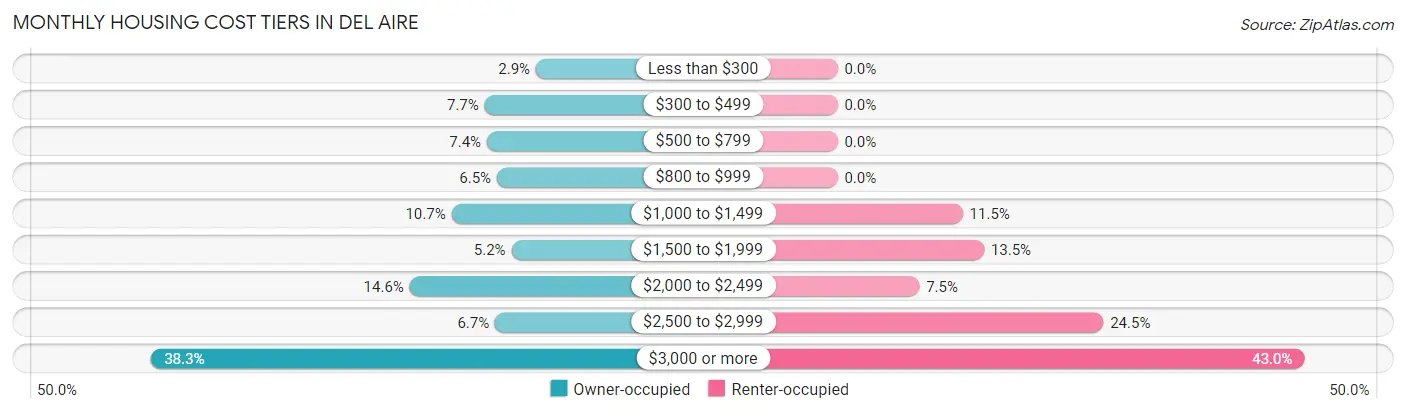
| Monthly Cost | Owner-occupied | Renter-occupied |
| Less than $300 | 70 (2.9%) | 0 (0.0%) |
| $300 to $499 | 183 (7.6%) | 0 (0.0%) |
| $500 to $799 | 178 (7.4%) | 0 (0.0%) |
| $800 to $999 | 156 (6.5%) | 0 (0.0%) |
| $1,000 to $1,499 | 256 (10.7%) | 124 (11.5%) |
| $1,500 to $1,999 | 124 (5.2%) | 145 (13.5%) |
| $2,000 to $2,499 | 348 (14.5%) | 81 (7.5%) |
| $2,500 to $2,999 | 160 (6.7%) | 263 (24.5%) |
| $3,000 or more | 917 (38.3%) | 462 (43.0%) |
| Total | 2,392 (100.0%) | 1,075 (100.0%) |
Physical Housing Characteristics in Del Aire
Housing Structures in Del Aire
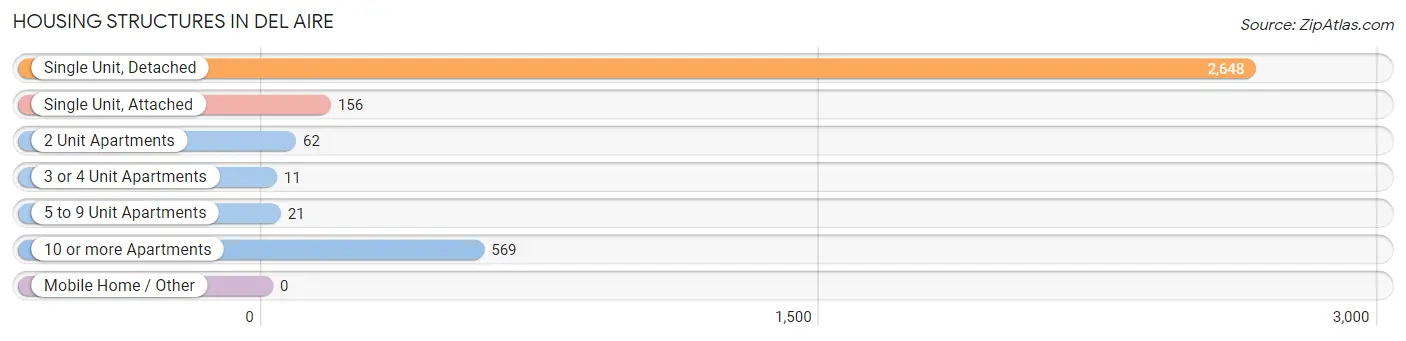
| Structure Type | # Housing Units | % Housing Units |
| Single Unit, Detached | 2,648 | 76.4% |
| Single Unit, Attached | 156 | 4.5% |
| 2 Unit Apartments | 62 | 1.8% |
| 3 or 4 Unit Apartments | 11 | 0.3% |
| 5 to 9 Unit Apartments | 21 | 0.6% |
| 10 or more Apartments | 569 | 16.4% |
| Mobile Home / Other | 0 | 0.0% |
| Total | 3,467 | 100.0% |
Housing Structures by Occupancy in Del Aire
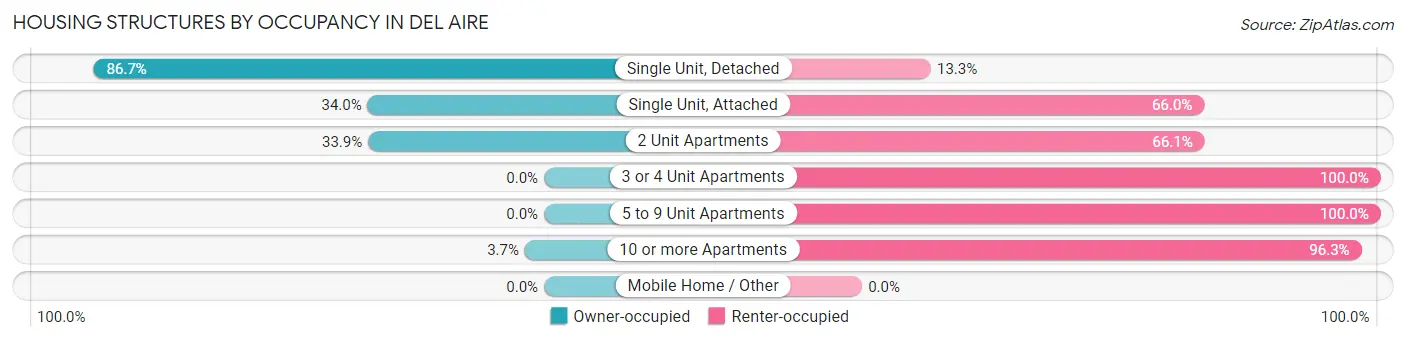
| Structure Type | Owner-occupied | Renter-occupied |
| Single Unit, Detached | 2,297 (86.7%) | 351 (13.3%) |
| Single Unit, Attached | 53 (34.0%) | 103 (66.0%) |
| 2 Unit Apartments | 21 (33.9%) | 41 (66.1%) |
| 3 or 4 Unit Apartments | 0 (0.0%) | 11 (100.0%) |
| 5 to 9 Unit Apartments | 0 (0.0%) | 21 (100.0%) |
| 10 or more Apartments | 21 (3.7%) | 548 (96.3%) |
| Mobile Home / Other | 0 (0.0%) | 0 (0.0%) |
| Total | 2,392 (69.0%) | 1,075 (31.0%) |
Housing Structures by Number of Rooms in Del Aire
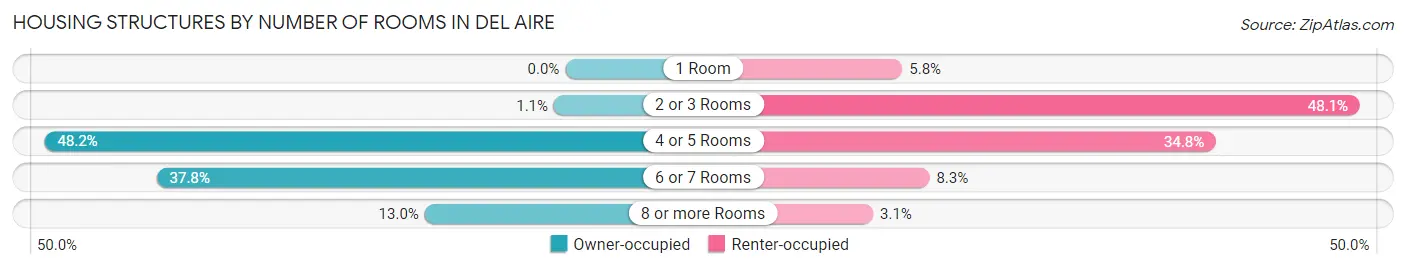
| Number of Rooms | Owner-occupied | Renter-occupied |
| 1 Room | 0 (0.0%) | 62 (5.8%) |
| 2 or 3 Rooms | 25 (1.1%) | 517 (48.1%) |
| 4 or 5 Rooms | 1,152 (48.2%) | 374 (34.8%) |
| 6 or 7 Rooms | 904 (37.8%) | 89 (8.3%) |
| 8 or more Rooms | 311 (13.0%) | 33 (3.1%) |
| Total | 2,392 (100.0%) | 1,075 (100.0%) |
Housing Structure by Heating Type in Del Aire
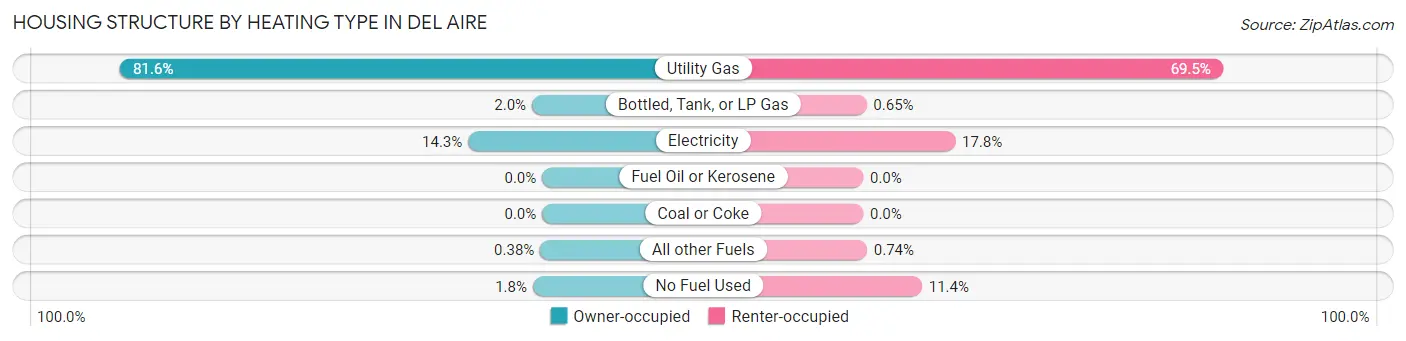
| Heating Type | Owner-occupied | Renter-occupied |
| Utility Gas | 1,951 (81.6%) | 747 (69.5%) |
| Bottled, Tank, or LP Gas | 47 (2.0%) | 7 (0.6%) |
| Electricity | 342 (14.3%) | 191 (17.8%) |
| Fuel Oil or Kerosene | 0 (0.0%) | 0 (0.0%) |
| Coal or Coke | 0 (0.0%) | 0 (0.0%) |
| All other Fuels | 9 (0.4%) | 8 (0.7%) |
| No Fuel Used | 43 (1.8%) | 122 (11.4%) |
| Total | 2,392 (100.0%) | 1,075 (100.0%) |
Household Vehicle Usage in Del Aire
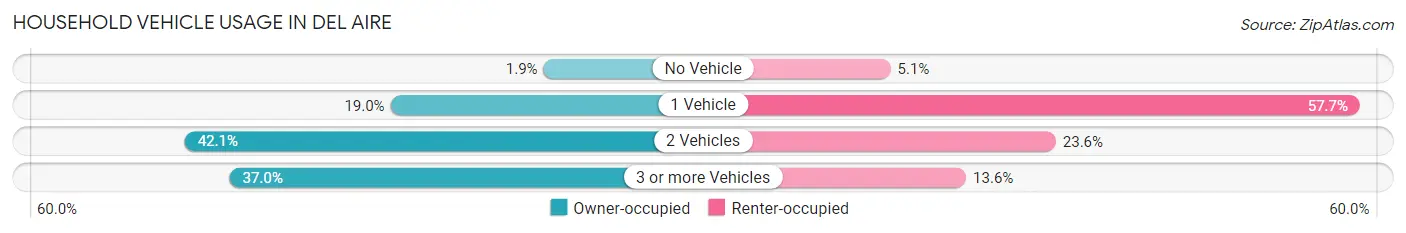
| Vehicles per Household | Owner-occupied | Renter-occupied |
| No Vehicle | 45 (1.9%) | 55 (5.1%) |
| 1 Vehicle | 455 (19.0%) | 620 (57.7%) |
| 2 Vehicles | 1,006 (42.1%) | 254 (23.6%) |
| 3 or more Vehicles | 886 (37.0%) | 146 (13.6%) |
| Total | 2,392 (100.0%) | 1,075 (100.0%) |
Real Estate & Mortgages in Del Aire
Real Estate and Mortgage Overview in Del Aire
| Characteristic | Without Mortgage | With Mortgage |
| Housing Units | 699 | 1,693 |
| Median Property Value | $740,000 | $876,000 |
| Median Household Income | $123,036 | $774 |
| Monthly Housing Costs | $633 | $896 |
| Real Estate Taxes | $4,129 | $26 |
Property Value by Mortgage Status in Del Aire
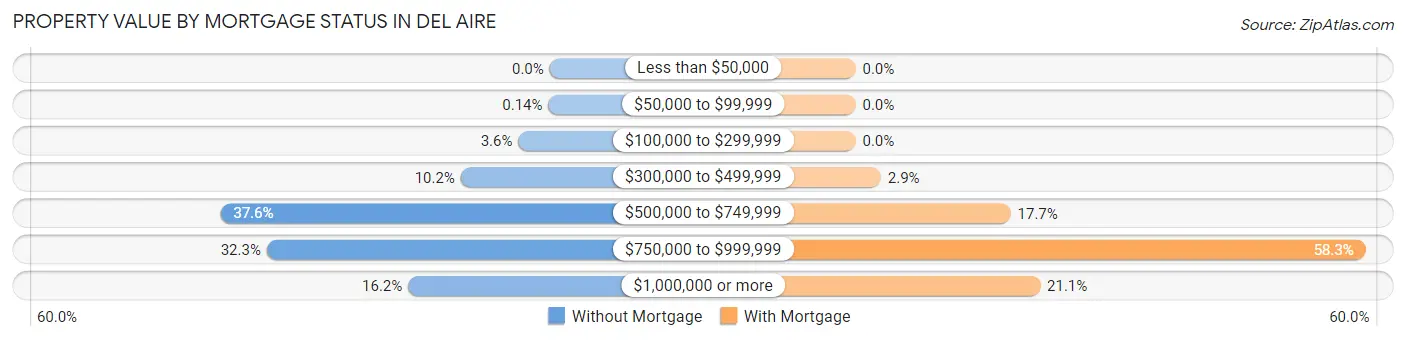
| Property Value | Without Mortgage | With Mortgage |
| Less than $50,000 | 0 (0.0%) | 0 (0.0%) |
| $50,000 to $99,999 | 1 (0.1%) | 0 (0.0%) |
| $100,000 to $299,999 | 25 (3.6%) | 0 (0.0%) |
| $300,000 to $499,999 | 71 (10.2%) | 49 (2.9%) |
| $500,000 to $749,999 | 263 (37.6%) | 300 (17.7%) |
| $750,000 to $999,999 | 226 (32.3%) | 987 (58.3%) |
| $1,000,000 or more | 113 (16.2%) | 357 (21.1%) |
| Total | 699 (100.0%) | 1,693 (100.0%) |
Household Income by Mortgage Status in Del Aire
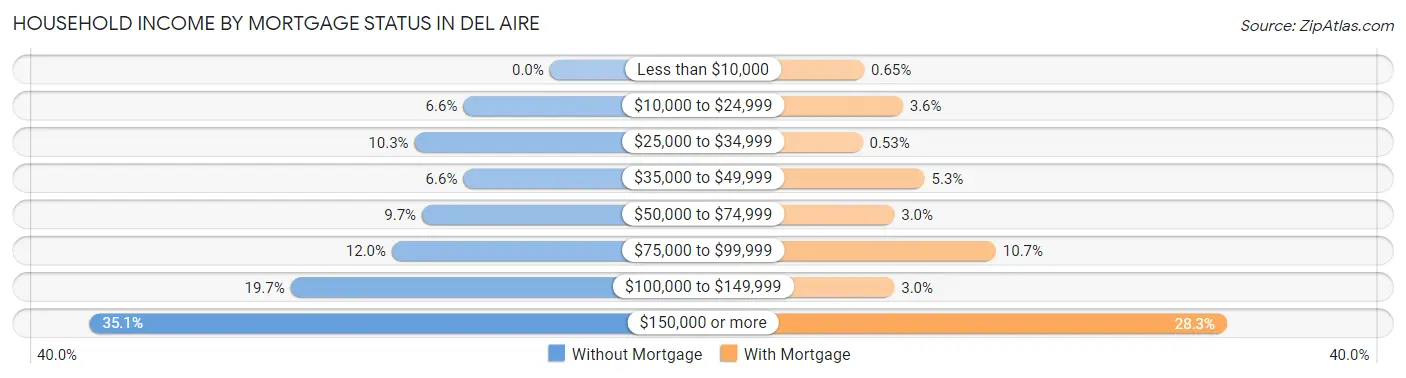
| Household Income | Without Mortgage | With Mortgage |
| Less than $10,000 | 0 (0.0%) | 11 (0.6%) |
| $10,000 to $24,999 | 46 (6.6%) | 61 (3.6%) |
| $25,000 to $34,999 | 72 (10.3%) | 9 (0.5%) |
| $35,000 to $49,999 | 46 (6.6%) | 89 (5.3%) |
| $50,000 to $74,999 | 68 (9.7%) | 50 (2.9%) |
| $75,000 to $99,999 | 84 (12.0%) | 181 (10.7%) |
| $100,000 to $149,999 | 138 (19.7%) | 50 (2.9%) |
| $150,000 or more | 245 (35.0%) | 479 (28.3%) |
| Total | 699 (100.0%) | 1,693 (100.0%) |
Property Value to Household Income Ratio in Del Aire
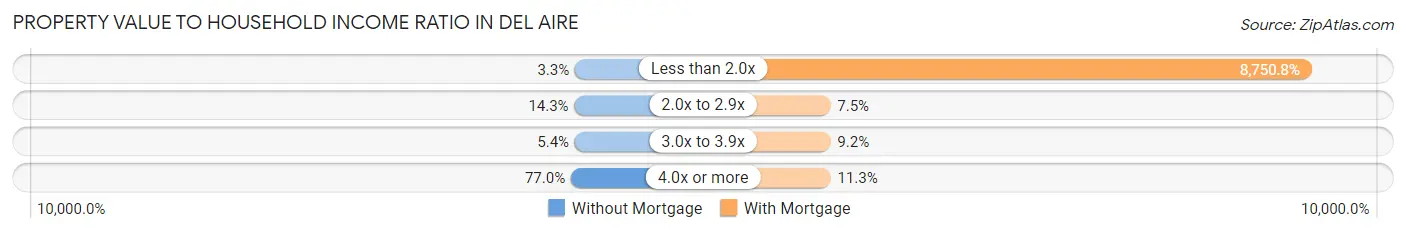
| Value-to-Income Ratio | Without Mortgage | With Mortgage |
| Less than 2.0x | 23 (3.3%) | 148,151 (8,750.8%) |
| 2.0x to 2.9x | 100 (14.3%) | 127 (7.5%) |
| 3.0x to 3.9x | 38 (5.4%) | 156 (9.2%) |
| 4.0x or more | 538 (77.0%) | 192 (11.3%) |
| Total | 699 (100.0%) | 1,693 (100.0%) |
Real Estate Taxes by Mortgage Status in Del Aire
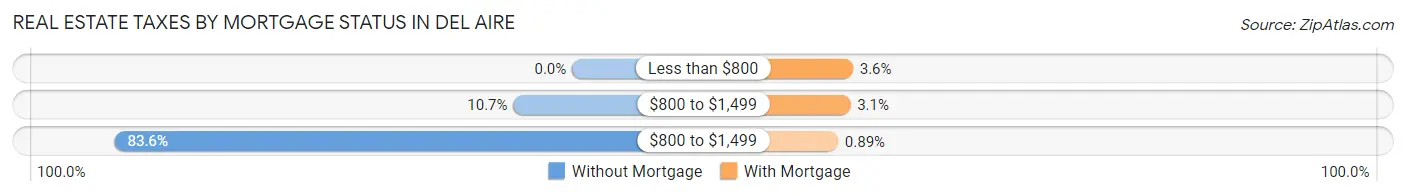
| Property Taxes | Without Mortgage | With Mortgage |
| Less than $800 | 0 (0.0%) | 61 (3.6%) |
| $800 to $1,499 | 75 (10.7%) | 53 (3.1%) |
| $800 to $1,499 | 584 (83.6%) | 15 (0.9%) |
| Total | 699 (100.0%) | 1,693 (100.0%) |
Health & Disability in Del Aire
Health Insurance Coverage by Age in Del Aire
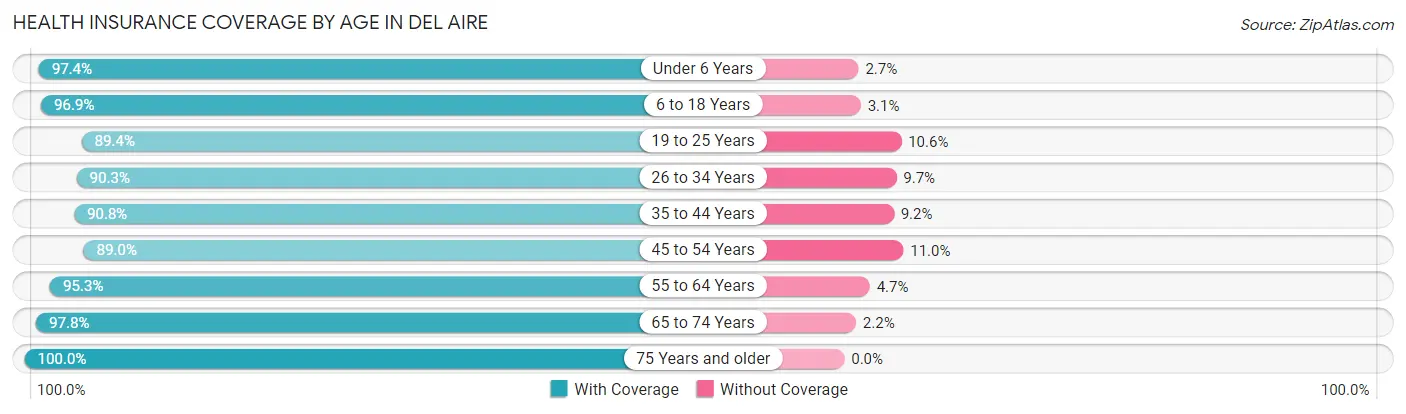
| Age Bracket | With Coverage | Without Coverage |
| Under 6 Years | 918 (97.4%) | 25 (2.6%) |
| 6 to 18 Years | 1,618 (96.9%) | 51 (3.1%) |
| 19 to 25 Years | 707 (89.4%) | 84 (10.6%) |
| 26 to 34 Years | 1,460 (90.3%) | 157 (9.7%) |
| 35 to 44 Years | 1,578 (90.8%) | 160 (9.2%) |
| 45 to 54 Years | 1,287 (89.0%) | 159 (11.0%) |
| 55 to 64 Years | 844 (95.3%) | 42 (4.7%) |
| 65 to 74 Years | 861 (97.8%) | 19 (2.2%) |
| 75 Years and older | 759 (100.0%) | 0 (0.0%) |
| Total | 10,032 (93.5%) | 697 (6.5%) |
Health Insurance Coverage by Citizenship Status in Del Aire
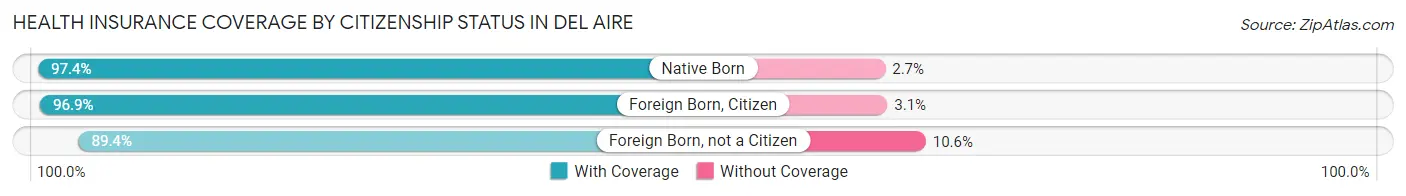
| Citizenship Status | With Coverage | Without Coverage |
| Native Born | 918 (97.4%) | 25 (2.6%) |
| Foreign Born, Citizen | 1,618 (96.9%) | 51 (3.1%) |
| Foreign Born, not a Citizen | 707 (89.4%) | 84 (10.6%) |
Health Insurance Coverage by Household Income in Del Aire
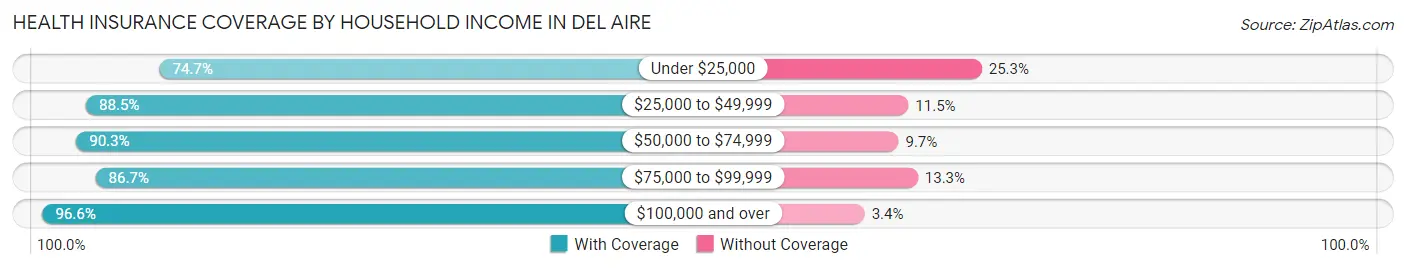
| Household Income | With Coverage | Without Coverage |
| Under $25,000 | 458 (74.7%) | 155 (25.3%) |
| $25,000 to $49,999 | 544 (88.5%) | 71 (11.5%) |
| $50,000 to $74,999 | 1,025 (90.3%) | 110 (9.7%) |
| $75,000 to $99,999 | 710 (86.7%) | 109 (13.3%) |
| $100,000 and over | 7,249 (96.6%) | 252 (3.4%) |
Public vs Private Health Insurance Coverage by Age in Del Aire
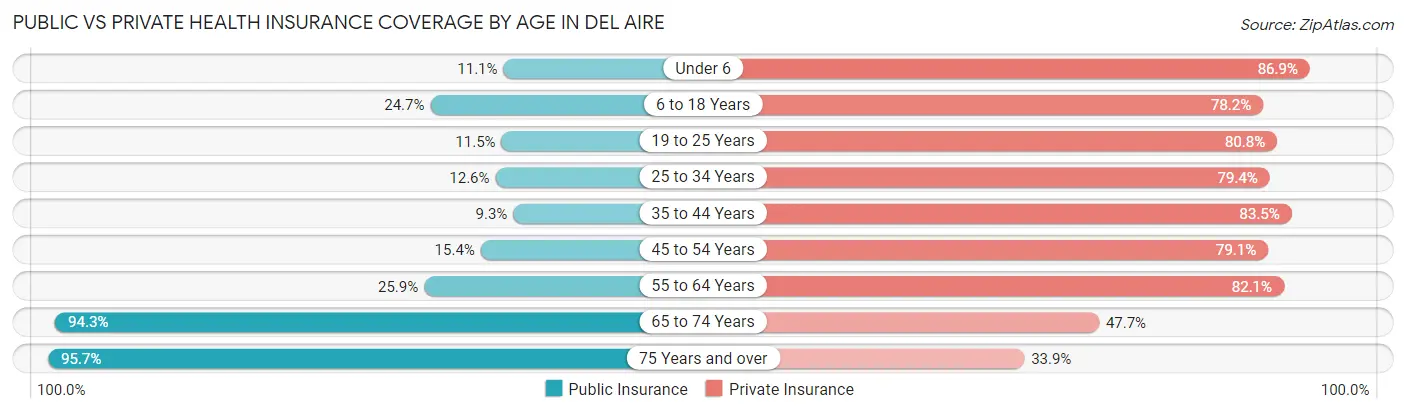
| Age Bracket | Public Insurance | Private Insurance |
| Under 6 | 105 (11.1%) | 819 (86.9%) |
| 6 to 18 Years | 412 (24.7%) | 1,305 (78.2%) |
| 19 to 25 Years | 91 (11.5%) | 639 (80.8%) |
| 25 to 34 Years | 204 (12.6%) | 1,284 (79.4%) |
| 35 to 44 Years | 162 (9.3%) | 1,451 (83.5%) |
| 45 to 54 Years | 222 (15.3%) | 1,144 (79.1%) |
| 55 to 64 Years | 229 (25.9%) | 727 (82.1%) |
| 65 to 74 Years | 830 (94.3%) | 420 (47.7%) |
| 75 Years and over | 726 (95.7%) | 257 (33.9%) |
| Total | 2,981 (27.8%) | 8,046 (75.0%) |
Disability Status by Sex by Age in Del Aire
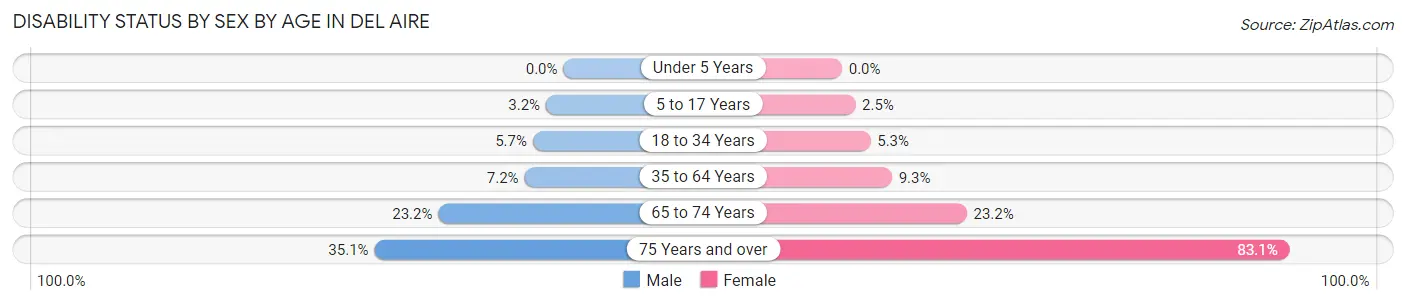
| Age Bracket | Male | Female |
| Under 5 Years | 0 (0.0%) | 0 (0.0%) |
| 5 to 17 Years | 26 (3.2%) | 25 (2.5%) |
| 18 to 34 Years | 70 (5.7%) | 66 (5.3%) |
| 35 to 64 Years | 146 (7.2%) | 190 (9.3%) |
| 65 to 74 Years | 81 (23.2%) | 123 (23.2%) |
| 75 Years and over | 94 (35.1%) | 408 (83.1%) |
Disability Class by Sex by Age in Del Aire
Disability Class: Hearing Difficulty
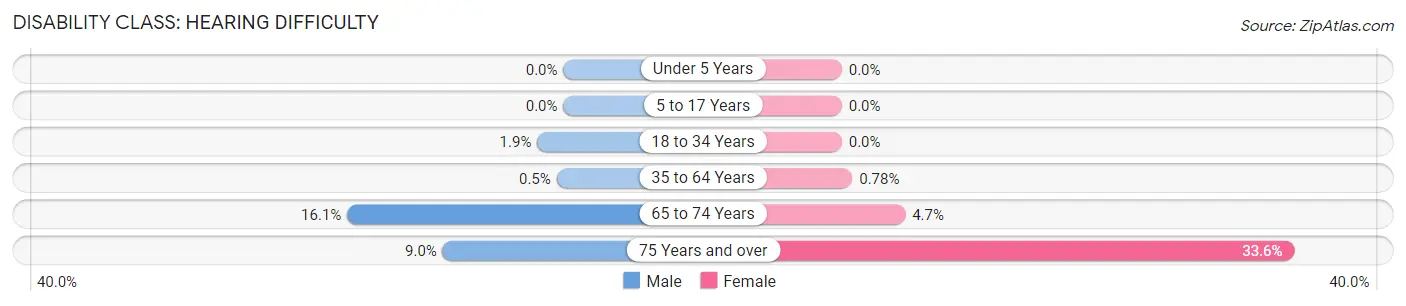
| Age Bracket | Male | Female |
| Under 5 Years | 0 (0.0%) | 0 (0.0%) |
| 5 to 17 Years | 0 (0.0%) | 0 (0.0%) |
| 18 to 34 Years | 24 (1.9%) | 0 (0.0%) |
| 35 to 64 Years | 10 (0.5%) | 16 (0.8%) |
| 65 to 74 Years | 56 (16.1%) | 25 (4.7%) |
| 75 Years and over | 24 (9.0%) | 165 (33.6%) |
Disability Class: Vision Difficulty
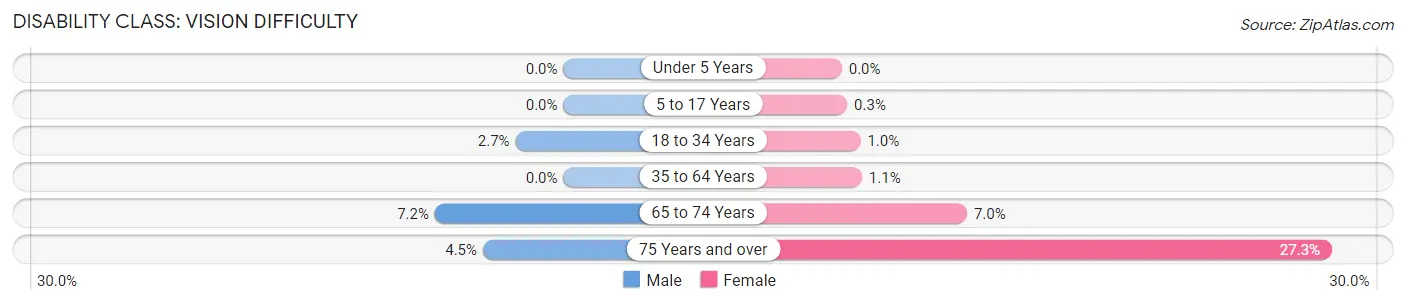
| Age Bracket | Male | Female |
| Under 5 Years | 0 (0.0%) | 0 (0.0%) |
| 5 to 17 Years | 0 (0.0%) | 3 (0.3%) |
| 18 to 34 Years | 33 (2.7%) | 13 (1.0%) |
| 35 to 64 Years | 0 (0.0%) | 23 (1.1%) |
| 65 to 74 Years | 25 (7.2%) | 37 (7.0%) |
| 75 Years and over | 12 (4.5%) | 134 (27.3%) |
Disability Class: Cognitive Difficulty
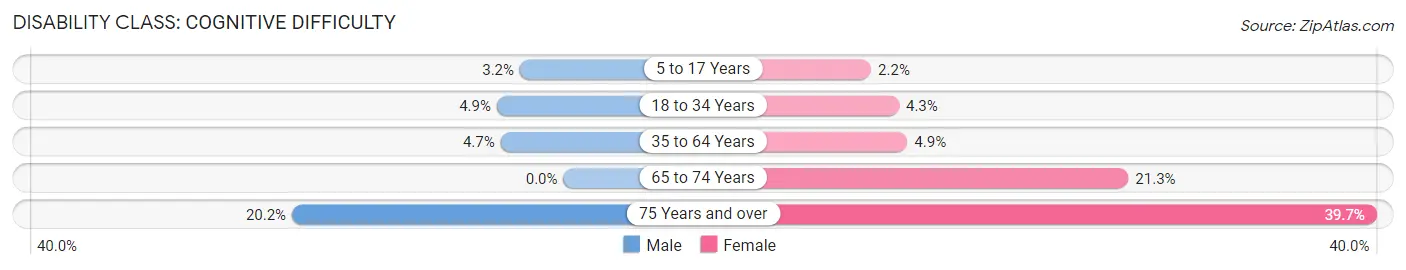
| Age Bracket | Male | Female |
| 5 to 17 Years | 26 (3.2%) | 22 (2.2%) |
| 18 to 34 Years | 61 (4.9%) | 53 (4.3%) |
| 35 to 64 Years | 94 (4.7%) | 100 (4.9%) |
| 65 to 74 Years | 0 (0.0%) | 113 (21.3%) |
| 75 Years and over | 54 (20.2%) | 195 (39.7%) |
Disability Class: Ambulatory Difficulty
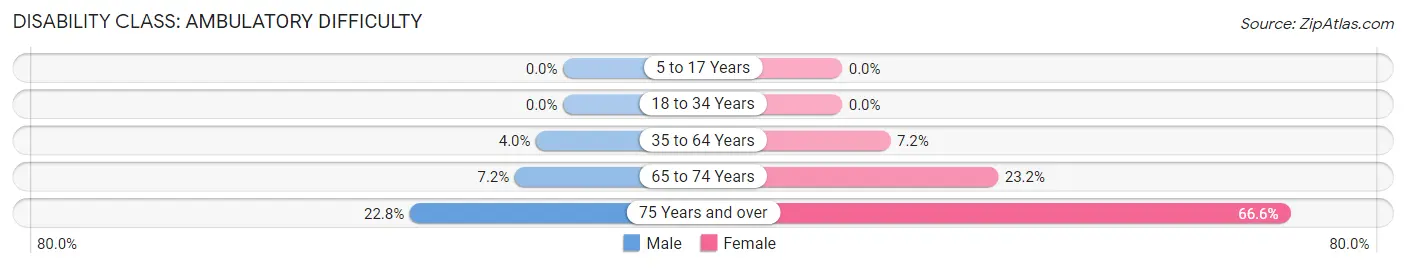
| Age Bracket | Male | Female |
| 5 to 17 Years | 0 (0.0%) | 0 (0.0%) |
| 18 to 34 Years | 0 (0.0%) | 0 (0.0%) |
| 35 to 64 Years | 81 (4.0%) | 147 (7.2%) |
| 65 to 74 Years | 25 (7.2%) | 123 (23.2%) |
| 75 Years and over | 61 (22.8%) | 327 (66.6%) |
Disability Class: Self-Care Difficulty
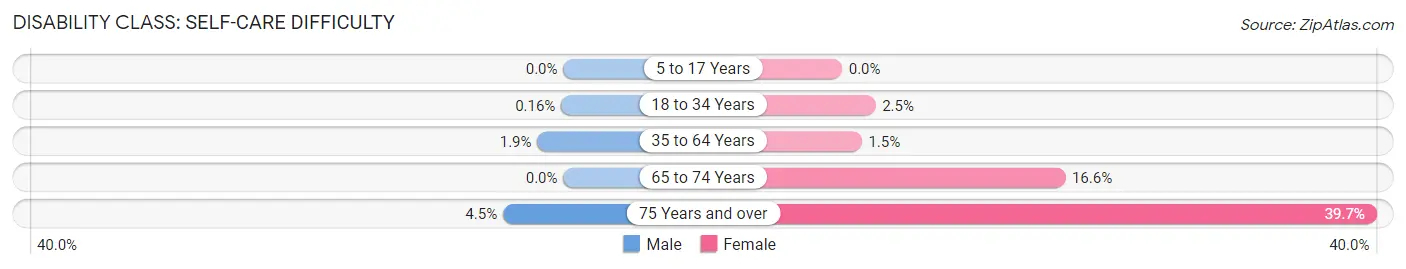
| Age Bracket | Male | Female |
| 5 to 17 Years | 0 (0.0%) | 0 (0.0%) |
| 18 to 34 Years | 2 (0.2%) | 31 (2.5%) |
| 35 to 64 Years | 39 (1.9%) | 30 (1.5%) |
| 65 to 74 Years | 0 (0.0%) | 88 (16.6%) |
| 75 Years and over | 12 (4.5%) | 195 (39.7%) |
Technology Access in Del Aire
Computing Device Access in Del Aire
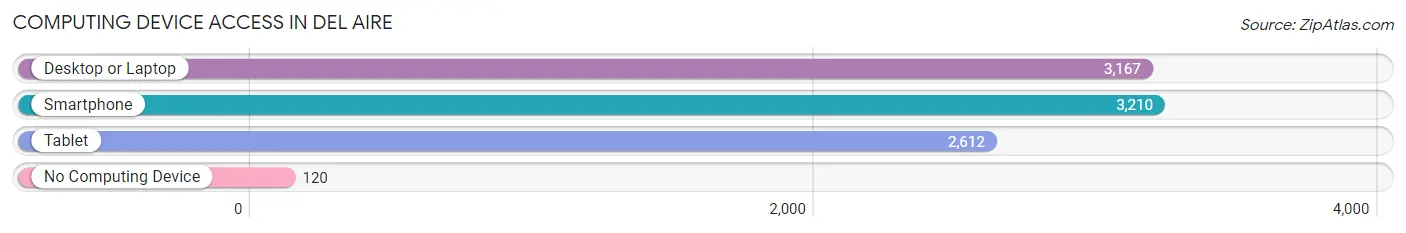
| Device Type | # Households | % Households |
| Desktop or Laptop | 3,167 | 91.3% |
| Smartphone | 3,210 | 92.6% |
| Tablet | 2,612 | 75.3% |
| No Computing Device | 120 | 3.5% |
| Total | 3,467 | 100.0% |
Internet Access in Del Aire
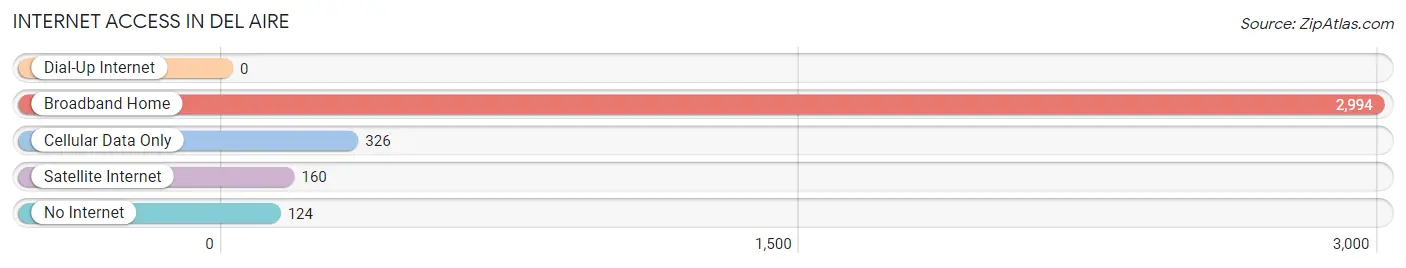
| Internet Type | # Households | % Households |
| Dial-Up Internet | 0 | 0.0% |
| Broadband Home | 2,994 | 86.4% |
| Cellular Data Only | 326 | 9.4% |
| Satellite Internet | 160 | 4.6% |
| No Internet | 124 | 3.6% |
| Total | 3,467 | 100.0% |
Del Aire Summary
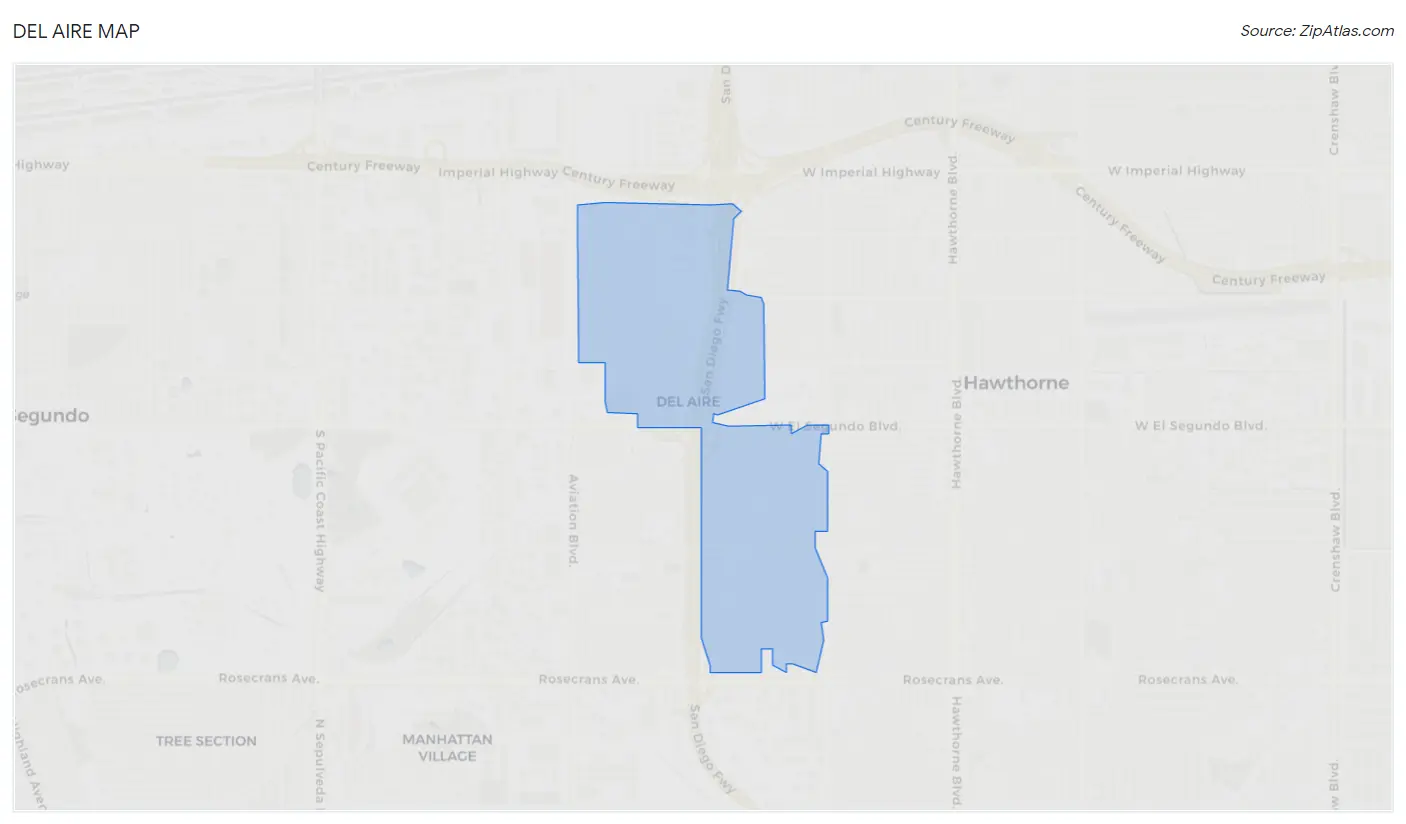
Del Aire is a census-designated place located in Los Angeles County, California. It is located in the South Bay region of the Greater Los Angeles Area, and is bordered by the cities of Hawthorne, El Segundo, and Lawndale. The population of Del Aire was 8,542 at the 2010 census.
History
Del Aire was originally part of the Rancho Sausal Redondo, a Mexican land grant given to Juan Jose Dominguez in 1839. The area was later developed as an agricultural community in the early 1900s. In the 1920s, the area was subdivided and developed as a residential community. The name “Del Aire” was chosen by the developers, who thought it was a fitting name for the area, which was located near the Los Angeles International Airport.
Geography
Del Aire is located at 33°54'25"N 118°22'17"W (33.906890, -118.371445). According to the United States Census Bureau, the CDP has a total area of 1.2 square miles (3.1 km2), all of it land.
Economy
Del Aire is primarily a residential community, but it does have some commercial businesses. The main industries in the area are retail, health care, and education. The largest employers in the area are the Los Angeles Unified School District, the Los Angeles County Department of Health Services, and the Los Angeles County Sheriff's Department.
Demographics
As of the 2010 census, there were 8,542 people, 2,945 households, and 2,092 families residing in Del Aire. The population density was 7,072.3 people per square mile (2,731.2/km2). The racial makeup of Del Aire was 57.2% White, 11.2% African American, 0.7% Native American, 16.2% Asian, 0.2% Pacific Islander, 9.7% from other races, and 5.0% from two or more races. Hispanic or Latino of any race were 24.3% of the population.
There were 2,945 households, out of which 33.2% had children under the age of 18 living with them, 48.2% were married couples living together, 14.2% had a female householder with no husband present, and 30.7% were non-families. 24.2% of all households were made up of individuals, and 8.2% had someone living alone who was 65 years of age or older. The average household size was 2.90 and the average family size was 3.45.
In Del Aire, the population was spread out, with 25.2% under the age of 18, 8.7% from 18 to 24, 30.2% from 25 to 44, 24.2% from 45 to 64, and 11.7% who were 65 years of age or older. The median age was 36 years. For every 100 females, there were 95.2 males. For every 100 females age 18 and over, there were 92.2 males.
The median income for a household in Del Aire was $50,945, and the median income for a family was $56,945. Males had a median income of $41,945 versus $35,945 for females. The per capita income for the CDP was $22,945. About 8.2% of families and 10.2% of the population were below the poverty line, including 14.2% of those under age 18 and 6.2% of those age 65 or over.
Common Questions
What is Per Capita Income in Del Aire?
Per Capita income in Del Aire is $51,927.
What is the Median Family Income in Del Aire?
Median Family Income in Del Aire is $146,491.
What is the Median Household income in Del Aire?
Median Household Income in Del Aire is $132,114.
What is Income or Wage Gap in Del Aire?
Income or Wage Gap in Del Aire is 35.0%.
Women in Del Aire earn 65.0 cents for every dollar earned by a man.
What is Inequality or Gini Index in Del Aire?
Inequality or Gini Index in Del Aire is 0.41.
What is the Total Population of Del Aire?
Total Population of Del Aire is 10,756.
What is the Total Male Population of Del Aire?
Total Male Population of Del Aire is 5,001.
What is the Total Female Population of Del Aire?
Total Female Population of Del Aire is 5,755.
What is the Ratio of Males per 100 Females in Del Aire?
There are 86.90 Males per 100 Females in Del Aire.
What is the Ratio of Females per 100 Males in Del Aire?
There are 115.08 Females per 100 Males in Del Aire.
What is the Median Population Age in Del Aire?
Median Population Age in Del Aire is 36.8 Years.
What is the Average Family Size in Del Aire
Average Family Size in Del Aire is 3.7 People.
What is the Average Household Size in Del Aire
Average Household Size in Del Aire is 3.1 People.
How Large is the Labor Force in Del Aire?
There are 5,617 People in the Labor Forcein in Del Aire.
What is the Percentage of People in the Labor Force in Del Aire?
67.1% of People are in the Labor Force in Del Aire.
What is the Unemployment Rate in Del Aire?
Unemployment Rate in Del Aire is 2.8%.