Cities with the Highest Percentage of Population Employed in Architecture & Engineering in Massachusetts
RELATED REPORTS & OPTIONS
Architecture & Engineering
Massachusetts
Compare Cities
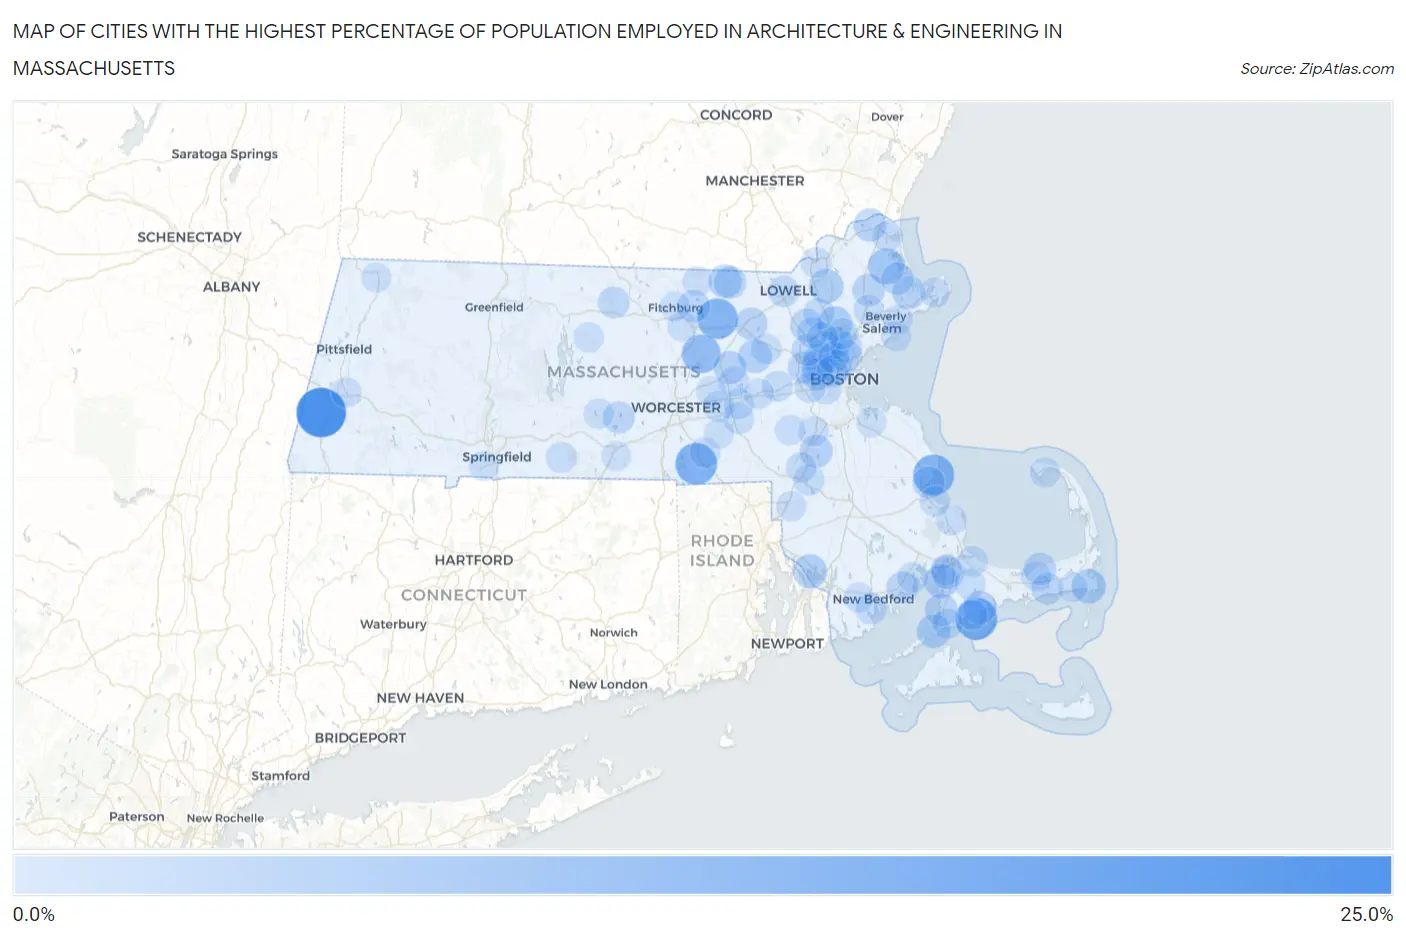
Map of Cities with the Highest Percentage of Population Employed in Architecture & Engineering in Massachusetts
0.0%
25.0%
Cities with the Highest Percentage of Population Employed in Architecture & Engineering in Massachusetts
| City | % Employed | vs State | vs National | |
| 1. | Housatonic | 21.6% | 2.7%(+19.0)#1 | 2.1%(+19.5)#115 |
| 2. | New Seabury | 14.2% | 2.7%(+11.5)#2 | 2.1%(+12.0)#259 |
| 3. | East Douglas | 13.6% | 2.7%(+10.9)#3 | 2.1%(+11.5)#283 |
| 4. | Duxbury | 12.9% | 2.7%(+10.3)#4 | 2.1%(+10.8)#306 |
| 5. | Devens | 12.6% | 2.7%(+9.93)#5 | 2.1%(+10.5)#327 |
| 6. | South Lancaster | 10.7% | 2.7%(+8.07)#6 | 2.1%(+8.59)#437 |
| 7. | West Warren | 8.3% | 2.7%(+5.66)#7 | 2.1%(+6.18)#660 |
| 8. | Rowley | 8.2% | 2.7%(+5.48)#8 | 2.1%(+6.00)#693 |
| 9. | Reading | 6.8% | 2.7%(+4.14)#9 | 2.1%(+4.66)#980 |
| 10. | West Chatham | 6.6% | 2.7%(+3.91)#10 | 2.1%(+4.44)#1,027 |
| 11. | Andover | 6.3% | 2.7%(+3.63)#11 | 2.1%(+4.16)#1,113 |
| 12. | Pocasset | 6.2% | 2.7%(+3.48)#12 | 2.1%(+4.01)#1,177 |
| 13. | Ocean Grove | 6.0% | 2.7%(+3.37)#13 | 2.1%(+3.90)#1,215 |
| 14. | Maynard | 5.8% | 2.7%(+3.15)#14 | 2.1%(+3.67)#1,332 |
| 15. | Woods Hole | 5.8% | 2.7%(+3.11)#15 | 2.1%(+3.63)#1,349 |
| 16. | Somerville | 5.5% | 2.7%(+2.84)#16 | 2.1%(+3.37)#1,500 |
| 17. | Pepperell | 5.4% | 2.7%(+2.76)#17 | 2.1%(+3.28)#1,547 |
| 18. | Essex | 5.4% | 2.7%(+2.71)#18 | 2.1%(+3.23)#1,575 |
| 19. | Mashpee Neck | 5.3% | 2.7%(+2.60)#19 | 2.1%(+3.12)#1,641 |
| 20. | Arlington | 5.2% | 2.7%(+2.56)#20 | 2.1%(+3.08)#1,678 |
| 21. | Hudson | 5.2% | 2.7%(+2.48)#21 | 2.1%(+3.00)#1,734 |
| 22. | Amesbury Town | 5.1% | 2.7%(+2.47)#22 | 2.1%(+3.00)#1,737 |
| 23. | Sharon | 5.1% | 2.7%(+2.44)#23 | 2.1%(+2.97)#1,753 |
| 24. | West Falmouth | 5.0% | 2.7%(+2.33)#24 | 2.1%(+2.86)#1,826 |
| 25. | Monument Beach | 4.9% | 2.7%(+2.26)#25 | 2.1%(+2.78)#1,879 |
| 26. | Littleton Common | 4.8% | 2.7%(+2.11)#26 | 2.1%(+2.63)#1,992 |
| 27. | Topsfield | 4.8% | 2.7%(+2.09)#27 | 2.1%(+2.61)#2,002 |
| 28. | Winchester | 4.7% | 2.7%(+2.01)#28 | 2.1%(+2.54)#2,068 |
| 29. | East Pepperell | 4.6% | 2.7%(+1.97)#29 | 2.1%(+2.50)#2,103 |
| 30. | Ipswich | 4.6% | 2.7%(+1.97)#30 | 2.1%(+2.49)#2,106 |
| 31. | Pinehurst | 4.6% | 2.7%(+1.97)#31 | 2.1%(+2.49)#2,109 |
| 32. | Lunenburg | 4.6% | 2.7%(+1.93)#32 | 2.1%(+2.45)#2,136 |
| 33. | Dennis | 4.6% | 2.7%(+1.89)#33 | 2.1%(+2.42)#2,162 |
| 34. | Malden | 4.5% | 2.7%(+1.81)#34 | 2.1%(+2.33)#2,244 |
| 35. | Belmont | 4.4% | 2.7%(+1.74)#35 | 2.1%(+2.26)#2,301 |
| 36. | South Duxbury | 4.4% | 2.7%(+1.72)#36 | 2.1%(+2.24)#2,326 |
| 37. | Mattapoisett Center | 4.3% | 2.7%(+1.59)#37 | 2.1%(+2.11)#2,443 |
| 38. | Waltham | 4.2% | 2.7%(+1.54)#38 | 2.1%(+2.06)#2,506 |
| 39. | Stoneham | 4.2% | 2.7%(+1.52)#39 | 2.1%(+2.04)#2,531 |
| 40. | East Brookfield | 4.2% | 2.7%(+1.52)#40 | 2.1%(+2.04)#2,539 |
| 41. | West Dennis | 4.2% | 2.7%(+1.49)#41 | 2.1%(+2.01)#2,574 |
| 42. | Watertown Town | 4.1% | 2.7%(+1.39)#42 | 2.1%(+1.92)#2,687 |
| 43. | Cambridge | 4.1% | 2.7%(+1.38)#43 | 2.1%(+1.90)#2,712 |
| 44. | Lexington | 4.0% | 2.7%(+1.30)#44 | 2.1%(+1.83)#2,803 |
| 45. | Baldwinville | 4.0% | 2.7%(+1.29)#45 | 2.1%(+1.81)#2,818 |
| 46. | Medford | 3.8% | 2.7%(+1.10)#46 | 2.1%(+1.63)#3,052 |
| 47. | Lowell | 3.8% | 2.7%(+1.09)#47 | 2.1%(+1.61)#3,074 |
| 48. | Melrose | 3.7% | 2.7%(+1.03)#48 | 2.1%(+1.55)#3,174 |
| 49. | Bliss Corner | 3.6% | 2.7%(+0.914)#49 | 2.1%(+1.44)#3,361 |
| 50. | Wakefield | 3.5% | 2.7%(+0.839)#50 | 2.1%(+1.36)#3,505 |
| 51. | Wilmington | 3.5% | 2.7%(+0.817)#51 | 2.1%(+1.34)#3,547 |
| 52. | Burlington | 3.5% | 2.7%(+0.816)#52 | 2.1%(+1.34)#3,550 |
| 53. | Woburn | 3.4% | 2.7%(+0.725)#53 | 2.1%(+1.25)#3,716 |
| 54. | Hopkinton | 3.4% | 2.7%(+0.695)#54 | 2.1%(+1.22)#3,782 |
| 55. | Cochituate | 3.3% | 2.7%(+0.581)#55 | 2.1%(+1.11)#3,978 |
| 56. | Westborough | 3.2% | 2.7%(+0.575)#56 | 2.1%(+1.10)#3,996 |
| 57. | Falmouth | 3.2% | 2.7%(+0.486)#57 | 2.1%(+1.01)#4,199 |
| 58. | Brookline | 3.1% | 2.7%(+0.454)#58 | 2.1%(+0.979)#4,263 |
| 59. | Mansfield Center | 3.1% | 2.7%(+0.441)#59 | 2.1%(+0.965)#4,309 |
| 60. | Sandwich | 3.1% | 2.7%(+0.413)#60 | 2.1%(+0.937)#4,361 |
| 61. | Forestdale | 3.1% | 2.7%(+0.399)#61 | 2.1%(+0.924)#4,386 |
| 62. | Cordaville | 3.0% | 2.7%(+0.336)#62 | 2.1%(+0.861)#4,565 |
| 63. | Methuen Town | 3.0% | 2.7%(+0.336)#63 | 2.1%(+0.860)#4,566 |
| 64. | Monson Center | 3.0% | 2.7%(+0.336)#64 | 2.1%(+0.860)#4,567 |
| 65. | Bourne | 3.0% | 2.7%(+0.304)#65 | 2.1%(+0.829)#4,640 |
| 66. | Newburyport | 3.0% | 2.7%(+0.299)#66 | 2.1%(+0.823)#4,654 |
| 67. | Marlborough | 3.0% | 2.7%(+0.292)#67 | 2.1%(+0.816)#4,670 |
| 68. | The Pinehills | 3.0% | 2.7%(+0.283)#68 | 2.1%(+0.807)#4,692 |
| 69. | Newton | 2.9% | 2.7%(+0.254)#69 | 2.1%(+0.779)#4,769 |
| 70. | Danvers | 2.9% | 2.7%(+0.212)#70 | 2.1%(+0.737)#4,886 |
| 71. | West Concord | 2.8% | 2.7%(+0.170)#71 | 2.1%(+0.695)#5,002 |
| 72. | Marion Center | 2.8% | 2.7%(+0.161)#72 | 2.1%(+0.686)#5,021 |
| 73. | Whitinsville | 2.8% | 2.7%(+0.153)#73 | 2.1%(+0.677)#5,035 |
| 74. | Foxborough | 2.8% | 2.7%(+0.130)#74 | 2.1%(+0.655)#5,109 |
| 75. | Plymouth | 2.8% | 2.7%(+0.123)#75 | 2.1%(+0.647)#5,130 |
| 76. | Petersham | 2.8% | 2.7%(+0.085)#76 | 2.1%(+0.609)#5,246 |
| 77. | Beverly | 2.8% | 2.7%(+0.082)#77 | 2.1%(+0.606)#5,255 |
| 78. | Provincetown | 2.7% | 2.7%(+0.074)#78 | 2.1%(+0.599)#5,270 |
| 79. | Yarmouth Port | 2.7% | 2.7%(+0.058)#79 | 2.1%(+0.583)#5,315 |
| 80. | Leominster | 2.7% | 2.7%(+0.045)#80 | 2.1%(+0.570)#5,369 |
| 81. | West Brookfield | 2.7% | 2.7%(+0.029)#81 | 2.1%(+0.553)#5,411 |
| 82. | Gloucester | 2.7% | 2.7%(+0.005)#82 | 2.1%(+0.529)#5,499 |
| 83. | North Attleborough | 2.7% | 2.7%(+0.003)#83 | 2.1%(+0.528)#5,503 |
| 84. | Lee | 2.6% | 2.7%(-0.025)#84 | 2.1%(+0.499)#5,588 |
| 85. | Norwood | 2.6% | 2.7%(-0.040)#85 | 2.1%(+0.484)#5,628 |
| 86. | Medfield | 2.6% | 2.7%(-0.045)#86 | 2.1%(+0.479)#5,653 |
| 87. | Marblehead | 2.6% | 2.7%(-0.050)#87 | 2.1%(+0.474)#5,664 |
| 88. | Framingham | 2.6% | 2.7%(-0.060)#88 | 2.1%(+0.464)#5,691 |
| 89. | Smith Mills | 2.6% | 2.7%(-0.101)#89 | 2.1%(+0.424)#5,814 |
| 90. | Attleboro | 2.6% | 2.7%(-0.121)#90 | 2.1%(+0.404)#5,879 |
| 91. | Northborough | 2.5% | 2.7%(-0.127)#91 | 2.1%(+0.398)#5,899 |
| 92. | Seabrook | 2.5% | 2.7%(-0.215)#92 | 2.1%(+0.310)#6,163 |
| 93. | Townsend | 2.4% | 2.7%(-0.244)#93 | 2.1%(+0.281)#6,264 |
| 94. | Weymouth Town | 2.4% | 2.7%(-0.286)#94 | 2.1%(+0.238)#6,421 |
| 95. | Agawam Town | 2.4% | 2.7%(-0.289)#95 | 2.1%(+0.235)#6,430 |
| 96. | Upton | 2.4% | 2.7%(-0.313)#96 | 2.1%(+0.212)#6,508 |
| 97. | North Adams | 2.3% | 2.7%(-0.334)#97 | 2.1%(+0.190)#6,589 |
| 98. | Sturbridge | 2.3% | 2.7%(-0.378)#98 | 2.1%(+0.147)#6,754 |
| 99. | Fitchburg | 2.3% | 2.7%(-0.379)#99 | 2.1%(+0.145)#6,759 |
| 100. | Harwich Port | 2.3% | 2.7%(-0.379)#100 | 2.1%(+0.145)#6,760 |
Common Questions
What are the Top 10 Cities with the Highest Percentage of Population Employed in Architecture & Engineering in Massachusetts?
Top 10 Cities with the Highest Percentage of Population Employed in Architecture & Engineering in Massachusetts are:
#1
21.6%
#2
14.2%
#3
13.6%
#4
12.9%
#5
12.6%
#6
10.7%
#7
8.2%
#8
6.8%
#9
6.6%
#10
6.3%
What city has the Highest Percentage of Population Employed in Architecture & Engineering in Massachusetts?
Housatonic has the Highest Percentage of Population Employed in Architecture & Engineering in Massachusetts with 21.6%.
What is the Percentage of Population Employed in Architecture & Engineering in the State of Massachusetts?
Percentage of Population Employed in Architecture & Engineering in Massachusetts is 2.7%.
What is the Percentage of Population Employed in Architecture & Engineering in the United States?
Percentage of Population Employed in Architecture & Engineering in the United States is 2.1%.