Cities with the Highest Percentage of Population Employed in Architecture & Engineering in Michigan
RELATED REPORTS & OPTIONS
Architecture & Engineering
Michigan
Compare Cities
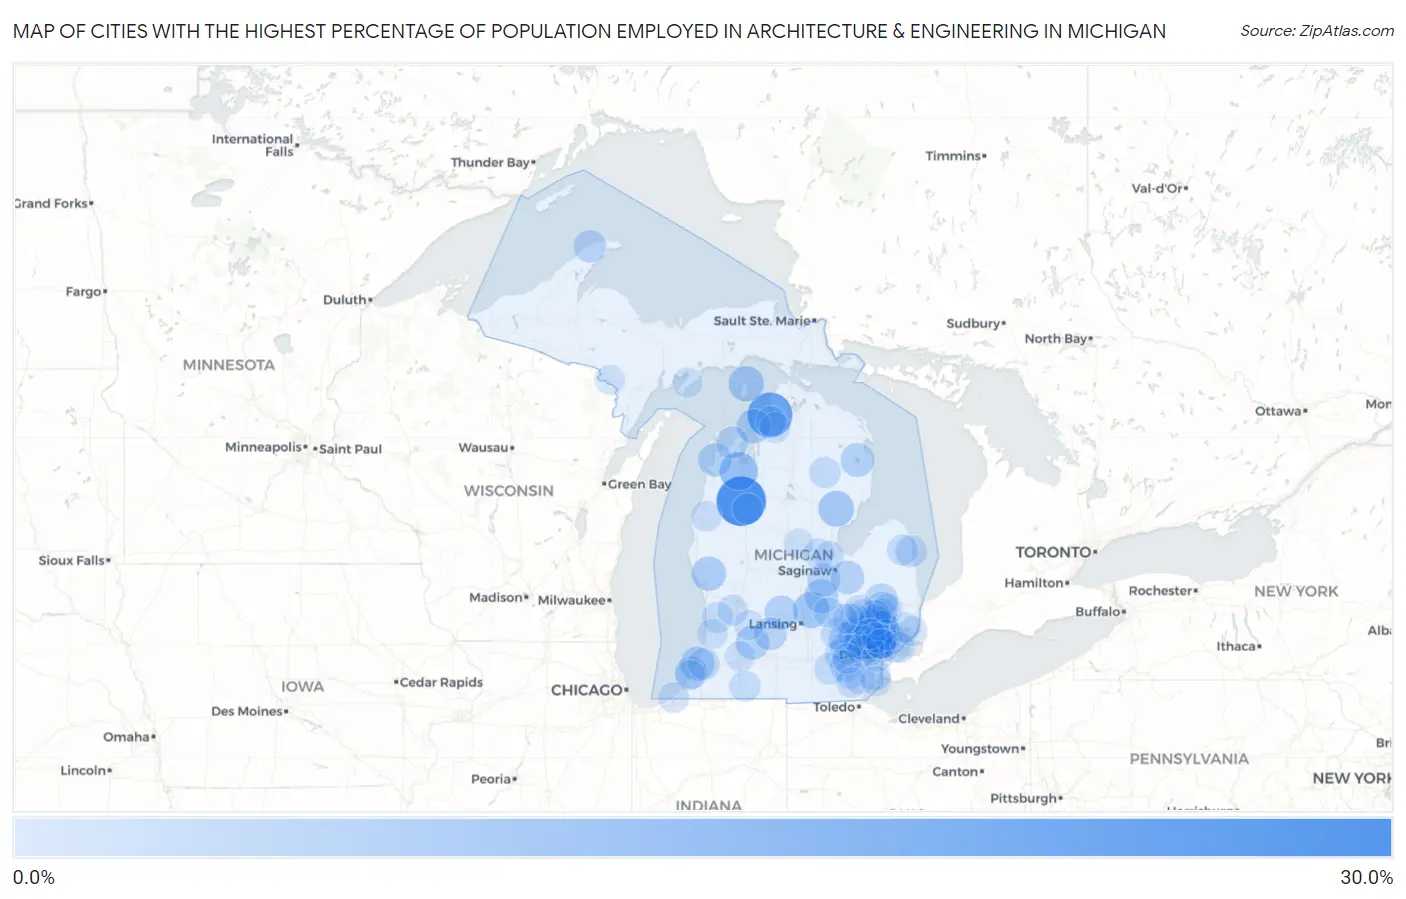
Map of Cities with the Highest Percentage of Population Employed in Architecture & Engineering in Michigan
0.0%
30.0%
Cities with the Highest Percentage of Population Employed in Architecture & Engineering in Michigan
| City | % Employed | vs State | vs National | |
| 1. | Boon | 26.1% | 3.4%(+22.7)#1 | 2.1%(+23.9)#79 |
| 2. | Bay Shore | 20.9% | 3.4%(+17.5)#2 | 2.1%(+18.7)#126 |
| 3. | Cambria | 19.3% | 3.4%(+15.9)#3 | 2.1%(+17.1)#144 |
| 4. | Lake Gogebic | 19.0% | 3.4%(+15.7)#4 | 2.1%(+16.9)#147 |
| 5. | Chums Corner | 13.2% | 3.4%(+9.79)#5 | 2.1%(+11.0)#299 |
| 6. | Auburn Hills | 13.0% | 3.4%(+9.59)#6 | 2.1%(+10.8)#305 |
| 7. | Lake Victoria | 10.8% | 3.4%(+7.48)#7 | 2.1%(+8.69)#434 |
| 8. | Prescott | 10.3% | 3.4%(+6.98)#8 | 2.1%(+8.20)#468 |
| 9. | Troy | 10.1% | 3.4%(+6.72)#9 | 2.1%(+7.93)#487 |
| 10. | St James | 10.0% | 3.4%(+6.63)#10 | 2.1%(+7.85)#494 |
| 11. | Rochester Hills | 9.4% | 3.4%(+6.06)#11 | 2.1%(+7.28)#545 |
| 12. | Royal Oak | 9.2% | 3.4%(+5.81)#12 | 2.1%(+7.03)#556 |
| 13. | Twin Lake | 8.9% | 3.4%(+5.53)#13 | 2.1%(+6.75)#592 |
| 14. | Norwood | 8.9% | 3.4%(+5.52)#14 | 2.1%(+6.74)#594 |
| 15. | Lake Michigan Beach | 8.8% | 3.4%(+5.44)#15 | 2.1%(+6.66)#607 |
| 16. | Farmington | 8.8% | 3.4%(+5.43)#16 | 2.1%(+6.65)#608 |
| 17. | Henderson | 8.7% | 3.4%(+5.33)#17 | 2.1%(+6.55)#616 |
| 18. | Novi | 8.5% | 3.4%(+5.09)#18 | 2.1%(+6.31)#646 |
| 19. | Hubbard Lake | 8.5% | 3.4%(+5.09)#19 | 2.1%(+6.31)#648 |
| 20. | Delton | 8.4% | 3.4%(+5.00)#20 | 2.1%(+6.22)#656 |
| 21. | Farmington Hills | 8.2% | 3.4%(+4.87)#21 | 2.1%(+6.09)#676 |
| 22. | Millburg | 8.2% | 3.4%(+4.81)#22 | 2.1%(+6.03)#689 |
| 23. | Portland | 8.2% | 3.4%(+4.79)#23 | 2.1%(+6.01)#692 |
| 24. | Empire | 8.1% | 3.4%(+4.74)#24 | 2.1%(+5.96)#702 |
| 25. | Frankenmuth | 8.0% | 3.4%(+4.60)#25 | 2.1%(+5.81)#729 |
| 26. | St Charles | 7.5% | 3.4%(+4.14)#26 | 2.1%(+5.36)#809 |
| 27. | Nashville | 7.4% | 3.4%(+4.03)#27 | 2.1%(+5.25)#826 |
| 28. | Milford | 7.3% | 3.4%(+3.95)#28 | 2.1%(+5.17)#841 |
| 29. | Rochester | 7.3% | 3.4%(+3.93)#29 | 2.1%(+5.15)#848 |
| 30. | Village Of Clarkston | 7.3% | 3.4%(+3.91)#30 | 2.1%(+5.12)#854 |
| 31. | Attica | 7.3% | 3.4%(+3.89)#31 | 2.1%(+5.11)#857 |
| 32. | Bloomfield Hills | 7.2% | 3.4%(+3.84)#32 | 2.1%(+5.06)#875 |
| 33. | Naubinway | 7.1% | 3.4%(+3.78)#33 | 2.1%(+4.99)#896 |
| 34. | Eagle River | 7.1% | 3.4%(+3.78)#34 | 2.1%(+4.99)#897 |
| 35. | Clawson | 7.1% | 3.4%(+3.70)#35 | 2.1%(+4.92)#915 |
| 36. | Brighton | 6.9% | 3.4%(+3.52)#36 | 2.1%(+4.74)#962 |
| 37. | St Joseph | 6.9% | 3.4%(+3.51)#37 | 2.1%(+4.73)#967 |
| 38. | Leland | 6.6% | 3.4%(+3.24)#38 | 2.1%(+4.46)#1,016 |
| 39. | Whitmore Lake | 6.4% | 3.4%(+3.05)#39 | 2.1%(+4.27)#1,077 |
| 40. | Dryden | 6.4% | 3.4%(+3.04)#40 | 2.1%(+4.26)#1,083 |
| 41. | Oxford | 6.4% | 3.4%(+3.02)#41 | 2.1%(+4.24)#1,087 |
| 42. | Ferndale | 6.3% | 3.4%(+2.91)#42 | 2.1%(+4.12)#1,127 |
| 43. | Wolverine Lake | 6.2% | 3.4%(+2.82)#43 | 2.1%(+4.04)#1,168 |
| 44. | Paw Paw Lake | 6.1% | 3.4%(+2.73)#44 | 2.1%(+3.95)#1,194 |
| 45. | Forestville | 6.1% | 3.4%(+2.69)#45 | 2.1%(+3.91)#1,209 |
| 46. | Ortonville | 6.0% | 3.4%(+2.67)#46 | 2.1%(+3.89)#1,219 |
| 47. | Berkley | 5.9% | 3.4%(+2.51)#47 | 2.1%(+3.73)#1,303 |
| 48. | Lake Orion | 5.9% | 3.4%(+2.50)#48 | 2.1%(+3.72)#1,307 |
| 49. | Manchester | 5.8% | 3.4%(+2.46)#49 | 2.1%(+3.68)#1,326 |
| 50. | Grosse Pointe Woods | 5.8% | 3.4%(+2.43)#50 | 2.1%(+3.65)#1,343 |
| 51. | Chassell | 5.8% | 3.4%(+2.39)#51 | 2.1%(+3.60)#1,361 |
| 52. | Kincheloe | 5.6% | 3.4%(+2.24)#52 | 2.1%(+3.46)#1,440 |
| 53. | Mio | 5.6% | 3.4%(+2.20)#53 | 2.1%(+3.42)#1,464 |
| 54. | Dexter | 5.6% | 3.4%(+2.20)#54 | 2.1%(+3.42)#1,465 |
| 55. | Fulton | 5.6% | 3.4%(+2.19)#55 | 2.1%(+3.41)#1,477 |
| 56. | Wixom | 5.5% | 3.4%(+2.18)#56 | 2.1%(+3.39)#1,486 |
| 57. | Livonia | 5.5% | 3.4%(+2.14)#57 | 2.1%(+3.36)#1,503 |
| 58. | Sterling Heights | 5.5% | 3.4%(+2.09)#58 | 2.1%(+3.31)#1,527 |
| 59. | Saline | 5.4% | 3.4%(+2.04)#59 | 2.1%(+3.26)#1,556 |
| 60. | Centreville | 5.4% | 3.4%(+2.04)#60 | 2.1%(+3.26)#1,559 |
| 61. | Howell | 5.3% | 3.4%(+1.97)#61 | 2.1%(+3.19)#1,600 |
| 62. | Zeeland | 5.3% | 3.4%(+1.97)#62 | 2.1%(+3.19)#1,601 |
| 63. | South Rockwood | 5.3% | 3.4%(+1.93)#63 | 2.1%(+3.15)#1,627 |
| 64. | Dodgeville | 5.3% | 3.4%(+1.92)#64 | 2.1%(+3.14)#1,631 |
| 65. | Minden City | 5.2% | 3.4%(+1.84)#65 | 2.1%(+3.06)#1,688 |
| 66. | Plymouth | 5.2% | 3.4%(+1.83)#66 | 2.1%(+3.05)#1,694 |
| 67. | Milan | 5.2% | 3.4%(+1.79)#67 | 2.1%(+3.01)#1,728 |
| 68. | Holly | 5.2% | 3.4%(+1.79)#68 | 2.1%(+3.01)#1,730 |
| 69. | Leonard | 5.1% | 3.4%(+1.78)#69 | 2.1%(+3.00)#1,738 |
| 70. | Maybee | 5.1% | 3.4%(+1.76)#70 | 2.1%(+2.98)#1,746 |
| 71. | Wedgewood | 5.1% | 3.4%(+1.73)#71 | 2.1%(+2.95)#1,762 |
| 72. | Midland | 5.1% | 3.4%(+1.71)#72 | 2.1%(+2.92)#1,782 |
| 73. | Grand Beach | 5.0% | 3.4%(+1.67)#73 | 2.1%(+2.89)#1,804 |
| 74. | Boyne City | 5.0% | 3.4%(+1.64)#74 | 2.1%(+2.86)#1,824 |
| 75. | Dearborn | 5.0% | 3.4%(+1.59)#75 | 2.1%(+2.80)#1,865 |
| 76. | Fenton | 4.9% | 3.4%(+1.49)#76 | 2.1%(+2.71)#1,934 |
| 77. | Grandville | 4.9% | 3.4%(+1.49)#77 | 2.1%(+2.70)#1,939 |
| 78. | Goodrich | 4.8% | 3.4%(+1.45)#78 | 2.1%(+2.66)#1,973 |
| 79. | Ann Arbor | 4.8% | 3.4%(+1.42)#79 | 2.1%(+2.64)#1,985 |
| 80. | Free Soil | 4.8% | 3.4%(+1.39)#80 | 2.1%(+2.61)#2,011 |
| 81. | Village Of Grosse Pointe Shores | 4.7% | 3.4%(+1.36)#81 | 2.1%(+2.58)#2,026 |
| 82. | Birmingham | 4.7% | 3.4%(+1.36)#82 | 2.1%(+2.57)#2,034 |
| 83. | New Baltimore | 4.7% | 3.4%(+1.36)#83 | 2.1%(+2.57)#2,035 |
| 84. | Almont | 4.7% | 3.4%(+1.36)#84 | 2.1%(+2.57)#2,036 |
| 85. | Dundee | 4.7% | 3.4%(+1.34)#85 | 2.1%(+2.56)#2,048 |
| 86. | Keego Harbor | 4.7% | 3.4%(+1.30)#86 | 2.1%(+2.52)#2,086 |
| 87. | Auburn | 4.6% | 3.4%(+1.20)#87 | 2.1%(+2.42)#2,163 |
| 88. | Pleasant Ridge | 4.6% | 3.4%(+1.19)#88 | 2.1%(+2.41)#2,172 |
| 89. | Estral Beach | 4.5% | 3.4%(+1.18)#89 | 2.1%(+2.40)#2,191 |
| 90. | Westwood | 4.5% | 3.4%(+1.16)#90 | 2.1%(+2.38)#2,210 |
| 91. | Horton Bay | 4.5% | 3.4%(+1.15)#91 | 2.1%(+2.37)#2,222 |
| 92. | Fennville | 4.5% | 3.4%(+1.14)#92 | 2.1%(+2.36)#2,230 |
| 93. | Argentine | 4.5% | 3.4%(+1.13)#93 | 2.1%(+2.35)#2,233 |
| 94. | Pearl Beach | 4.5% | 3.4%(+1.11)#94 | 2.1%(+2.33)#2,248 |
| 95. | Shoreham | 4.4% | 3.4%(+1.07)#95 | 2.1%(+2.29)#2,275 |
| 96. | Coleman | 4.4% | 3.4%(+1.06)#96 | 2.1%(+2.27)#2,290 |
| 97. | Middleville | 4.4% | 3.4%(+1.04)#97 | 2.1%(+2.26)#2,296 |
| 98. | Bancroft | 4.4% | 3.4%(+1.03)#98 | 2.1%(+2.25)#2,310 |
| 99. | Garden | 4.3% | 3.4%(+0.919)#99 | 2.1%(+2.14)#2,418 |
| 100. | Norway | 4.3% | 3.4%(+0.918)#100 | 2.1%(+2.14)#2,421 |
Common Questions
What are the Top 10 Cities with the Highest Percentage of Population Employed in Architecture & Engineering in Michigan?
Top 10 Cities with the Highest Percentage of Population Employed in Architecture & Engineering in Michigan are:
#1
26.1%
#2
20.9%
#3
13.2%
#4
13.0%
#5
10.8%
#6
10.3%
#7
10.1%
#8
10.0%
#9
9.4%
#10
9.2%
What city has the Highest Percentage of Population Employed in Architecture & Engineering in Michigan?
Boon has the Highest Percentage of Population Employed in Architecture & Engineering in Michigan with 26.1%.
What is the Percentage of Population Employed in Architecture & Engineering in the State of Michigan?
Percentage of Population Employed in Architecture & Engineering in Michigan is 3.4%.
What is the Percentage of Population Employed in Architecture & Engineering in the United States?
Percentage of Population Employed in Architecture & Engineering in the United States is 2.1%.