Los Altos, CA Map & Demographics
Los Altos Map
Los Altos Overview
$142,219
PER CAPITA INCOME
$250,001
AVG FAMILY INCOME
$250,001
AVG HOUSEHOLD INCOME
54.3%
WAGE / INCOME GAP [ % ]
45.7¢/ $1
WAGE / INCOME GAP [ $ ]
0.48
INEQUALITY / GINI INDEX
31,133
TOTAL POPULATION
15,685
MALE POPULATION
15,448
FEMALE POPULATION
101.53
MALES / 100 FEMALES
98.49
FEMALES / 100 MALES
46.6
MEDIAN AGE
3.2
AVG FAMILY SIZE
2.8
AVG HOUSEHOLD SIZE
14,361
LABOR FORCE [ PEOPLE ]
58.1%
PERCENT IN LABOR FORCE
3.9%
UNEMPLOYMENT RATE
Los Altos Area Codes
Income in Los Altos
Income Overview in Los Altos
Per Capita Income in Los Altos is $142,219, while median incomes of families and households are $250,001 and $250,001 respectively.
| Characteristic | Number | Measure |
| Per Capita Income | 31,133 | $142,219 |
| Median Family Income | 8,824 | $250,001 |
| Mean Family Income | 8,824 | $451,282 |
| Median Household Income | 10,887 | $250,001 |
| Mean Household Income | 10,887 | $400,817 |
| Income Deficit | 8,824 | $0 |
| Wage / Income Gap (%) | 31,133 | 54.34% |
| Wage / Income Gap ($) | 31,133 | 45.66¢ per $1 |
| Gini / Inequality Index | 31,133 | 0.48 |
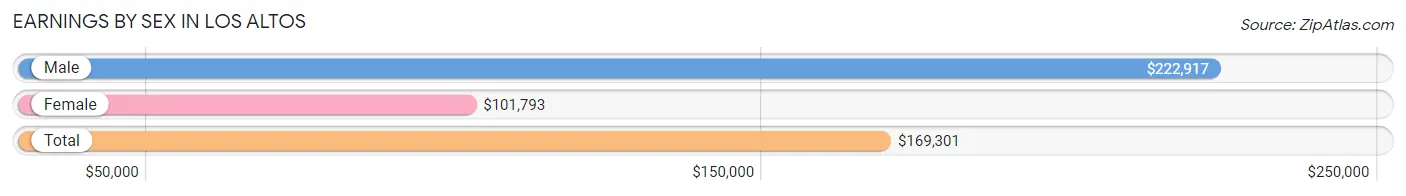
Earnings by Sex in Los Altos
Average Earnings in Los Altos are $169,301, $222,917 for men and $101,793 for women, a difference of 54.3%.
| Sex | Number | Average Earnings |
| Male | 8,238 (55.6%) | $222,917 |
| Female | 6,578 (44.4%) | $101,793 |
| Total | 14,816 (100.0%) | $169,301 |
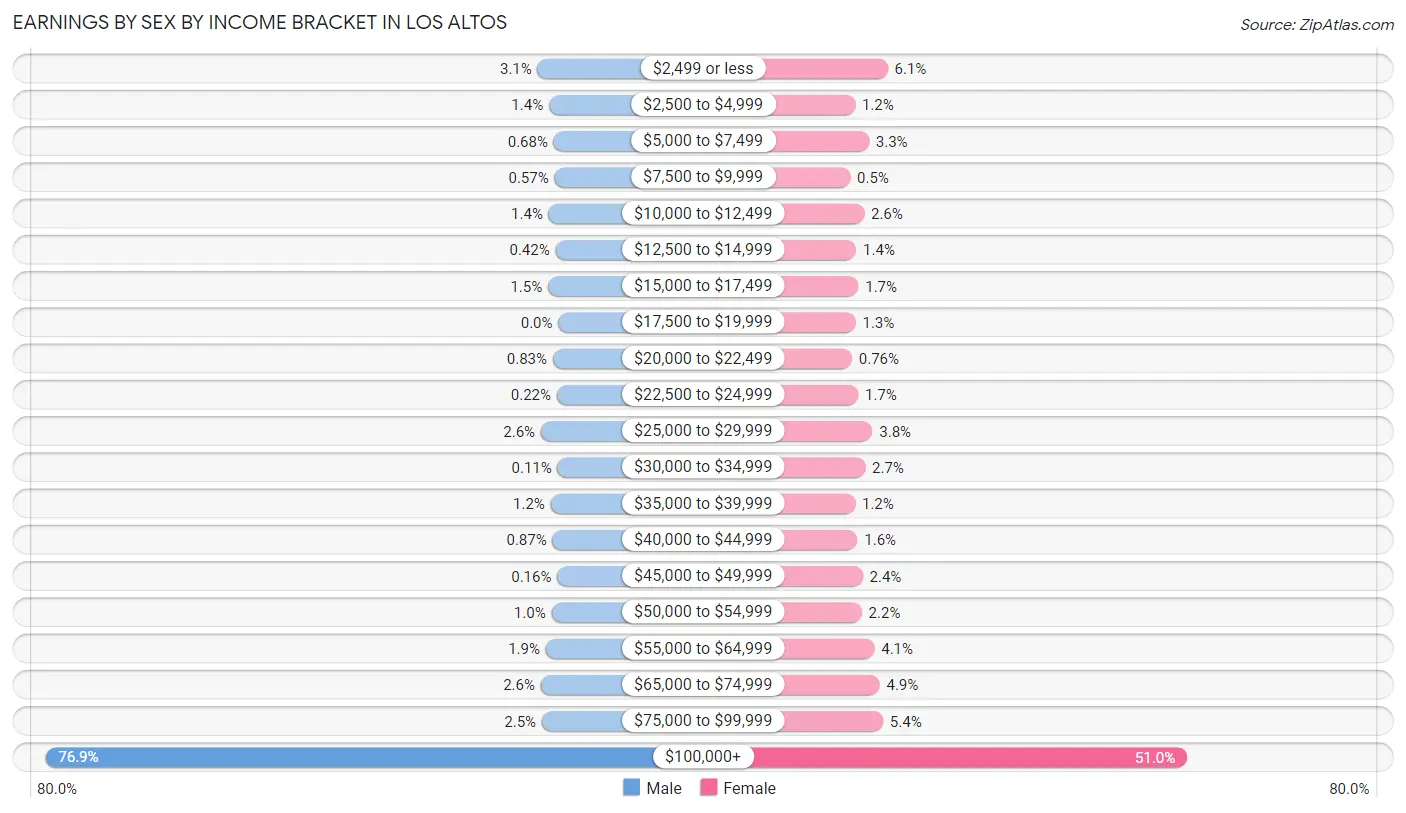
Earnings by Sex by Income Bracket in Los Altos
The most common earnings brackets in Los Altos are $100,000+ for men (6,333 | 76.9%) and $100,000+ for women (3,355 | 51.0%).
| Income | Male | Female |
| $2,499 or less | 256 (3.1%) | 402 (6.1%) |
| $2,500 to $4,999 | 115 (1.4%) | 80 (1.2%) |
| $5,000 to $7,499 | 56 (0.7%) | 217 (3.3%) |
| $7,500 to $9,999 | 47 (0.6%) | 33 (0.5%) |
| $10,000 to $12,499 | 119 (1.4%) | 170 (2.6%) |
| $12,500 to $14,999 | 35 (0.4%) | 92 (1.4%) |
| $15,000 to $17,499 | 127 (1.5%) | 113 (1.7%) |
| $17,500 to $19,999 | 0 (0.0%) | 86 (1.3%) |
| $20,000 to $22,499 | 68 (0.8%) | 50 (0.8%) |
| $22,500 to $24,999 | 18 (0.2%) | 111 (1.7%) |
| $25,000 to $29,999 | 215 (2.6%) | 252 (3.8%) |
| $30,000 to $34,999 | 9 (0.1%) | 180 (2.7%) |
| $35,000 to $39,999 | 95 (1.1%) | 80 (1.2%) |
| $40,000 to $44,999 | 72 (0.9%) | 104 (1.6%) |
| $45,000 to $49,999 | 13 (0.2%) | 156 (2.4%) |
| $50,000 to $54,999 | 85 (1.0%) | 147 (2.2%) |
| $55,000 to $64,999 | 155 (1.9%) | 271 (4.1%) |
| $65,000 to $74,999 | 217 (2.6%) | 323 (4.9%) |
| $75,000 to $99,999 | 203 (2.5%) | 356 (5.4%) |
| $100,000+ | 6,333 (76.9%) | 3,355 (51.0%) |
| Total | 8,238 (100.0%) | 6,578 (100.0%) |
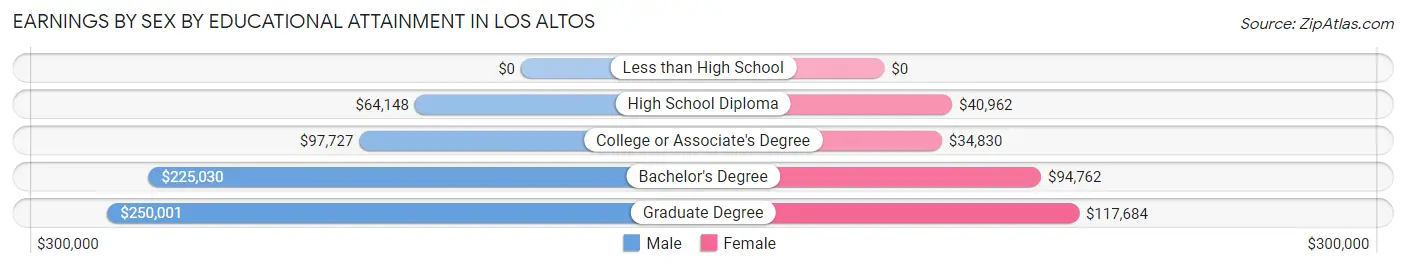
Earnings by Sex by Educational Attainment in Los Altos
Average earnings in Los Altos are $235,159 for men and $112,694 for women, a difference of 52.1%. Men with an educational attainment of graduate degree enjoy the highest average annual earnings of $250,001, while those with high school diploma education earn the least with $64,148. Women with an educational attainment of graduate degree earn the most with the average annual earnings of $117,684, while those with college or associate's degree education have the smallest earnings of $34,830.
| Educational Attainment | Male Income | Female Income |
| Less than High School | - | - |
| High School Diploma | $64,148 | $40,962 |
| College or Associate's Degree | $97,727 | $34,830 |
| Bachelor's Degree | $225,030 | $94,762 |
| Graduate Degree | $250,001 | $117,684 |
| Total | $235,159 | $112,694 |
Family Income in Los Altos
Family Income Brackets in Los Altos
According to the Los Altos family income data, there are 6,362 families falling into the $200,000+ income range, which is the most common income bracket and makes up 72.1% of all families. Conversely, the $10,000 to $14,999 income bracket is the least frequent group with only 9 families (0.1%) belonging to this category.
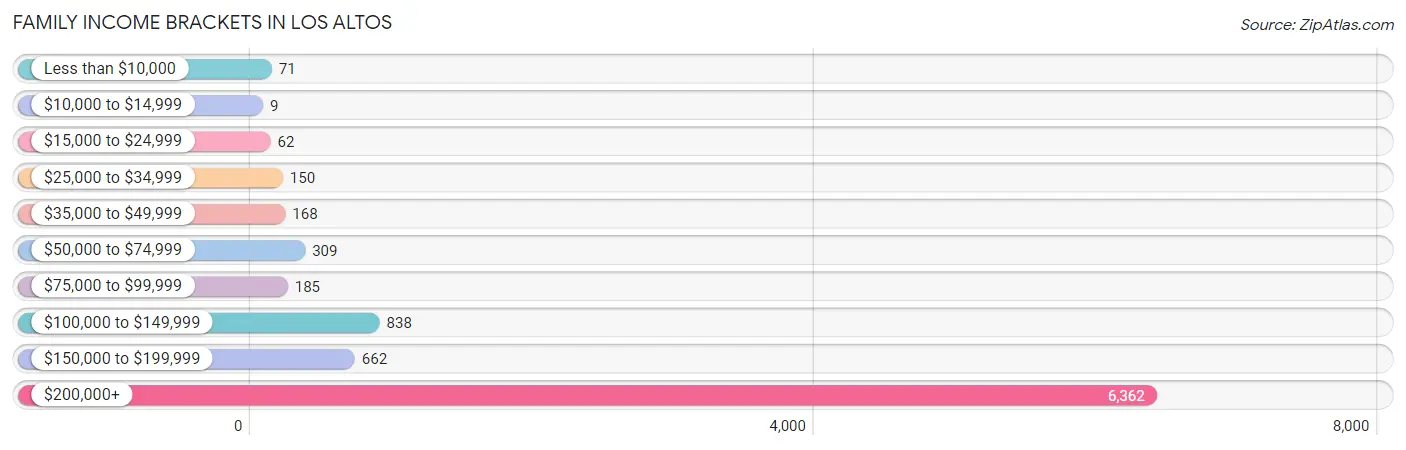
| Income Bracket | # Families | % Families |
| Less than $10,000 | 71 | 0.8% |
| $10,000 to $14,999 | 9 | 0.1% |
| $15,000 to $24,999 | 62 | 0.7% |
| $25,000 to $34,999 | 150 | 1.7% |
| $35,000 to $49,999 | 168 | 1.9% |
| $50,000 to $74,999 | 309 | 3.5% |
| $75,000 to $99,999 | 185 | 2.1% |
| $100,000 to $149,999 | 838 | 9.5% |
| $150,000 to $199,999 | 662 | 7.5% |
| $200,000+ | 6,362 | 72.1% |
Family Income by Famaliy Size in Los Altos
3-person families (1,925 | 21.8%) account for the highest median family income in Los Altos with $250,001 per family, while 2-person families (3,576 | 40.5%) have the highest median income of $122,000 per family member.
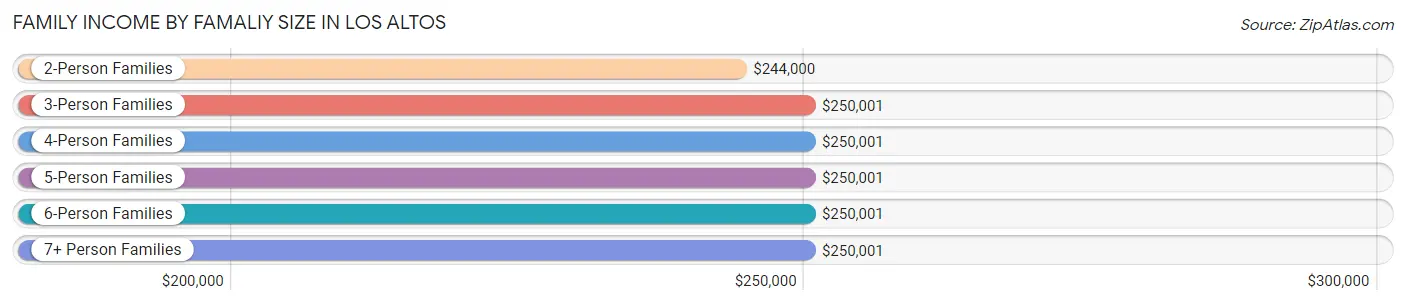
| Income Bracket | # Families | Median Income |
| 2-Person Families | 3,576 (40.5%) | $244,000 |
| 3-Person Families | 1,925 (21.8%) | $250,001 |
| 4-Person Families | 2,497 (28.3%) | $250,001 |
| 5-Person Families | 696 (7.9%) | $250,001 |
| 6-Person Families | 87 (1.0%) | $250,001 |
| 7+ Person Families | 43 (0.5%) | $250,001 |
| Total | 8,824 (100.0%) | $250,001 |
Family Income by Number of Earners in Los Altos
The median family income in Los Altos is $250,001, with families comprising 2 earners (4,120) having the highest median family income of $250,001, while families with no earners (1,403) have the lowest median family income of $135,673, accounting for 46.7% and 15.9% of families, respectively.
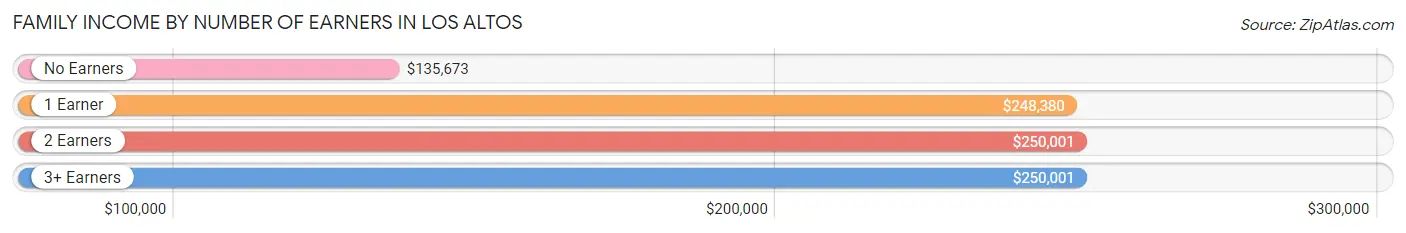
| Number of Earners | # Families | Median Income |
| No Earners | 1,403 (15.9%) | $135,673 |
| 1 Earner | 2,646 (30.0%) | $248,380 |
| 2 Earners | 4,120 (46.7%) | $250,001 |
| 3+ Earners | 655 (7.4%) | $250,001 |
| Total | 8,824 (100.0%) | $250,001 |
Household Income in Los Altos
Household Income Brackets in Los Altos
With 6,989 households falling in the category, the $200,000+ income range is the most frequent in Los Altos, accounting for 64.2% of all households. In contrast, only 65 households (0.6%) fall into the $10,000 to $14,999 income bracket, making it the least populous group.
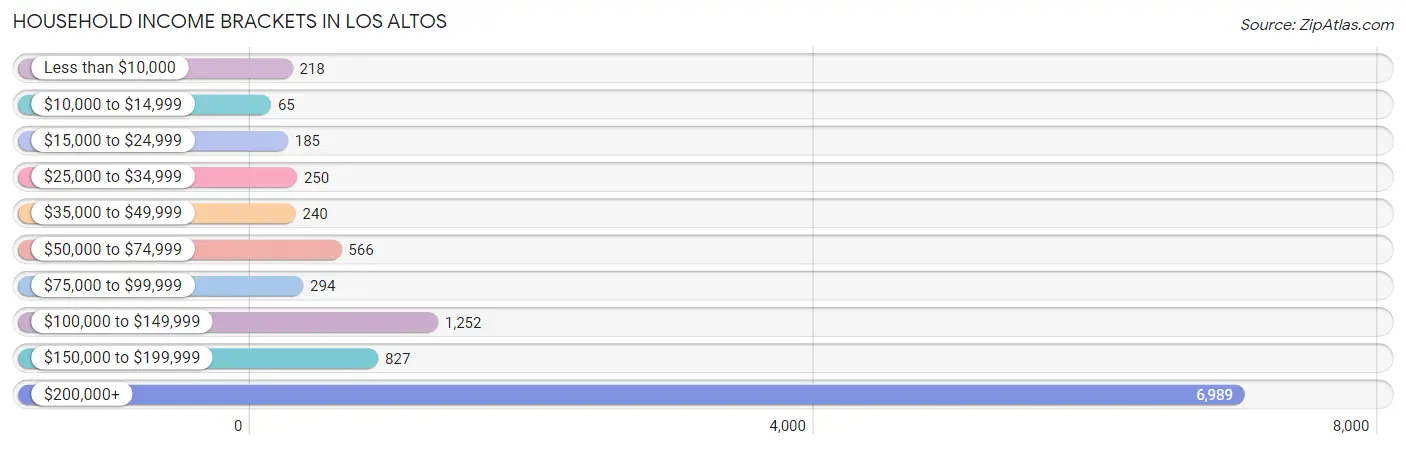
| Income Bracket | # Households | % Households |
| Less than $10,000 | 218 | 2.0% |
| $10,000 to $14,999 | 65 | 0.6% |
| $15,000 to $24,999 | 185 | 1.7% |
| $25,000 to $34,999 | 250 | 2.3% |
| $35,000 to $49,999 | 240 | 2.2% |
| $50,000 to $74,999 | 566 | 5.2% |
| $75,000 to $99,999 | 294 | 2.7% |
| $100,000 to $149,999 | 1,252 | 11.5% |
| $150,000 to $199,999 | 827 | 7.6% |
| $200,000+ | 6,989 | 64.2% |
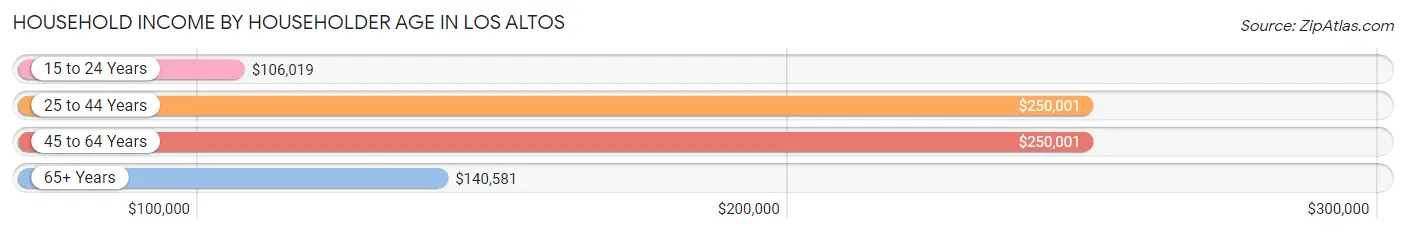
Household Income by Householder Age in Los Altos
The median household income in Los Altos is $250,001, with the highest median household income of $250,001 found in the 25 to 44 years age bracket for the primary householder. A total of 2,221 households (20.4%) fall into this category. Meanwhile, the 15 to 24 years age bracket for the primary householder has the lowest median household income of $106,019, with 44 households (0.4%) in this group.
| Income Bracket | # Households | Median Income |
| 15 to 24 Years | 44 (0.4%) | $106,019 |
| 25 to 44 Years | 2,221 (20.4%) | $250,001 |
| 45 to 64 Years | 4,991 (45.8%) | $250,001 |
| 65+ Years | 3,631 (33.4%) | $140,581 |
| Total | 10,887 (100.0%) | $250,001 |
Poverty in Los Altos
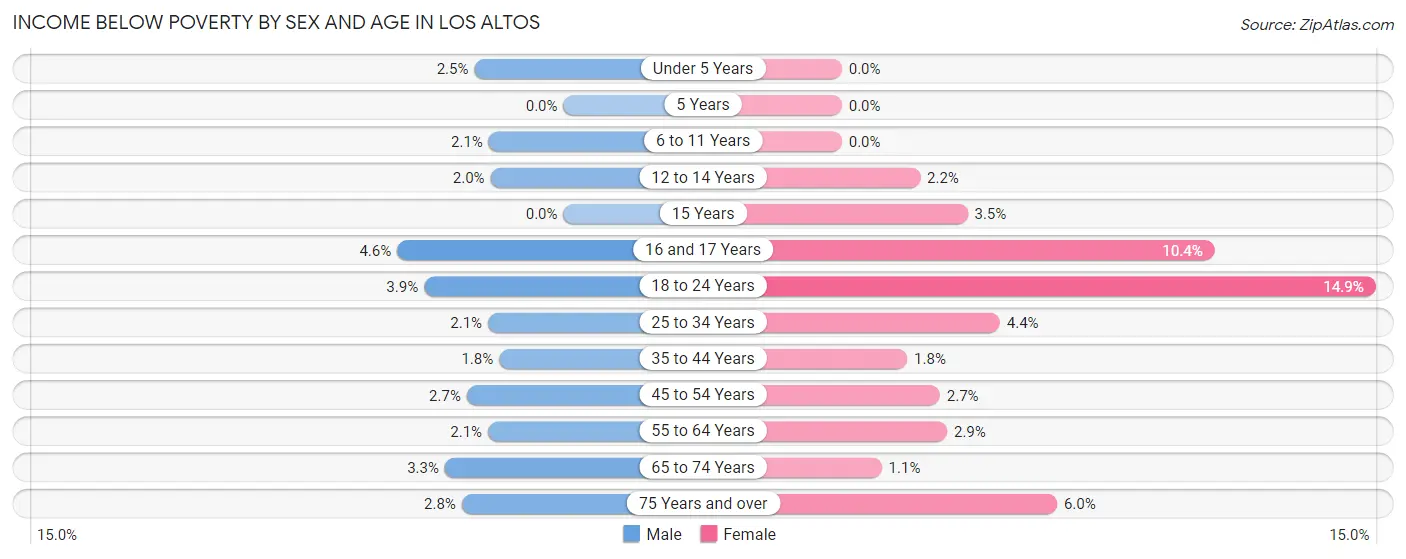
Income Below Poverty by Sex and Age in Los Altos
With 2.5% poverty level for males and 3.6% for females among the residents of Los Altos, 16 and 17 year old males and 18 to 24 year old females are the most vulnerable to poverty, with 33 males (4.6%) and 137 females (14.9%) in their respective age groups living below the poverty level.
| Age Bracket | Male | Female |
| Under 5 Years | 16 (2.5%) | 0 (0.0%) |
| 5 Years | 0 (0.0%) | 0 (0.0%) |
| 6 to 11 Years | 32 (2.1%) | 0 (0.0%) |
| 12 to 14 Years | 17 (2.0%) | 17 (2.2%) |
| 15 Years | 0 (0.0%) | 9 (3.5%) |
| 16 and 17 Years | 33 (4.6%) | 47 (10.4%) |
| 18 to 24 Years | 40 (3.9%) | 137 (14.9%) |
| 25 to 34 Years | 19 (2.1%) | 46 (4.4%) |
| 35 to 44 Years | 31 (1.8%) | 31 (1.8%) |
| 45 to 54 Years | 79 (2.7%) | 76 (2.7%) |
| 55 to 64 Years | 43 (2.1%) | 60 (2.9%) |
| 65 to 74 Years | 47 (3.3%) | 17 (1.1%) |
| 75 Years and over | 40 (2.8%) | 108 (6.0%) |
| Total | 397 (2.5%) | 548 (3.6%) |
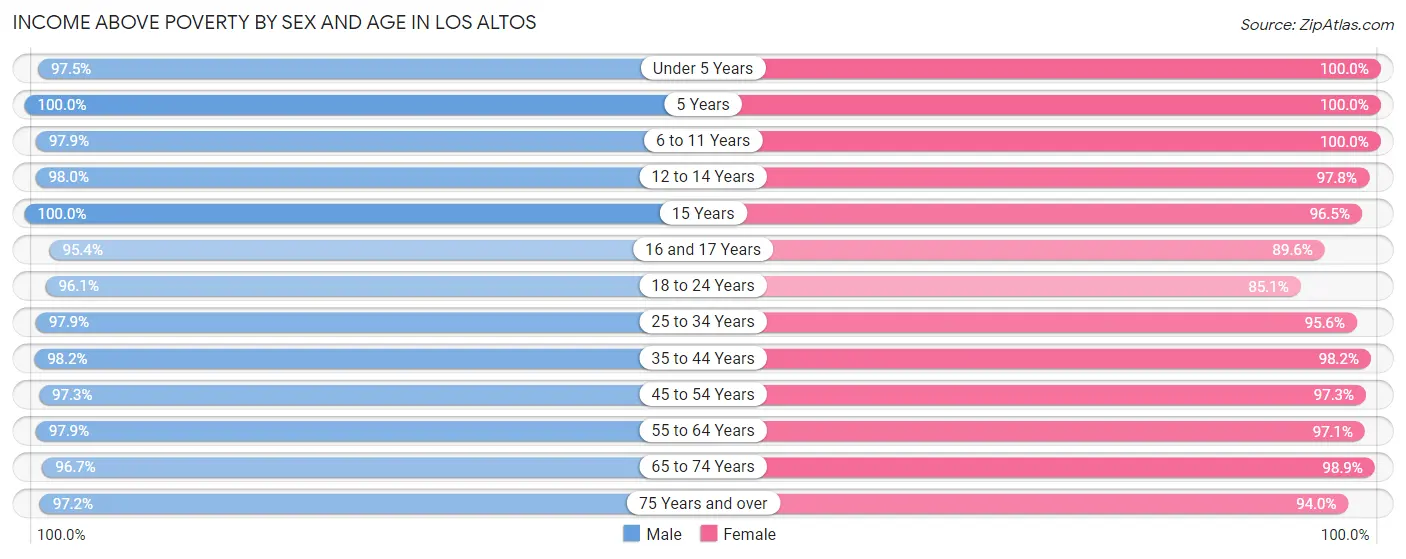
Income Above Poverty by Sex and Age in Los Altos
According to the poverty statistics in Los Altos, males aged 5 years and females aged under 5 years are the age groups that are most secure financially, with 100.0% of males and 100.0% of females in these age groups living above the poverty line.
| Age Bracket | Male | Female |
| Under 5 Years | 630 (97.5%) | 644 (100.0%) |
| 5 Years | 130 (100.0%) | 254 (100.0%) |
| 6 to 11 Years | 1,509 (97.9%) | 1,110 (100.0%) |
| 12 to 14 Years | 821 (98.0%) | 762 (97.8%) |
| 15 Years | 212 (100.0%) | 248 (96.5%) |
| 16 and 17 Years | 680 (95.4%) | 406 (89.6%) |
| 18 to 24 Years | 991 (96.1%) | 785 (85.1%) |
| 25 to 34 Years | 885 (97.9%) | 999 (95.6%) |
| 35 to 44 Years | 1,702 (98.2%) | 1,671 (98.2%) |
| 45 to 54 Years | 2,856 (97.3%) | 2,706 (97.3%) |
| 55 to 64 Years | 2,004 (97.9%) | 1,987 (97.1%) |
| 65 to 74 Years | 1,379 (96.7%) | 1,513 (98.9%) |
| 75 Years and over | 1,375 (97.2%) | 1,696 (94.0%) |
| Total | 15,174 (97.5%) | 14,781 (96.4%) |
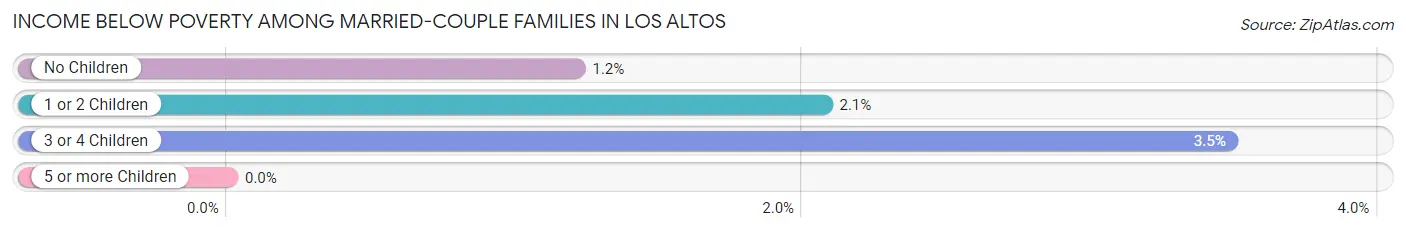
Income Below Poverty Among Married-Couple Families in Los Altos
The poverty statistics for married-couple families in Los Altos show that 1.7% or 137 of the total 8,111 families live below the poverty line. Families with 3 or 4 children have the highest poverty rate of 3.5%, comprising of 16 families. On the other hand, families with 5 or more children have the lowest poverty rate of 0.0%, which includes 0 families.
| Children | Above Poverty | Below Poverty |
| No Children | 4,233 (98.8%) | 52 (1.2%) |
| 1 or 2 Children | 3,265 (97.9%) | 69 (2.1%) |
| 3 or 4 Children | 444 (96.5%) | 16 (3.5%) |
| 5 or more Children | 32 (100.0%) | 0 (0.0%) |
| Total | 7,974 (98.3%) | 137 (1.7%) |
Income Below Poverty Among Single-Parent Households in Los Altos
According to the poverty data in Los Altos, 9.0% or 16 single-father households and 7.6% or 41 single-mother households are living below the poverty line. Among single-father households, those with no children have the highest poverty rate, with 16 households (19.3%) experiencing poverty. Likewise, among single-mother households, those with 3 or 4 children have the highest poverty rate, with 11 households (35.5%) falling below the poverty line.
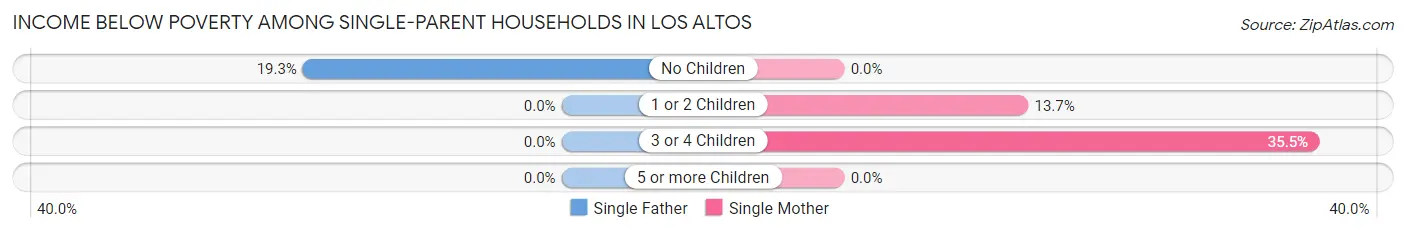
| Children | Single Father | Single Mother |
| No Children | 16 (19.3%) | 0 (0.0%) |
| 1 or 2 Children | 0 (0.0%) | 30 (13.7%) |
| 3 or 4 Children | 0 (0.0%) | 11 (35.5%) |
| 5 or more Children | 0 (0.0%) | 0 (0.0%) |
| Total | 16 (9.0%) | 41 (7.6%) |
Income Below Poverty Among Married-Couple vs Single-Parent Households in Los Altos
The poverty data for Los Altos shows that 137 of the married-couple family households (1.7%) and 57 of the single-parent households (8.0%) are living below the poverty level. Within the married-couple family households, those with 3 or 4 children have the highest poverty rate, with 16 households (3.5%) falling below the poverty line. Among the single-parent households, those with 3 or 4 children have the highest poverty rate, with 11 household (28.2%) living below poverty.
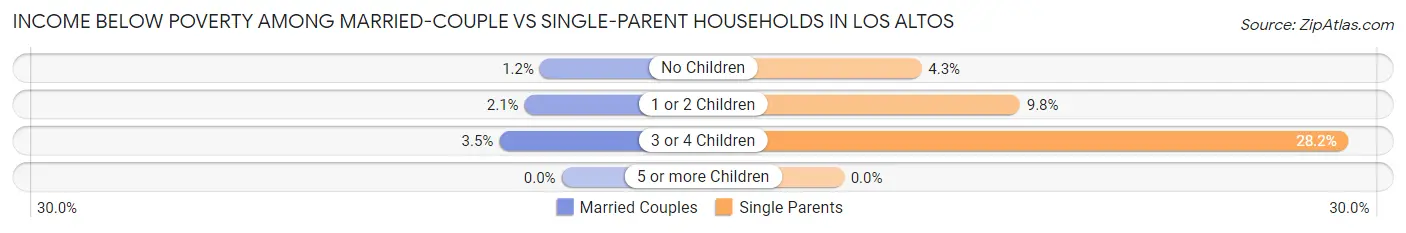
| Children | Married-Couple Families | Single-Parent Households |
| No Children | 52 (1.2%) | 16 (4.3%) |
| 1 or 2 Children | 69 (2.1%) | 30 (9.8%) |
| 3 or 4 Children | 16 (3.5%) | 11 (28.2%) |
| 5 or more Children | 0 (0.0%) | 0 (0.0%) |
| Total | 137 (1.7%) | 57 (8.0%) |
Race in Los Altos
The most populous races in Los Altos are White / Caucasian (16,982 | 54.5%), Asian (11,444 | 36.8%), and Two or more Races (1,874 | 6.0%).
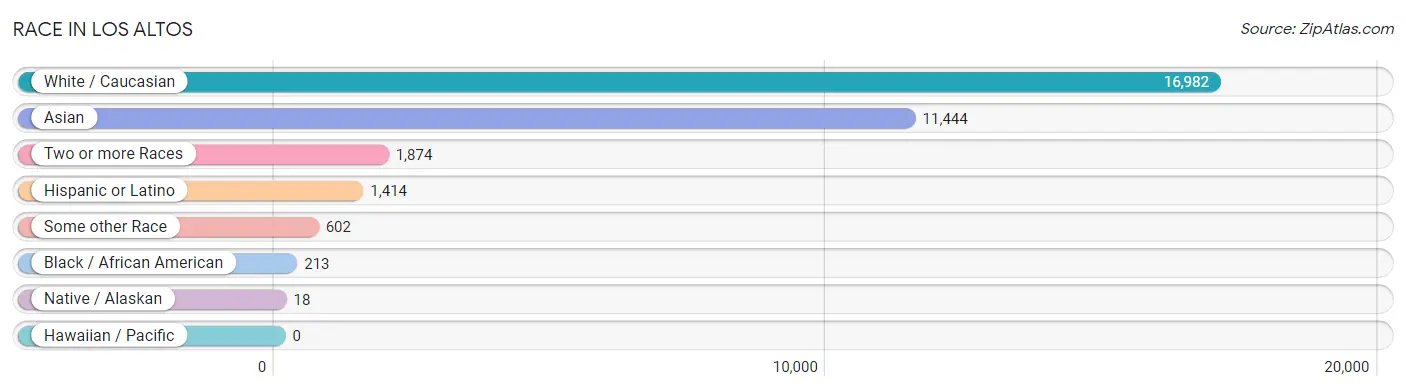
| Race | # Population | % Population |
| Asian | 11,444 | 36.8% |
| Black / African American | 213 | 0.7% |
| Hawaiian / Pacific | 0 | 0.0% |
| Hispanic or Latino | 1,414 | 4.5% |
| Native / Alaskan | 18 | 0.1% |
| White / Caucasian | 16,982 | 54.5% |
| Two or more Races | 1,874 | 6.0% |
| Some other Race | 602 | 1.9% |
| Total | 31,133 | 100.0% |
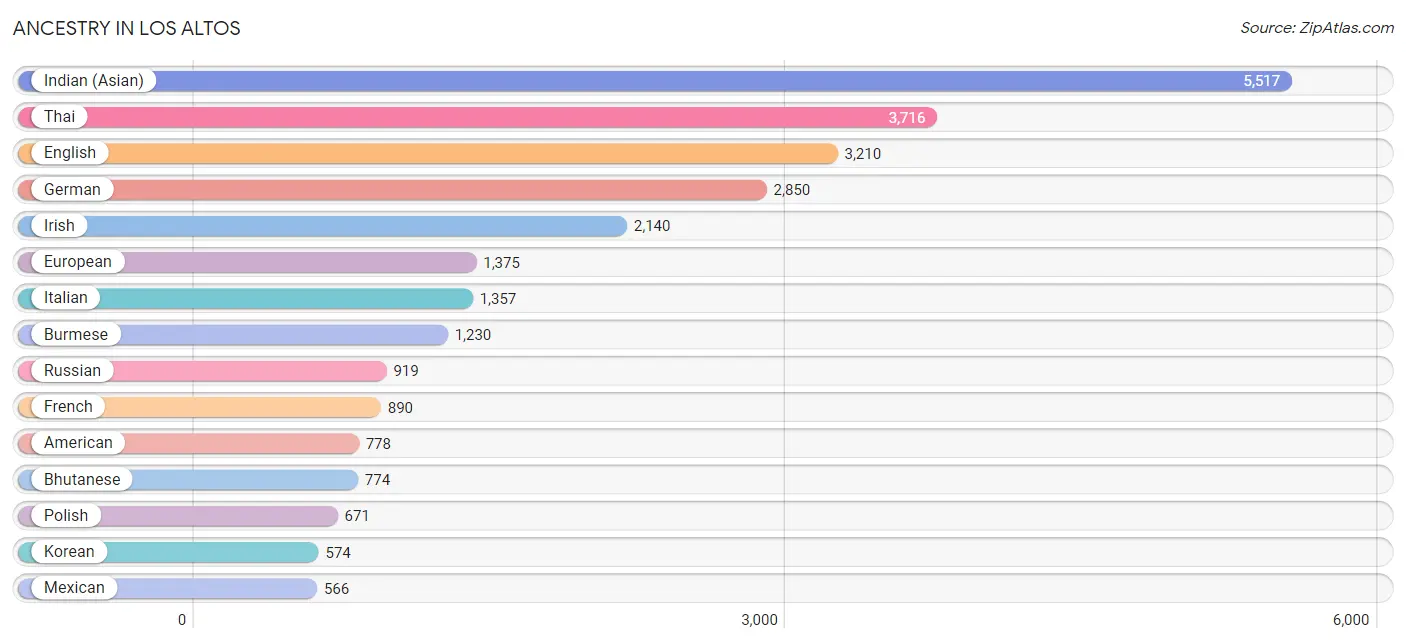
Ancestry in Los Altos
The most populous ancestries reported in Los Altos are Indian (Asian) (5,517 | 17.7%), Thai (3,716 | 11.9%), English (3,210 | 10.3%), German (2,850 | 9.1%), and Irish (2,140 | 6.9%), together accounting for 56.0% of all Los Altos residents.
| Ancestry | # Population | % Population |
| American | 778 | 2.5% |
| Apache | 15 | 0.1% |
| Arab | 286 | 0.9% |
| Argentinean | 190 | 0.6% |
| Armenian | 114 | 0.4% |
| Assyrian / Chaldean / Syriac | 8 | 0.0% |
| Australian | 91 | 0.3% |
| Austrian | 114 | 0.4% |
| Basque | 39 | 0.1% |
| Belgian | 48 | 0.2% |
| Bhutanese | 774 | 2.5% |
| Brazilian | 41 | 0.1% |
| British | 199 | 0.6% |
| Burmese | 1,230 | 4.0% |
| Canadian | 240 | 0.8% |
| Central American | 140 | 0.4% |
| Cherokee | 25 | 0.1% |
| Chilean | 18 | 0.1% |
| Choctaw | 7 | 0.0% |
| Colombian | 108 | 0.4% |
| Croatian | 213 | 0.7% |
| Czech | 60 | 0.2% |
| Danish | 269 | 0.9% |
| Dutch | 317 | 1.0% |
| Eastern European | 171 | 0.5% |
| Ecuadorian | 42 | 0.1% |
| Egyptian | 27 | 0.1% |
| English | 3,210 | 10.3% |
| European | 1,375 | 4.4% |
| Filipino | 453 | 1.5% |
| Finnish | 59 | 0.2% |
| French | 890 | 2.9% |
| French Canadian | 15 | 0.1% |
| German | 2,850 | 9.1% |
| Greek | 97 | 0.3% |
| Honduran | 36 | 0.1% |
| Hungarian | 59 | 0.2% |
| Icelander | 14 | 0.0% |
| Indian (Asian) | 5,517 | 17.7% |
| Indonesian | 17 | 0.1% |
| Iranian | 354 | 1.1% |
| Irish | 2,140 | 6.9% |
| Israeli | 51 | 0.2% |
| Italian | 1,357 | 4.4% |
| Jamaican | 12 | 0.0% |
| Japanese | 9 | 0.0% |
| Korean | 574 | 1.8% |
| Laotian | 51 | 0.2% |
| Latvian | 37 | 0.1% |
| Lebanese | 37 | 0.1% |
| Lithuanian | 70 | 0.2% |
| Maltese | 55 | 0.2% |
| Mexican | 566 | 1.8% |
| Mongolian | 26 | 0.1% |
| Native Hawaiian | 19 | 0.1% |
| New Zealander | 19 | 0.1% |
| Nicaraguan | 20 | 0.1% |
| Nigerian | 4 | 0.0% |
| Northern European | 206 | 0.7% |
| Norwegian | 276 | 0.9% |
| Okinawan | 53 | 0.2% |
| Pakistani | 70 | 0.2% |
| Palestinian | 122 | 0.4% |
| Pennsylvania German | 9 | 0.0% |
| Peruvian | 95 | 0.3% |
| Polish | 671 | 2.2% |
| Portuguese | 100 | 0.3% |
| Pueblo | 3 | 0.0% |
| Puerto Rican | 69 | 0.2% |
| Romanian | 128 | 0.4% |
| Russian | 919 | 2.9% |
| Salvadoran | 82 | 0.3% |
| Scandinavian | 132 | 0.4% |
| Scotch-Irish | 171 | 0.5% |
| Scottish | 476 | 1.5% |
| Serbian | 47 | 0.2% |
| Slavic | 12 | 0.0% |
| Slovak | 37 | 0.1% |
| Slovene | 31 | 0.1% |
| South American | 494 | 1.6% |
| Spaniard | 88 | 0.3% |
| Spanish | 41 | 0.1% |
| Sri Lankan | 219 | 0.7% |
| Subsaharan African | 4 | 0.0% |
| Swedish | 485 | 1.6% |
| Swiss | 389 | 1.3% |
| Thai | 3,716 | 11.9% |
| Turkish | 141 | 0.4% |
| Ukrainian | 218 | 0.7% |
| Venezuelan | 41 | 0.1% |
| Welsh | 167 | 0.5% |
| Yugoslavian | 13 | 0.0% | View All 92 Rows |
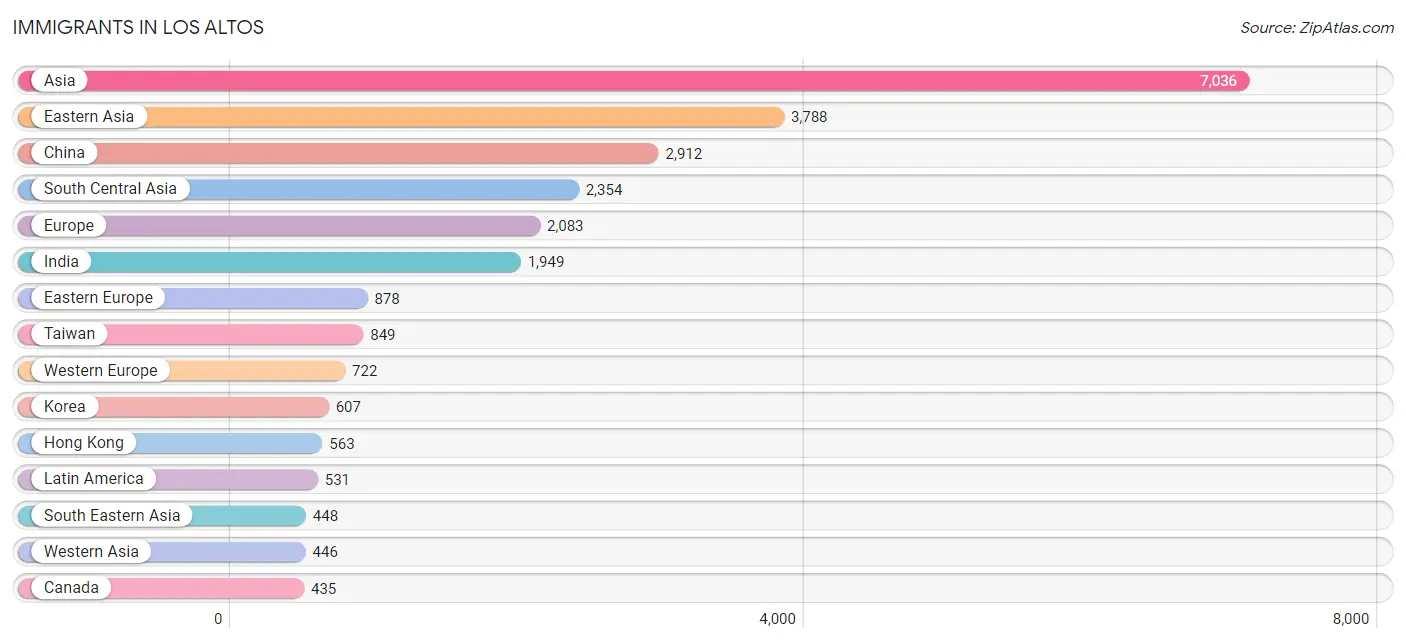
Immigrants in Los Altos
The most numerous immigrant groups reported in Los Altos came from Asia (7,036 | 22.6%), Eastern Asia (3,788 | 12.2%), China (2,912 | 9.3%), South Central Asia (2,354 | 7.6%), and Europe (2,083 | 6.7%), together accounting for 58.4% of all Los Altos residents.
| Immigration Origin | # Population | % Population |
| Africa | 202 | 0.6% |
| Argentina | 156 | 0.5% |
| Armenia | 64 | 0.2% |
| Asia | 7,036 | 22.6% |
| Australia | 121 | 0.4% |
| Austria | 24 | 0.1% |
| Bangladesh | 24 | 0.1% |
| Belarus | 14 | 0.0% |
| Belgium | 52 | 0.2% |
| Bosnia and Herzegovina | 8 | 0.0% |
| Brazil | 62 | 0.2% |
| Canada | 435 | 1.4% |
| Central America | 159 | 0.5% |
| China | 2,912 | 9.3% |
| Colombia | 49 | 0.2% |
| Croatia | 10 | 0.0% |
| Denmark | 16 | 0.1% |
| Eastern Africa | 20 | 0.1% |
| Eastern Asia | 3,788 | 12.2% |
| Eastern Europe | 878 | 2.8% |
| Ecuador | 30 | 0.1% |
| Egypt | 18 | 0.1% |
| El Salvador | 11 | 0.0% |
| England | 100 | 0.3% |
| Europe | 2,083 | 6.7% |
| France | 338 | 1.1% |
| Germany | 225 | 0.7% |
| Guatemala | 2 | 0.0% |
| Hong Kong | 563 | 1.8% |
| Hungary | 3 | 0.0% |
| India | 1,949 | 6.3% |
| Indonesia | 34 | 0.1% |
| Iran | 288 | 0.9% |
| Ireland | 35 | 0.1% |
| Israel | 205 | 0.7% |
| Italy | 22 | 0.1% |
| Japan | 269 | 0.9% |
| Jordan | 30 | 0.1% |
| Kenya | 12 | 0.0% |
| Korea | 607 | 1.9% |
| Kuwait | 10 | 0.0% |
| Laos | 8 | 0.0% |
| Latin America | 531 | 1.7% |
| Latvia | 58 | 0.2% |
| Lebanon | 8 | 0.0% |
| Malaysia | 64 | 0.2% |
| Mexico | 146 | 0.5% |
| Morocco | 2 | 0.0% |
| Nepal | 43 | 0.1% |
| Netherlands | 40 | 0.1% |
| Northern Africa | 76 | 0.2% |
| Northern Europe | 434 | 1.4% |
| Norway | 19 | 0.1% |
| Oceania | 139 | 0.4% |
| Pakistan | 34 | 0.1% |
| Peru | 66 | 0.2% |
| Philippines | 128 | 0.4% |
| Poland | 121 | 0.4% |
| Romania | 17 | 0.1% |
| Russia | 396 | 1.3% |
| Serbia | 17 | 0.1% |
| Singapore | 63 | 0.2% |
| South Africa | 83 | 0.3% |
| South America | 372 | 1.2% |
| South Central Asia | 2,354 | 7.6% |
| South Eastern Asia | 448 | 1.4% |
| Southern Europe | 45 | 0.1% |
| Spain | 23 | 0.1% |
| Sri Lanka | 16 | 0.1% |
| Sweden | 29 | 0.1% |
| Switzerland | 43 | 0.1% |
| Taiwan | 849 | 2.7% |
| Thailand | 75 | 0.2% |
| Turkey | 59 | 0.2% |
| Ukraine | 97 | 0.3% |
| Venezuela | 9 | 0.0% |
| Vietnam | 59 | 0.2% |
| Western Asia | 446 | 1.4% |
| Western Europe | 722 | 2.3% | View All 79 Rows |
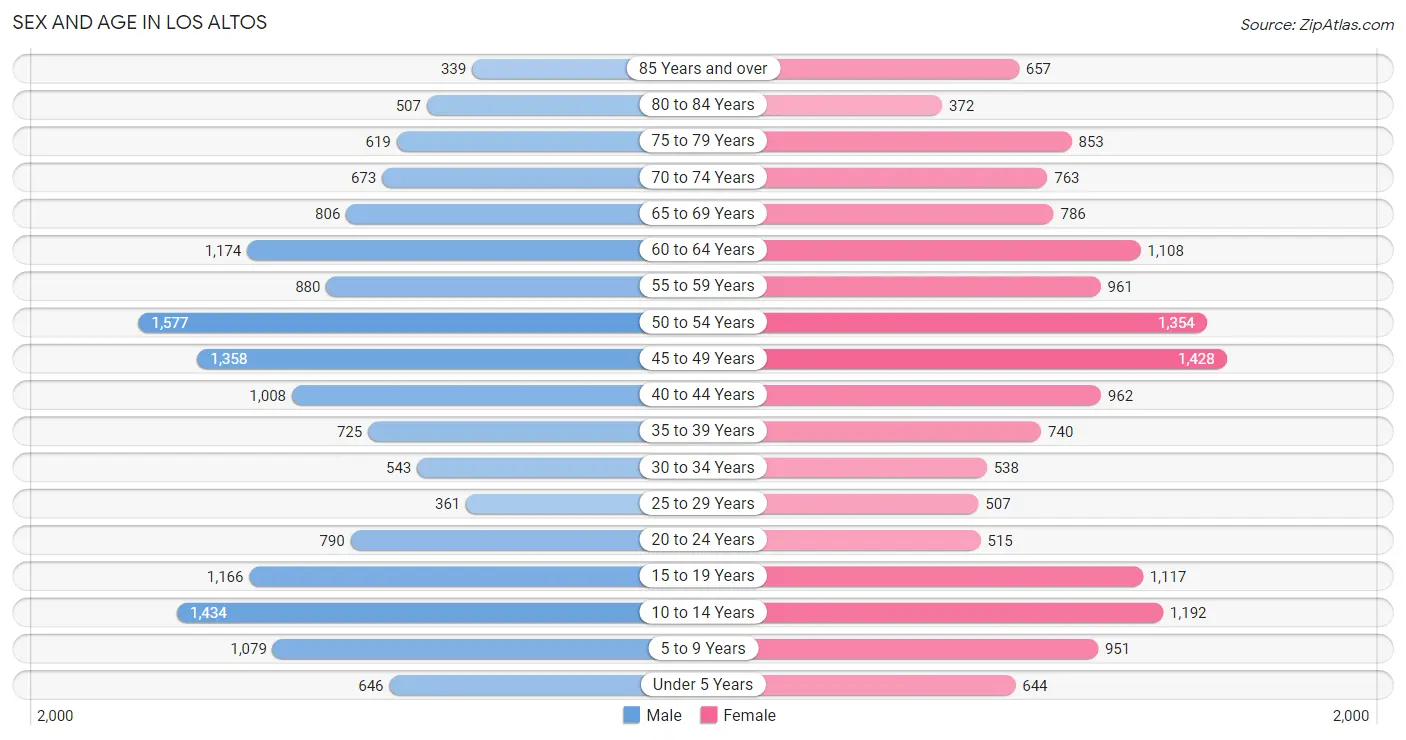
Sex and Age in Los Altos
Sex and Age in Los Altos
The most populous age groups in Los Altos are 50 to 54 Years (1,577 | 10.1%) for men and 45 to 49 Years (1,428 | 9.2%) for women.
| Age Bracket | Male | Female |
| Under 5 Years | 646 (4.1%) | 644 (4.2%) |
| 5 to 9 Years | 1,079 (6.9%) | 951 (6.2%) |
| 10 to 14 Years | 1,434 (9.1%) | 1,192 (7.7%) |
| 15 to 19 Years | 1,166 (7.4%) | 1,117 (7.2%) |
| 20 to 24 Years | 790 (5.0%) | 515 (3.3%) |
| 25 to 29 Years | 361 (2.3%) | 507 (3.3%) |
| 30 to 34 Years | 543 (3.5%) | 538 (3.5%) |
| 35 to 39 Years | 725 (4.6%) | 740 (4.8%) |
| 40 to 44 Years | 1,008 (6.4%) | 962 (6.2%) |
| 45 to 49 Years | 1,358 (8.7%) | 1,428 (9.2%) |
| 50 to 54 Years | 1,577 (10.1%) | 1,354 (8.8%) |
| 55 to 59 Years | 880 (5.6%) | 961 (6.2%) |
| 60 to 64 Years | 1,174 (7.5%) | 1,108 (7.2%) |
| 65 to 69 Years | 806 (5.1%) | 786 (5.1%) |
| 70 to 74 Years | 673 (4.3%) | 763 (4.9%) |
| 75 to 79 Years | 619 (4.0%) | 853 (5.5%) |
| 80 to 84 Years | 507 (3.2%) | 372 (2.4%) |
| 85 Years and over | 339 (2.2%) | 657 (4.3%) |
| Total | 15,685 (100.0%) | 15,448 (100.0%) |
Families and Households in Los Altos
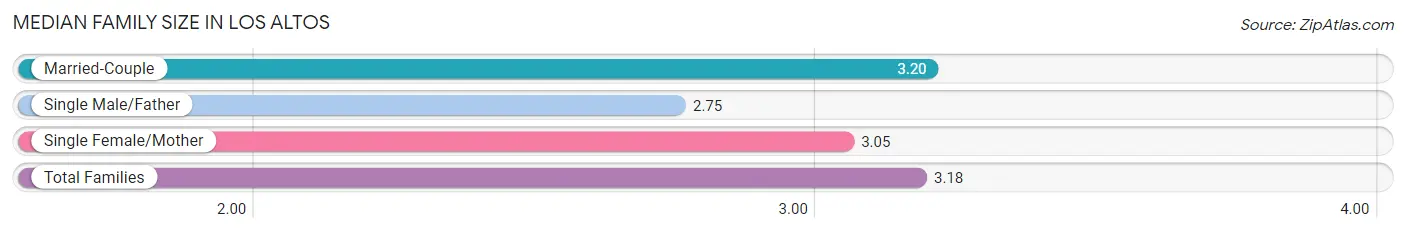
Median Family Size in Los Altos
The median family size in Los Altos is 3.18 persons per family, with married-couple families (8,111 | 91.9%) accounting for the largest median family size of 3.2 persons per family. On the other hand, single male/father families (177 | 2.0%) represent the smallest median family size with 2.75 persons per family.
| Family Type | # Families | Family Size |
| Married-Couple | 8,111 (91.9%) | 3.20 |
| Single Male/Father | 177 (2.0%) | 2.75 |
| Single Female/Mother | 536 (6.1%) | 3.05 |
| Total Families | 8,824 (100.0%) | 3.18 |
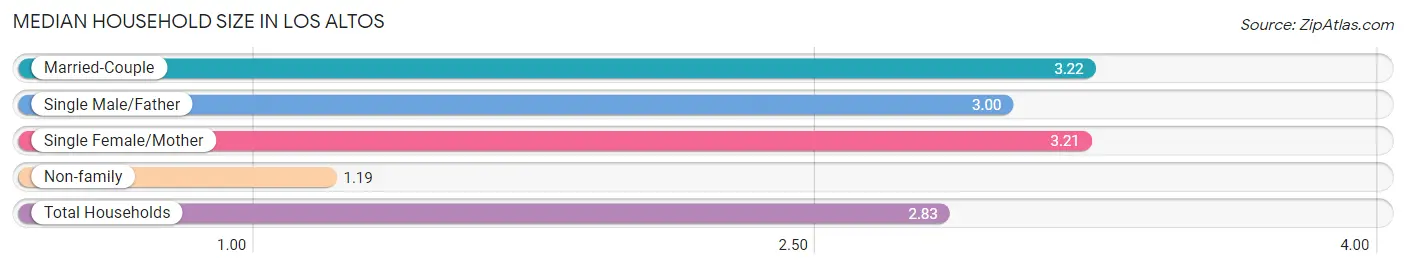
Median Household Size in Los Altos
The median household size in Los Altos is 2.83 persons per household, with married-couple households (8,111 | 74.5%) accounting for the largest median household size of 3.22 persons per household. non-family households (2,063 | 19.0%) represent the smallest median household size with 1.19 persons per household.
| Household Type | # Households | Household Size |
| Married-Couple | 8,111 (74.5%) | 3.22 |
| Single Male/Father | 177 (1.6%) | 3.00 |
| Single Female/Mother | 536 (4.9%) | 3.21 |
| Non-family | 2,063 (19.0%) | 1.19 |
| Total Households | 10,887 (100.0%) | 2.83 |
Household Size by Marriage Status in Los Altos
Out of a total of 10,887 households in Los Altos, 8,824 (81.0%) are family households, while 2,063 (19.0%) are nonfamily households. The most numerous type of family households are 2-person households, comprising 3,513, and the most common type of nonfamily households are 1-person households, comprising 1,811.
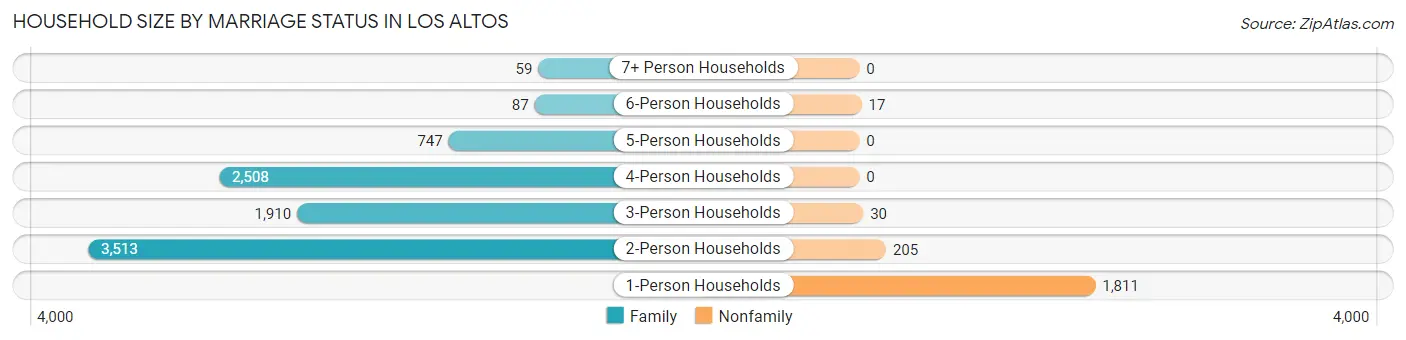
| Household Size | Family Households | Nonfamily Households |
| 1-Person Households | - | 1,811 (16.6%) |
| 2-Person Households | 3,513 (32.3%) | 205 (1.9%) |
| 3-Person Households | 1,910 (17.5%) | 30 (0.3%) |
| 4-Person Households | 2,508 (23.0%) | 0 (0.0%) |
| 5-Person Households | 747 (6.9%) | 0 (0.0%) |
| 6-Person Households | 87 (0.8%) | 17 (0.2%) |
| 7+ Person Households | 59 (0.5%) | 0 (0.0%) |
| Total | 8,824 (81.0%) | 2,063 (19.0%) |
Female Fertility in Los Altos
Fertility by Age in Los Altos
Average fertility rate in Los Altos is 22.0 births per 1,000 women. Women in the age bracket of 35 to 50 years have the highest fertility rate with 29.0 births per 1,000 women. Women in the age bracket of 35 to 50 years acount for 75.9% of all women with births.
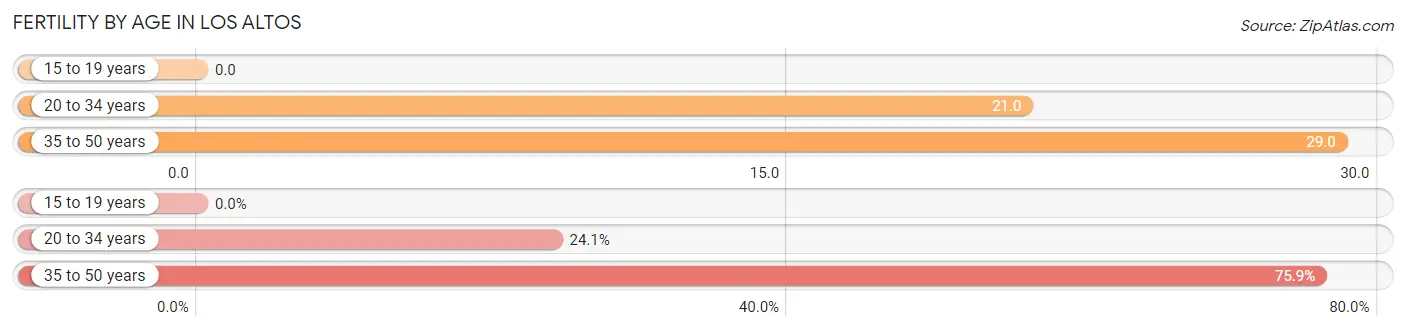
| Age Bracket | Women with Births | Births / 1,000 Women |
| 15 to 19 years | 0 (0.0%) | 0.0 |
| 20 to 34 years | 32 (24.1%) | 21.0 |
| 35 to 50 years | 101 (75.9%) | 29.0 |
| Total | 133 (100.0%) | 22.0 |
Fertility by Age by Marriage Status in Los Altos
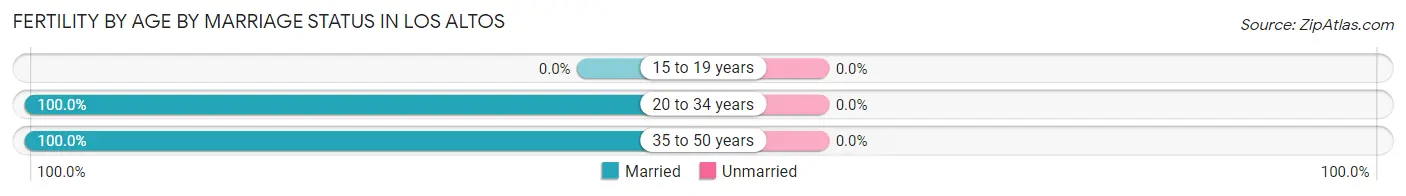
| Age Bracket | Married | Unmarried |
| 15 to 19 years | 0 (0.0%) | 0 (0.0%) |
| 20 to 34 years | 32 (100.0%) | 0 (0.0%) |
| 35 to 50 years | 101 (100.0%) | 0 (0.0%) |
| Total | 133 (100.0%) | 0 (0.0%) |
Fertility by Education in Los Altos
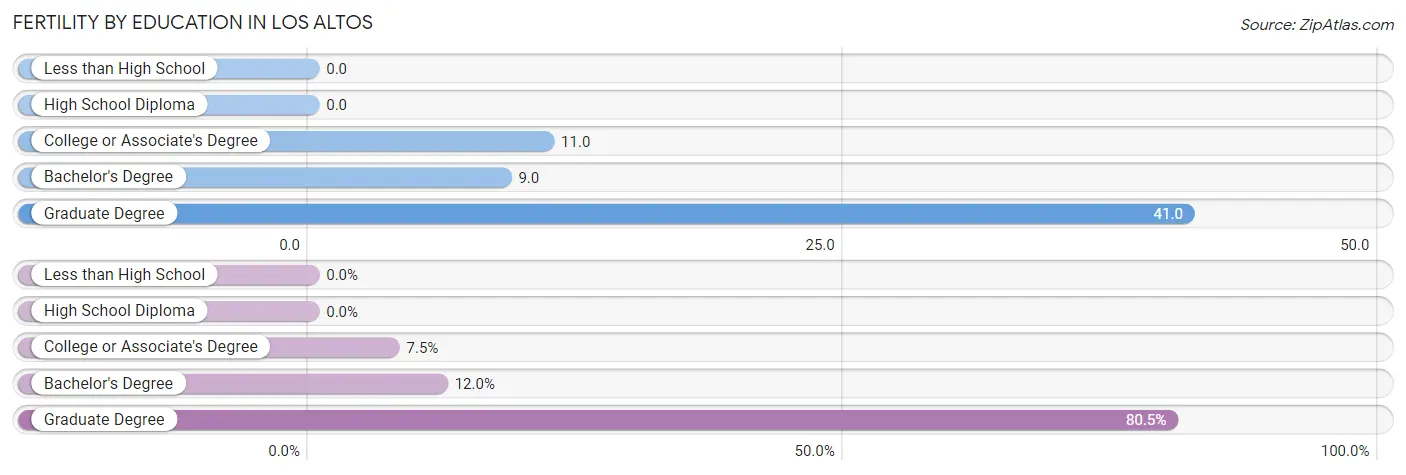
| Educational Attainment | Women with Births | Births / 1,000 Women |
| Less than High School | 0 (0.0%) | 0.0 |
| High School Diploma | 0 (0.0%) | 0.0 |
| College or Associate's Degree | 10 (7.5%) | 11.0 |
| Bachelor's Degree | 16 (12.0%) | 9.0 |
| Graduate Degree | 107 (80.4%) | 41.0 |
| Total | 133 (100.0%) | 22.0 |
Fertility by Education by Marriage Status in Los Altos
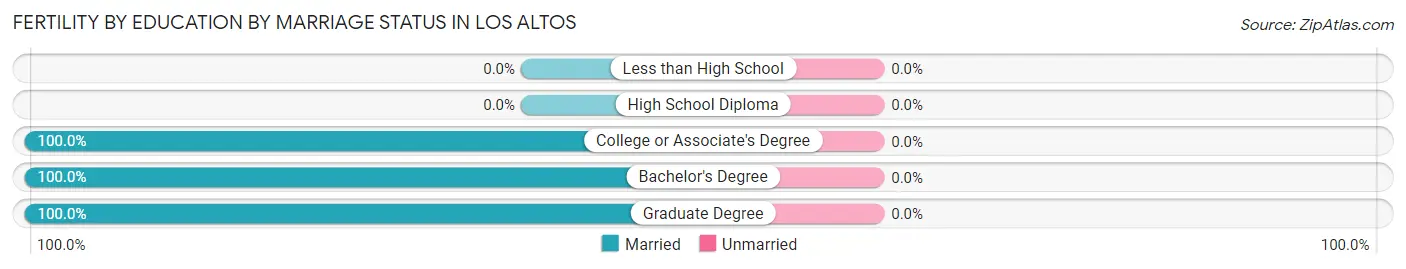
| Educational Attainment | Married | Unmarried |
| Less than High School | 0 (0.0%) | 0 (0.0%) |
| High School Diploma | 0 (0.0%) | 0 (0.0%) |
| College or Associate's Degree | 10 (100.0%) | 0 (0.0%) |
| Bachelor's Degree | 16 (100.0%) | 0 (0.0%) |
| Graduate Degree | 107 (100.0%) | 0 (0.0%) |
| Total | 133 (100.0%) | 0 (0.0%) |
Employment Characteristics in Los Altos
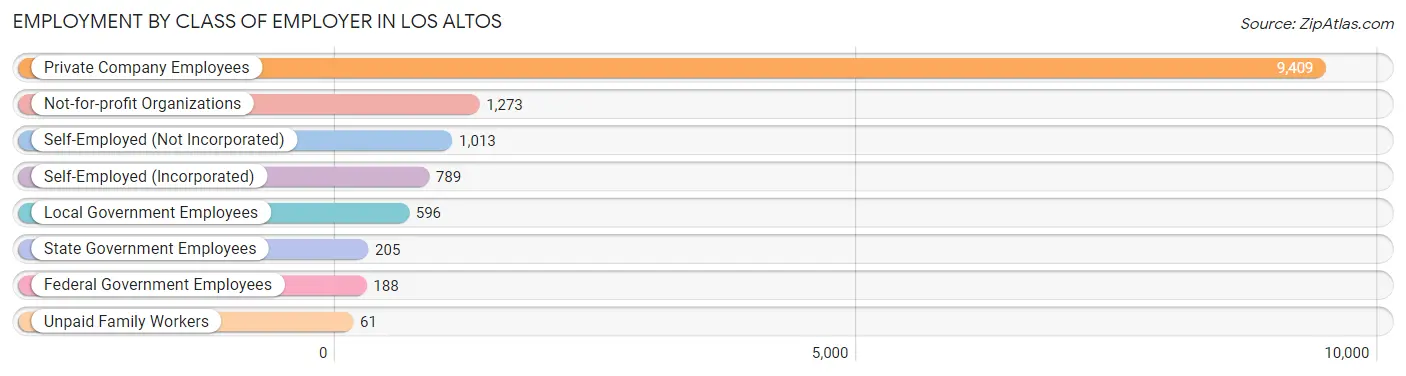
Employment by Class of Employer in Los Altos
Among the 13,534 employed individuals in Los Altos, private company employees (9,409 | 69.5%), not-for-profit organizations (1,273 | 9.4%), and self-employed (not incorporated) (1,013 | 7.5%) make up the most common classes of employment.
| Employer Class | # Employees | % Employees |
| Private Company Employees | 9,409 | 69.5% |
| Self-Employed (Incorporated) | 789 | 5.8% |
| Self-Employed (Not Incorporated) | 1,013 | 7.5% |
| Not-for-profit Organizations | 1,273 | 9.4% |
| Local Government Employees | 596 | 4.4% |
| State Government Employees | 205 | 1.5% |
| Federal Government Employees | 188 | 1.4% |
| Unpaid Family Workers | 61 | 0.4% |
| Total | 13,534 | 100.0% |
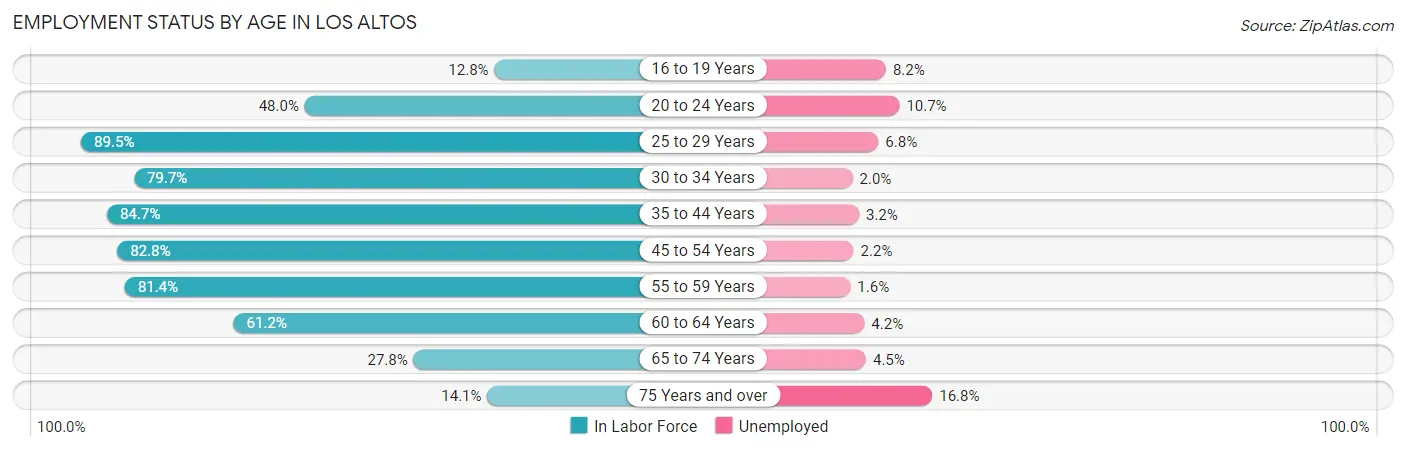
Employment Status by Age in Los Altos
According to the labor force statistics for Los Altos, out of the total population over 16 years of age (24,718), 58.1% or 14,361 individuals are in the labor force, with 3.9% or 560 of them unemployed. The age group with the highest labor force participation rate is 25 to 29 years, with 89.5% or 777 individuals in the labor force. Within the labor force, the 75 years and over age range has the highest percentage of unemployed individuals, with 16.8% or 79 of them being unemployed.
| Age Bracket | In Labor Force | Unemployed |
| 16 to 19 Years | 232 (12.8%) | 19 (8.2%) |
| 20 to 24 Years | 626 (48.0%) | 67 (10.7%) |
| 25 to 29 Years | 777 (89.5%) | 53 (6.8%) |
| 30 to 34 Years | 862 (79.7%) | 17 (2.0%) |
| 35 to 44 Years | 2,909 (84.7%) | 93 (3.2%) |
| 45 to 54 Years | 4,734 (82.8%) | 104 (2.2%) |
| 55 to 59 Years | 1,499 (81.4%) | 24 (1.6%) |
| 60 to 64 Years | 1,397 (61.2%) | 59 (4.2%) |
| 65 to 74 Years | 842 (27.8%) | 38 (4.5%) |
| 75 Years and over | 472 (14.1%) | 79 (16.8%) |
| Total | 14,361 (58.1%) | 560 (3.9%) |
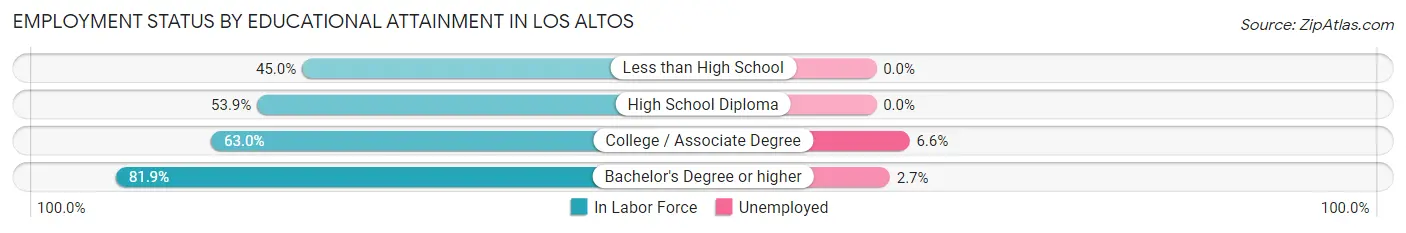
Employment Status by Educational Attainment in Los Altos
According to labor force statistics for Los Altos, 80.0% of individuals (12,179) out of the total population between 25 and 64 years of age (15,224) are in the labor force, with 2.9% or 353 of them being unemployed. The group with the highest labor force participation rate are those with the educational attainment of bachelor's degree or higher, with 81.9% or 11,344 individuals in the labor force. Within the labor force, individuals with college / associate degree education have the highest percentage of unemployment, with 6.6% or 45 of them being unemployed.
| Educational Attainment | In Labor Force | Unemployed |
| Less than High School | 9 (45.0%) | 0 (0.0%) |
| High School Diploma | 145 (53.9%) | 0 (0.0%) |
| College / Associate Degree | 683 (63.0%) | 72 (6.6%) |
| Bachelor's Degree or higher | 11,344 (81.9%) | 374 (2.7%) |
| Total | 12,179 (80.0%) | 441 (2.9%) |
Employment Occupations by Sex in Los Altos
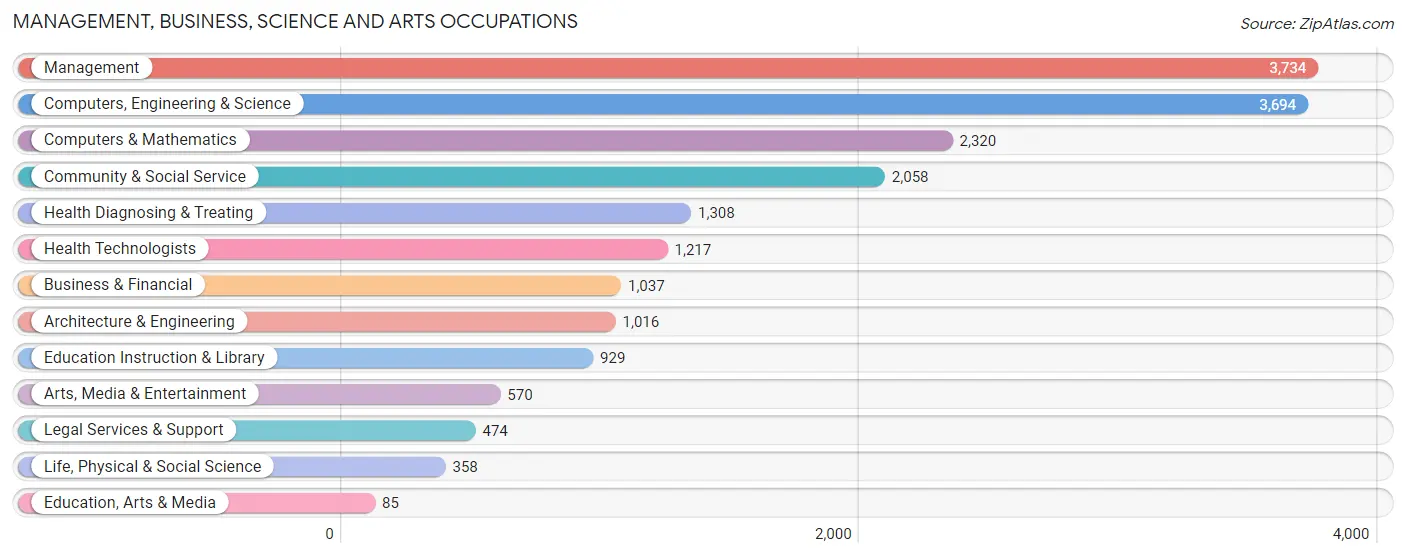
Management, Business, Science and Arts Occupations
The most common Management, Business, Science and Arts occupations in Los Altos are Management (3,734 | 27.1%), Computers, Engineering & Science (3,694 | 26.8%), Computers & Mathematics (2,320 | 16.8%), Community & Social Service (2,058 | 14.9%), and Health Diagnosing & Treating (1,308 | 9.5%).
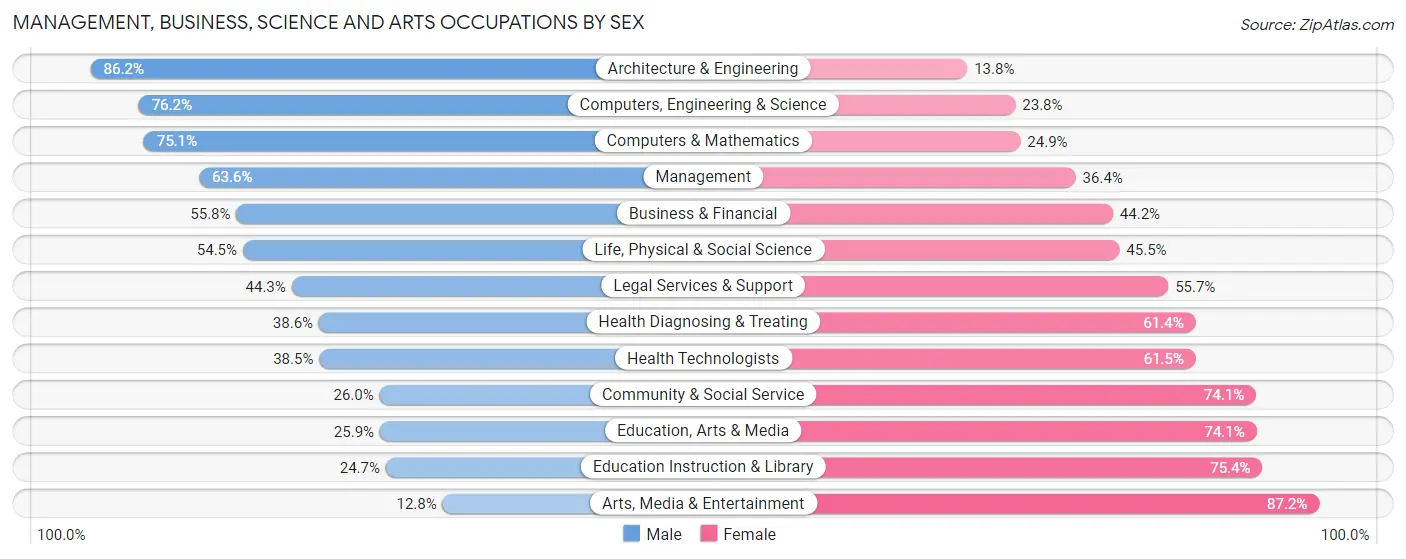
Management, Business, Science and Arts Occupations by Sex
Within the Management, Business, Science and Arts occupations in Los Altos, the most male-oriented occupations are Architecture & Engineering (86.2%), Computers, Engineering & Science (76.2%), and Computers & Mathematics (75.1%), while the most female-oriented occupations are Arts, Media & Entertainment (87.2%), Education Instruction & Library (75.3%), and Education, Arts & Media (74.1%).
| Occupation | Male | Female |
| Management | 2,375 (63.6%) | 1,359 (36.4%) |
| Business & Financial | 579 (55.8%) | 458 (44.2%) |
| Computers, Engineering & Science | 2,814 (76.2%) | 880 (23.8%) |
| Computers & Mathematics | 1,743 (75.1%) | 577 (24.9%) |
| Architecture & Engineering | 876 (86.2%) | 140 (13.8%) |
| Life, Physical & Social Science | 195 (54.5%) | 163 (45.5%) |
| Community & Social Service | 534 (26.0%) | 1,524 (74.1%) |
| Education, Arts & Media | 22 (25.9%) | 63 (74.1%) |
| Legal Services & Support | 210 (44.3%) | 264 (55.7%) |
| Education Instruction & Library | 229 (24.6%) | 700 (75.3%) |
| Arts, Media & Entertainment | 73 (12.8%) | 497 (87.2%) |
| Health Diagnosing & Treating | 505 (38.6%) | 803 (61.4%) |
| Health Technologists | 469 (38.5%) | 748 (61.5%) |
| Total (Category) | 6,807 (57.5%) | 5,024 (42.5%) |
| Total (Overall) | 7,710 (55.9%) | 6,079 (44.1%) |
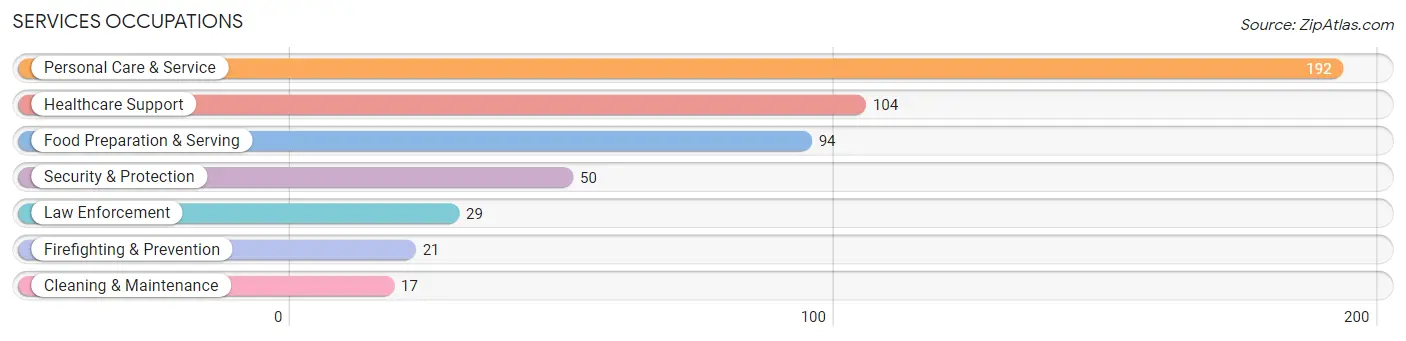
Services Occupations
The most common Services occupations in Los Altos are Personal Care & Service (192 | 1.4%), Healthcare Support (104 | 0.7%), Food Preparation & Serving (94 | 0.7%), Security & Protection (50 | 0.4%), and Law Enforcement (29 | 0.2%).
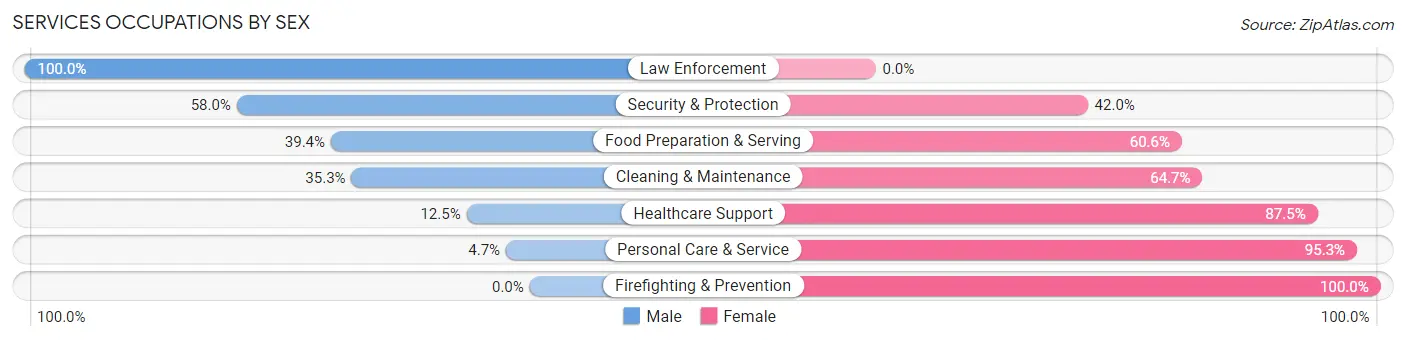
Services Occupations by Sex
Within the Services occupations in Los Altos, the most male-oriented occupations are Law Enforcement (100.0%), Security & Protection (58.0%), and Food Preparation & Serving (39.4%), while the most female-oriented occupations are Firefighting & Prevention (100.0%), Personal Care & Service (95.3%), and Healthcare Support (87.5%).
| Occupation | Male | Female |
| Healthcare Support | 13 (12.5%) | 91 (87.5%) |
| Security & Protection | 29 (58.0%) | 21 (42.0%) |
| Firefighting & Prevention | 0 (0.0%) | 21 (100.0%) |
| Law Enforcement | 29 (100.0%) | 0 (0.0%) |
| Food Preparation & Serving | 37 (39.4%) | 57 (60.6%) |
| Cleaning & Maintenance | 6 (35.3%) | 11 (64.7%) |
| Personal Care & Service | 9 (4.7%) | 183 (95.3%) |
| Total (Category) | 94 (20.6%) | 363 (79.4%) |
| Total (Overall) | 7,710 (55.9%) | 6,079 (44.1%) |
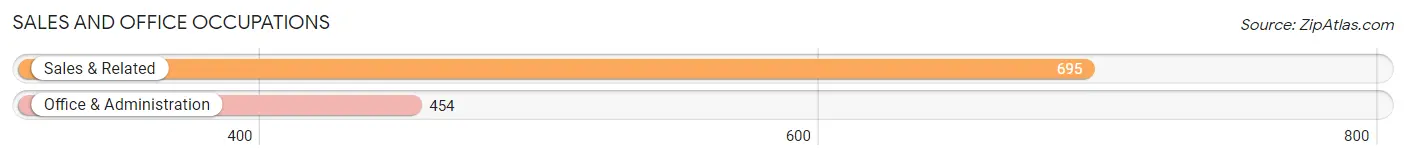
Sales and Office Occupations
The most common Sales and Office occupations in Los Altos are Sales & Related (695 | 5.0%), and Office & Administration (454 | 3.3%).
Sales and Office Occupations by Sex
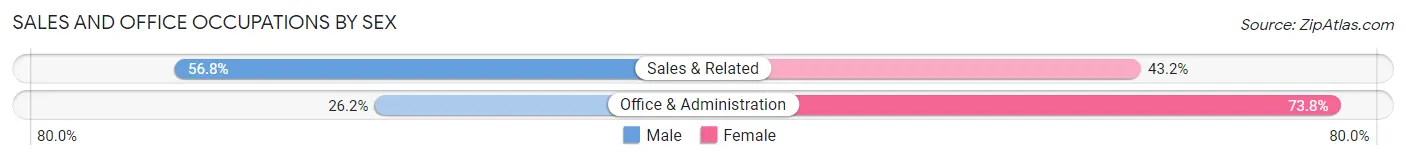
| Occupation | Male | Female |
| Sales & Related | 395 (56.8%) | 300 (43.2%) |
| Office & Administration | 119 (26.2%) | 335 (73.8%) |
| Total (Category) | 514 (44.7%) | 635 (55.3%) |
| Total (Overall) | 7,710 (55.9%) | 6,079 (44.1%) |
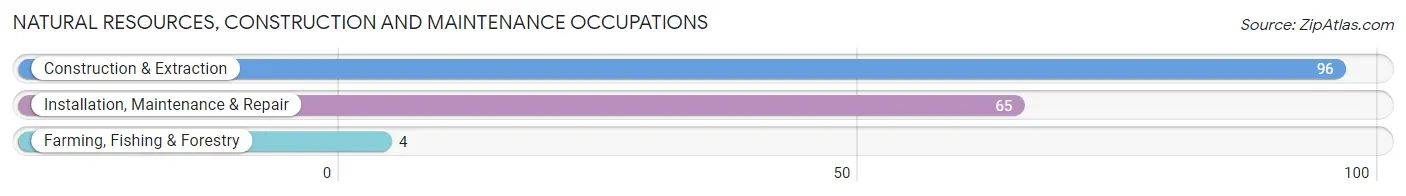
Natural Resources, Construction and Maintenance Occupations
The most common Natural Resources, Construction and Maintenance occupations in Los Altos are Construction & Extraction (96 | 0.7%), Installation, Maintenance & Repair (65 | 0.5%), and Farming, Fishing & Forestry (4 | 0.0%).
Natural Resources, Construction and Maintenance Occupations by Sex
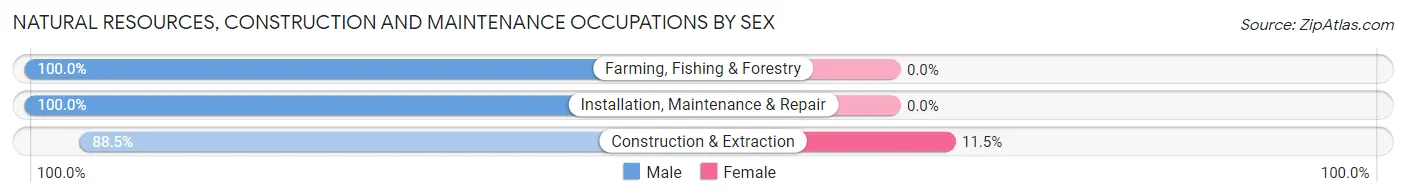
| Occupation | Male | Female |
| Farming, Fishing & Forestry | 4 (100.0%) | 0 (0.0%) |
| Construction & Extraction | 85 (88.5%) | 11 (11.5%) |
| Installation, Maintenance & Repair | 65 (100.0%) | 0 (0.0%) |
| Total (Category) | 154 (93.3%) | 11 (6.7%) |
| Total (Overall) | 7,710 (55.9%) | 6,079 (44.1%) |
Production, Transportation and Moving Occupations
The most common Production, Transportation and Moving occupations in Los Altos are Material Moving (96 | 0.7%), Production (54 | 0.4%), and Transportation (37 | 0.3%).
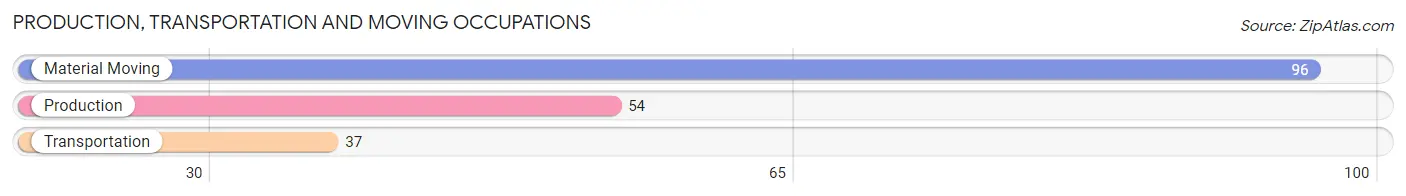
Production, Transportation and Moving Occupations by Sex
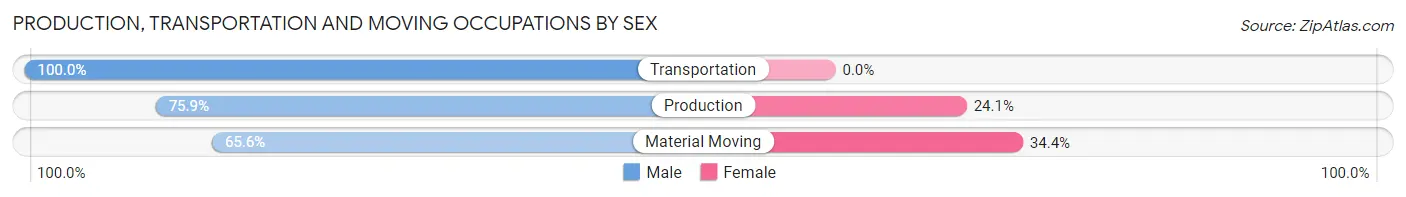
| Occupation | Male | Female |
| Production | 41 (75.9%) | 13 (24.1%) |
| Transportation | 37 (100.0%) | 0 (0.0%) |
| Material Moving | 63 (65.6%) | 33 (34.4%) |
| Total (Category) | 141 (75.4%) | 46 (24.6%) |
| Total (Overall) | 7,710 (55.9%) | 6,079 (44.1%) |
Employment Industries by Sex in Los Altos
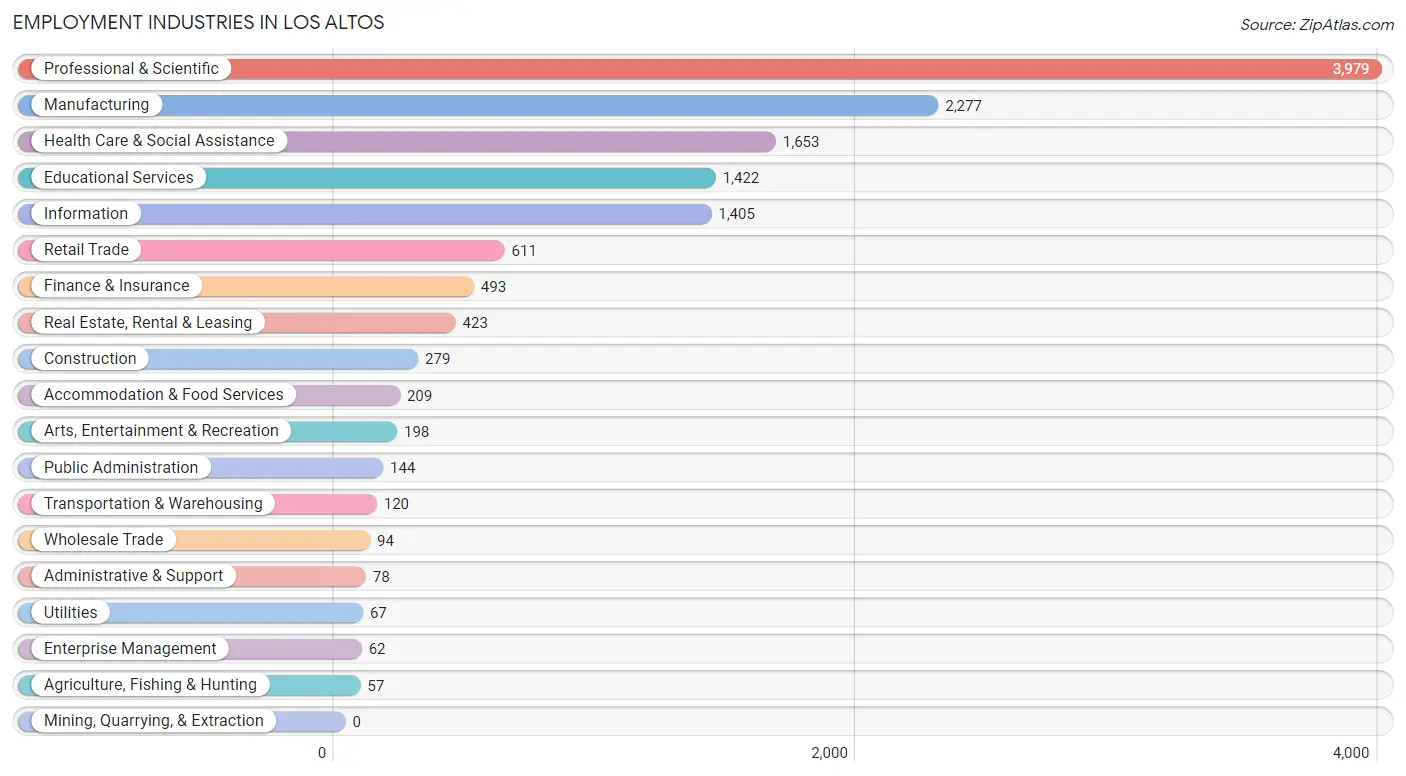
Employment Industries in Los Altos
The major employment industries in Los Altos include Professional & Scientific (3,979 | 28.9%), Manufacturing (2,277 | 16.5%), Health Care & Social Assistance (1,653 | 12.0%), Educational Services (1,422 | 10.3%), and Information (1,405 | 10.2%).
Employment Industries by Sex in Los Altos
The Los Altos industries that see more men than women are Construction (79.9%), Wholesale Trade (79.8%), and Transportation & Warehousing (72.5%), whereas the industries that tend to have a higher number of women are Utilities (74.6%), Arts, Entertainment & Recreation (71.7%), and Educational Services (67.2%).
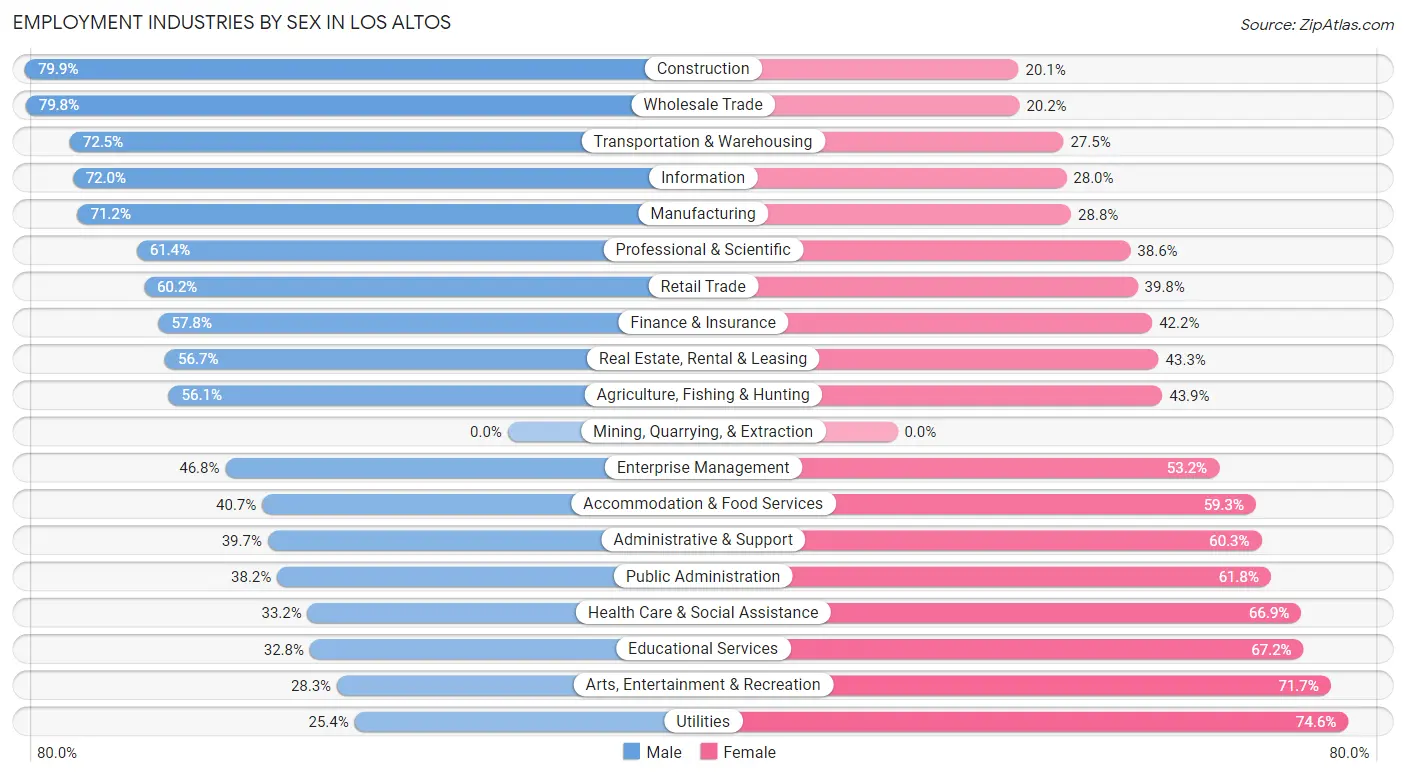
| Industry | Male | Female |
| Agriculture, Fishing & Hunting | 32 (56.1%) | 25 (43.9%) |
| Mining, Quarrying, & Extraction | 0 (0.0%) | 0 (0.0%) |
| Construction | 223 (79.9%) | 56 (20.1%) |
| Manufacturing | 1,622 (71.2%) | 655 (28.8%) |
| Wholesale Trade | 75 (79.8%) | 19 (20.2%) |
| Retail Trade | 368 (60.2%) | 243 (39.8%) |
| Transportation & Warehousing | 87 (72.5%) | 33 (27.5%) |
| Utilities | 17 (25.4%) | 50 (74.6%) |
| Information | 1,012 (72.0%) | 393 (28.0%) |
| Finance & Insurance | 285 (57.8%) | 208 (42.2%) |
| Real Estate, Rental & Leasing | 240 (56.7%) | 183 (43.3%) |
| Professional & Scientific | 2,444 (61.4%) | 1,535 (38.6%) |
| Enterprise Management | 29 (46.8%) | 33 (53.2%) |
| Administrative & Support | 31 (39.7%) | 47 (60.3%) |
| Educational Services | 466 (32.8%) | 956 (67.2%) |
| Health Care & Social Assistance | 548 (33.2%) | 1,105 (66.8%) |
| Arts, Entertainment & Recreation | 56 (28.3%) | 142 (71.7%) |
| Accommodation & Food Services | 85 (40.7%) | 124 (59.3%) |
| Public Administration | 55 (38.2%) | 89 (61.8%) |
| Total | 7,710 (55.9%) | 6,079 (44.1%) |
Education in Los Altos
School Enrollment in Los Altos
The most common levels of schooling among the 8,908 students in Los Altos are middle school (2,180 | 24.5%), high school (2,065 | 23.2%), and college / undergraduate (1,617 | 18.1%).
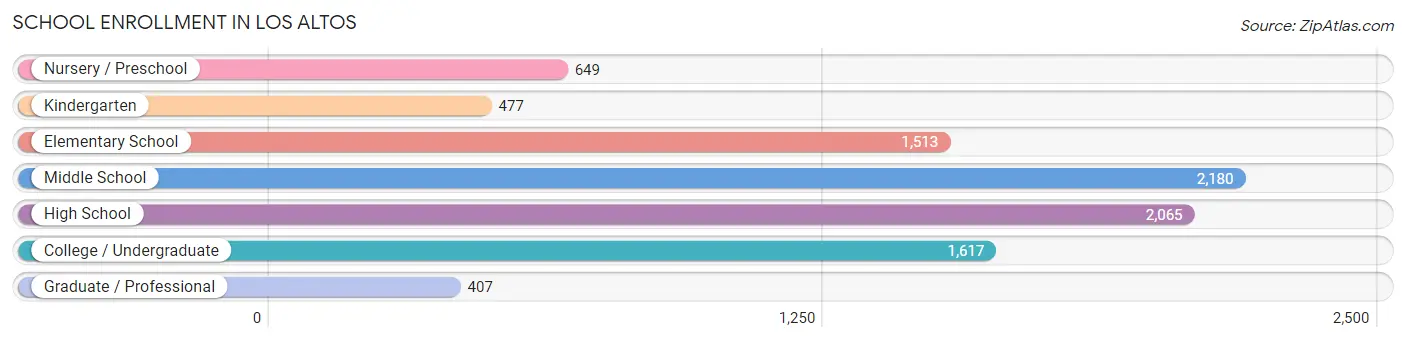
| School Level | # Students | % Students |
| Nursery / Preschool | 649 | 7.3% |
| Kindergarten | 477 | 5.3% |
| Elementary School | 1,513 | 17.0% |
| Middle School | 2,180 | 24.5% |
| High School | 2,065 | 23.2% |
| College / Undergraduate | 1,617 | 18.1% |
| Graduate / Professional | 407 | 4.6% |
| Total | 8,908 | 100.0% |
School Enrollment by Age by Funding Source in Los Altos
Out of a total of 8,908 students who are enrolled in schools in Los Altos, 2,423 (27.2%) attend a private institution, while the remaining 6,485 (72.8%) are enrolled in public schools. The age group of 3 to 4 year olds has the highest likelihood of being enrolled in private schools, with 410 (87.4% in the age bracket) enrolled. Conversely, the age group of 25 to 34 year olds has the lowest likelihood of being enrolled in a private school, with 158 (85.4% in the age bracket) attending a public institution.
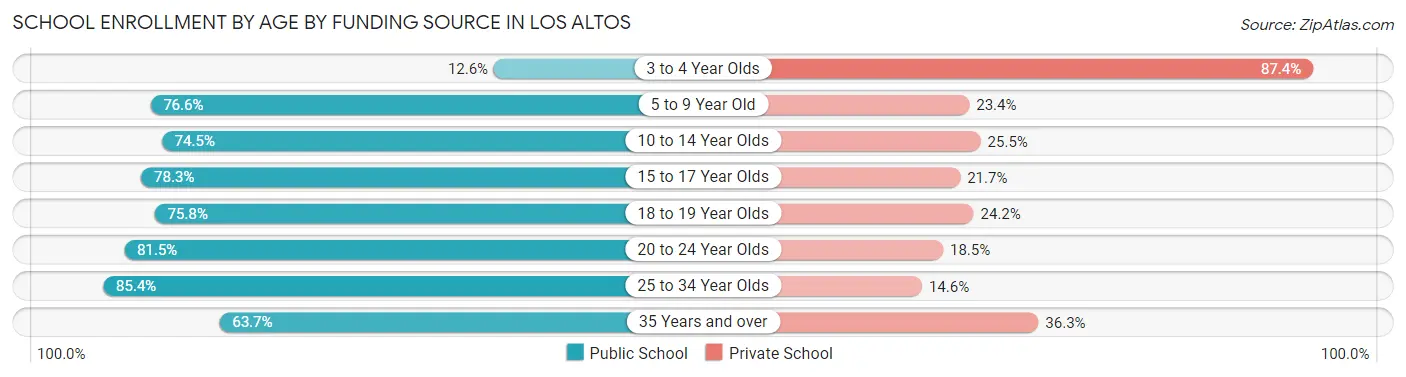
| Age Bracket | Public School | Private School |
| 3 to 4 Year Olds | 59 (12.6%) | 410 (87.4%) |
| 5 to 9 Year Old | 1,555 (76.6%) | 475 (23.4%) |
| 10 to 14 Year Olds | 1,950 (74.5%) | 668 (25.5%) |
| 15 to 17 Year Olds | 1,280 (78.3%) | 355 (21.7%) |
| 18 to 19 Year Olds | 448 (75.8%) | 143 (24.2%) |
| 20 to 24 Year Olds | 709 (81.5%) | 161 (18.5%) |
| 25 to 34 Year Olds | 158 (85.4%) | 27 (14.6%) |
| 35 Years and over | 325 (63.7%) | 185 (36.3%) |
| Total | 6,485 (72.8%) | 2,423 (27.2%) |
Educational Attainment by Field of Study in Los Altos
Engineering (4,975 | 24.7%), computers & mathematics (2,584 | 12.8%), business (2,406 | 11.9%), social sciences (1,965 | 9.8%), and bio, nature & agricultural (1,397 | 6.9%) are the most common fields of study among 20,157 individuals in Los Altos who have obtained a bachelor's degree or higher.
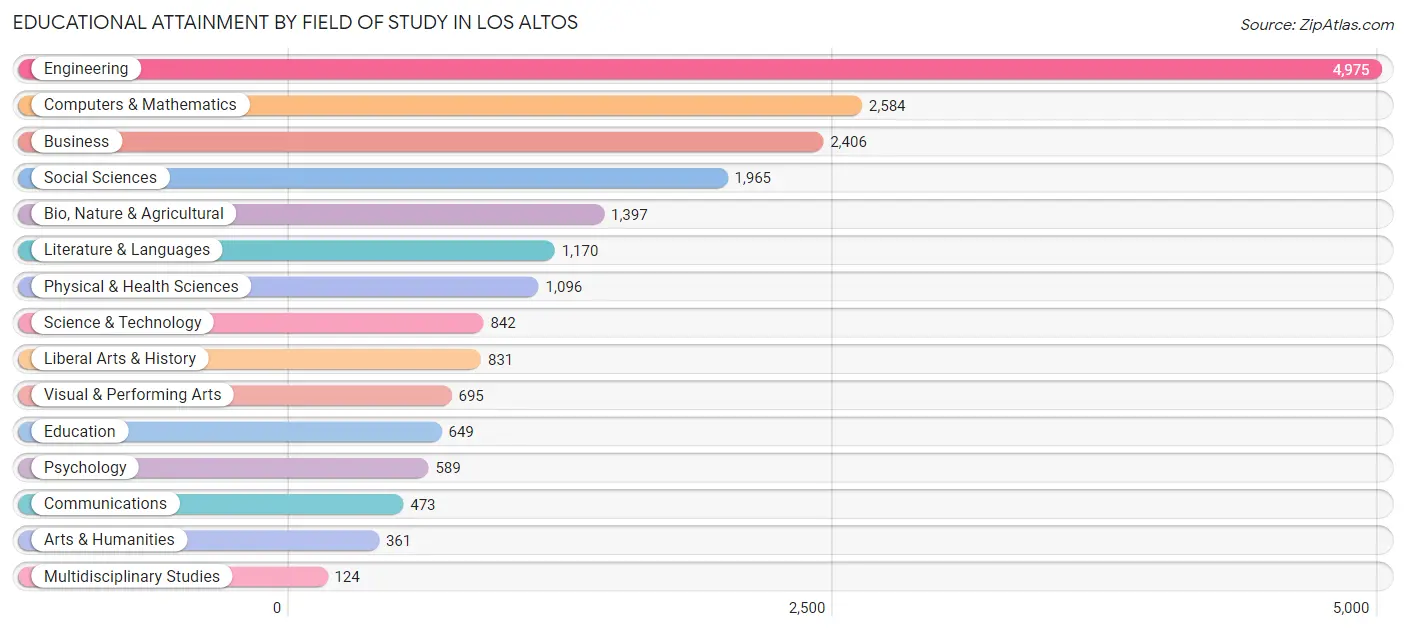
| Field of Study | # Graduates | % Graduates |
| Computers & Mathematics | 2,584 | 12.8% |
| Bio, Nature & Agricultural | 1,397 | 6.9% |
| Physical & Health Sciences | 1,096 | 5.4% |
| Psychology | 589 | 2.9% |
| Social Sciences | 1,965 | 9.8% |
| Engineering | 4,975 | 24.7% |
| Multidisciplinary Studies | 124 | 0.6% |
| Science & Technology | 842 | 4.2% |
| Business | 2,406 | 11.9% |
| Education | 649 | 3.2% |
| Literature & Languages | 1,170 | 5.8% |
| Liberal Arts & History | 831 | 4.1% |
| Visual & Performing Arts | 695 | 3.5% |
| Communications | 473 | 2.4% |
| Arts & Humanities | 361 | 1.8% |
| Total | 20,157 | 100.0% |
Transportation & Commute in Los Altos
Vehicle Availability by Sex in Los Altos
The most prevalent vehicle ownership categories in Los Altos are males with 2 vehicles (3,640, accounting for 47.7%) and females with 2 vehicles (2,592, making up 62.0%).
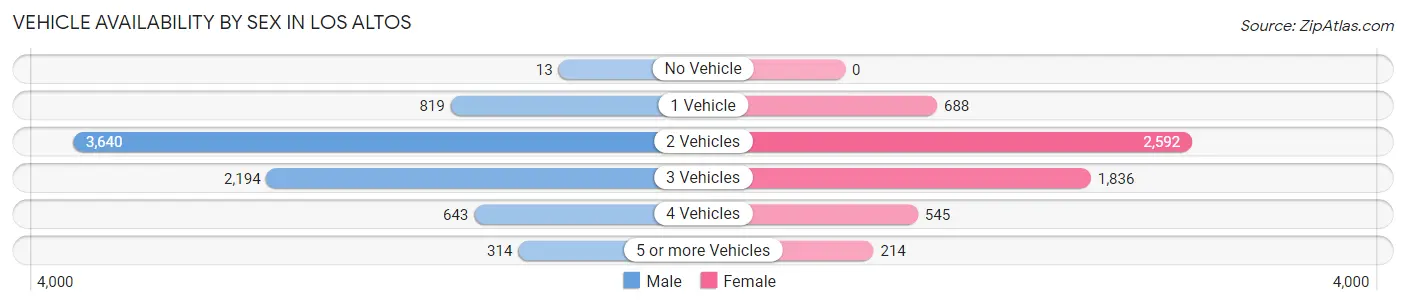
| Vehicles Available | Male | Female |
| No Vehicle | 13 (0.2%) | 0 (0.0%) |
| 1 Vehicle | 819 (10.7%) | 688 (11.7%) |
| 2 Vehicles | 3,640 (47.7%) | 2,592 (44.1%) |
| 3 Vehicles | 2,194 (28.8%) | 1,836 (31.2%) |
| 4 Vehicles | 643 (8.4%) | 545 (9.3%) |
| 5 or more Vehicles | 314 (4.1%) | 214 (3.6%) |
| Total | 7,623 (100.0%) | 5,875 (100.0%) |
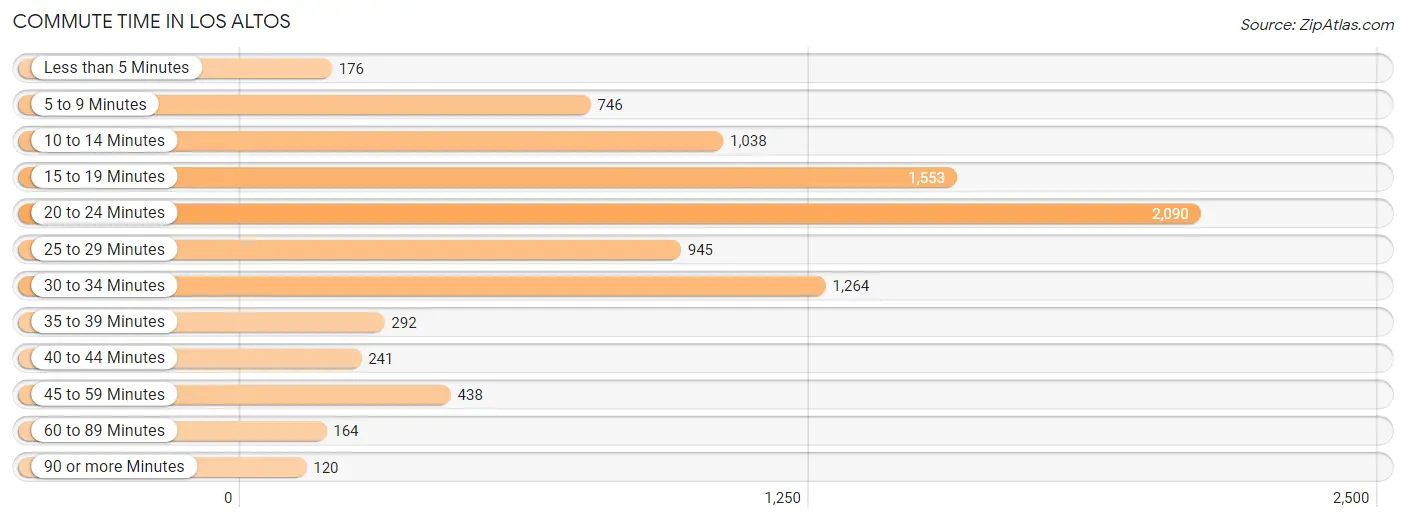
Commute Time in Los Altos
The most frequently occuring commute durations in Los Altos are 20 to 24 minutes (2,090 commuters, 23.1%), 15 to 19 minutes (1,553 commuters, 17.1%), and 30 to 34 minutes (1,264 commuters, 13.9%).
| Commute Time | # Commuters | % Commuters |
| Less than 5 Minutes | 176 | 1.9% |
| 5 to 9 Minutes | 746 | 8.2% |
| 10 to 14 Minutes | 1,038 | 11.5% |
| 15 to 19 Minutes | 1,553 | 17.1% |
| 20 to 24 Minutes | 2,090 | 23.1% |
| 25 to 29 Minutes | 945 | 10.4% |
| 30 to 34 Minutes | 1,264 | 13.9% |
| 35 to 39 Minutes | 292 | 3.2% |
| 40 to 44 Minutes | 241 | 2.7% |
| 45 to 59 Minutes | 438 | 4.8% |
| 60 to 89 Minutes | 164 | 1.8% |
| 90 or more Minutes | 120 | 1.3% |
Commute Time by Sex in Los Altos
The most common commute times in Los Altos are 20 to 24 minutes (1,189 commuters, 22.8%) for males and 20 to 24 minutes (901 commuters, 23.4%) for females.
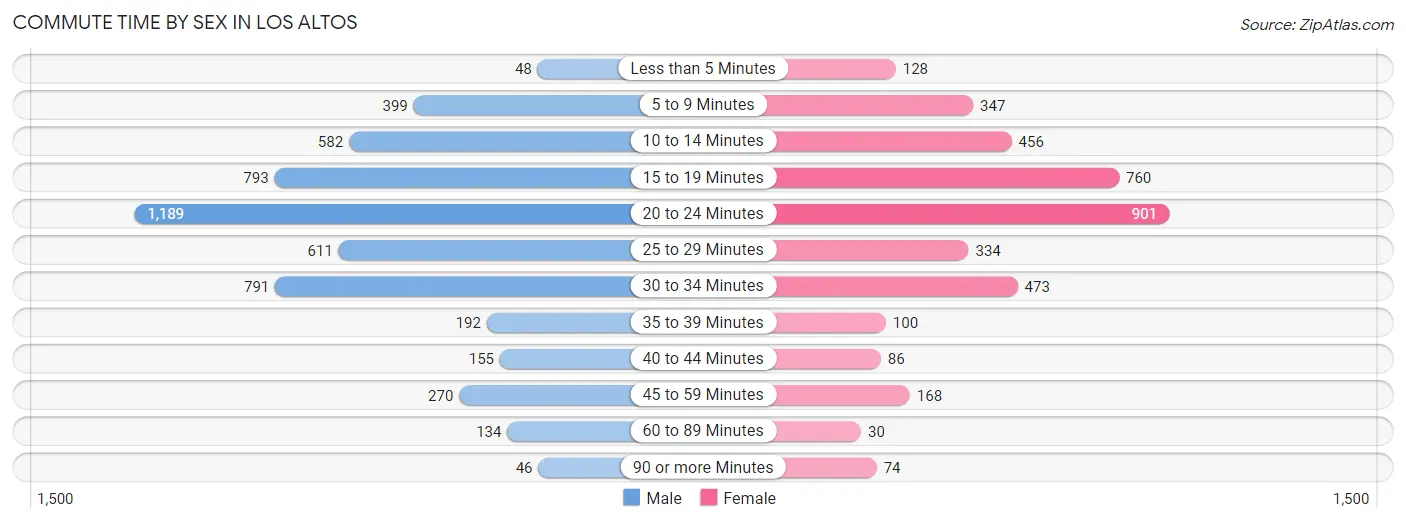
| Commute Time | Male | Female |
| Less than 5 Minutes | 48 (0.9%) | 128 (3.3%) |
| 5 to 9 Minutes | 399 (7.7%) | 347 (9.0%) |
| 10 to 14 Minutes | 582 (11.2%) | 456 (11.8%) |
| 15 to 19 Minutes | 793 (15.2%) | 760 (19.7%) |
| 20 to 24 Minutes | 1,189 (22.8%) | 901 (23.4%) |
| 25 to 29 Minutes | 611 (11.7%) | 334 (8.7%) |
| 30 to 34 Minutes | 791 (15.2%) | 473 (12.3%) |
| 35 to 39 Minutes | 192 (3.7%) | 100 (2.6%) |
| 40 to 44 Minutes | 155 (3.0%) | 86 (2.2%) |
| 45 to 59 Minutes | 270 (5.2%) | 168 (4.4%) |
| 60 to 89 Minutes | 134 (2.6%) | 30 (0.8%) |
| 90 or more Minutes | 46 (0.9%) | 74 (1.9%) |
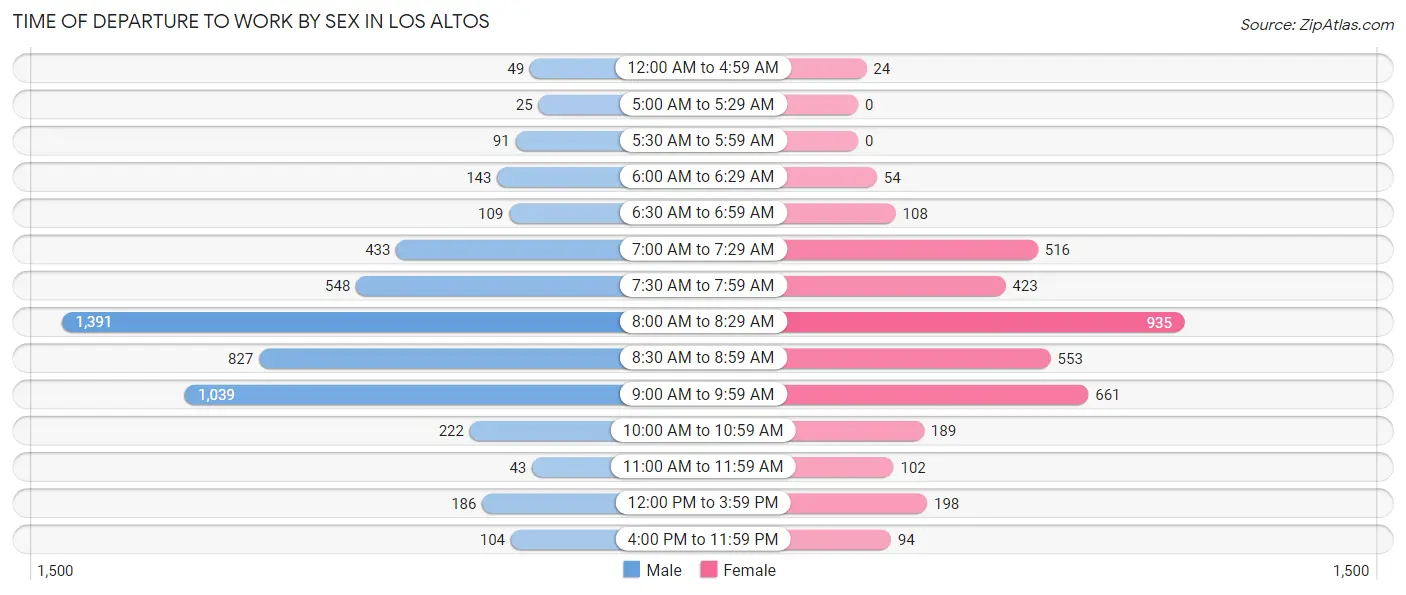
Time of Departure to Work by Sex in Los Altos
The most frequent times of departure to work in Los Altos are 8:00 AM to 8:29 AM (1,391, 26.7%) for males and 8:00 AM to 8:29 AM (935, 24.2%) for females.
| Time of Departure | Male | Female |
| 12:00 AM to 4:59 AM | 49 (0.9%) | 24 (0.6%) |
| 5:00 AM to 5:29 AM | 25 (0.5%) | 0 (0.0%) |
| 5:30 AM to 5:59 AM | 91 (1.8%) | 0 (0.0%) |
| 6:00 AM to 6:29 AM | 143 (2.7%) | 54 (1.4%) |
| 6:30 AM to 6:59 AM | 109 (2.1%) | 108 (2.8%) |
| 7:00 AM to 7:29 AM | 433 (8.3%) | 516 (13.4%) |
| 7:30 AM to 7:59 AM | 548 (10.5%) | 423 (11.0%) |
| 8:00 AM to 8:29 AM | 1,391 (26.7%) | 935 (24.2%) |
| 8:30 AM to 8:59 AM | 827 (15.9%) | 553 (14.3%) |
| 9:00 AM to 9:59 AM | 1,039 (19.9%) | 661 (17.1%) |
| 10:00 AM to 10:59 AM | 222 (4.3%) | 189 (4.9%) |
| 11:00 AM to 11:59 AM | 43 (0.8%) | 102 (2.6%) |
| 12:00 PM to 3:59 PM | 186 (3.6%) | 198 (5.1%) |
| 4:00 PM to 11:59 PM | 104 (2.0%) | 94 (2.4%) |
| Total | 5,210 (100.0%) | 3,857 (100.0%) |
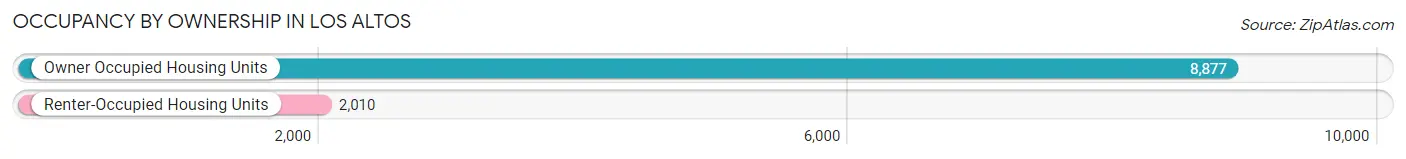
Housing Occupancy in Los Altos
Occupancy by Ownership in Los Altos
Of the total 10,887 dwellings in Los Altos, owner-occupied units account for 8,877 (81.5%), while renter-occupied units make up 2,010 (18.5%).
| Occupancy | # Housing Units | % Housing Units |
| Owner Occupied Housing Units | 8,877 | 81.5% |
| Renter-Occupied Housing Units | 2,010 | 18.5% |
| Total Occupied Housing Units | 10,887 | 100.0% |
Occupancy by Household Size in Los Altos
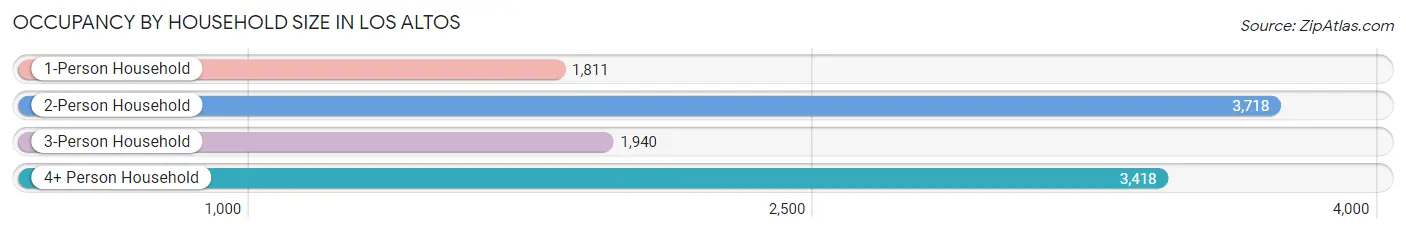
| Household Size | # Housing Units | % Housing Units |
| 1-Person Household | 1,811 | 16.6% |
| 2-Person Household | 3,718 | 34.2% |
| 3-Person Household | 1,940 | 17.8% |
| 4+ Person Household | 3,418 | 31.4% |
| Total Housing Units | 10,887 | 100.0% |
Occupancy by Ownership by Household Size in Los Altos
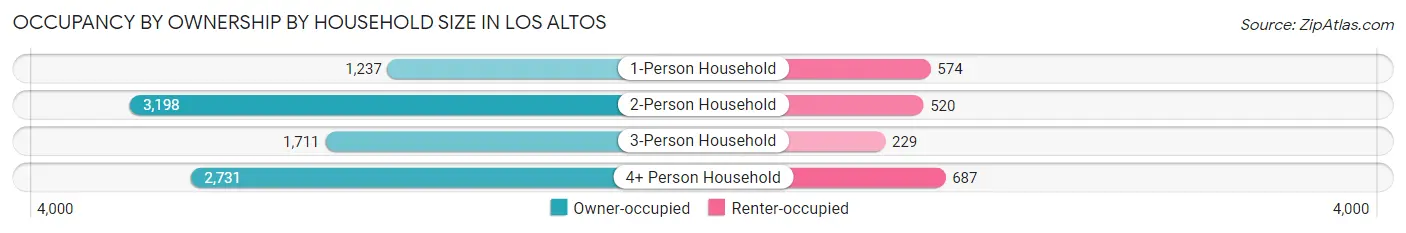
| Household Size | Owner-occupied | Renter-occupied |
| 1-Person Household | 1,237 (68.3%) | 574 (31.7%) |
| 2-Person Household | 3,198 (86.0%) | 520 (14.0%) |
| 3-Person Household | 1,711 (88.2%) | 229 (11.8%) |
| 4+ Person Household | 2,731 (79.9%) | 687 (20.1%) |
| Total Housing Units | 8,877 (81.5%) | 2,010 (18.5%) |
Occupancy by Educational Attainment in Los Altos
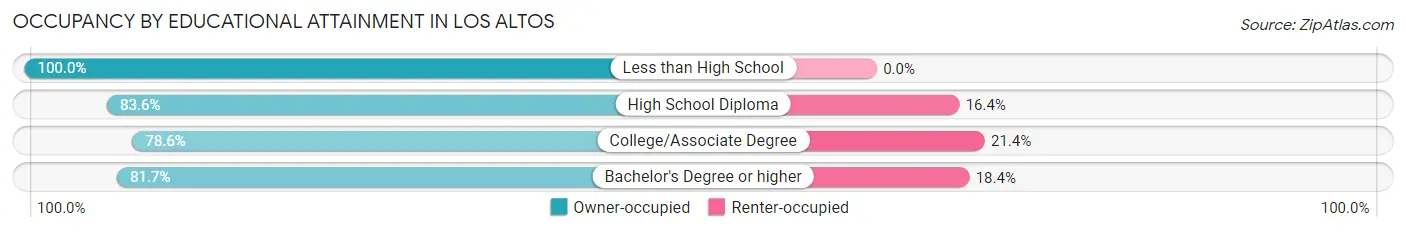
| Household Size | Owner-occupied | Renter-occupied |
| Less than High School | 49 (100.0%) | 0 (0.0%) |
| High School Diploma | 184 (83.6%) | 36 (16.4%) |
| College/Associate Degree | 673 (78.6%) | 183 (21.4%) |
| Bachelor's Degree or higher | 7,971 (81.7%) | 1,791 (18.3%) |
Occupancy by Age of Householder in Los Altos
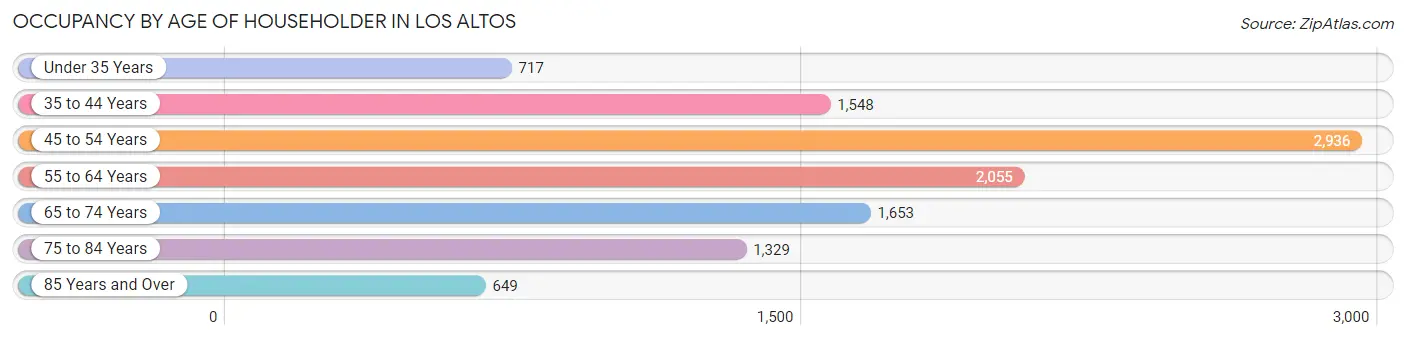
| Age Bracket | # Households | % Households |
| Under 35 Years | 717 | 6.6% |
| 35 to 44 Years | 1,548 | 14.2% |
| 45 to 54 Years | 2,936 | 27.0% |
| 55 to 64 Years | 2,055 | 18.9% |
| 65 to 74 Years | 1,653 | 15.2% |
| 75 to 84 Years | 1,329 | 12.2% |
| 85 Years and Over | 649 | 6.0% |
| Total | 10,887 | 100.0% |
Housing Finances in Los Altos
Median Income by Occupancy in Los Altos
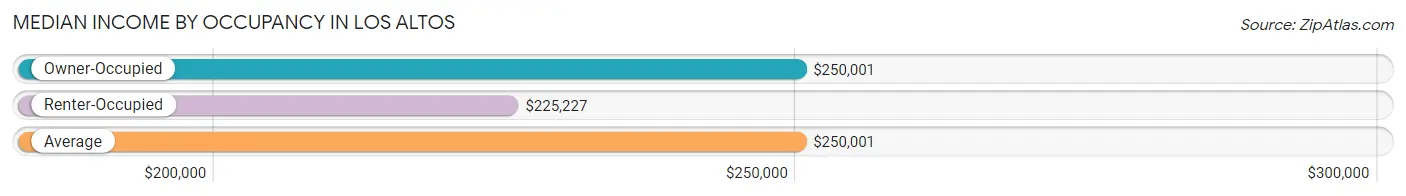
| Occupancy Type | # Households | Median Income |
| Owner-Occupied | 8,877 (81.5%) | $250,001 |
| Renter-Occupied | 2,010 (18.5%) | $225,227 |
| Average | 10,887 (100.0%) | $250,001 |
Occupancy by Householder Income Bracket in Los Altos
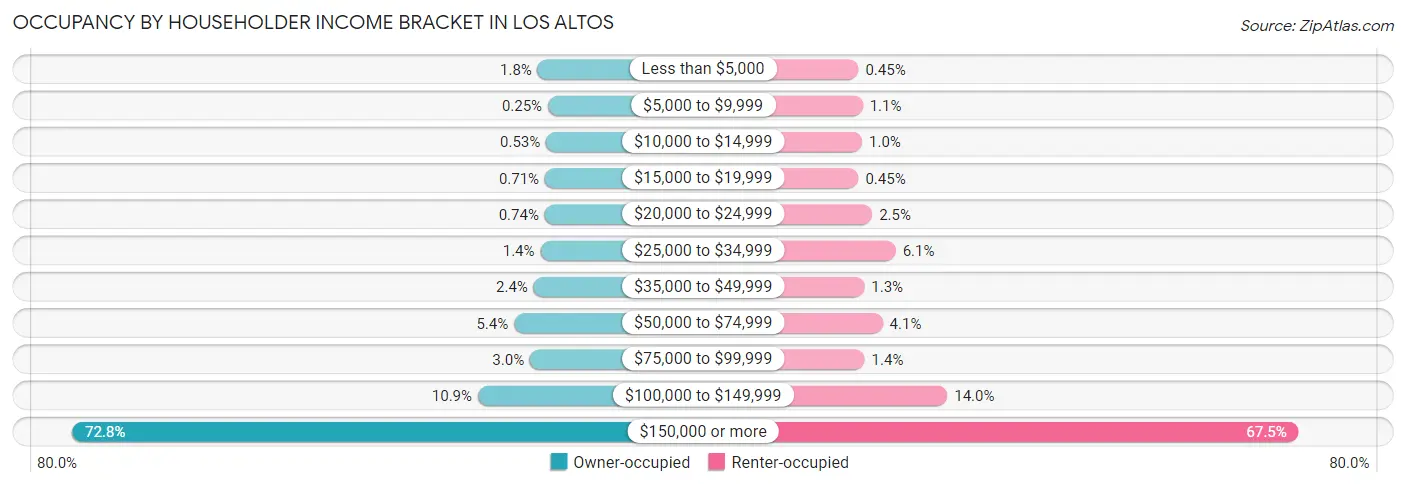
| Income Bracket | Owner-occupied | Renter-occupied |
| Less than $5,000 | 162 (1.8%) | 9 (0.4%) |
| $5,000 to $9,999 | 22 (0.3%) | 22 (1.1%) |
| $10,000 to $14,999 | 47 (0.5%) | 20 (1.0%) |
| $15,000 to $19,999 | 63 (0.7%) | 9 (0.4%) |
| $20,000 to $24,999 | 66 (0.7%) | 51 (2.5%) |
| $25,000 to $34,999 | 125 (1.4%) | 123 (6.1%) |
| $35,000 to $49,999 | 216 (2.4%) | 27 (1.3%) |
| $50,000 to $74,999 | 481 (5.4%) | 83 (4.1%) |
| $75,000 to $99,999 | 265 (3.0%) | 28 (1.4%) |
| $100,000 to $149,999 | 970 (10.9%) | 281 (14.0%) |
| $150,000 or more | 6,460 (72.8%) | 1,357 (67.5%) |
| Total | 8,877 (100.0%) | 2,010 (100.0%) |
Monthly Housing Cost Tiers in Los Altos
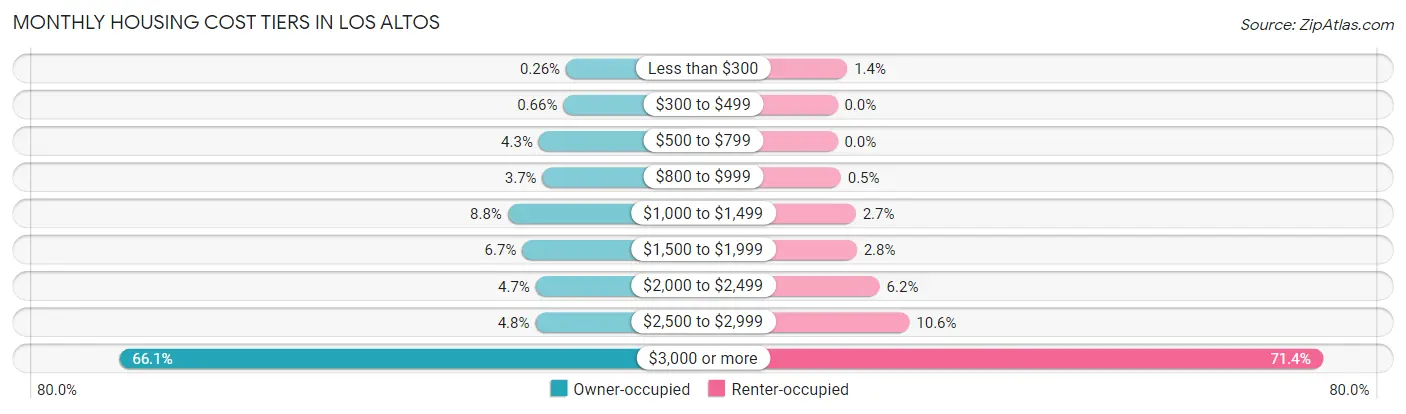
| Monthly Cost | Owner-occupied | Renter-occupied |
| Less than $300 | 23 (0.3%) | 29 (1.4%) |
| $300 to $499 | 59 (0.7%) | 0 (0.0%) |
| $500 to $799 | 379 (4.3%) | 0 (0.0%) |
| $800 to $999 | 331 (3.7%) | 10 (0.5%) |
| $1,000 to $1,499 | 785 (8.8%) | 54 (2.7%) |
| $1,500 to $1,999 | 595 (6.7%) | 57 (2.8%) |
| $2,000 to $2,499 | 419 (4.7%) | 125 (6.2%) |
| $2,500 to $2,999 | 423 (4.8%) | 213 (10.6%) |
| $3,000 or more | 5,863 (66.0%) | 1,436 (71.4%) |
| Total | 8,877 (100.0%) | 2,010 (100.0%) |
Physical Housing Characteristics in Los Altos
Housing Structures in Los Altos
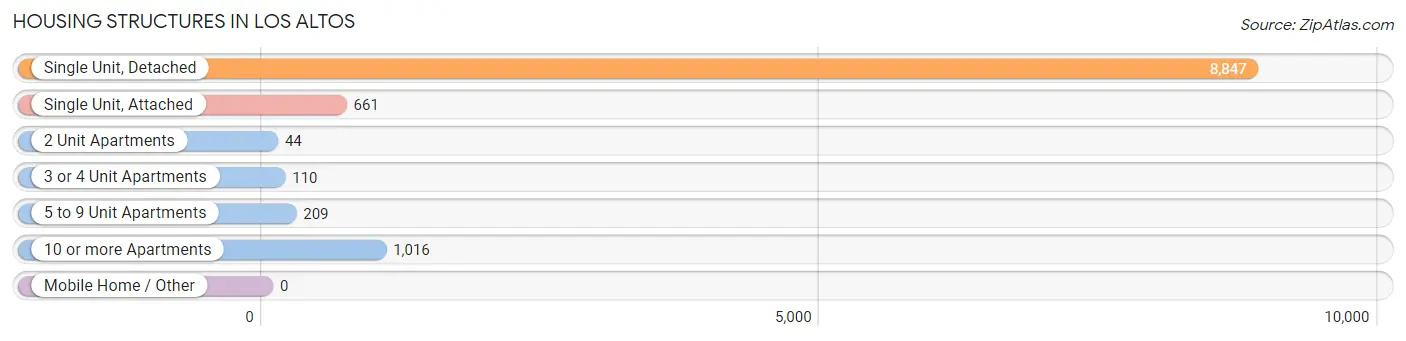
| Structure Type | # Housing Units | % Housing Units |
| Single Unit, Detached | 8,847 | 81.3% |
| Single Unit, Attached | 661 | 6.1% |
| 2 Unit Apartments | 44 | 0.4% |
| 3 or 4 Unit Apartments | 110 | 1.0% |
| 5 to 9 Unit Apartments | 209 | 1.9% |
| 10 or more Apartments | 1,016 | 9.3% |
| Mobile Home / Other | 0 | 0.0% |
| Total | 10,887 | 100.0% |
Housing Structures by Occupancy in Los Altos
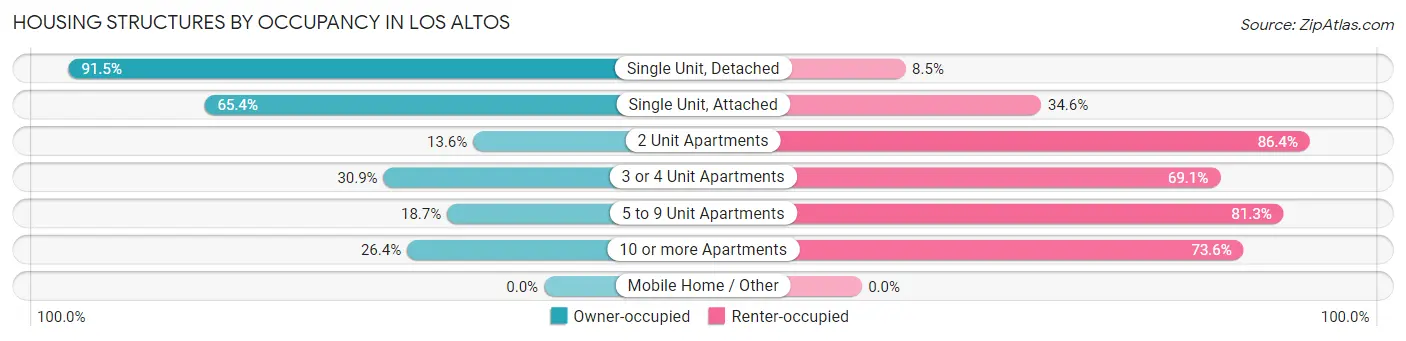
| Structure Type | Owner-occupied | Renter-occupied |
| Single Unit, Detached | 8,098 (91.5%) | 749 (8.5%) |
| Single Unit, Attached | 432 (65.4%) | 229 (34.6%) |
| 2 Unit Apartments | 6 (13.6%) | 38 (86.4%) |
| 3 or 4 Unit Apartments | 34 (30.9%) | 76 (69.1%) |
| 5 to 9 Unit Apartments | 39 (18.7%) | 170 (81.3%) |
| 10 or more Apartments | 268 (26.4%) | 748 (73.6%) |
| Mobile Home / Other | 0 (0.0%) | 0 (0.0%) |
| Total | 8,877 (81.5%) | 2,010 (18.5%) |
Housing Structures by Number of Rooms in Los Altos
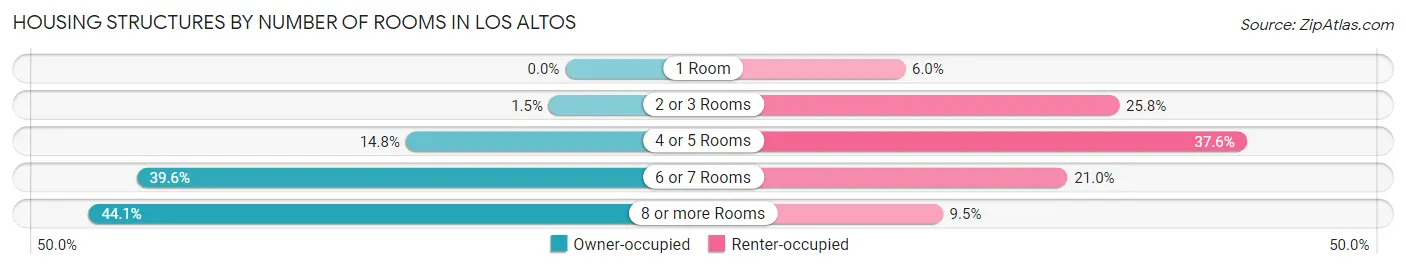
| Number of Rooms | Owner-occupied | Renter-occupied |
| 1 Room | 0 (0.0%) | 121 (6.0%) |
| 2 or 3 Rooms | 135 (1.5%) | 519 (25.8%) |
| 4 or 5 Rooms | 1,309 (14.7%) | 756 (37.6%) |
| 6 or 7 Rooms | 3,519 (39.6%) | 423 (21.0%) |
| 8 or more Rooms | 3,914 (44.1%) | 191 (9.5%) |
| Total | 8,877 (100.0%) | 2,010 (100.0%) |
Housing Structure by Heating Type in Los Altos
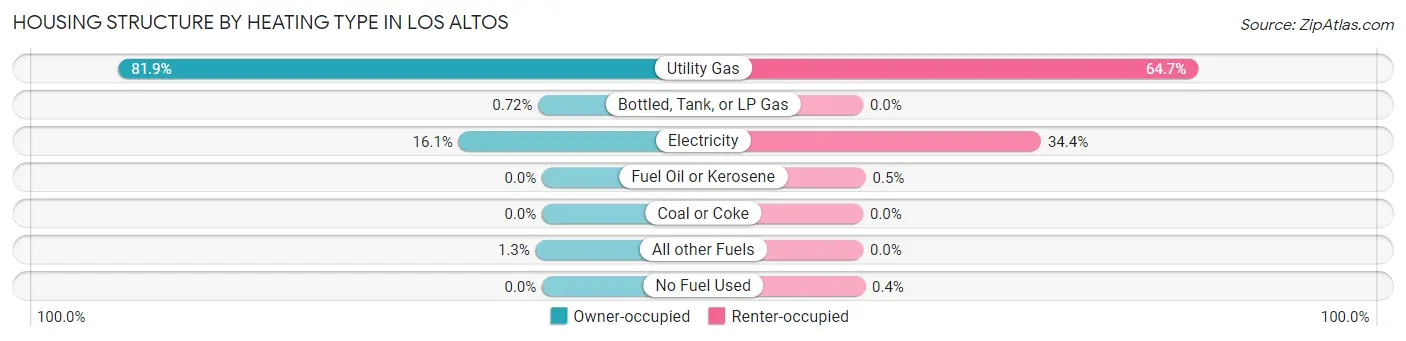
| Heating Type | Owner-occupied | Renter-occupied |
| Utility Gas | 7,269 (81.9%) | 1,301 (64.7%) |
| Bottled, Tank, or LP Gas | 64 (0.7%) | 0 (0.0%) |
| Electricity | 1,431 (16.1%) | 691 (34.4%) |
| Fuel Oil or Kerosene | 0 (0.0%) | 10 (0.5%) |
| Coal or Coke | 0 (0.0%) | 0 (0.0%) |
| All other Fuels | 113 (1.3%) | 0 (0.0%) |
| No Fuel Used | 0 (0.0%) | 8 (0.4%) |
| Total | 8,877 (100.0%) | 2,010 (100.0%) |
Household Vehicle Usage in Los Altos
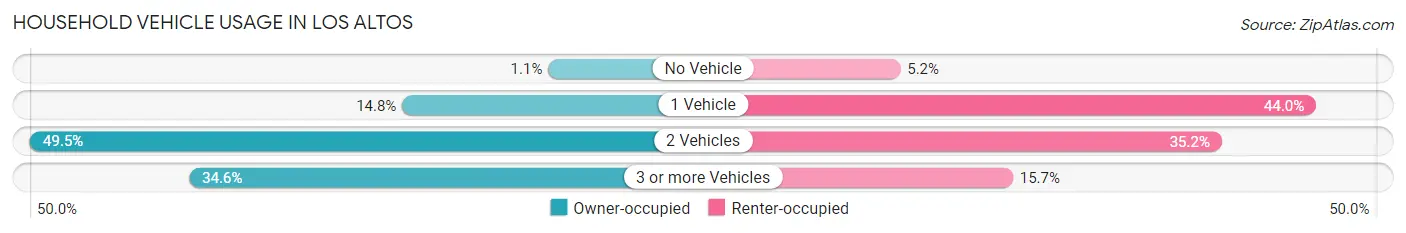
| Vehicles per Household | Owner-occupied | Renter-occupied |
| No Vehicle | 99 (1.1%) | 104 (5.2%) |
| 1 Vehicle | 1,309 (14.7%) | 884 (44.0%) |
| 2 Vehicles | 4,394 (49.5%) | 707 (35.2%) |
| 3 or more Vehicles | 3,075 (34.6%) | 315 (15.7%) |
| Total | 8,877 (100.0%) | 2,010 (100.0%) |
Real Estate & Mortgages in Los Altos
Real Estate and Mortgage Overview in Los Altos
| Characteristic | Without Mortgage | With Mortgage |
| Housing Units | 3,220 | 5,657 |
| Median Property Value | $2,000,001 | $2,000,001 |
| Median Household Income | $217,500 | $4,481 |
| Monthly Housing Costs | $1,501 | $5,227 |
| Real Estate Taxes | $10,001 | $9 |
Property Value by Mortgage Status in Los Altos
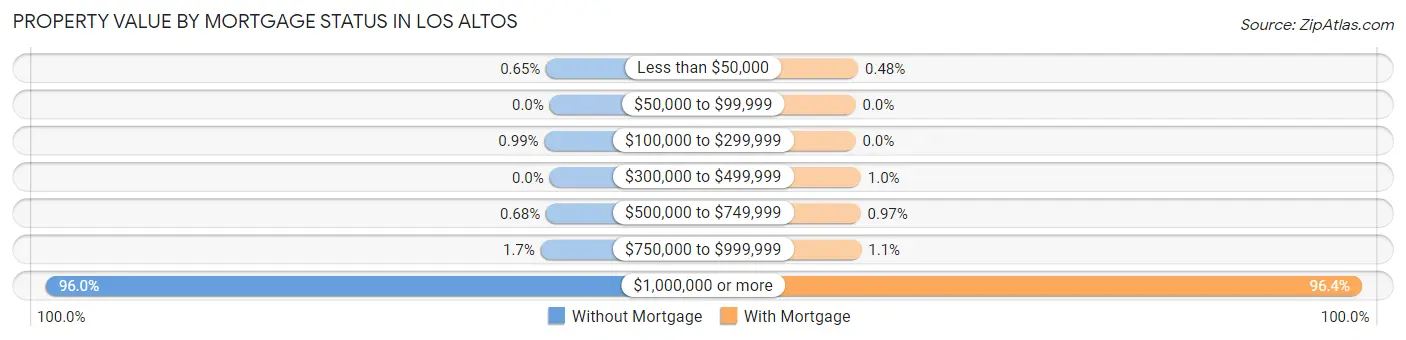
| Property Value | Without Mortgage | With Mortgage |
| Less than $50,000 | 21 (0.6%) | 27 (0.5%) |
| $50,000 to $99,999 | 0 (0.0%) | 0 (0.0%) |
| $100,000 to $299,999 | 32 (1.0%) | 0 (0.0%) |
| $300,000 to $499,999 | 0 (0.0%) | 57 (1.0%) |
| $500,000 to $749,999 | 22 (0.7%) | 55 (1.0%) |
| $750,000 to $999,999 | 55 (1.7%) | 63 (1.1%) |
| $1,000,000 or more | 3,090 (96.0%) | 5,455 (96.4%) |
| Total | 3,220 (100.0%) | 5,657 (100.0%) |
Household Income by Mortgage Status in Los Altos
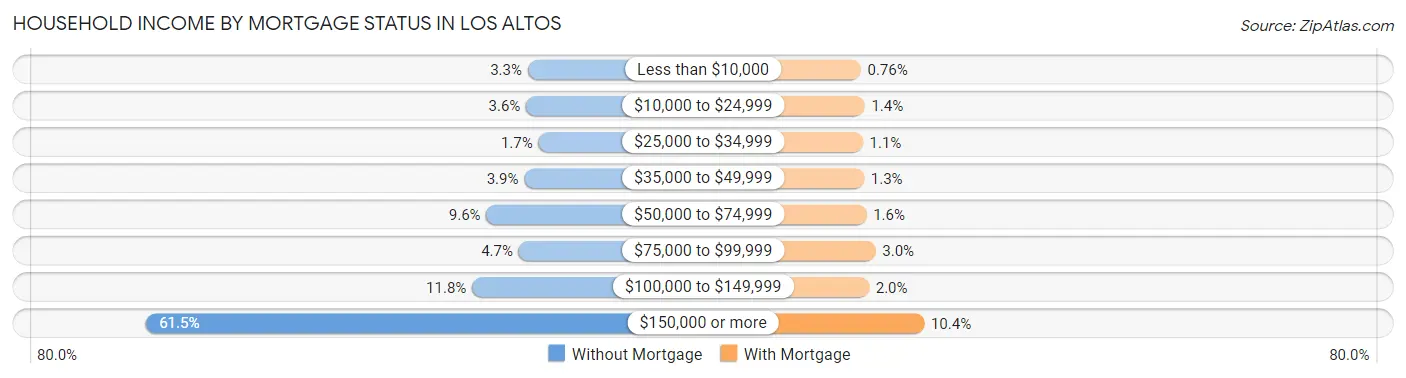
| Household Income | Without Mortgage | With Mortgage |
| Less than $10,000 | 107 (3.3%) | 43 (0.8%) |
| $10,000 to $24,999 | 115 (3.6%) | 77 (1.4%) |
| $25,000 to $34,999 | 54 (1.7%) | 61 (1.1%) |
| $35,000 to $49,999 | 124 (3.8%) | 71 (1.3%) |
| $50,000 to $74,999 | 310 (9.6%) | 92 (1.6%) |
| $75,000 to $99,999 | 151 (4.7%) | 171 (3.0%) |
| $100,000 to $149,999 | 380 (11.8%) | 114 (2.0%) |
| $150,000 or more | 1,979 (61.5%) | 590 (10.4%) |
| Total | 3,220 (100.0%) | 5,657 (100.0%) |
Property Value to Household Income Ratio in Los Altos
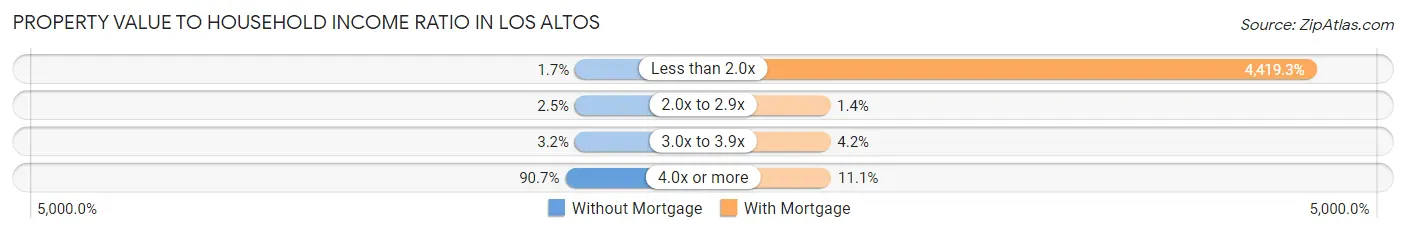
| Value-to-Income Ratio | Without Mortgage | With Mortgage |
| Less than 2.0x | 55 (1.7%) | 250,001 (4,419.3%) |
| 2.0x to 2.9x | 80 (2.5%) | 79 (1.4%) |
| 3.0x to 3.9x | 102 (3.2%) | 238 (4.2%) |
| 4.0x or more | 2,920 (90.7%) | 629 (11.1%) |
| Total | 3,220 (100.0%) | 5,657 (100.0%) |
Real Estate Taxes by Mortgage Status in Los Altos
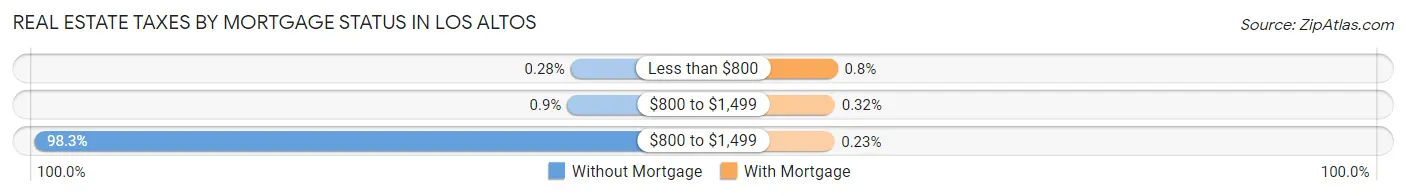
| Property Taxes | Without Mortgage | With Mortgage |
| Less than $800 | 9 (0.3%) | 45 (0.8%) |
| $800 to $1,499 | 29 (0.9%) | 18 (0.3%) |
| $800 to $1,499 | 3,164 (98.3%) | 13 (0.2%) |
| Total | 3,220 (100.0%) | 5,657 (100.0%) |
Health & Disability in Los Altos
Health Insurance Coverage by Age in Los Altos
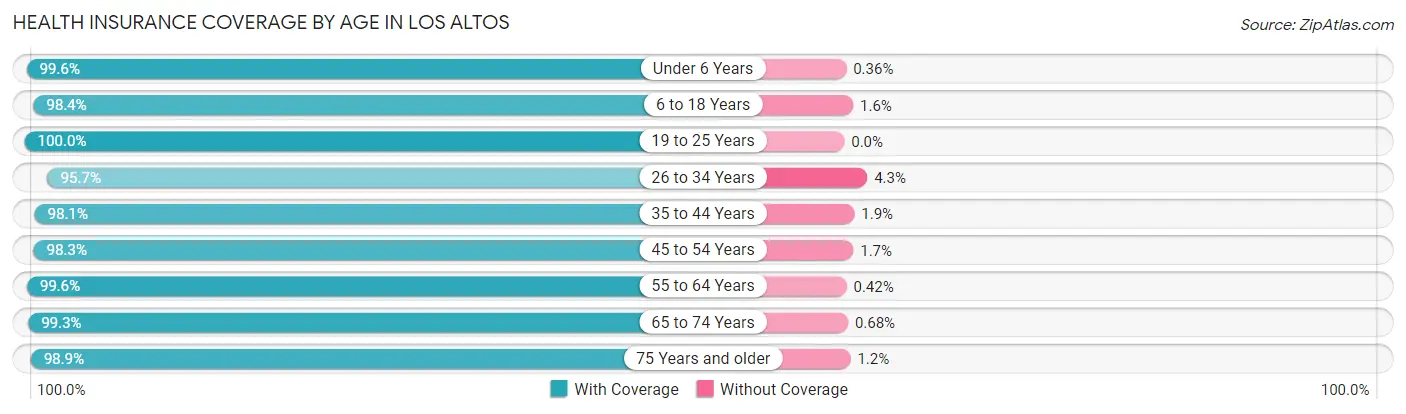
| Age Bracket | With Coverage | Without Coverage |
| Under 6 Years | 1,668 (99.6%) | 6 (0.4%) |
| 6 to 18 Years | 6,100 (98.4%) | 102 (1.6%) |
| 19 to 25 Years | 1,920 (100.0%) | 0 (0.0%) |
| 26 to 34 Years | 1,615 (95.7%) | 72 (4.3%) |
| 35 to 44 Years | 3,361 (98.1%) | 64 (1.9%) |
| 45 to 54 Years | 5,621 (98.3%) | 96 (1.7%) |
| 55 to 64 Years | 4,077 (99.6%) | 17 (0.4%) |
| 65 to 74 Years | 2,936 (99.3%) | 20 (0.7%) |
| 75 Years and older | 3,182 (98.9%) | 37 (1.1%) |
| Total | 30,480 (98.7%) | 414 (1.3%) |
Health Insurance Coverage by Citizenship Status in Los Altos
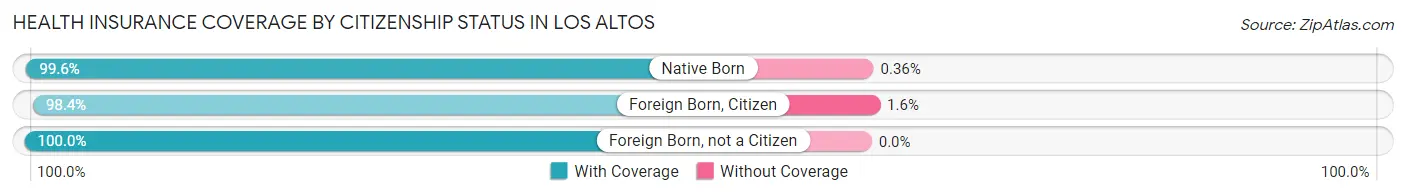
| Citizenship Status | With Coverage | Without Coverage |
| Native Born | 1,668 (99.6%) | 6 (0.4%) |
| Foreign Born, Citizen | 6,100 (98.4%) | 102 (1.6%) |
| Foreign Born, not a Citizen | 1,920 (100.0%) | 0 (0.0%) |
Health Insurance Coverage by Household Income in Los Altos
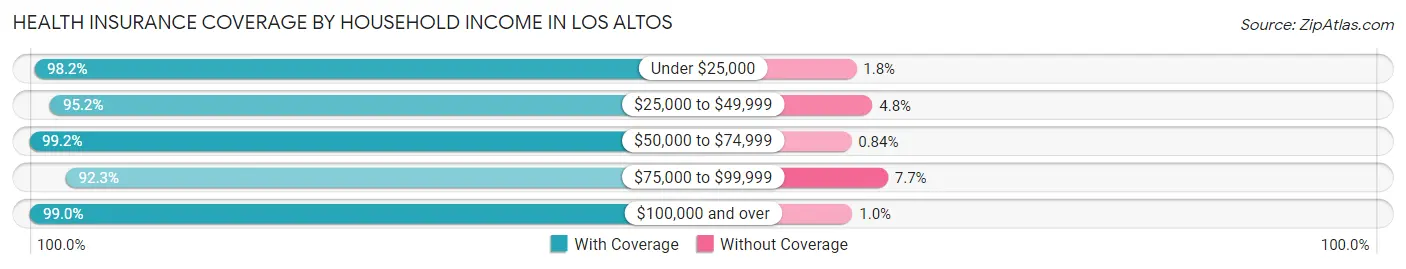
| Household Income | With Coverage | Without Coverage |
| Under $25,000 | 715 (98.2%) | 13 (1.8%) |
| $25,000 to $49,999 | 936 (95.2%) | 47 (4.8%) |
| $50,000 to $74,999 | 1,061 (99.2%) | 9 (0.8%) |
| $75,000 to $99,999 | 540 (92.3%) | 45 (7.7%) |
| $100,000 and over | 27,153 (99.0%) | 285 (1.0%) |
Public vs Private Health Insurance Coverage by Age in Los Altos
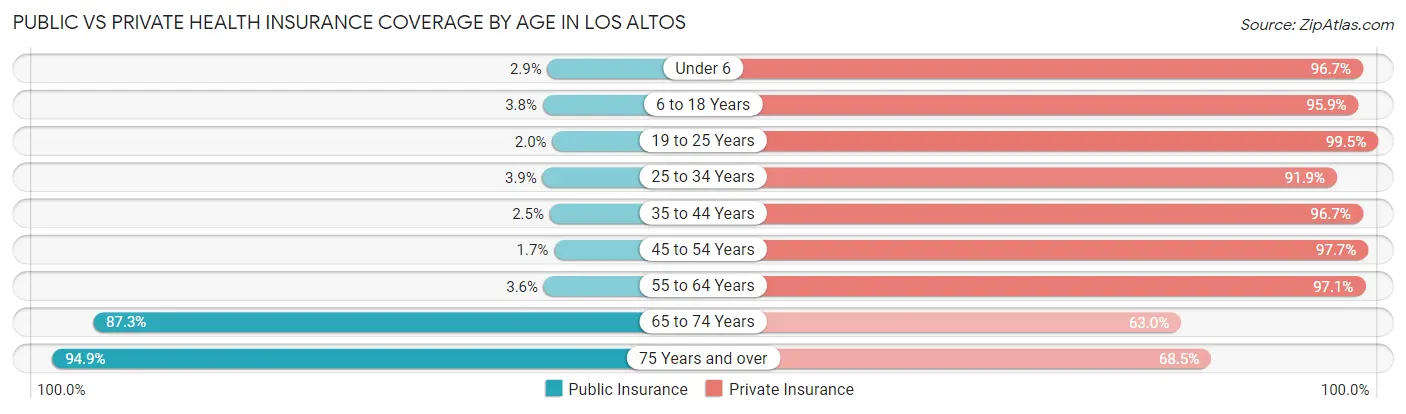
| Age Bracket | Public Insurance | Private Insurance |
| Under 6 | 49 (2.9%) | 1,619 (96.7%) |
| 6 to 18 Years | 237 (3.8%) | 5,947 (95.9%) |
| 19 to 25 Years | 39 (2.0%) | 1,911 (99.5%) |
| 25 to 34 Years | 65 (3.8%) | 1,550 (91.9%) |
| 35 to 44 Years | 86 (2.5%) | 3,311 (96.7%) |
| 45 to 54 Years | 97 (1.7%) | 5,585 (97.7%) |
| 55 to 64 Years | 148 (3.6%) | 3,977 (97.1%) |
| 65 to 74 Years | 2,581 (87.3%) | 1,861 (63.0%) |
| 75 Years and over | 3,054 (94.9%) | 2,206 (68.5%) |
| Total | 6,356 (20.6%) | 27,967 (90.5%) |
Disability Status by Sex by Age in Los Altos
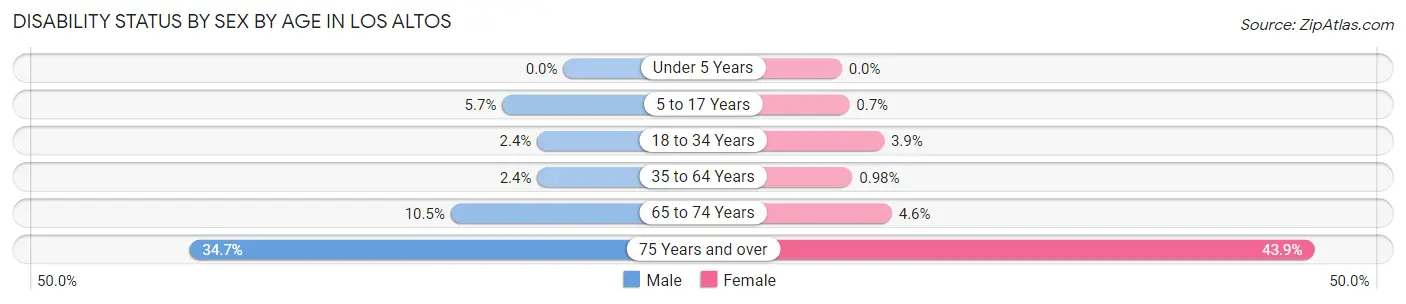
| Age Bracket | Male | Female |
| Under 5 Years | 0 (0.0%) | 0 (0.0%) |
| 5 to 17 Years | 195 (5.7%) | 20 (0.7%) |
| 18 to 34 Years | 47 (2.4%) | 77 (3.9%) |
| 35 to 64 Years | 162 (2.4%) | 64 (1.0%) |
| 65 to 74 Years | 149 (10.4%) | 71 (4.6%) |
| 75 Years and over | 491 (34.7%) | 791 (43.9%) |
Disability Class by Sex by Age in Los Altos
Disability Class: Hearing Difficulty
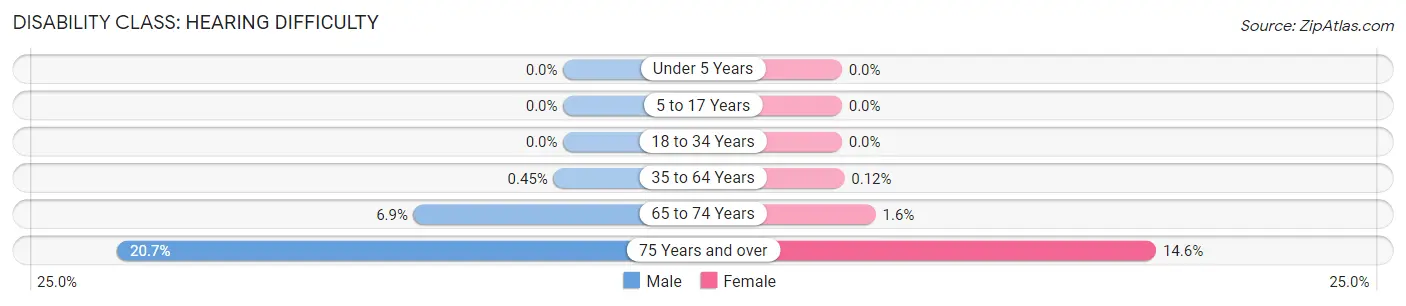
| Age Bracket | Male | Female |
| Under 5 Years | 0 (0.0%) | 0 (0.0%) |
| 5 to 17 Years | 0 (0.0%) | 0 (0.0%) |
| 18 to 34 Years | 0 (0.0%) | 0 (0.0%) |
| 35 to 64 Years | 30 (0.4%) | 8 (0.1%) |
| 65 to 74 Years | 99 (6.9%) | 24 (1.6%) |
| 75 Years and over | 293 (20.7%) | 263 (14.6%) |
Disability Class: Vision Difficulty
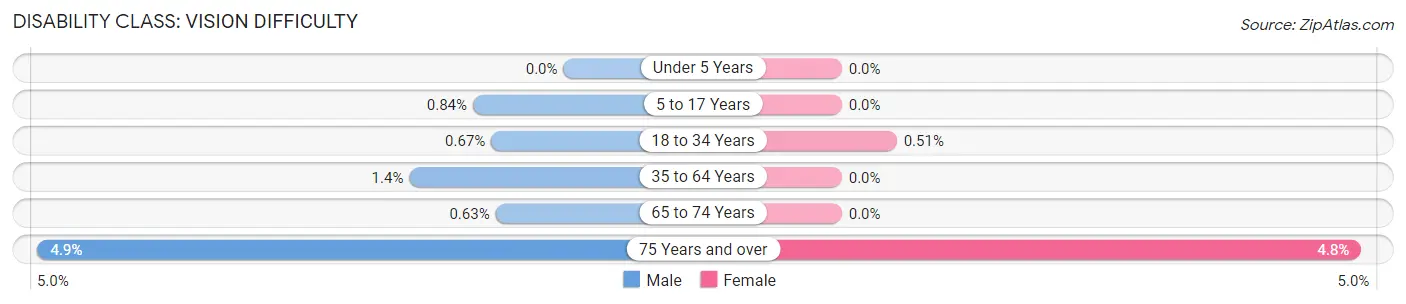
| Age Bracket | Male | Female |
| Under 5 Years | 0 (0.0%) | 0 (0.0%) |
| 5 to 17 Years | 29 (0.8%) | 0 (0.0%) |
| 18 to 34 Years | 13 (0.7%) | 10 (0.5%) |
| 35 to 64 Years | 96 (1.4%) | 0 (0.0%) |
| 65 to 74 Years | 9 (0.6%) | 0 (0.0%) |
| 75 Years and over | 69 (4.9%) | 87 (4.8%) |
Disability Class: Cognitive Difficulty
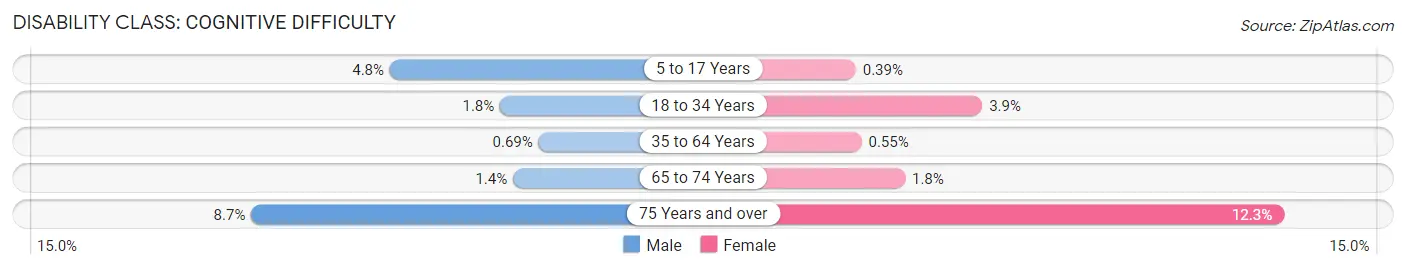
| Age Bracket | Male | Female |
| 5 to 17 Years | 166 (4.8%) | 11 (0.4%) |
| 18 to 34 Years | 34 (1.8%) | 77 (3.9%) |
| 35 to 64 Years | 46 (0.7%) | 36 (0.5%) |
| 65 to 74 Years | 20 (1.4%) | 27 (1.8%) |
| 75 Years and over | 123 (8.7%) | 222 (12.3%) |
Disability Class: Ambulatory Difficulty
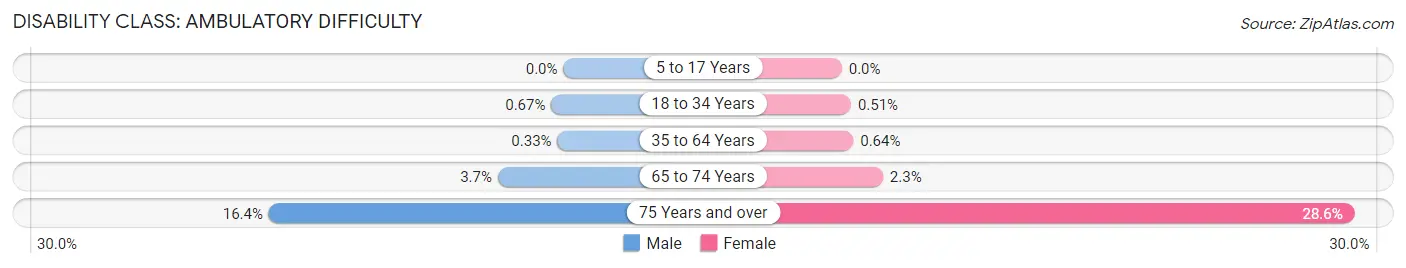
| Age Bracket | Male | Female |
| 5 to 17 Years | 0 (0.0%) | 0 (0.0%) |
| 18 to 34 Years | 13 (0.7%) | 10 (0.5%) |
| 35 to 64 Years | 22 (0.3%) | 42 (0.6%) |
| 65 to 74 Years | 52 (3.6%) | 35 (2.3%) |
| 75 Years and over | 232 (16.4%) | 515 (28.5%) |
Disability Class: Self-Care Difficulty
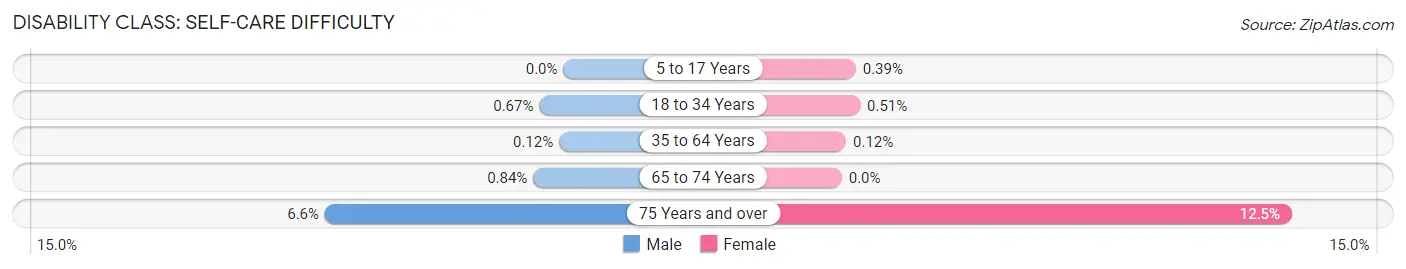
| Age Bracket | Male | Female |
| 5 to 17 Years | 0 (0.0%) | 11 (0.4%) |
| 18 to 34 Years | 13 (0.7%) | 10 (0.5%) |
| 35 to 64 Years | 8 (0.1%) | 8 (0.1%) |
| 65 to 74 Years | 12 (0.8%) | 0 (0.0%) |
| 75 Years and over | 94 (6.6%) | 226 (12.5%) |
Technology Access in Los Altos
Computing Device Access in Los Altos
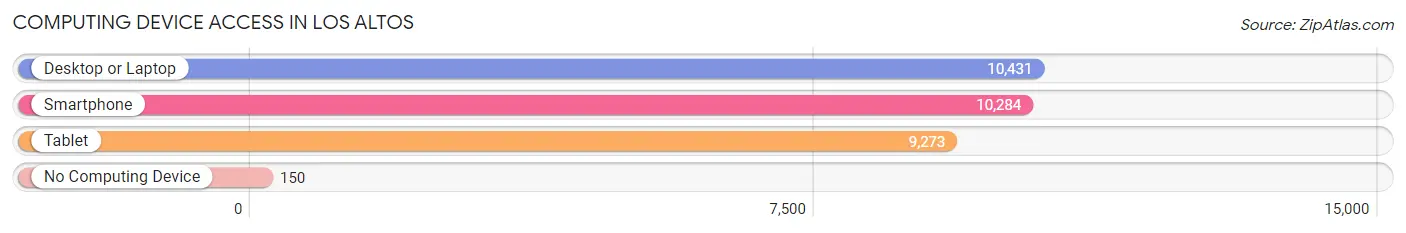
| Device Type | # Households | % Households |
| Desktop or Laptop | 10,431 | 95.8% |
| Smartphone | 10,284 | 94.5% |
| Tablet | 9,273 | 85.2% |
| No Computing Device | 150 | 1.4% |
| Total | 10,887 | 100.0% |
Internet Access in Los Altos
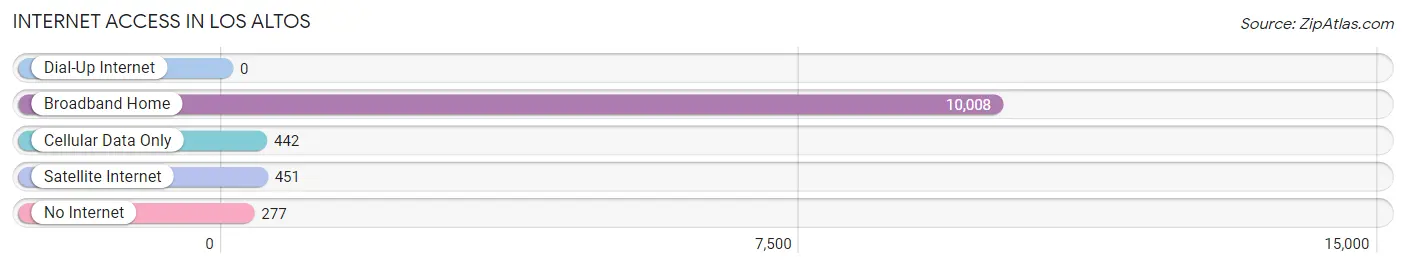
| Internet Type | # Households | % Households |
| Dial-Up Internet | 0 | 0.0% |
| Broadband Home | 10,008 | 91.9% |
| Cellular Data Only | 442 | 4.1% |
| Satellite Internet | 451 | 4.1% |
| No Internet | 277 | 2.5% |
| Total | 10,887 | 100.0% |
Los Altos Summary
Los Altos, California is a city located in Santa Clara County, in the San Francisco Bay Area. It is situated in the foothills of the Santa Cruz Mountains, and is bordered by the cities of Palo Alto, Mountain View, and Los Altos Hills. The city has a population of approximately 30,000 people, and is known for its excellent schools, high quality of life, and its proximity to Silicon Valley.
History
Los Altos was originally part of the Rancho San Antonio land grant, which was given to the Alviso family in 1839. The area was used for farming and ranching until the late 19th century, when it began to be developed for residential use. The city was incorporated in 1952, and has since grown to become one of the most affluent cities in the Bay Area.
Geography
Los Altos is located in the San Francisco Bay Area, in the foothills of the Santa Cruz Mountains. The city covers an area of 8.3 square miles, and is bordered by the cities of Palo Alto, Mountain View, and Los Altos Hills. The city is situated at an elevation of about 500 feet, and is located about 25 miles south of San Francisco.
Climate
Los Altos has a Mediterranean climate, with mild, wet winters and warm, dry summers. The average high temperature in the summer is around 80 degrees Fahrenheit, and the average low temperature in the winter is around 50 degrees Fahrenheit. The city receives an average of about 20 inches of rain per year.
Economy
Los Altos is home to a number of technology companies, including Google, Apple, and Microsoft. The city is also home to a number of venture capital firms, and is a popular destination for entrepreneurs and start-ups. The city also has a thriving retail sector, with a number of upscale shops and restaurants.
Demographics
As of the 2010 census, the population of Los Altos was 28,976. The racial makeup of the city was 74.3% White, 0.7% African American, 0.2% Native American, 20.2% Asian, 0.1% Pacific Islander, 2.2% from other races, and 2.4% from two or more races. The median household income was $150,890, and the median family income was $179,890.
Conclusion
Los Altos, California is a city located in Santa Clara County, in the San Francisco Bay Area. It is known for its excellent schools, high quality of life, and its proximity to Silicon Valley. The city has a population of approximately 30,000 people, and has a Mediterranean climate with mild, wet winters and warm, dry summers. The economy of Los Altos is largely based on technology, with a number of tech companies and venture capital firms located in the city. The racial makeup of the city is predominantly White, with a significant Asian population. The median household income is $150,890, and the median family income is $179,890.
Common Questions
What is Per Capita Income in Los Altos?
Per Capita income in Los Altos is $142,219.
What is the Median Family Income in Los Altos?
Median Family Income in Los Altos is $250,001.
What is the Median Household income in Los Altos?
Median Household Income in Los Altos is $250,001.
What is Income or Wage Gap in Los Altos?
Income or Wage Gap in Los Altos is 54.3%.
Women in Los Altos earn 45.7 cents for every dollar earned by a man.
What is Inequality or Gini Index in Los Altos?
Inequality or Gini Index in Los Altos is 0.48.
What is the Total Population of Los Altos?
Total Population of Los Altos is 31,133.
What is the Total Male Population of Los Altos?
Total Male Population of Los Altos is 15,685.
What is the Total Female Population of Los Altos?
Total Female Population of Los Altos is 15,448.
What is the Ratio of Males per 100 Females in Los Altos?
There are 101.53 Males per 100 Females in Los Altos.
What is the Ratio of Females per 100 Males in Los Altos?
There are 98.49 Females per 100 Males in Los Altos.
What is the Median Population Age in Los Altos?
Median Population Age in Los Altos is 46.6 Years.
What is the Average Family Size in Los Altos
Average Family Size in Los Altos is 3.2 People.
What is the Average Household Size in Los Altos
Average Household Size in Los Altos is 2.8 People.
How Large is the Labor Force in Los Altos?
There are 14,361 People in the Labor Forcein in Los Altos.
What is the Percentage of People in the Labor Force in Los Altos?
58.1% of People are in the Labor Force in Los Altos.
What is the Unemployment Rate in Los Altos?
Unemployment Rate in Los Altos is 3.9%.