Muir Beach, CA Map & Demographics
Muir Beach Map
Muir Beach Overview
$84,194
PER CAPITA INCOME
$228,438
AVG FAMILY INCOME
$198,229
AVG HOUSEHOLD INCOME
12.5%
WAGE / INCOME GAP [ % ]
87.5¢/ $1
WAGE / INCOME GAP [ $ ]
0.42
INEQUALITY / GINI INDEX
407
TOTAL POPULATION
246
MALE POPULATION
161
FEMALE POPULATION
152.80
MALES / 100 FEMALES
65.45
FEMALES / 100 MALES
56.2
MEDIAN AGE
2.9
AVG FAMILY SIZE
2.4
AVG HOUSEHOLD SIZE
212
LABOR FORCE [ PEOPLE ]
61.1%
PERCENT IN LABOR FORCE
7.5%
UNEMPLOYMENT RATE
Muir Beach Area Codes
Income in Muir Beach
Income Overview in Muir Beach
Per Capita Income in Muir Beach is $84,194, while median incomes of families and households are $228,438 and $198,229 respectively.
| Characteristic | Number | Measure |
| Per Capita Income | 407 | $84,194 |
| Median Family Income | 101 | $228,438 |
| Mean Family Income | 101 | $263,692 |
| Median Household Income | 170 | $198,229 |
| Mean Household Income | 170 | $188,965 |
| Income Deficit | 101 | $0 |
| Wage / Income Gap (%) | 407 | 12.49% |
| Wage / Income Gap ($) | 407 | 87.51¢ per $1 |
| Gini / Inequality Index | 407 | 0.42 |
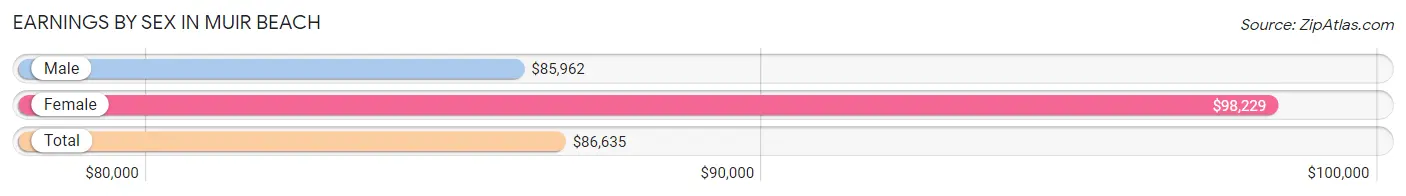
Earnings by Sex in Muir Beach
Average Earnings in Muir Beach are $86,635, $85,962 for men and $98,229 for women, a difference of 12.5%.
| Sex | Number | Average Earnings |
| Male | 142 (62.0%) | $85,962 |
| Female | 87 (38.0%) | $98,229 |
| Total | 229 (100.0%) | $86,635 |
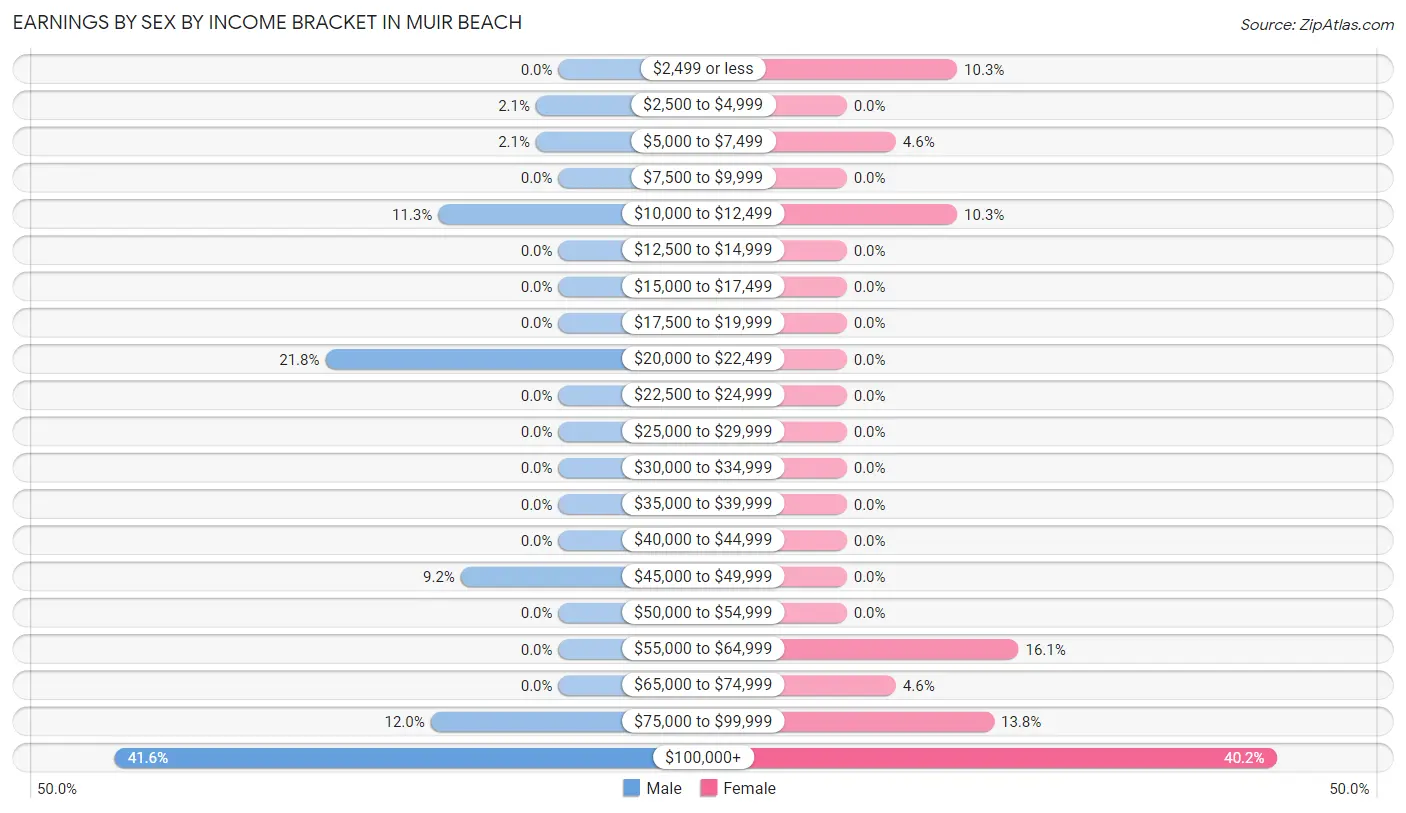
Earnings by Sex by Income Bracket in Muir Beach
The most common earnings brackets in Muir Beach are $100,000+ for men (59 | 41.5%) and $100,000+ for women (35 | 40.2%).
| Income | Male | Female |
| $2,499 or less | 0 (0.0%) | 9 (10.3%) |
| $2,500 to $4,999 | 3 (2.1%) | 0 (0.0%) |
| $5,000 to $7,499 | 3 (2.1%) | 4 (4.6%) |
| $7,500 to $9,999 | 0 (0.0%) | 0 (0.0%) |
| $10,000 to $12,499 | 16 (11.3%) | 9 (10.3%) |
| $12,500 to $14,999 | 0 (0.0%) | 0 (0.0%) |
| $15,000 to $17,499 | 0 (0.0%) | 0 (0.0%) |
| $17,500 to $19,999 | 0 (0.0%) | 0 (0.0%) |
| $20,000 to $22,499 | 31 (21.8%) | 0 (0.0%) |
| $22,500 to $24,999 | 0 (0.0%) | 0 (0.0%) |
| $25,000 to $29,999 | 0 (0.0%) | 0 (0.0%) |
| $30,000 to $34,999 | 0 (0.0%) | 0 (0.0%) |
| $35,000 to $39,999 | 0 (0.0%) | 0 (0.0%) |
| $40,000 to $44,999 | 0 (0.0%) | 0 (0.0%) |
| $45,000 to $49,999 | 13 (9.1%) | 0 (0.0%) |
| $50,000 to $54,999 | 0 (0.0%) | 0 (0.0%) |
| $55,000 to $64,999 | 0 (0.0%) | 14 (16.1%) |
| $65,000 to $74,999 | 0 (0.0%) | 4 (4.6%) |
| $75,000 to $99,999 | 17 (12.0%) | 12 (13.8%) |
| $100,000+ | 59 (41.5%) | 35 (40.2%) |
| Total | 142 (100.0%) | 87 (100.0%) |
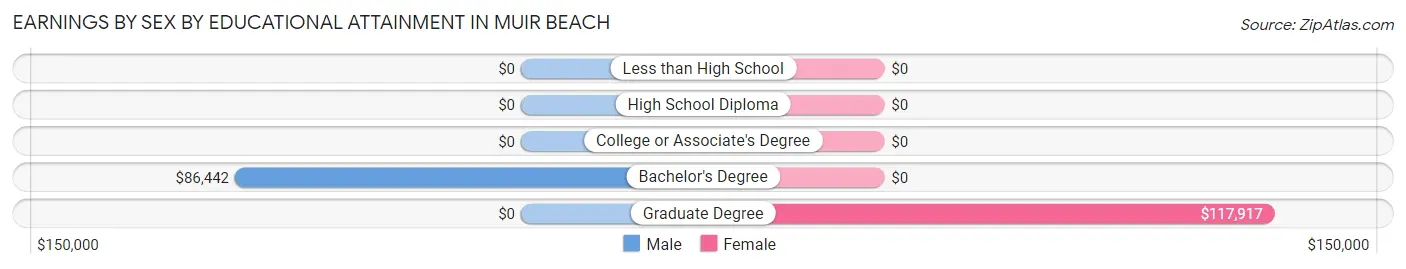
Earnings by Sex by Educational Attainment in Muir Beach
Average earnings in Muir Beach are $90,625 for men and $98,229 for women, a difference of 7.7%. Men with an educational attainment of bachelor's degree enjoy the highest average annual earnings of $86,442, while those with bachelor's degree education earn the least with $86,442. Women with an educational attainment of graduate degree earn the most with the average annual earnings of $117,917, while those with graduate degree education have the smallest earnings of $117,917.
| Educational Attainment | Male Income | Female Income |
| Less than High School | - | - |
| High School Diploma | - | - |
| College or Associate's Degree | - | - |
| Bachelor's Degree | $86,442 | $0 |
| Graduate Degree | - | - |
| Total | $90,625 | $98,229 |
Family Income in Muir Beach
Family Income Brackets in Muir Beach
According to the Muir Beach family income data, there are 56 families falling into the $200,000+ income range, which is the most common income bracket and makes up 55.4% of all families.
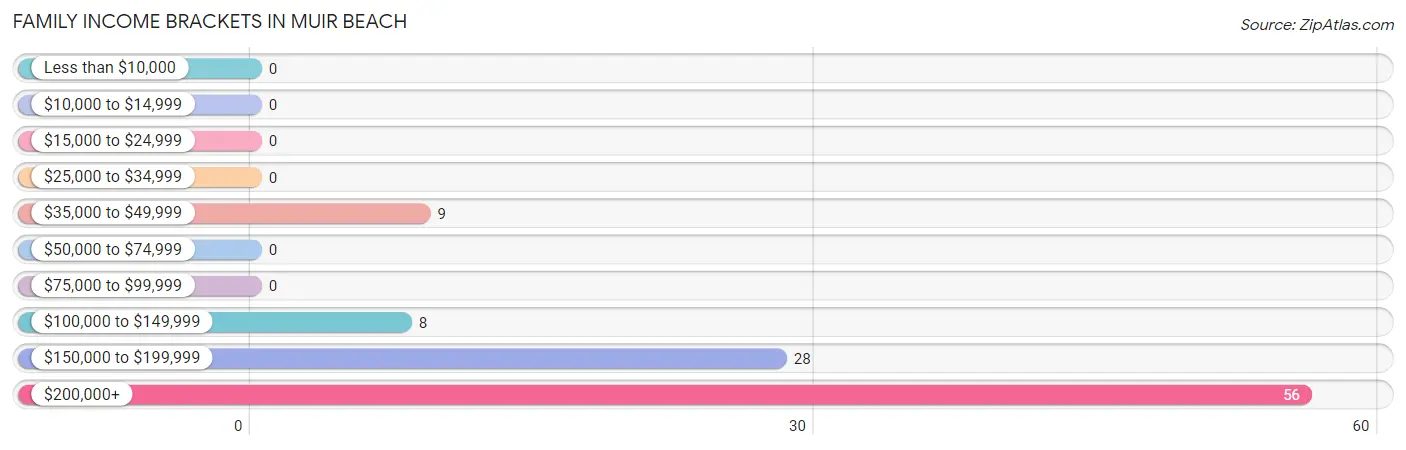
| Income Bracket | # Families | % Families |
| Less than $10,000 | 0 | 0.0% |
| $10,000 to $14,999 | 0 | 0.0% |
| $15,000 to $24,999 | 0 | 0.0% |
| $25,000 to $34,999 | 0 | 0.0% |
| $35,000 to $49,999 | 9 | 8.9% |
| $50,000 to $74,999 | 0 | 0.0% |
| $75,000 to $99,999 | 0 | 0.0% |
| $100,000 to $149,999 | 8 | 7.9% |
| $150,000 to $199,999 | 28 | 27.7% |
| $200,000+ | 56 | 55.4% |
Family Income by Famaliy Size in Muir Beach
2-person families (49 | 48.5%) account for the highest median family income in Muir Beach with $250,001 per family, while 2-person families (49 | 48.5%) have the highest median income of $125,000 per family member.
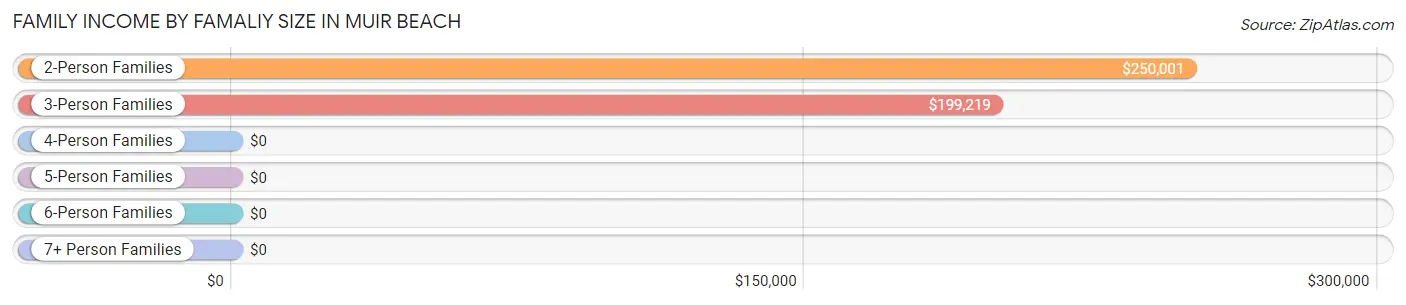
| Income Bracket | # Families | Median Income |
| 2-Person Families | 49 (48.5%) | $250,001 |
| 3-Person Families | 39 (38.6%) | $199,219 |
| 4-Person Families | 13 (12.9%) | $0 |
| 5-Person Families | 0 (0.0%) | $0 |
| 6-Person Families | 0 (0.0%) | $0 |
| 7+ Person Families | 0 (0.0%) | $0 |
| Total | 101 (100.0%) | $228,438 |
Family Income by Number of Earners in Muir Beach
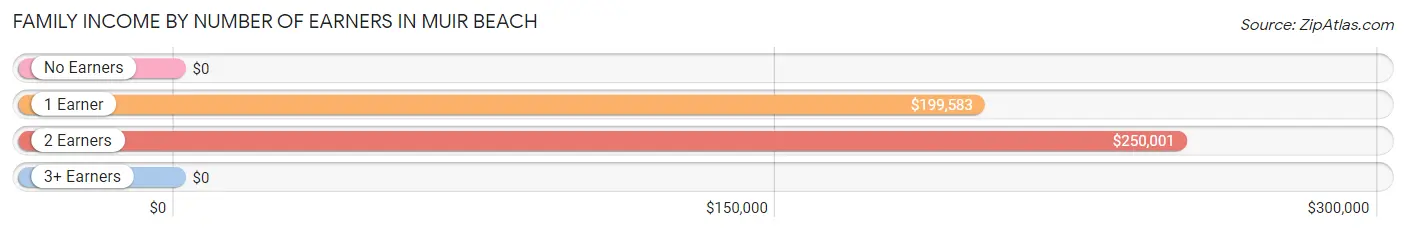
| Number of Earners | # Families | Median Income |
| No Earners | 8 (7.9%) | $0 |
| 1 Earner | 60 (59.4%) | $199,583 |
| 2 Earners | 20 (19.8%) | $250,001 |
| 3+ Earners | 13 (12.9%) | $0 |
| Total | 101 (100.0%) | $228,438 |
Household Income in Muir Beach
Household Income Brackets in Muir Beach
With 68 households falling in the category, the $200,000+ income range is the most frequent in Muir Beach, accounting for 40.0% of all households.
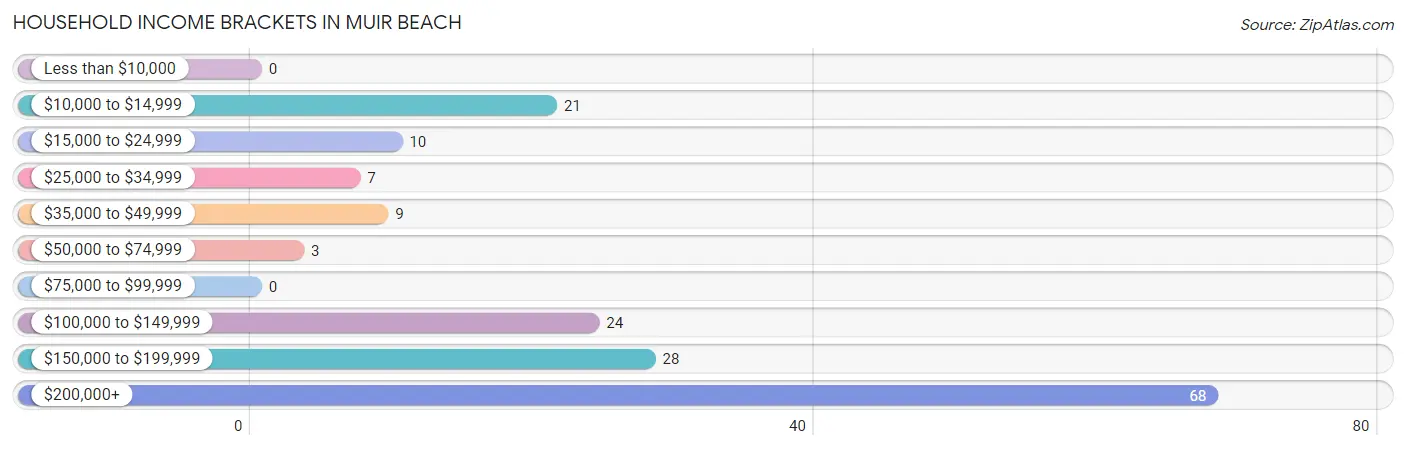
| Income Bracket | # Households | % Households |
| Less than $10,000 | 0 | 0.0% |
| $10,000 to $14,999 | 21 | 12.4% |
| $15,000 to $24,999 | 10 | 5.9% |
| $25,000 to $34,999 | 7 | 4.1% |
| $35,000 to $49,999 | 9 | 5.3% |
| $50,000 to $74,999 | 3 | 1.8% |
| $75,000 to $99,999 | 0 | 0.0% |
| $100,000 to $149,999 | 24 | 14.1% |
| $150,000 to $199,999 | 28 | 16.5% |
| $200,000+ | 68 | 40.0% |
Household Income by Householder Age in Muir Beach
The median household income in Muir Beach is $198,229, with the highest median household income of $205,938 found in the 45 to 64 years age bracket for the primary householder. A total of 71 households (41.8%) fall into this category.
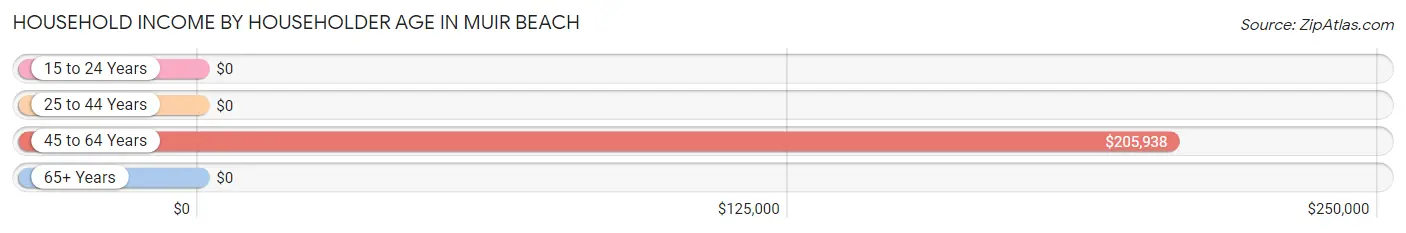
| Income Bracket | # Households | Median Income |
| 15 to 24 Years | 0 (0.0%) | $0 |
| 25 to 44 Years | 28 (16.5%) | $0 |
| 45 to 64 Years | 71 (41.8%) | $205,938 |
| 65+ Years | 71 (41.8%) | $0 |
| Total | 170 (100.0%) | $198,229 |
Poverty in Muir Beach
Income Below Poverty by Sex and Age in Muir Beach
With 8.1% poverty level for males and 16.2% for females among the residents of Muir Beach, 55 to 64 year old males and 25 to 34 year old females are the most vulnerable to poverty, with 16 males (26.7%) and 4 females (100.0%) in their respective age groups living below the poverty level.
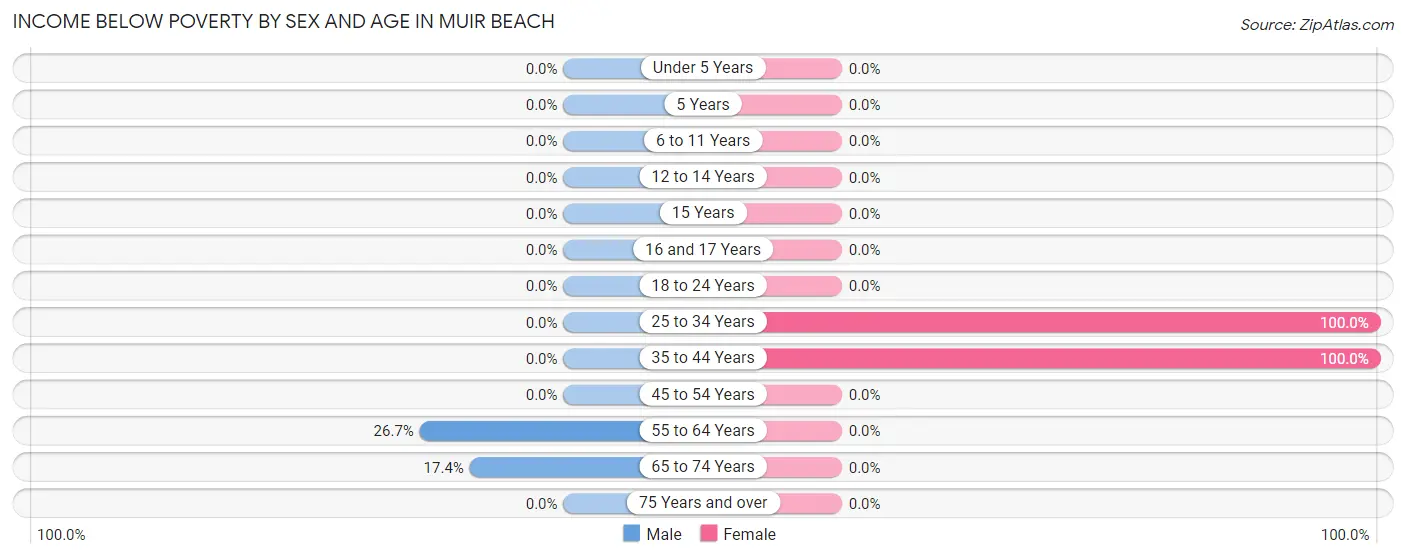
| Age Bracket | Male | Female |
| Under 5 Years | 0 (0.0%) | 0 (0.0%) |
| 5 Years | 0 (0.0%) | 0 (0.0%) |
| 6 to 11 Years | 0 (0.0%) | 0 (0.0%) |
| 12 to 14 Years | 0 (0.0%) | 0 (0.0%) |
| 15 Years | 0 (0.0%) | 0 (0.0%) |
| 16 and 17 Years | 0 (0.0%) | 0 (0.0%) |
| 18 to 24 Years | 0 (0.0%) | 0 (0.0%) |
| 25 to 34 Years | 0 (0.0%) | 4 (100.0%) |
| 35 to 44 Years | 0 (0.0%) | 22 (100.0%) |
| 45 to 54 Years | 0 (0.0%) | 0 (0.0%) |
| 55 to 64 Years | 16 (26.7%) | 0 (0.0%) |
| 65 to 74 Years | 4 (17.4%) | 0 (0.0%) |
| 75 Years and over | 0 (0.0%) | 0 (0.0%) |
| Total | 20 (8.1%) | 26 (16.2%) |
Income Above Poverty by Sex and Age in Muir Beach
According to the poverty statistics in Muir Beach, males aged under 5 years and females aged 15 years are the age groups that are most secure financially, with 100.0% of males and 100.0% of females in these age groups living above the poverty line.
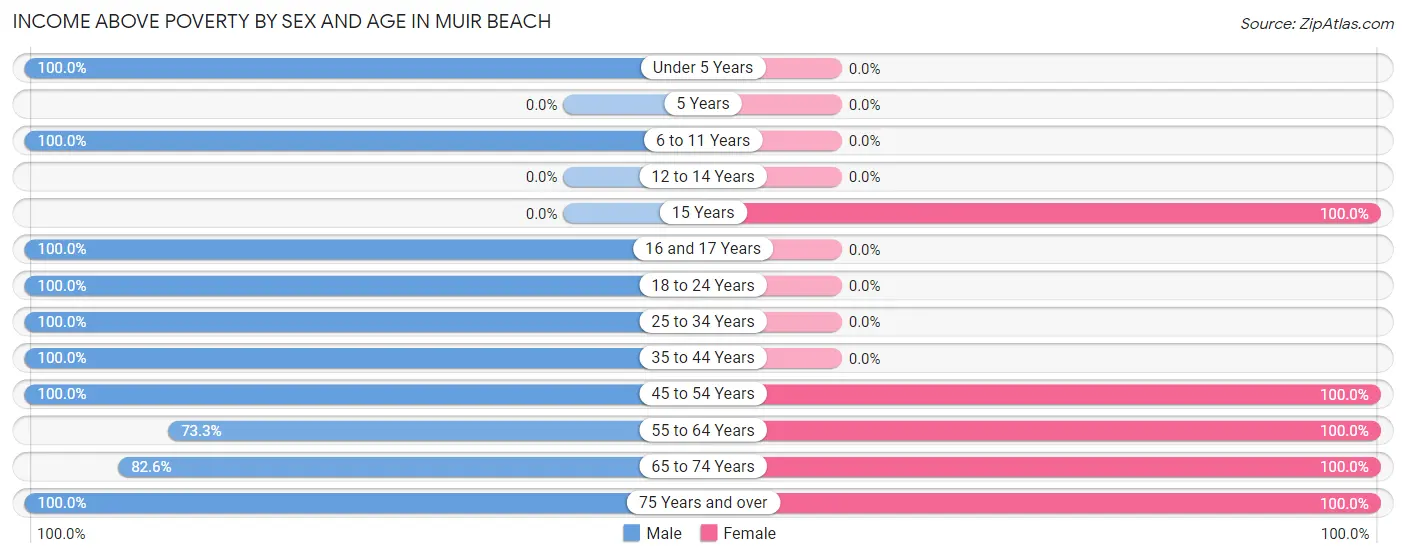
| Age Bracket | Male | Female |
| Under 5 Years | 44 (100.0%) | 0 (0.0%) |
| 5 Years | 0 (0.0%) | 0 (0.0%) |
| 6 to 11 Years | 4 (100.0%) | 0 (0.0%) |
| 12 to 14 Years | 0 (0.0%) | 0 (0.0%) |
| 15 Years | 0 (0.0%) | 12 (100.0%) |
| 16 and 17 Years | 6 (100.0%) | 0 (0.0%) |
| 18 to 24 Years | 23 (100.0%) | 0 (0.0%) |
| 25 to 34 Years | 19 (100.0%) | 0 (0.0%) |
| 35 to 44 Years | 24 (100.0%) | 0 (0.0%) |
| 45 to 54 Years | 13 (100.0%) | 29 (100.0%) |
| 55 to 64 Years | 44 (73.3%) | 31 (100.0%) |
| 65 to 74 Years | 19 (82.6%) | 39 (100.0%) |
| 75 Years and over | 30 (100.0%) | 24 (100.0%) |
| Total | 226 (91.9%) | 135 (83.9%) |
Income Below Poverty Among Married-Couple Families in Muir Beach
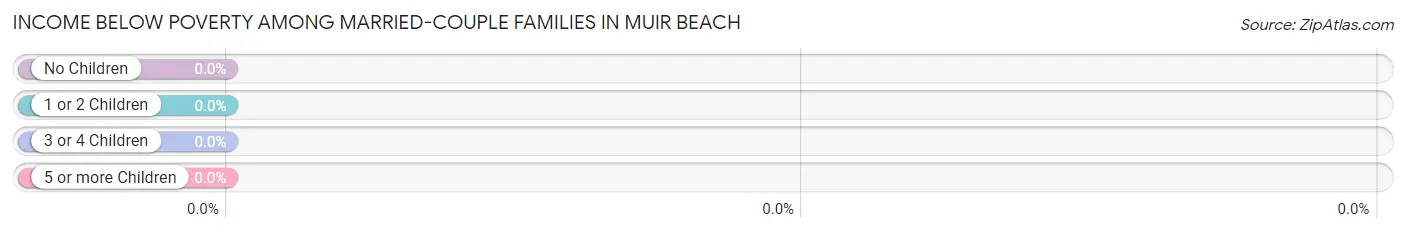
| Children | Above Poverty | Below Poverty |
| No Children | 59 (100.0%) | 0 (0.0%) |
| 1 or 2 Children | 18 (100.0%) | 0 (0.0%) |
| 3 or 4 Children | 0 (0.0%) | 0 (0.0%) |
| 5 or more Children | 0 (0.0%) | 0 (0.0%) |
| Total | 77 (100.0%) | 0 (0.0%) |
Income Below Poverty Among Single-Parent Households in Muir Beach
| Children | Single Father | Single Mother |
| No Children | 0 (0.0%) | 0 (0.0%) |
| 1 or 2 Children | 0 (0.0%) | 0 (0.0%) |
| 3 or 4 Children | 0 (0.0%) | 0 (0.0%) |
| 5 or more Children | 0 (0.0%) | 0 (0.0%) |
| Total | 0 (0.0%) | 0 (0.0%) |
Income Below Poverty Among Married-Couple vs Single-Parent Households in Muir Beach
| Children | Married-Couple Families | Single-Parent Households |
| No Children | 0 (0.0%) | 0 (0.0%) |
| 1 or 2 Children | 0 (0.0%) | 0 (0.0%) |
| 3 or 4 Children | 0 (0.0%) | 0 (0.0%) |
| 5 or more Children | 0 (0.0%) | 0 (0.0%) |
| Total | 0 (0.0%) | 0 (0.0%) |
Race in Muir Beach
The most populous races in Muir Beach are White / Caucasian (385 | 94.6%), Two or more Races (22 | 5.4%), and Hispanic or Latino (17 | 4.2%).
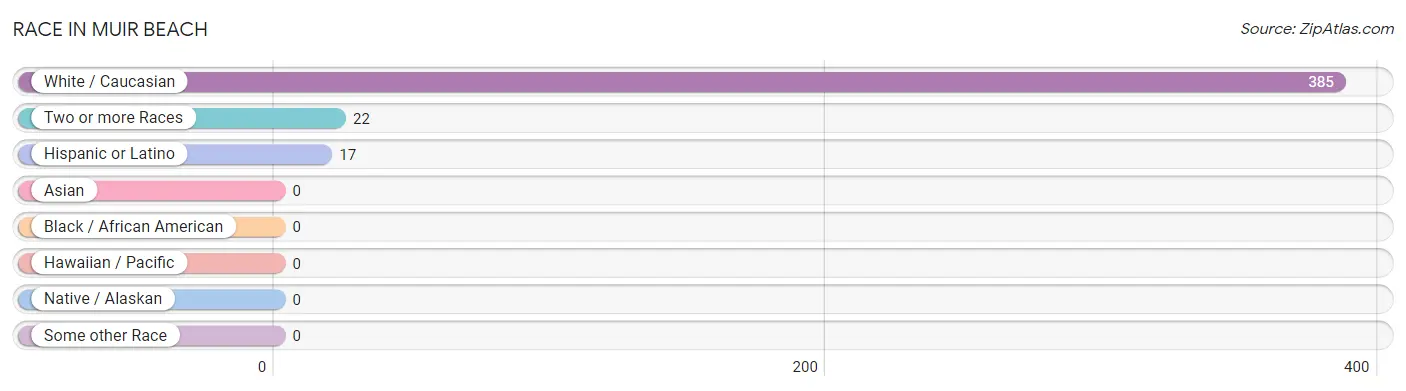
| Race | # Population | % Population |
| Asian | 0 | 0.0% |
| Black / African American | 0 | 0.0% |
| Hawaiian / Pacific | 0 | 0.0% |
| Hispanic or Latino | 17 | 4.2% |
| Native / Alaskan | 0 | 0.0% |
| White / Caucasian | 385 | 94.6% |
| Two or more Races | 22 | 5.4% |
| Some other Race | 0 | 0.0% |
| Total | 407 | 100.0% |
Ancestry in Muir Beach
The most populous ancestries reported in Muir Beach are Russian (83 | 20.4%), Austrian (66 | 16.2%), Irish (58 | 14.2%), English (49 | 12.0%), and German (46 | 11.3%), together accounting for 74.2% of all Muir Beach residents.
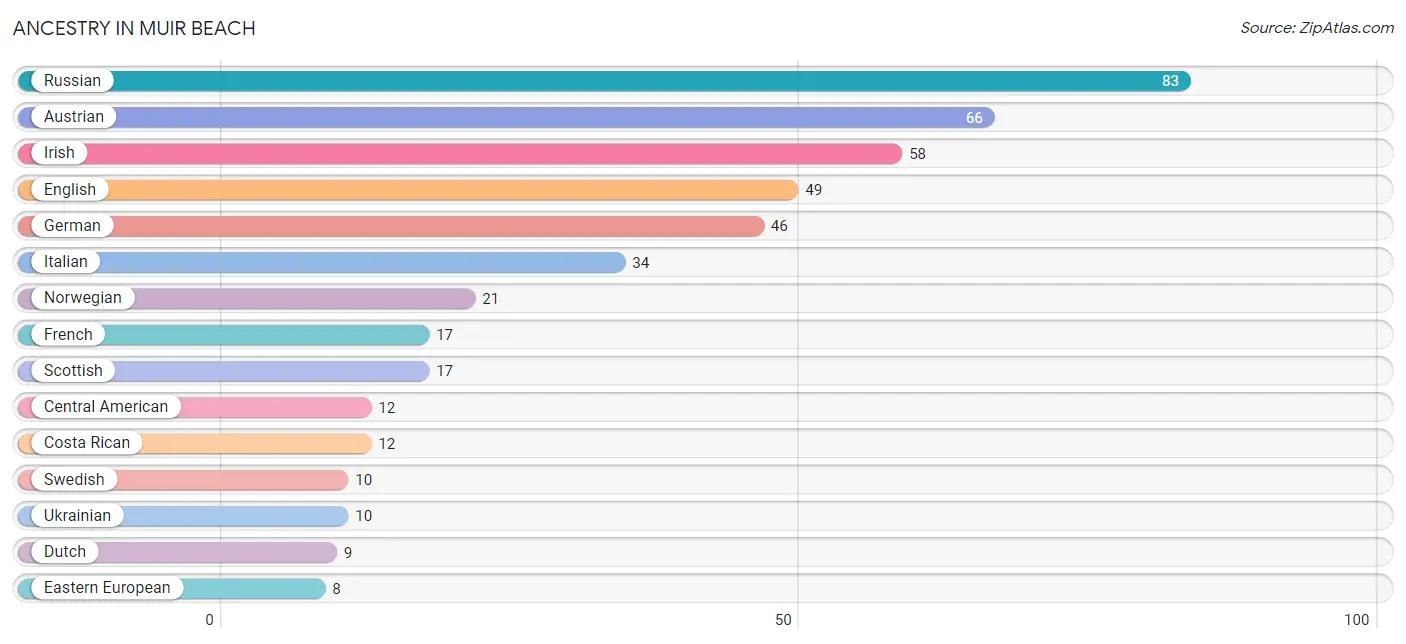
| Ancestry | # Population | % Population |
| Austrian | 66 | 16.2% |
| British | 3 | 0.7% |
| Central American | 12 | 2.9% |
| Costa Rican | 12 | 2.9% |
| Danish | 6 | 1.5% |
| Dutch | 9 | 2.2% |
| Eastern European | 8 | 2.0% |
| English | 49 | 12.0% |
| Finnish | 6 | 1.5% |
| French | 17 | 4.2% |
| German | 46 | 11.3% |
| Irish | 58 | 14.2% |
| Italian | 34 | 8.4% |
| Norwegian | 21 | 5.2% |
| Portuguese | 7 | 1.7% |
| Russian | 83 | 20.4% |
| Scottish | 17 | 4.2% |
| Swedish | 10 | 2.5% |
| Ukrainian | 10 | 2.5% | View All 19 Rows |
Immigrants in Muir Beach
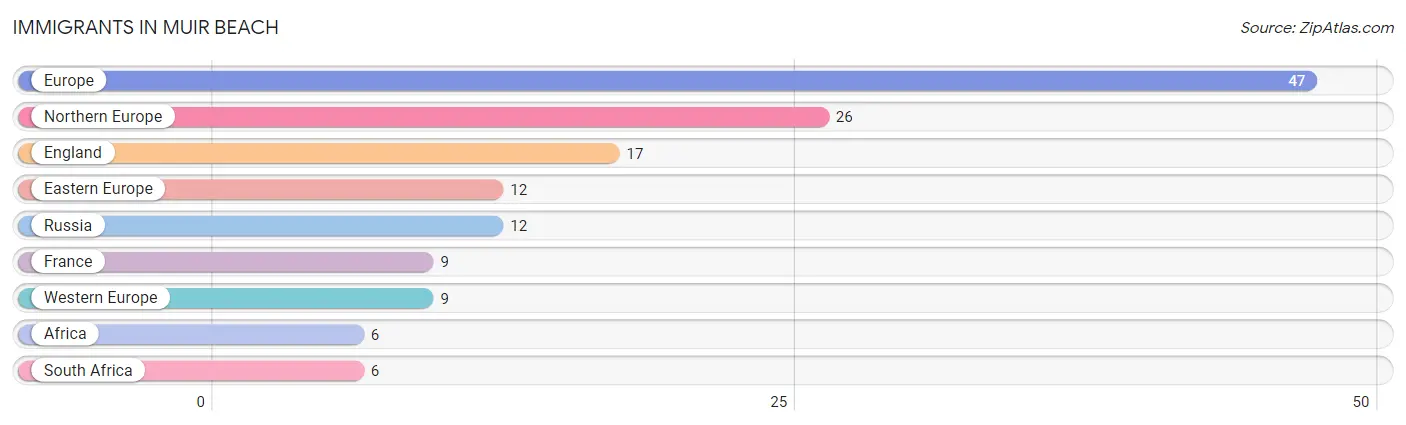
The most numerous immigrant groups reported in Muir Beach came from Europe (47 | 11.6%), Northern Europe (26 | 6.4%), England (17 | 4.2%), Eastern Europe (12 | 2.9%), and Russia (12 | 2.9%), together accounting for 28.0% of all Muir Beach residents.
| Immigration Origin | # Population | % Population |
| Africa | 6 | 1.5% |
| Eastern Europe | 12 | 2.9% |
| England | 17 | 4.2% |
| Europe | 47 | 11.6% |
| France | 9 | 2.2% |
| Northern Europe | 26 | 6.4% |
| Russia | 12 | 2.9% |
| South Africa | 6 | 1.5% |
| Western Europe | 9 | 2.2% | View All 9 Rows |
Sex and Age in Muir Beach
Sex and Age in Muir Beach
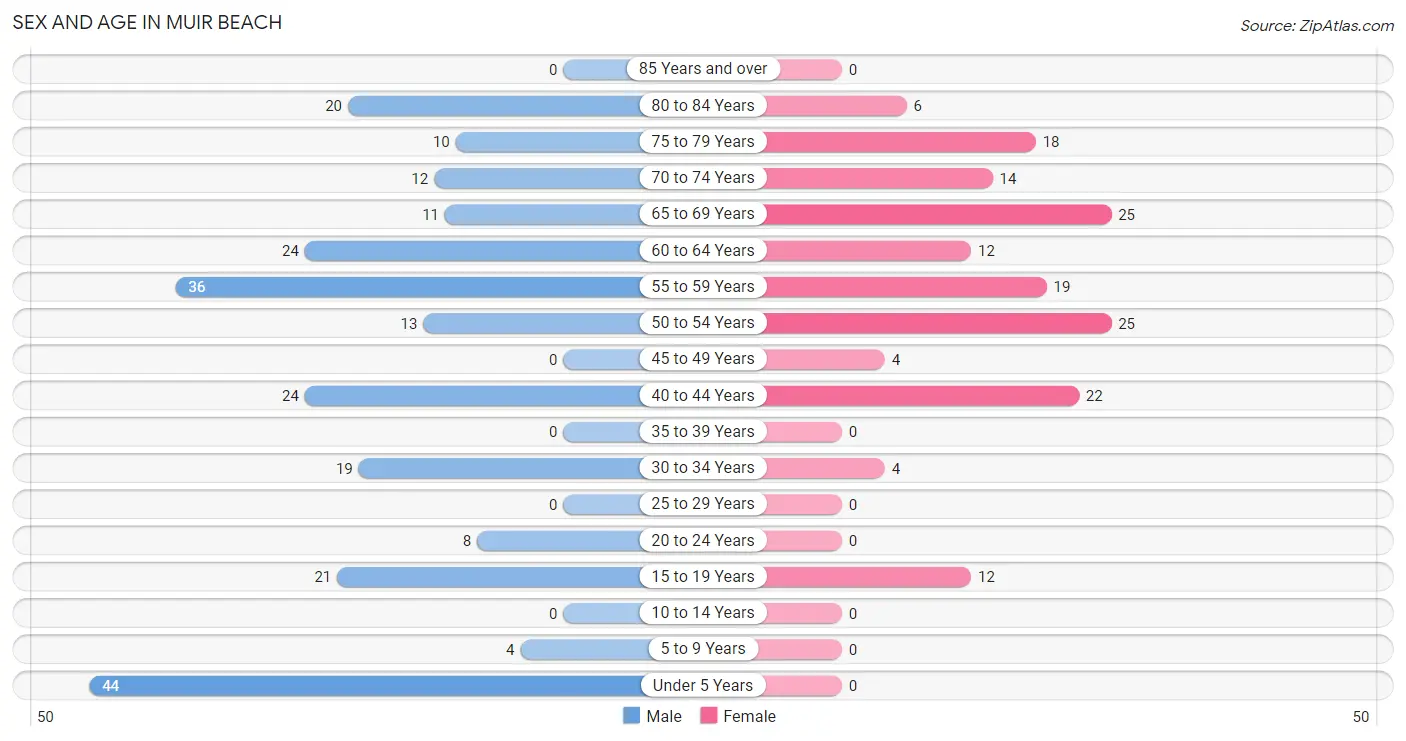
The most populous age groups in Muir Beach are Under 5 Years (44 | 17.9%) for men and 50 to 54 Years (25 | 15.5%) for women.
| Age Bracket | Male | Female |
| Under 5 Years | 44 (17.9%) | 0 (0.0%) |
| 5 to 9 Years | 4 (1.6%) | 0 (0.0%) |
| 10 to 14 Years | 0 (0.0%) | 0 (0.0%) |
| 15 to 19 Years | 21 (8.5%) | 12 (7.4%) |
| 20 to 24 Years | 8 (3.3%) | 0 (0.0%) |
| 25 to 29 Years | 0 (0.0%) | 0 (0.0%) |
| 30 to 34 Years | 19 (7.7%) | 4 (2.5%) |
| 35 to 39 Years | 0 (0.0%) | 0 (0.0%) |
| 40 to 44 Years | 24 (9.8%) | 22 (13.7%) |
| 45 to 49 Years | 0 (0.0%) | 4 (2.5%) |
| 50 to 54 Years | 13 (5.3%) | 25 (15.5%) |
| 55 to 59 Years | 36 (14.6%) | 19 (11.8%) |
| 60 to 64 Years | 24 (9.8%) | 12 (7.4%) |
| 65 to 69 Years | 11 (4.5%) | 25 (15.5%) |
| 70 to 74 Years | 12 (4.9%) | 14 (8.7%) |
| 75 to 79 Years | 10 (4.1%) | 18 (11.2%) |
| 80 to 84 Years | 20 (8.1%) | 6 (3.7%) |
| 85 Years and over | 0 (0.0%) | 0 (0.0%) |
| Total | 246 (100.0%) | 161 (100.0%) |
Families and Households in Muir Beach
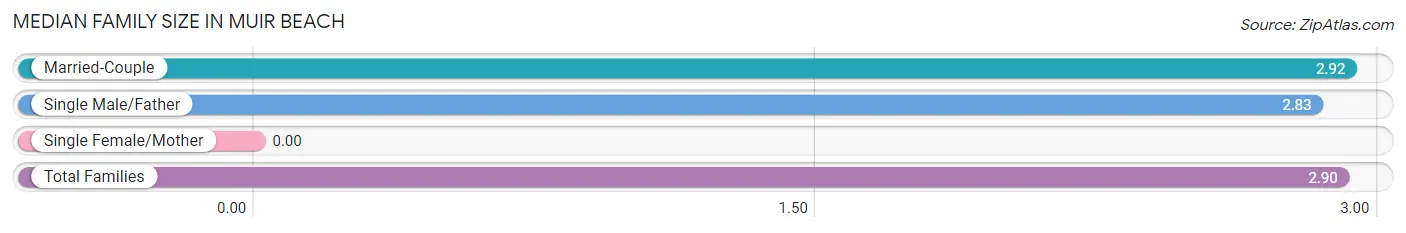
Median Family Size in Muir Beach
| Family Type | # Families | Family Size |
| Married-Couple | 77 (76.2%) | 2.92 |
| Single Male/Father | 24 (23.8%) | 2.83 |
| Single Female/Mother | 0 (0.0%) | - |
| Total Families | 101 (100.0%) | 2.90 |
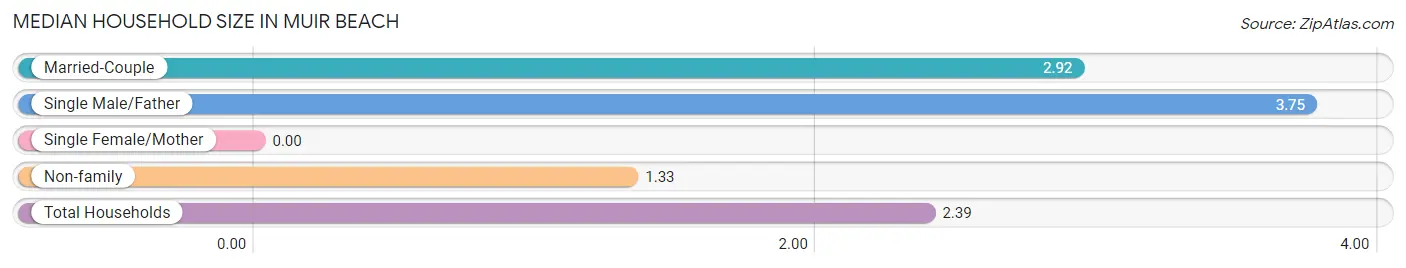
Median Household Size in Muir Beach
| Household Type | # Households | Household Size |
| Married-Couple | 77 (45.3%) | 2.92 |
| Single Male/Father | 24 (14.1%) | 3.75 |
| Single Female/Mother | 0 (0.0%) | - |
| Non-family | 69 (40.6%) | 1.33 |
| Total Households | 170 (100.0%) | 2.39 |
Household Size by Marriage Status in Muir Beach
Out of a total of 170 households in Muir Beach, 101 (59.4%) are family households, while 69 (40.6%) are nonfamily households. The most numerous type of family households are 2-person households, comprising 49, and the most common type of nonfamily households are 1-person households, comprising 50.
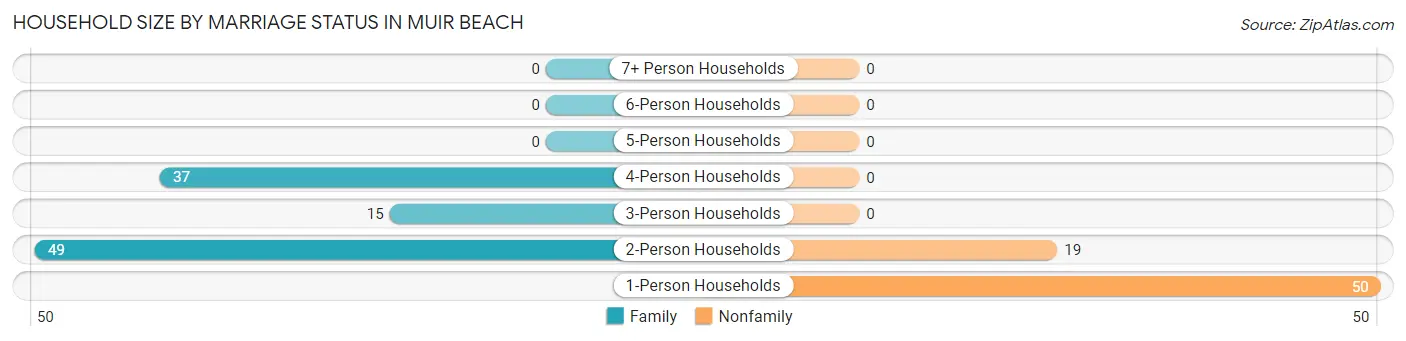
| Household Size | Family Households | Nonfamily Households |
| 1-Person Households | - | 50 (29.4%) |
| 2-Person Households | 49 (28.8%) | 19 (11.2%) |
| 3-Person Households | 15 (8.8%) | 0 (0.0%) |
| 4-Person Households | 37 (21.8%) | 0 (0.0%) |
| 5-Person Households | 0 (0.0%) | 0 (0.0%) |
| 6-Person Households | 0 (0.0%) | 0 (0.0%) |
| 7+ Person Households | 0 (0.0%) | 0 (0.0%) |
| Total | 101 (59.4%) | 69 (40.6%) |
Female Fertility in Muir Beach
Fertility by Age in Muir Beach
Average fertility rate in Muir Beach is 431.0 births per 1,000 women. Women in the age bracket of 35 to 50 years have the highest fertility rate with 629.0 births per 1,000 women. Women in the age bracket of 35 to 50 years acount for 100.0% of all women with births.
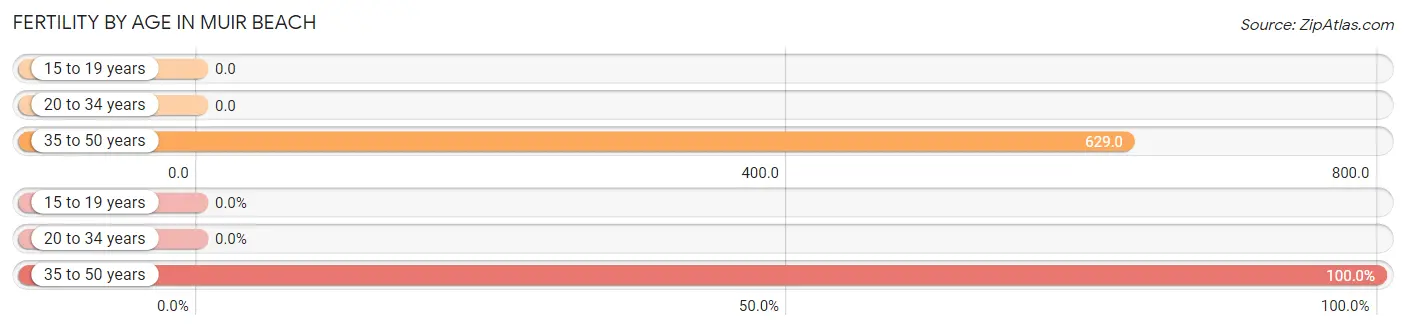
| Age Bracket | Women with Births | Births / 1,000 Women |
| 15 to 19 years | 0 (0.0%) | 0.0 |
| 20 to 34 years | 0 (0.0%) | 0.0 |
| 35 to 50 years | 22 (100.0%) | 629.0 |
| Total | 22 (100.0%) | 431.0 |
Fertility by Age by Marriage Status in Muir Beach
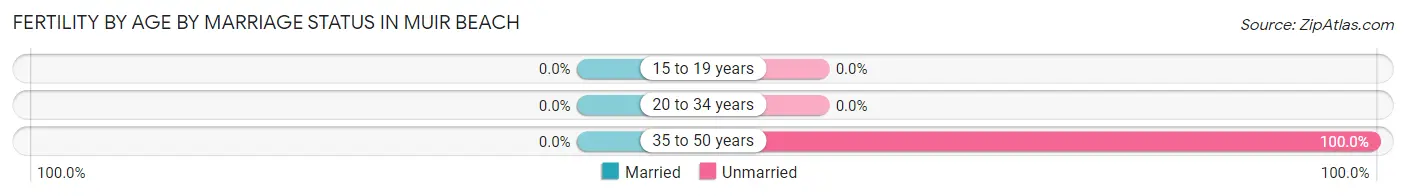
| Age Bracket | Married | Unmarried |
| 15 to 19 years | 0 (0.0%) | 0 (0.0%) |
| 20 to 34 years | 0 (0.0%) | 0 (0.0%) |
| 35 to 50 years | 0 (0.0%) | 22 (100.0%) |
| Total | 0 (0.0%) | 22 (100.0%) |
Fertility by Education in Muir Beach
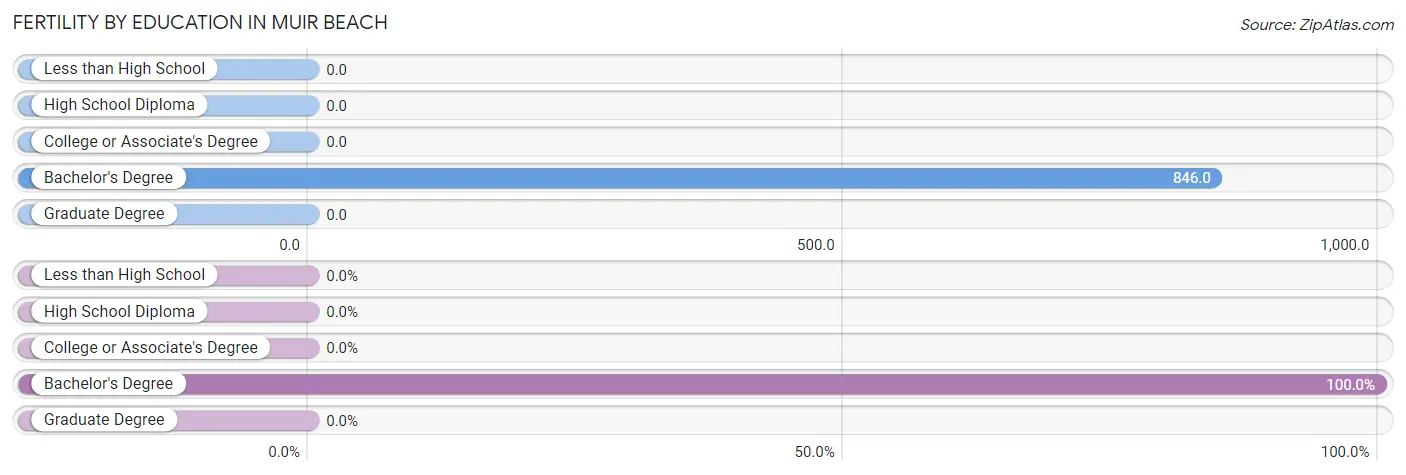
| Educational Attainment | Women with Births | Births / 1,000 Women |
| Less than High School | 0 (0.0%) | 0.0 |
| High School Diploma | 0 (0.0%) | 0.0 |
| College or Associate's Degree | 0 (0.0%) | 0.0 |
| Bachelor's Degree | 22 (100.0%) | 846.0 |
| Graduate Degree | 0 (0.0%) | 0.0 |
| Total | 22 (100.0%) | 431.0 |
Fertility by Education by Marriage Status in Muir Beach
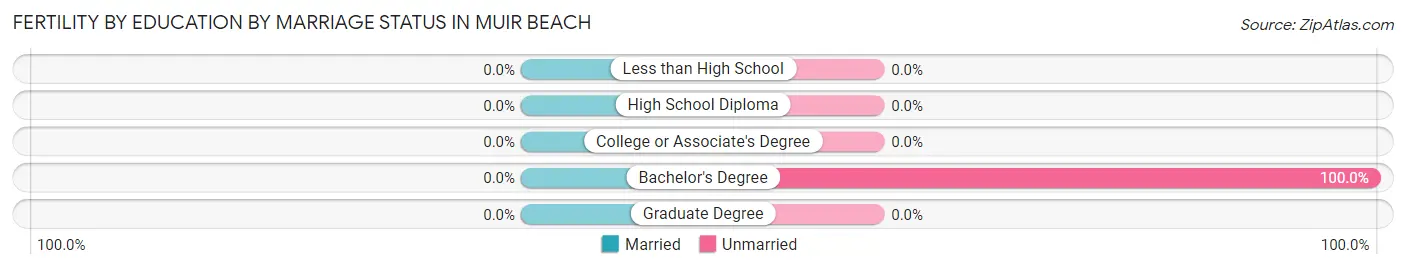
| Educational Attainment | Married | Unmarried |
| Less than High School | 0 (0.0%) | 0 (0.0%) |
| High School Diploma | 0 (0.0%) | 0 (0.0%) |
| College or Associate's Degree | 0 (0.0%) | 0 (0.0%) |
| Bachelor's Degree | 0 (0.0%) | 22 (100.0%) |
| Graduate Degree | 0 (0.0%) | 0 (0.0%) |
| Total | 0 (0.0%) | 22 (100.0%) |
Employment Characteristics in Muir Beach
Employment by Class of Employer in Muir Beach
Among the 196 employed individuals in Muir Beach, private company employees (83 | 42.3%), self-employed (incorporated) (50 | 25.5%), and not-for-profit organizations (46 | 23.5%) make up the most common classes of employment.
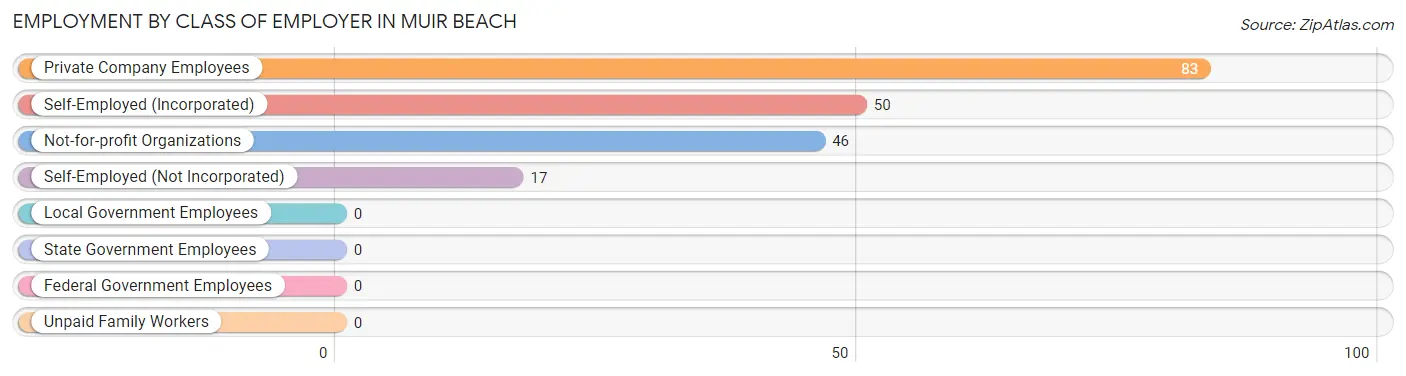
| Employer Class | # Employees | % Employees |
| Private Company Employees | 83 | 42.3% |
| Self-Employed (Incorporated) | 50 | 25.5% |
| Self-Employed (Not Incorporated) | 17 | 8.7% |
| Not-for-profit Organizations | 46 | 23.5% |
| Local Government Employees | 0 | 0.0% |
| State Government Employees | 0 | 0.0% |
| Federal Government Employees | 0 | 0.0% |
| Unpaid Family Workers | 0 | 0.0% |
| Total | 196 | 100.0% |
Employment Status by Age in Muir Beach
According to the labor force statistics for Muir Beach, out of the total population over 16 years of age (347), 61.1% or 212 individuals are in the labor force, with 7.5% or 16 of them unemployed. The age group with the highest labor force participation rate is 55 to 59 years, with 100.0% or 55 individuals in the labor force. Within the labor force, the 30 to 34 years age range has the highest percentage of unemployed individuals, with 68.4% or 13 of them being unemployed.
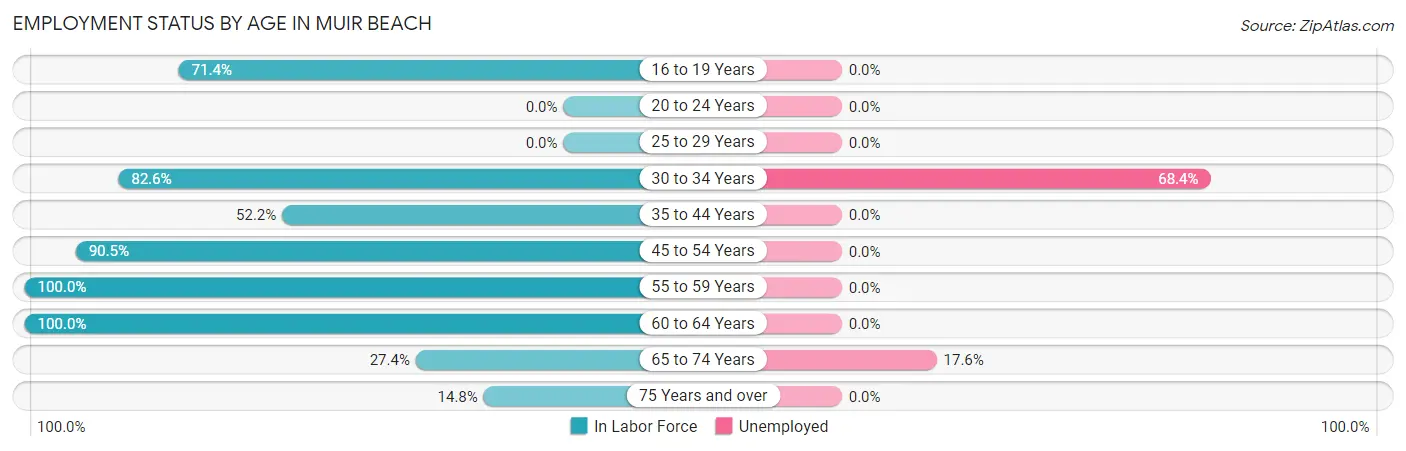
| Age Bracket | In Labor Force | Unemployed |
| 16 to 19 Years | 15 (71.4%) | 0 (0.0%) |
| 20 to 24 Years | 0 (0.0%) | 0 (0.0%) |
| 25 to 29 Years | 0 (0.0%) | 0 (0.0%) |
| 30 to 34 Years | 19 (82.6%) | 13 (68.4%) |
| 35 to 44 Years | 24 (52.2%) | 0 (0.0%) |
| 45 to 54 Years | 38 (90.5%) | 0 (0.0%) |
| 55 to 59 Years | 55 (100.0%) | 0 (0.0%) |
| 60 to 64 Years | 36 (100.0%) | 0 (0.0%) |
| 65 to 74 Years | 17 (27.4%) | 3 (17.6%) |
| 75 Years and over | 8 (14.8%) | 0 (0.0%) |
| Total | 212 (61.1%) | 16 (7.5%) |
Employment Status by Educational Attainment in Muir Beach
According to labor force statistics for Muir Beach, 85.1% of individuals (172) out of the total population between 25 and 64 years of age (202) are in the labor force, with 7.6% or 13 of them being unemployed. The group with the highest labor force participation rate are those with the educational attainment of college / associate degree, with 100.0% or 24 individuals in the labor force. Within the labor force, individuals with bachelor's degree or higher education have the highest percentage of unemployment, with 8.8% or 13 of them being unemployed.
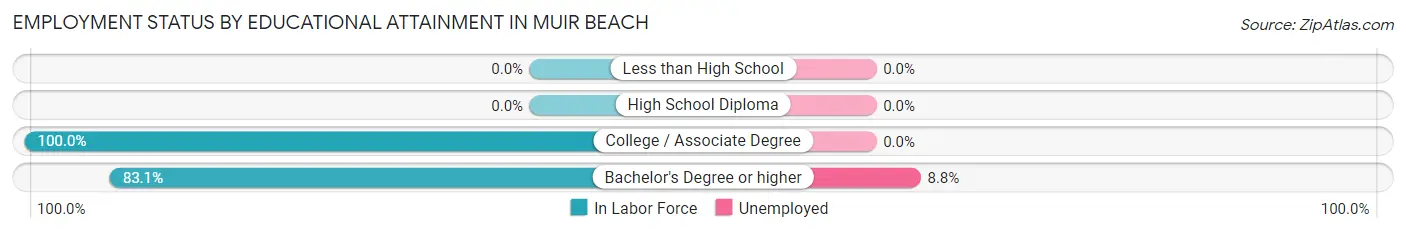
| Educational Attainment | In Labor Force | Unemployed |
| Less than High School | 0 (0.0%) | 0 (0.0%) |
| High School Diploma | 0 (0.0%) | 0 (0.0%) |
| College / Associate Degree | 24 (100.0%) | 0 (0.0%) |
| Bachelor's Degree or higher | 148 (83.1%) | 16 (8.8%) |
| Total | 172 (85.1%) | 15 (7.6%) |
Employment Occupations by Sex in Muir Beach
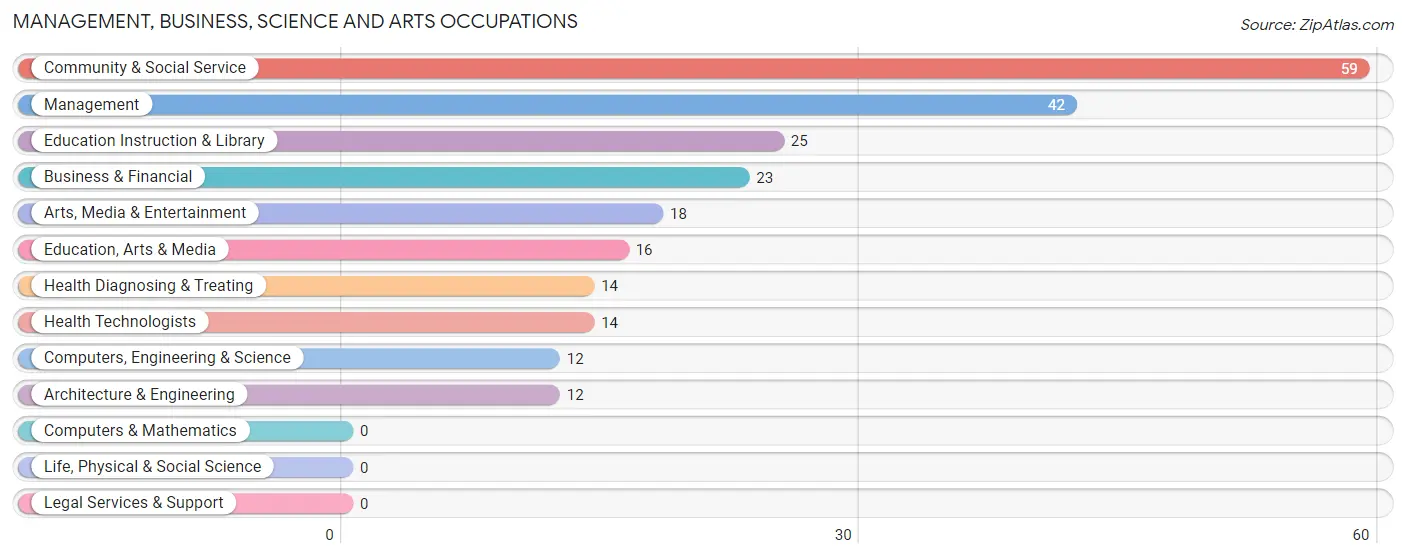
Management, Business, Science and Arts Occupations
The most common Management, Business, Science and Arts occupations in Muir Beach are Community & Social Service (59 | 30.1%), Management (42 | 21.4%), Education Instruction & Library (25 | 12.8%), Business & Financial (23 | 11.7%), and Arts, Media & Entertainment (18 | 9.2%).
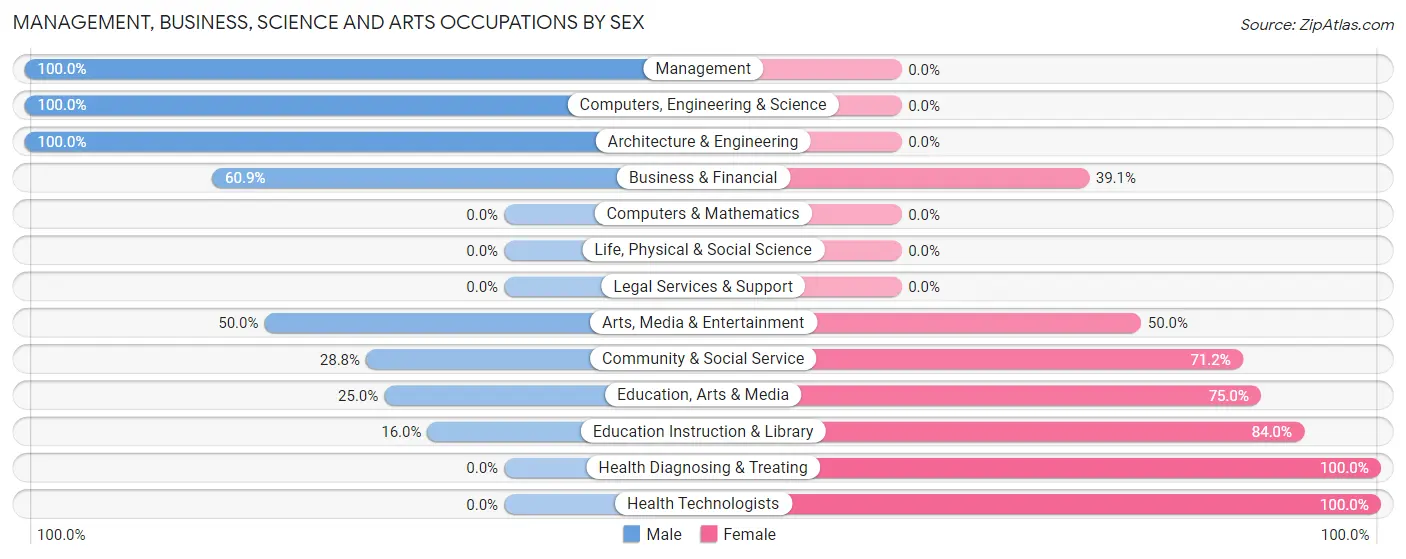
Management, Business, Science and Arts Occupations by Sex
Within the Management, Business, Science and Arts occupations in Muir Beach, the most male-oriented occupations are Management (100.0%), Computers, Engineering & Science (100.0%), and Architecture & Engineering (100.0%), while the most female-oriented occupations are Health Diagnosing & Treating (100.0%), Health Technologists (100.0%), and Education Instruction & Library (84.0%).
| Occupation | Male | Female |
| Management | 42 (100.0%) | 0 (0.0%) |
| Business & Financial | 14 (60.9%) | 9 (39.1%) |
| Computers, Engineering & Science | 12 (100.0%) | 0 (0.0%) |
| Computers & Mathematics | 0 (0.0%) | 0 (0.0%) |
| Architecture & Engineering | 12 (100.0%) | 0 (0.0%) |
| Life, Physical & Social Science | 0 (0.0%) | 0 (0.0%) |
| Community & Social Service | 17 (28.8%) | 42 (71.2%) |
| Education, Arts & Media | 4 (25.0%) | 12 (75.0%) |
| Legal Services & Support | 0 (0.0%) | 0 (0.0%) |
| Education Instruction & Library | 4 (16.0%) | 21 (84.0%) |
| Arts, Media & Entertainment | 9 (50.0%) | 9 (50.0%) |
| Health Diagnosing & Treating | 0 (0.0%) | 14 (100.0%) |
| Health Technologists | 0 (0.0%) | 14 (100.0%) |
| Total (Category) | 85 (56.7%) | 65 (43.3%) |
| Total (Overall) | 122 (62.2%) | 74 (37.8%) |
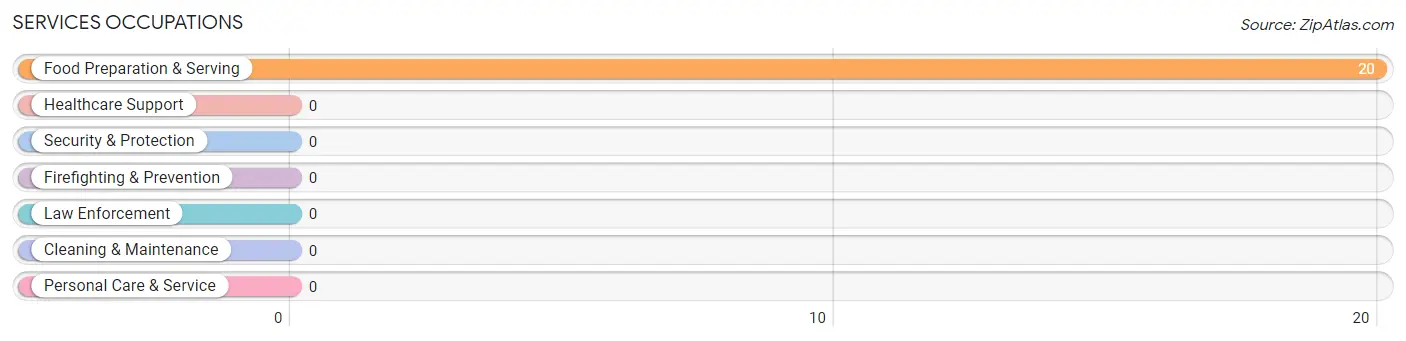
Services Occupations
The most common Services occupations in Muir Beach are , and Food Preparation & Serving (20 | 10.2%).
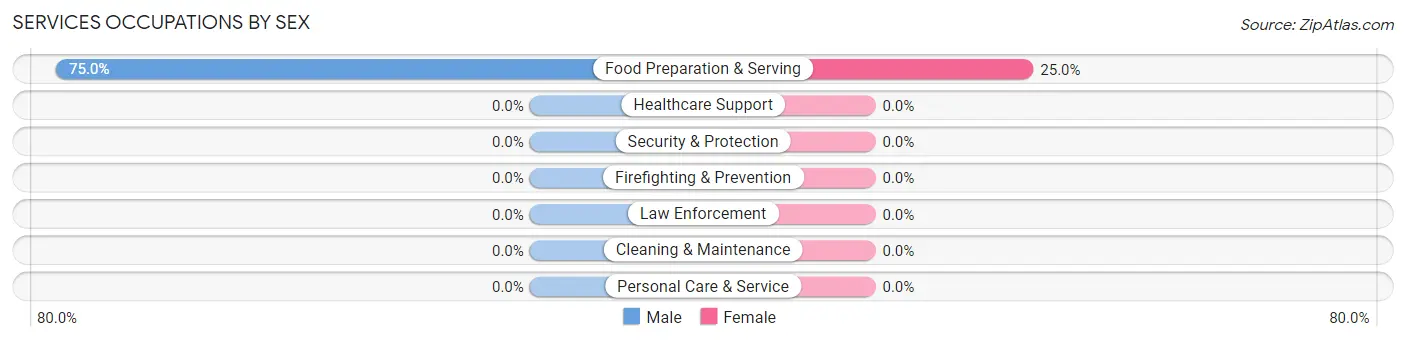
Services Occupations by Sex
| Occupation | Male | Female |
| Healthcare Support | 0 (0.0%) | 0 (0.0%) |
| Security & Protection | 0 (0.0%) | 0 (0.0%) |
| Firefighting & Prevention | 0 (0.0%) | 0 (0.0%) |
| Law Enforcement | 0 (0.0%) | 0 (0.0%) |
| Food Preparation & Serving | 15 (75.0%) | 5 (25.0%) |
| Cleaning & Maintenance | 0 (0.0%) | 0 (0.0%) |
| Personal Care & Service | 0 (0.0%) | 0 (0.0%) |
| Total (Category) | 15 (75.0%) | 5 (25.0%) |
| Total (Overall) | 122 (62.2%) | 74 (37.8%) |
Sales and Office Occupations
The most common Sales and Office occupations in Muir Beach are , and Office & Administration (13 | 6.6%).
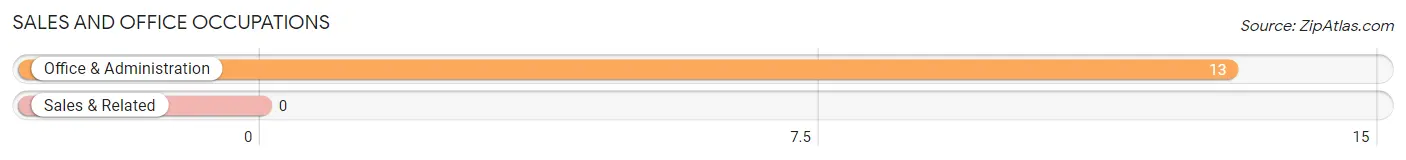
Sales and Office Occupations by Sex

| Occupation | Male | Female |
| Sales & Related | 0 (0.0%) | 0 (0.0%) |
| Office & Administration | 13 (100.0%) | 0 (0.0%) |
| Total (Category) | 13 (100.0%) | 0 (0.0%) |
| Total (Overall) | 122 (62.2%) | 74 (37.8%) |
Natural Resources, Construction and Maintenance Occupations
The most common Natural Resources, Construction and Maintenance occupations in Muir Beach are , and Construction & Extraction (13 | 6.6%).
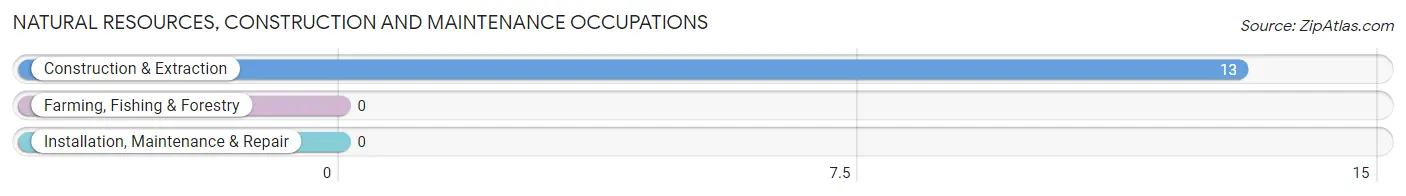
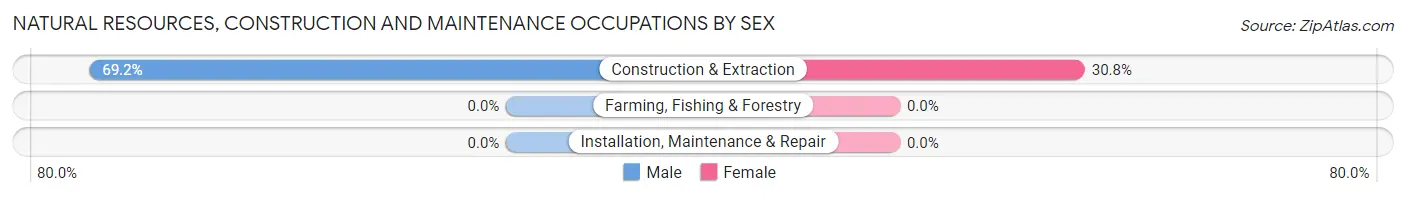
Natural Resources, Construction and Maintenance Occupations by Sex
| Occupation | Male | Female |
| Farming, Fishing & Forestry | 0 (0.0%) | 0 (0.0%) |
| Construction & Extraction | 9 (69.2%) | 4 (30.8%) |
| Installation, Maintenance & Repair | 0 (0.0%) | 0 (0.0%) |
| Total (Category) | 9 (69.2%) | 4 (30.8%) |
| Total (Overall) | 122 (62.2%) | 74 (37.8%) |
Production, Transportation and Moving Occupations
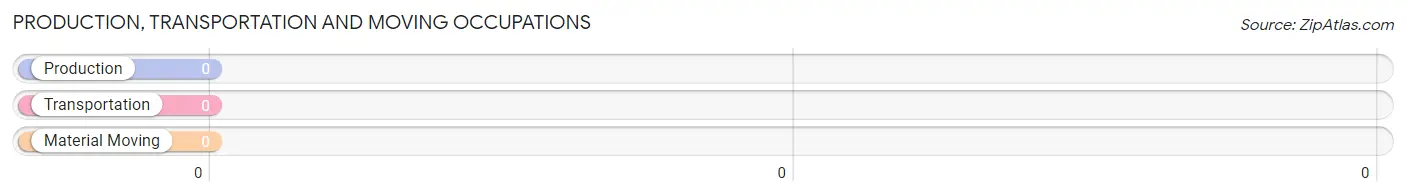
Production, Transportation and Moving Occupations by Sex
| Occupation | Male | Female |
| Production | 0 (0.0%) | 0 (0.0%) |
| Transportation | 0 (0.0%) | 0 (0.0%) |
| Material Moving | 0 (0.0%) | 0 (0.0%) |
| Total (Category) | 0 (0.0%) | 0 (0.0%) |
| Total (Overall) | 122 (62.2%) | 74 (37.8%) |
Employment Industries by Sex in Muir Beach
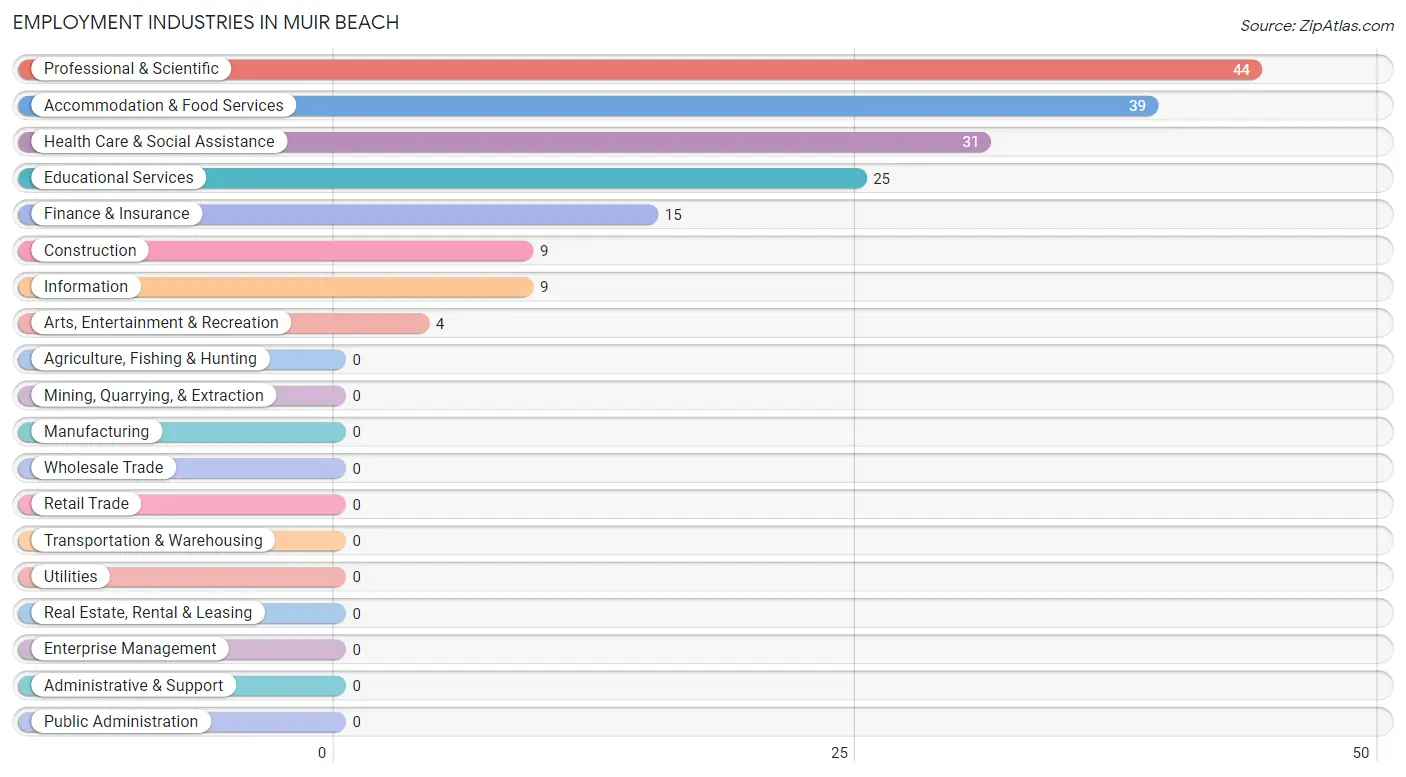
Employment Industries in Muir Beach
The major employment industries in Muir Beach include Professional & Scientific (44 | 22.5%), Accommodation & Food Services (39 | 19.9%), Health Care & Social Assistance (31 | 15.8%), Educational Services (25 | 12.8%), and Finance & Insurance (15 | 7.6%).
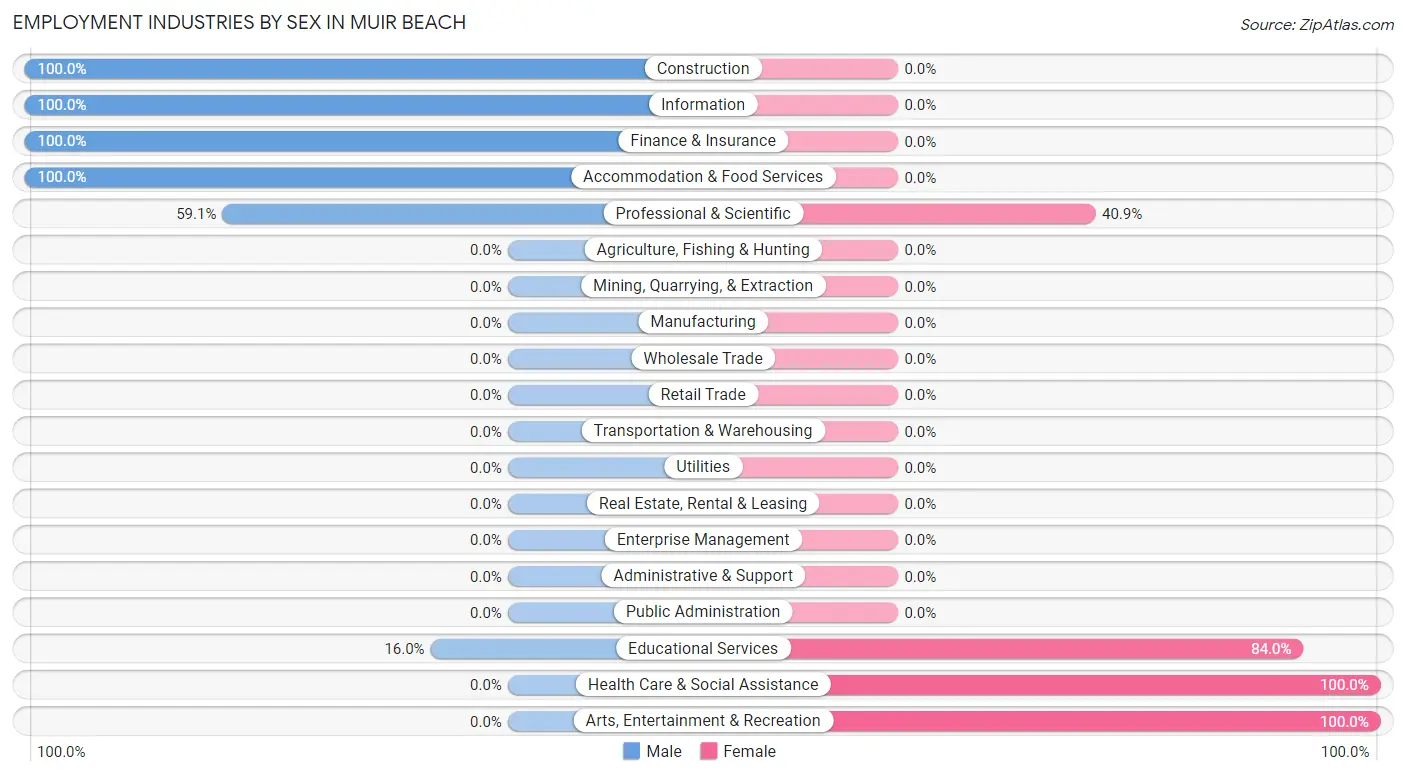
Employment Industries by Sex in Muir Beach
The Muir Beach industries that see more men than women are Construction (100.0%), Information (100.0%), and Finance & Insurance (100.0%), whereas the industries that tend to have a higher number of women are Health Care & Social Assistance (100.0%), Arts, Entertainment & Recreation (100.0%), and Educational Services (84.0%).
| Industry | Male | Female |
| Agriculture, Fishing & Hunting | 0 (0.0%) | 0 (0.0%) |
| Mining, Quarrying, & Extraction | 0 (0.0%) | 0 (0.0%) |
| Construction | 9 (100.0%) | 0 (0.0%) |
| Manufacturing | 0 (0.0%) | 0 (0.0%) |
| Wholesale Trade | 0 (0.0%) | 0 (0.0%) |
| Retail Trade | 0 (0.0%) | 0 (0.0%) |
| Transportation & Warehousing | 0 (0.0%) | 0 (0.0%) |
| Utilities | 0 (0.0%) | 0 (0.0%) |
| Information | 9 (100.0%) | 0 (0.0%) |
| Finance & Insurance | 15 (100.0%) | 0 (0.0%) |
| Real Estate, Rental & Leasing | 0 (0.0%) | 0 (0.0%) |
| Professional & Scientific | 26 (59.1%) | 18 (40.9%) |
| Enterprise Management | 0 (0.0%) | 0 (0.0%) |
| Administrative & Support | 0 (0.0%) | 0 (0.0%) |
| Educational Services | 4 (16.0%) | 21 (84.0%) |
| Health Care & Social Assistance | 0 (0.0%) | 31 (100.0%) |
| Arts, Entertainment & Recreation | 0 (0.0%) | 4 (100.0%) |
| Accommodation & Food Services | 39 (100.0%) | 0 (0.0%) |
| Public Administration | 0 (0.0%) | 0 (0.0%) |
| Total | 122 (62.2%) | 74 (37.8%) |
Education in Muir Beach
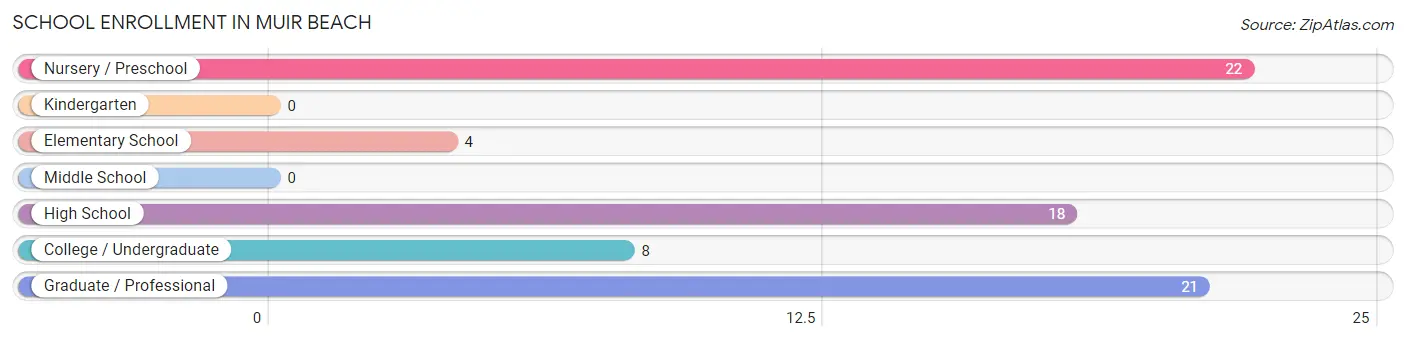
School Enrollment in Muir Beach
The most common levels of schooling among the 73 students in Muir Beach are nursery / preschool (22 | 30.1%), graduate / professional (21 | 28.8%), and high school (18 | 24.7%).
| School Level | # Students | % Students |
| Nursery / Preschool | 22 | 30.1% |
| Kindergarten | 0 | 0.0% |
| Elementary School | 4 | 5.5% |
| Middle School | 0 | 0.0% |
| High School | 18 | 24.7% |
| College / Undergraduate | 8 | 11.0% |
| Graduate / Professional | 21 | 28.8% |
| Total | 73 | 100.0% |
School Enrollment by Age by Funding Source in Muir Beach
Out of a total of 73 students who are enrolled in schools in Muir Beach, 25 (34.2%) attend a private institution, while the remaining 48 (65.8%) are enrolled in public schools. The age group of 3 to 4 year olds has the highest likelihood of being enrolled in private schools, with 22 (100.0% in the age bracket) enrolled. Conversely, the age group of 5 to 9 year old has the lowest likelihood of being enrolled in a private school, with 4 (100.0% in the age bracket) attending a public institution.
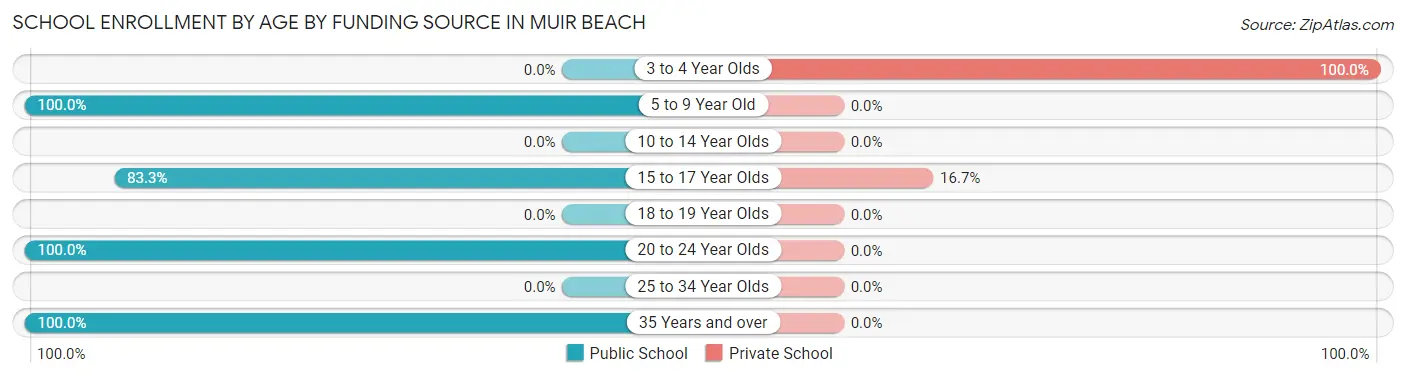
| Age Bracket | Public School | Private School |
| 3 to 4 Year Olds | 0 (0.0%) | 22 (100.0%) |
| 5 to 9 Year Old | 4 (100.0%) | 0 (0.0%) |
| 10 to 14 Year Olds | 0 (0.0%) | 0 (0.0%) |
| 15 to 17 Year Olds | 15 (83.3%) | 3 (16.7%) |
| 18 to 19 Year Olds | 0 (0.0%) | 0 (0.0%) |
| 20 to 24 Year Olds | 8 (100.0%) | 0 (0.0%) |
| 25 to 34 Year Olds | 0 (0.0%) | 0 (0.0%) |
| 35 Years and over | 21 (100.0%) | 0 (0.0%) |
| Total | 48 (65.8%) | 25 (34.2%) |
Educational Attainment by Field of Study in Muir Beach
Visual & performing arts (59 | 20.4%), business (52 | 18.0%), social sciences (34 | 11.8%), science & technology (34 | 11.8%), and liberal arts & history (27 | 9.3%) are the most common fields of study among 289 individuals in Muir Beach who have obtained a bachelor's degree or higher.
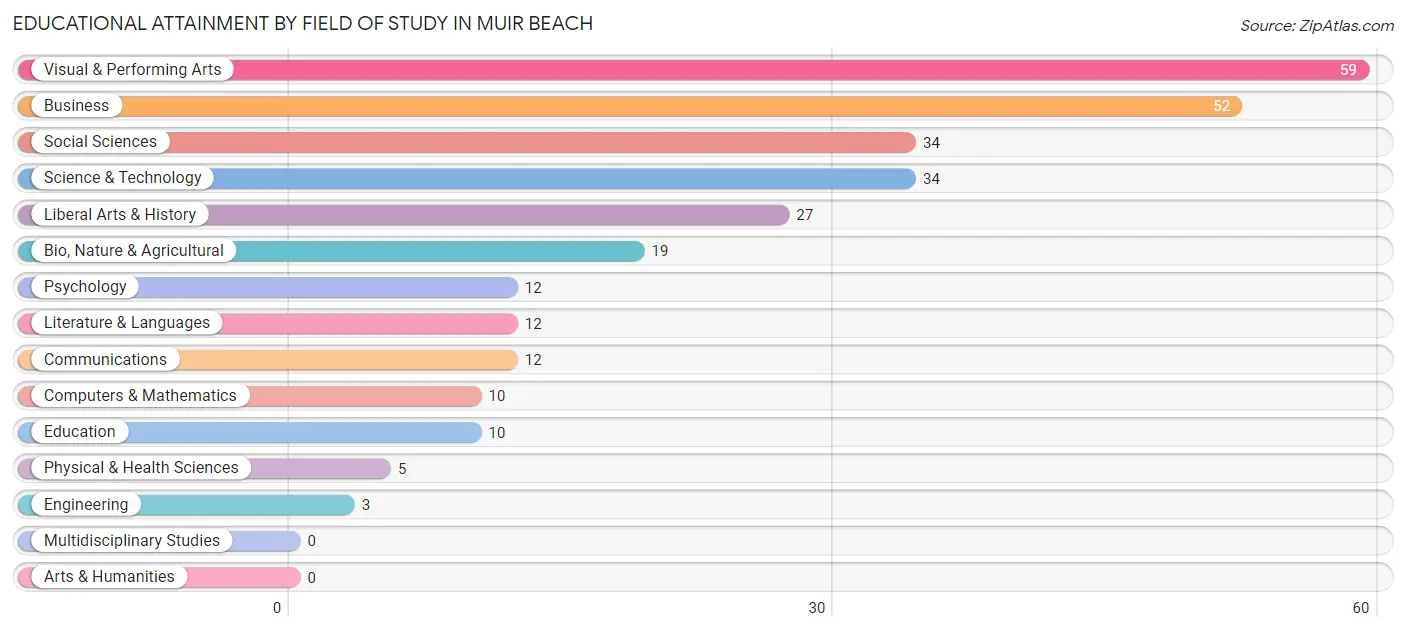
| Field of Study | # Graduates | % Graduates |
| Computers & Mathematics | 10 | 3.5% |
| Bio, Nature & Agricultural | 19 | 6.6% |
| Physical & Health Sciences | 5 | 1.7% |
| Psychology | 12 | 4.2% |
| Social Sciences | 34 | 11.8% |
| Engineering | 3 | 1.0% |
| Multidisciplinary Studies | 0 | 0.0% |
| Science & Technology | 34 | 11.8% |
| Business | 52 | 18.0% |
| Education | 10 | 3.5% |
| Literature & Languages | 12 | 4.2% |
| Liberal Arts & History | 27 | 9.3% |
| Visual & Performing Arts | 59 | 20.4% |
| Communications | 12 | 4.2% |
| Arts & Humanities | 0 | 0.0% |
| Total | 289 | 100.0% |
Transportation & Commute in Muir Beach
Vehicle Availability by Sex in Muir Beach
The most prevalent vehicle ownership categories in Muir Beach are males with 2 vehicles (66, accounting for 54.1%) and females with 2 vehicles (25, making up 89.2%).
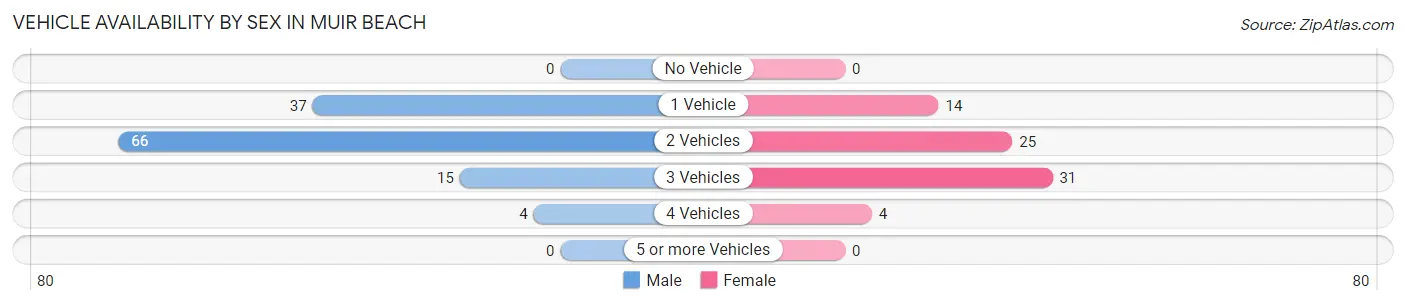
| Vehicles Available | Male | Female |
| No Vehicle | 0 (0.0%) | 0 (0.0%) |
| 1 Vehicle | 37 (30.3%) | 14 (18.9%) |
| 2 Vehicles | 66 (54.1%) | 25 (33.8%) |
| 3 Vehicles | 15 (12.3%) | 31 (41.9%) |
| 4 Vehicles | 4 (3.3%) | 4 (5.4%) |
| 5 or more Vehicles | 0 (0.0%) | 0 (0.0%) |
| Total | 122 (100.0%) | 74 (100.0%) |
Commute Time in Muir Beach
The most frequently occuring commute durations in Muir Beach are 15 to 19 minutes (28 commuters, 23.0%), 25 to 29 minutes (23 commuters, 18.9%), and 60 to 89 minutes (21 commuters, 17.2%).
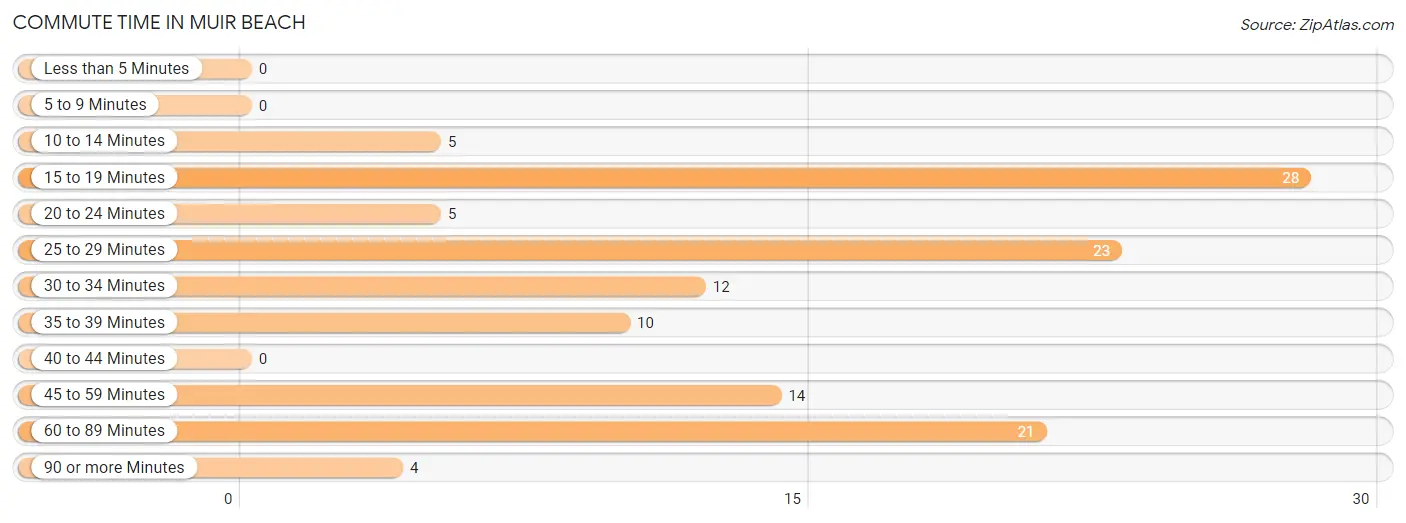
| Commute Time | # Commuters | % Commuters |
| Less than 5 Minutes | 0 | 0.0% |
| 5 to 9 Minutes | 0 | 0.0% |
| 10 to 14 Minutes | 5 | 4.1% |
| 15 to 19 Minutes | 28 | 23.0% |
| 20 to 24 Minutes | 5 | 4.1% |
| 25 to 29 Minutes | 23 | 18.9% |
| 30 to 34 Minutes | 12 | 9.8% |
| 35 to 39 Minutes | 10 | 8.2% |
| 40 to 44 Minutes | 0 | 0.0% |
| 45 to 59 Minutes | 14 | 11.5% |
| 60 to 89 Minutes | 21 | 17.2% |
| 90 or more Minutes | 4 | 3.3% |
Commute Time by Sex in Muir Beach
The most common commute times in Muir Beach are 15 to 19 minutes (28 commuters, 37.8%) for males and 30 to 34 minutes (12 commuters, 25.0%) for females.
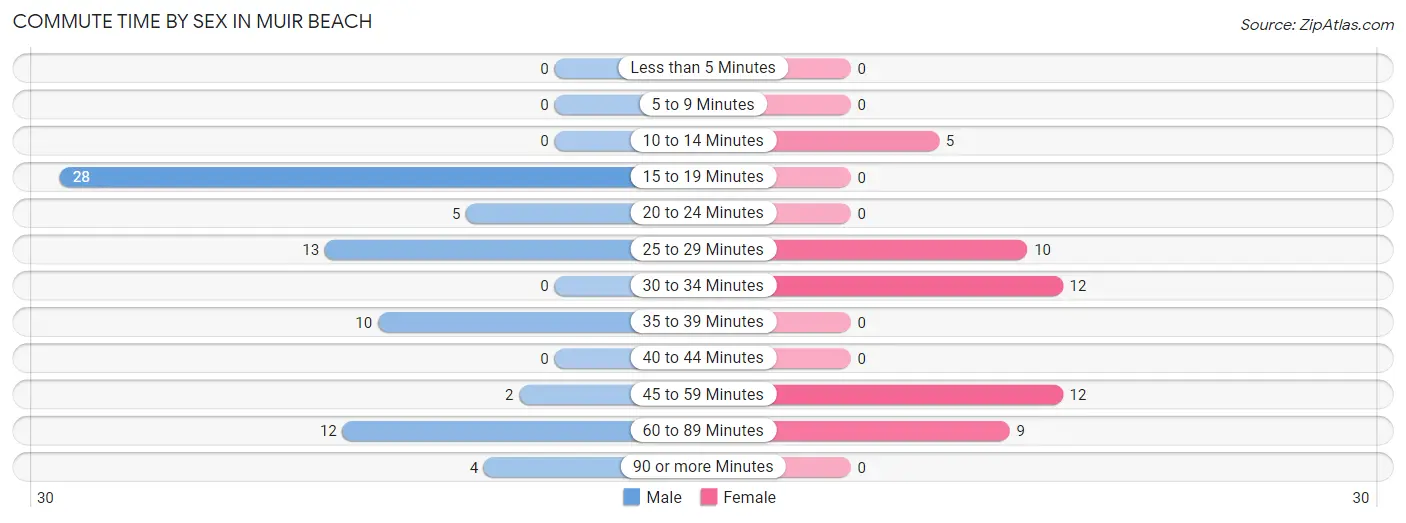
| Commute Time | Male | Female |
| Less than 5 Minutes | 0 (0.0%) | 0 (0.0%) |
| 5 to 9 Minutes | 0 (0.0%) | 0 (0.0%) |
| 10 to 14 Minutes | 0 (0.0%) | 5 (10.4%) |
| 15 to 19 Minutes | 28 (37.8%) | 0 (0.0%) |
| 20 to 24 Minutes | 5 (6.8%) | 0 (0.0%) |
| 25 to 29 Minutes | 13 (17.6%) | 10 (20.8%) |
| 30 to 34 Minutes | 0 (0.0%) | 12 (25.0%) |
| 35 to 39 Minutes | 10 (13.5%) | 0 (0.0%) |
| 40 to 44 Minutes | 0 (0.0%) | 0 (0.0%) |
| 45 to 59 Minutes | 2 (2.7%) | 12 (25.0%) |
| 60 to 89 Minutes | 12 (16.2%) | 9 (18.8%) |
| 90 or more Minutes | 4 (5.4%) | 0 (0.0%) |
Time of Departure to Work by Sex in Muir Beach
The most frequent times of departure to work in Muir Beach are 12:00 AM to 4:59 AM (28, 37.8%) for males and 9:00 AM to 9:59 AM (22, 45.8%) for females.
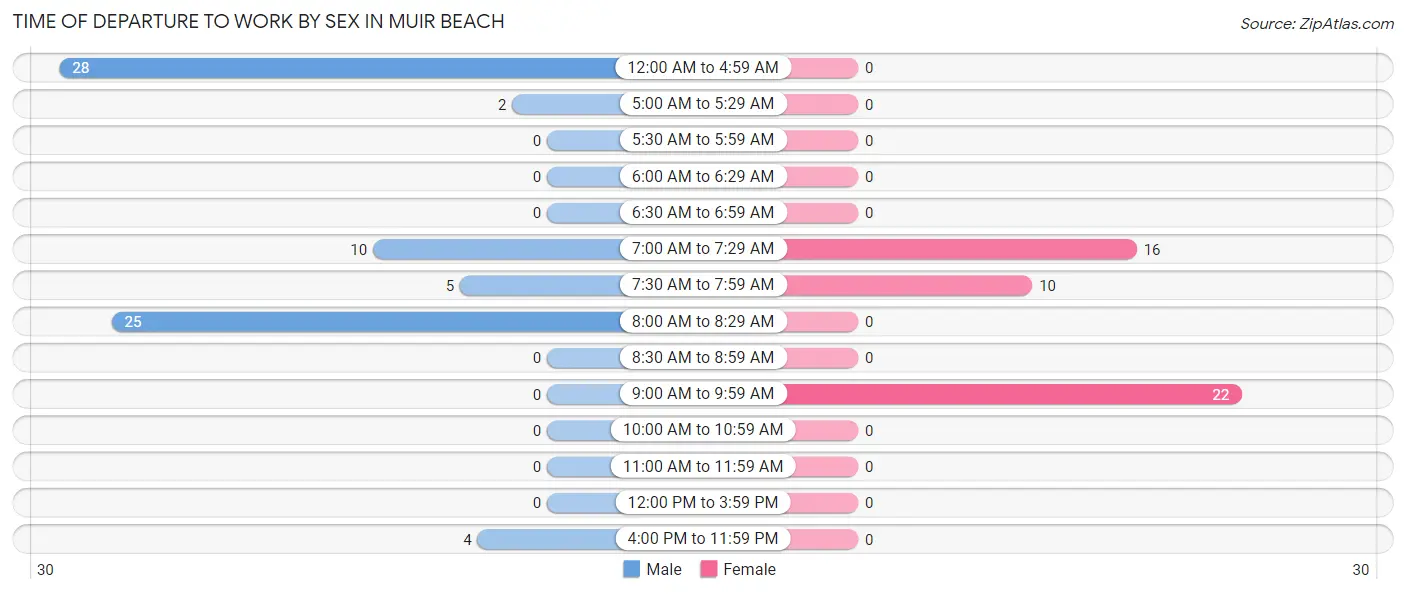
| Time of Departure | Male | Female |
| 12:00 AM to 4:59 AM | 28 (37.8%) | 0 (0.0%) |
| 5:00 AM to 5:29 AM | 2 (2.7%) | 0 (0.0%) |
| 5:30 AM to 5:59 AM | 0 (0.0%) | 0 (0.0%) |
| 6:00 AM to 6:29 AM | 0 (0.0%) | 0 (0.0%) |
| 6:30 AM to 6:59 AM | 0 (0.0%) | 0 (0.0%) |
| 7:00 AM to 7:29 AM | 10 (13.5%) | 16 (33.3%) |
| 7:30 AM to 7:59 AM | 5 (6.8%) | 10 (20.8%) |
| 8:00 AM to 8:29 AM | 25 (33.8%) | 0 (0.0%) |
| 8:30 AM to 8:59 AM | 0 (0.0%) | 0 (0.0%) |
| 9:00 AM to 9:59 AM | 0 (0.0%) | 22 (45.8%) |
| 10:00 AM to 10:59 AM | 0 (0.0%) | 0 (0.0%) |
| 11:00 AM to 11:59 AM | 0 (0.0%) | 0 (0.0%) |
| 12:00 PM to 3:59 PM | 0 (0.0%) | 0 (0.0%) |
| 4:00 PM to 11:59 PM | 4 (5.4%) | 0 (0.0%) |
| Total | 74 (100.0%) | 48 (100.0%) |
Housing Occupancy in Muir Beach
Occupancy by Ownership in Muir Beach
Of the total 170 dwellings in Muir Beach, owner-occupied units account for 141 (82.9%), while renter-occupied units make up 29 (17.1%).
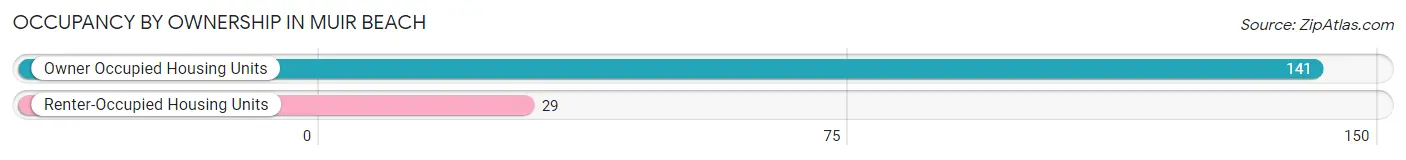
| Occupancy | # Housing Units | % Housing Units |
| Owner Occupied Housing Units | 141 | 82.9% |
| Renter-Occupied Housing Units | 29 | 17.1% |
| Total Occupied Housing Units | 170 | 100.0% |
Occupancy by Household Size in Muir Beach
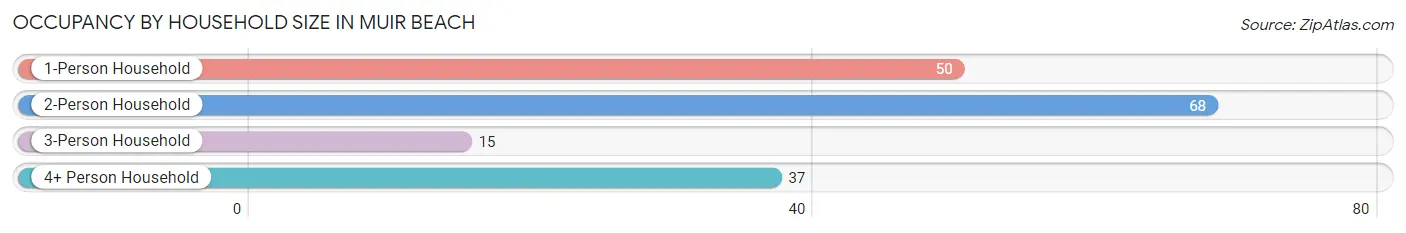
| Household Size | # Housing Units | % Housing Units |
| 1-Person Household | 50 | 29.4% |
| 2-Person Household | 68 | 40.0% |
| 3-Person Household | 15 | 8.8% |
| 4+ Person Household | 37 | 21.8% |
| Total Housing Units | 170 | 100.0% |
Occupancy by Ownership by Household Size in Muir Beach
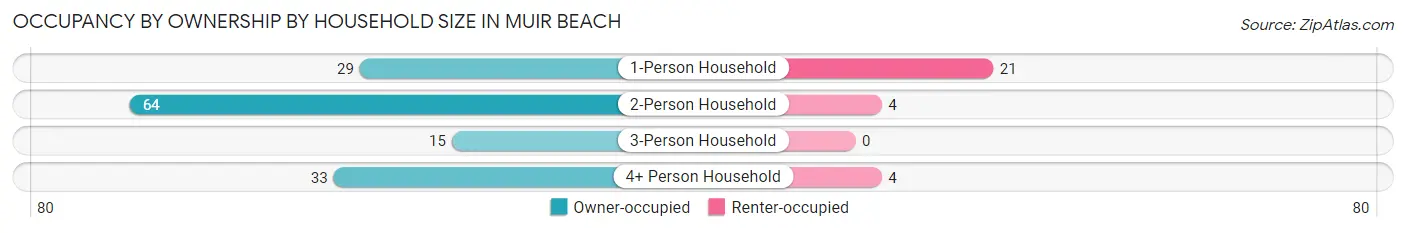
| Household Size | Owner-occupied | Renter-occupied |
| 1-Person Household | 29 (58.0%) | 21 (42.0%) |
| 2-Person Household | 64 (94.1%) | 4 (5.9%) |
| 3-Person Household | 15 (100.0%) | 0 (0.0%) |
| 4+ Person Household | 33 (89.2%) | 4 (10.8%) |
| Total Housing Units | 141 (82.9%) | 29 (17.1%) |
Occupancy by Educational Attainment in Muir Beach
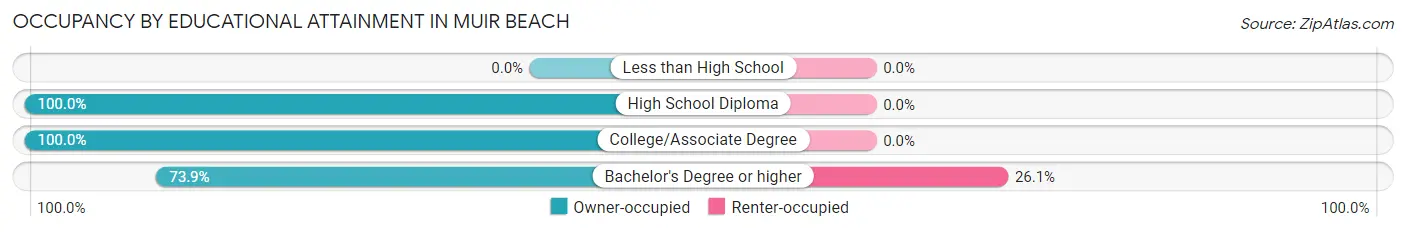
| Household Size | Owner-occupied | Renter-occupied |
| Less than High School | 0 (0.0%) | 0 (0.0%) |
| High School Diploma | 7 (100.0%) | 0 (0.0%) |
| College/Associate Degree | 52 (100.0%) | 0 (0.0%) |
| Bachelor's Degree or higher | 82 (73.9%) | 29 (26.1%) |
Occupancy by Age of Householder in Muir Beach
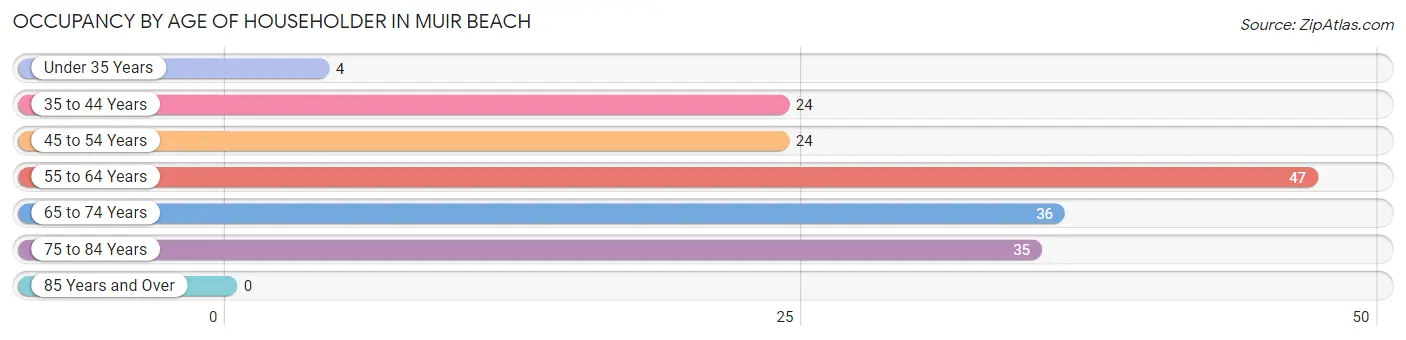
| Age Bracket | # Households | % Households |
| Under 35 Years | 4 | 2.4% |
| 35 to 44 Years | 24 | 14.1% |
| 45 to 54 Years | 24 | 14.1% |
| 55 to 64 Years | 47 | 27.7% |
| 65 to 74 Years | 36 | 21.2% |
| 75 to 84 Years | 35 | 20.6% |
| 85 Years and Over | 0 | 0.0% |
| Total | 170 | 100.0% |
Housing Finances in Muir Beach
Median Income by Occupancy in Muir Beach
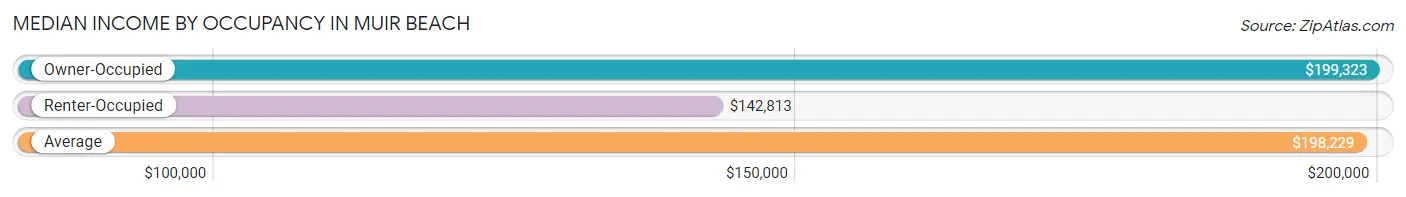
| Occupancy Type | # Households | Median Income |
| Owner-Occupied | 141 (82.9%) | $199,323 |
| Renter-Occupied | 29 (17.1%) | $142,813 |
| Average | 170 (100.0%) | $198,229 |
Occupancy by Householder Income Bracket in Muir Beach
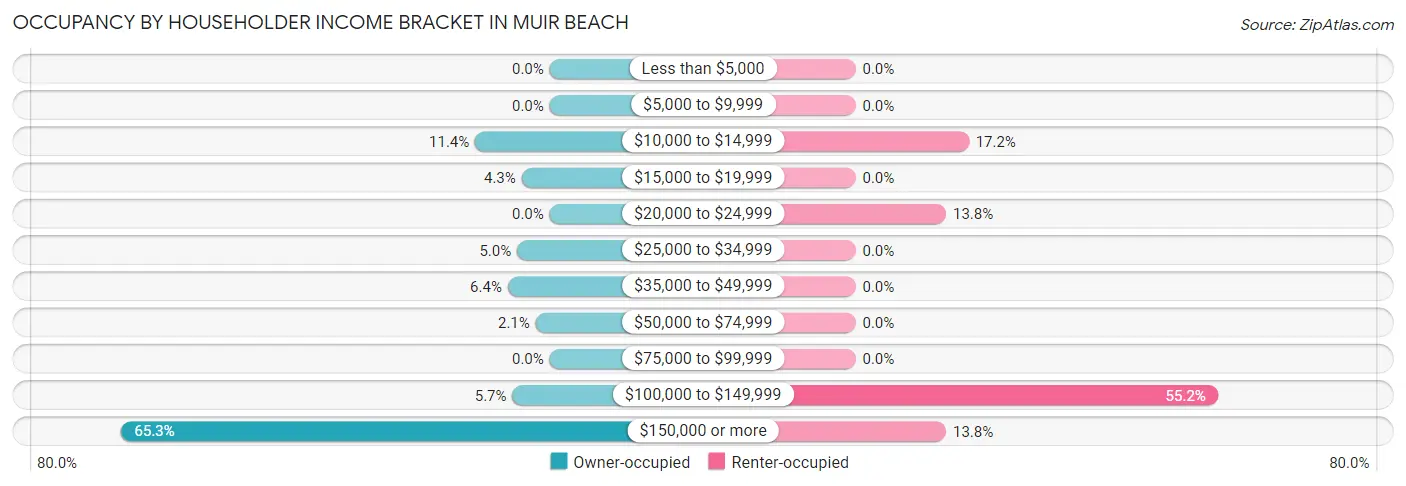
| Income Bracket | Owner-occupied | Renter-occupied |
| Less than $5,000 | 0 (0.0%) | 0 (0.0%) |
| $5,000 to $9,999 | 0 (0.0%) | 0 (0.0%) |
| $10,000 to $14,999 | 16 (11.4%) | 5 (17.2%) |
| $15,000 to $19,999 | 6 (4.3%) | 0 (0.0%) |
| $20,000 to $24,999 | 0 (0.0%) | 4 (13.8%) |
| $25,000 to $34,999 | 7 (5.0%) | 0 (0.0%) |
| $35,000 to $49,999 | 9 (6.4%) | 0 (0.0%) |
| $50,000 to $74,999 | 3 (2.1%) | 0 (0.0%) |
| $75,000 to $99,999 | 0 (0.0%) | 0 (0.0%) |
| $100,000 to $149,999 | 8 (5.7%) | 16 (55.2%) |
| $150,000 or more | 92 (65.2%) | 4 (13.8%) |
| Total | 141 (100.0%) | 29 (100.0%) |
Monthly Housing Cost Tiers in Muir Beach
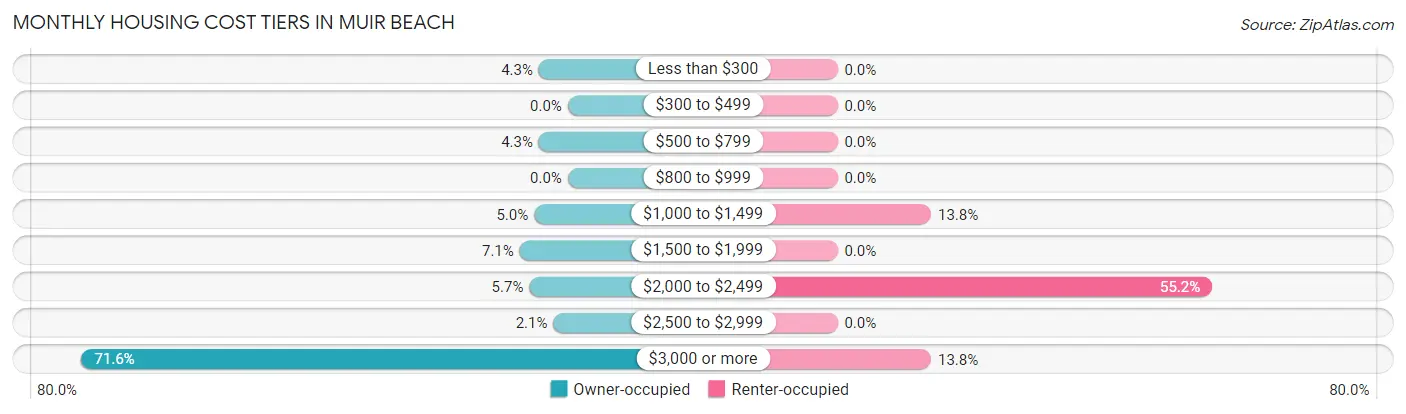
| Monthly Cost | Owner-occupied | Renter-occupied |
| Less than $300 | 6 (4.3%) | 0 (0.0%) |
| $300 to $499 | 0 (0.0%) | 0 (0.0%) |
| $500 to $799 | 6 (4.3%) | 0 (0.0%) |
| $800 to $999 | 0 (0.0%) | 0 (0.0%) |
| $1,000 to $1,499 | 7 (5.0%) | 4 (13.8%) |
| $1,500 to $1,999 | 10 (7.1%) | 0 (0.0%) |
| $2,000 to $2,499 | 8 (5.7%) | 16 (55.2%) |
| $2,500 to $2,999 | 3 (2.1%) | 0 (0.0%) |
| $3,000 or more | 101 (71.6%) | 4 (13.8%) |
| Total | 141 (100.0%) | 29 (100.0%) |
Physical Housing Characteristics in Muir Beach
Housing Structures in Muir Beach
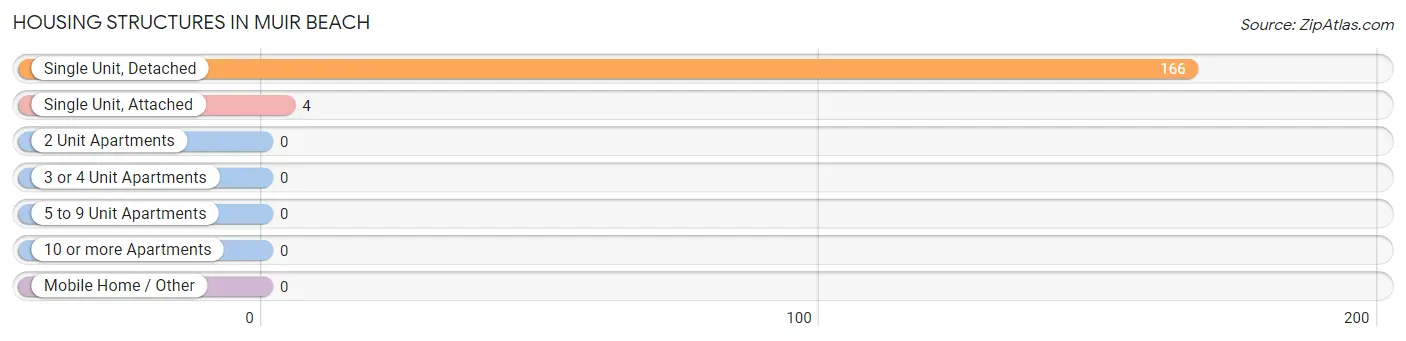
| Structure Type | # Housing Units | % Housing Units |
| Single Unit, Detached | 166 | 97.7% |
| Single Unit, Attached | 4 | 2.4% |
| 2 Unit Apartments | 0 | 0.0% |
| 3 or 4 Unit Apartments | 0 | 0.0% |
| 5 to 9 Unit Apartments | 0 | 0.0% |
| 10 or more Apartments | 0 | 0.0% |
| Mobile Home / Other | 0 | 0.0% |
| Total | 170 | 100.0% |
Housing Structures by Occupancy in Muir Beach
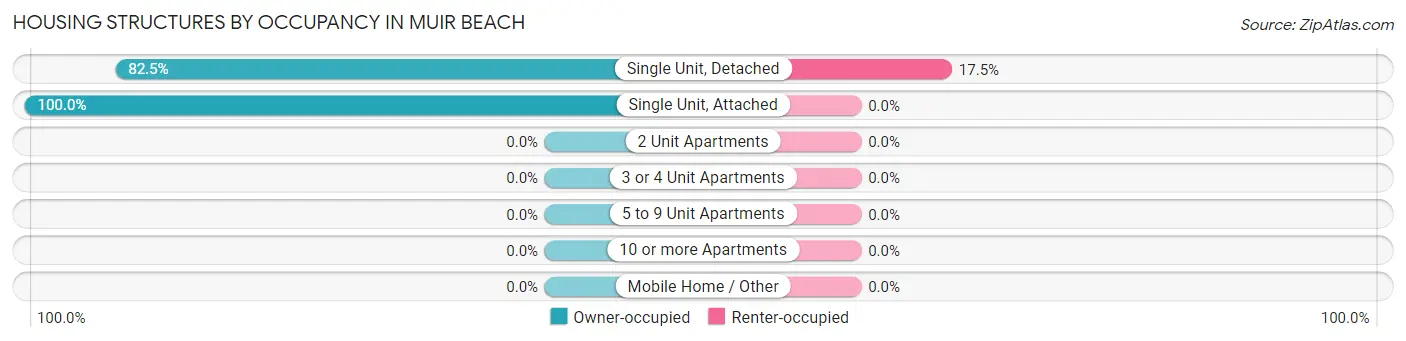
| Structure Type | Owner-occupied | Renter-occupied |
| Single Unit, Detached | 137 (82.5%) | 29 (17.5%) |
| Single Unit, Attached | 4 (100.0%) | 0 (0.0%) |
| 2 Unit Apartments | 0 (0.0%) | 0 (0.0%) |
| 3 or 4 Unit Apartments | 0 (0.0%) | 0 (0.0%) |
| 5 to 9 Unit Apartments | 0 (0.0%) | 0 (0.0%) |
| 10 or more Apartments | 0 (0.0%) | 0 (0.0%) |
| Mobile Home / Other | 0 (0.0%) | 0 (0.0%) |
| Total | 141 (82.9%) | 29 (17.1%) |
Housing Structures by Number of Rooms in Muir Beach
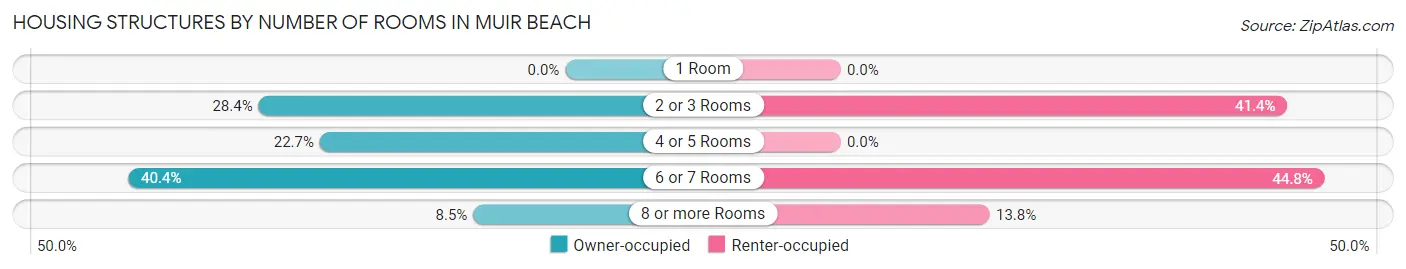
| Number of Rooms | Owner-occupied | Renter-occupied |
| 1 Room | 0 (0.0%) | 0 (0.0%) |
| 2 or 3 Rooms | 40 (28.4%) | 12 (41.4%) |
| 4 or 5 Rooms | 32 (22.7%) | 0 (0.0%) |
| 6 or 7 Rooms | 57 (40.4%) | 13 (44.8%) |
| 8 or more Rooms | 12 (8.5%) | 4 (13.8%) |
| Total | 141 (100.0%) | 29 (100.0%) |
Housing Structure by Heating Type in Muir Beach
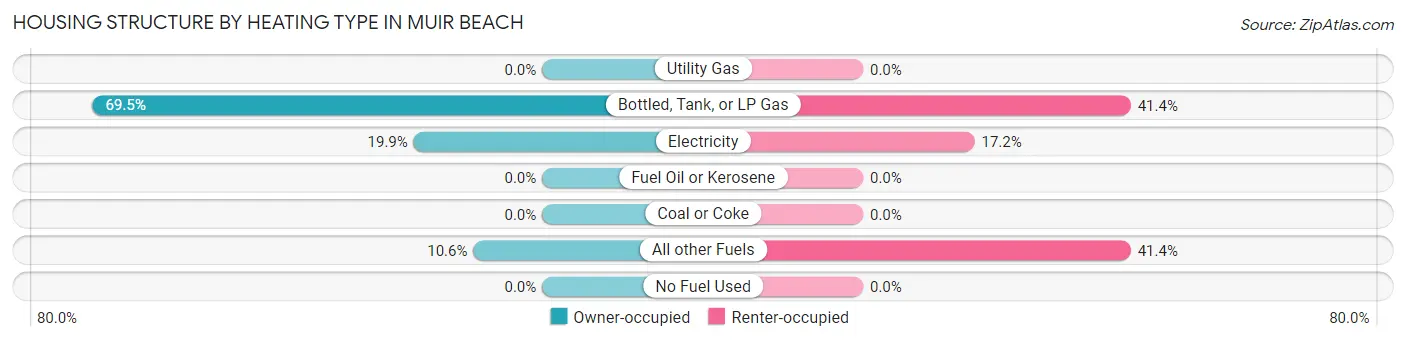
| Heating Type | Owner-occupied | Renter-occupied |
| Utility Gas | 0 (0.0%) | 0 (0.0%) |
| Bottled, Tank, or LP Gas | 98 (69.5%) | 12 (41.4%) |
| Electricity | 28 (19.9%) | 5 (17.2%) |
| Fuel Oil or Kerosene | 0 (0.0%) | 0 (0.0%) |
| Coal or Coke | 0 (0.0%) | 0 (0.0%) |
| All other Fuels | 15 (10.6%) | 12 (41.4%) |
| No Fuel Used | 0 (0.0%) | 0 (0.0%) |
| Total | 141 (100.0%) | 29 (100.0%) |
Household Vehicle Usage in Muir Beach
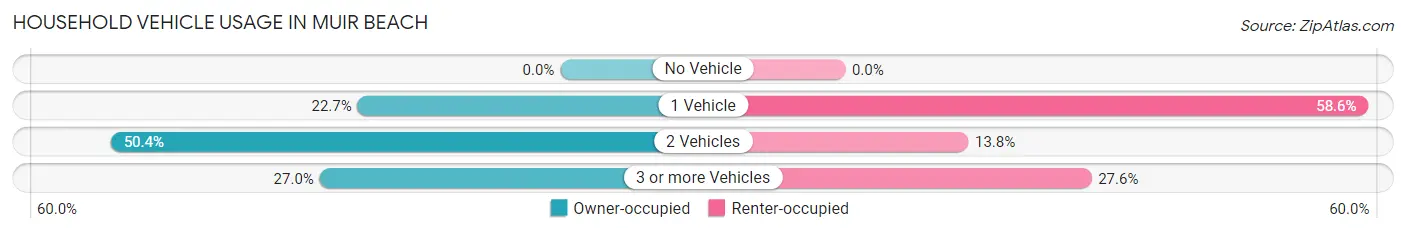
| Vehicles per Household | Owner-occupied | Renter-occupied |
| No Vehicle | 0 (0.0%) | 0 (0.0%) |
| 1 Vehicle | 32 (22.7%) | 17 (58.6%) |
| 2 Vehicles | 71 (50.3%) | 4 (13.8%) |
| 3 or more Vehicles | 38 (27.0%) | 8 (27.6%) |
| Total | 141 (100.0%) | 29 (100.0%) |
Real Estate & Mortgages in Muir Beach
Real Estate and Mortgage Overview in Muir Beach
| Characteristic | Without Mortgage | With Mortgage |
| Housing Units | 44 | 97 |
| Median Property Value | $2,000,001 | $1,796,400 |
| Median Household Income | $250,001 | $64 |
| Monthly Housing Costs | $1,501 | $90 |
| Real Estate Taxes | $10,001 | $0 |
Property Value by Mortgage Status in Muir Beach
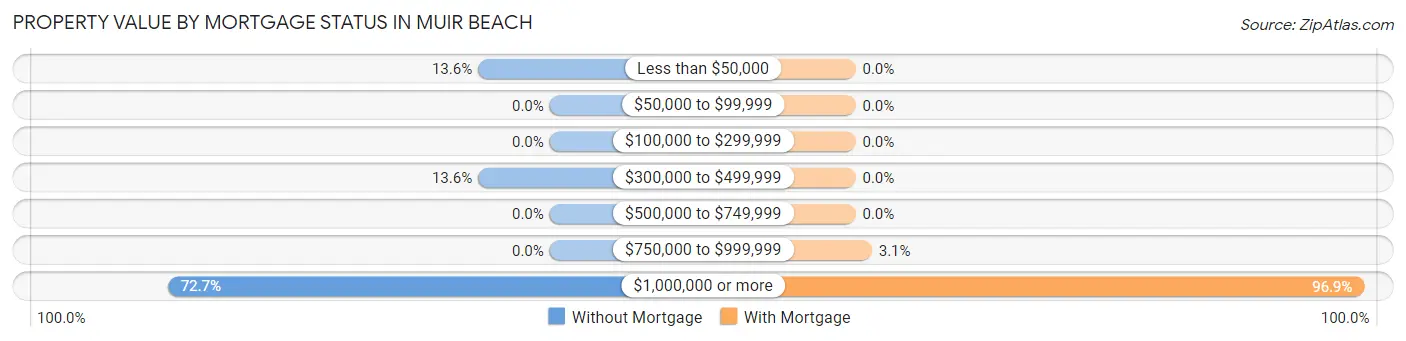
| Property Value | Without Mortgage | With Mortgage |
| Less than $50,000 | 6 (13.6%) | 0 (0.0%) |
| $50,000 to $99,999 | 0 (0.0%) | 0 (0.0%) |
| $100,000 to $299,999 | 0 (0.0%) | 0 (0.0%) |
| $300,000 to $499,999 | 6 (13.6%) | 0 (0.0%) |
| $500,000 to $749,999 | 0 (0.0%) | 0 (0.0%) |
| $750,000 to $999,999 | 0 (0.0%) | 3 (3.1%) |
| $1,000,000 or more | 32 (72.7%) | 94 (96.9%) |
| Total | 44 (100.0%) | 97 (100.0%) |
Household Income by Mortgage Status in Muir Beach
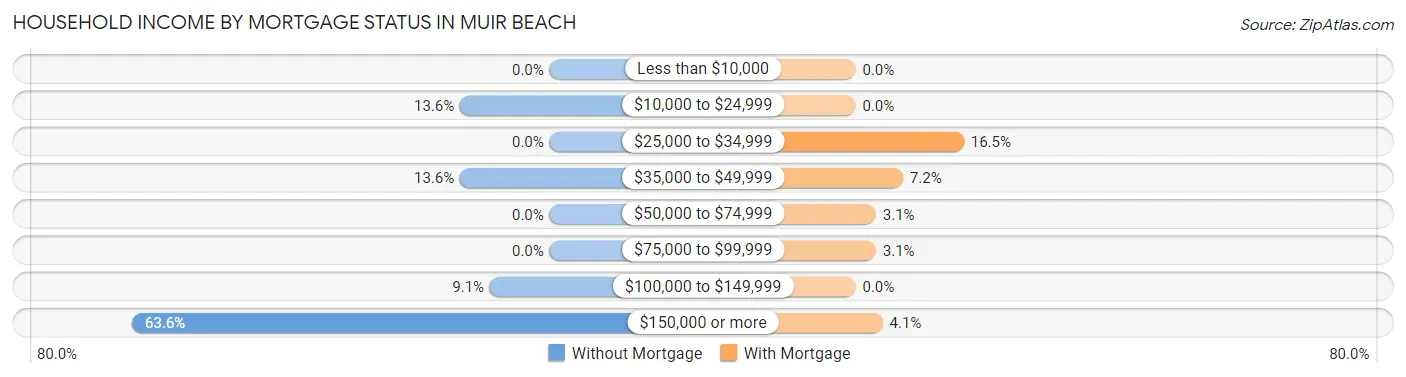
| Household Income | Without Mortgage | With Mortgage |
| Less than $10,000 | 0 (0.0%) | 0 (0.0%) |
| $10,000 to $24,999 | 6 (13.6%) | 0 (0.0%) |
| $25,000 to $34,999 | 0 (0.0%) | 16 (16.5%) |
| $35,000 to $49,999 | 6 (13.6%) | 7 (7.2%) |
| $50,000 to $74,999 | 0 (0.0%) | 3 (3.1%) |
| $75,000 to $99,999 | 0 (0.0%) | 3 (3.1%) |
| $100,000 to $149,999 | 4 (9.1%) | 0 (0.0%) |
| $150,000 or more | 28 (63.6%) | 4 (4.1%) |
| Total | 44 (100.0%) | 97 (100.0%) |
Property Value to Household Income Ratio in Muir Beach
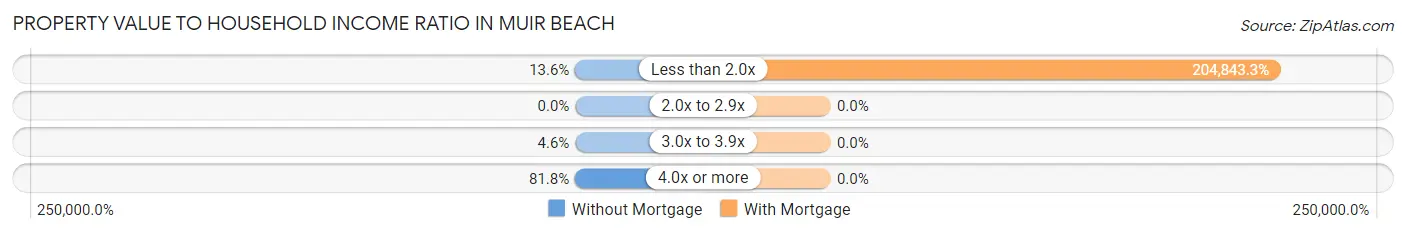
| Value-to-Income Ratio | Without Mortgage | With Mortgage |
| Less than 2.0x | 6 (13.6%) | 198,698 (204,843.3%) |
| 2.0x to 2.9x | 0 (0.0%) | 0 (0.0%) |
| 3.0x to 3.9x | 2 (4.5%) | 0 (0.0%) |
| 4.0x or more | 36 (81.8%) | 0 (0.0%) |
| Total | 44 (100.0%) | 97 (100.0%) |
Real Estate Taxes by Mortgage Status in Muir Beach
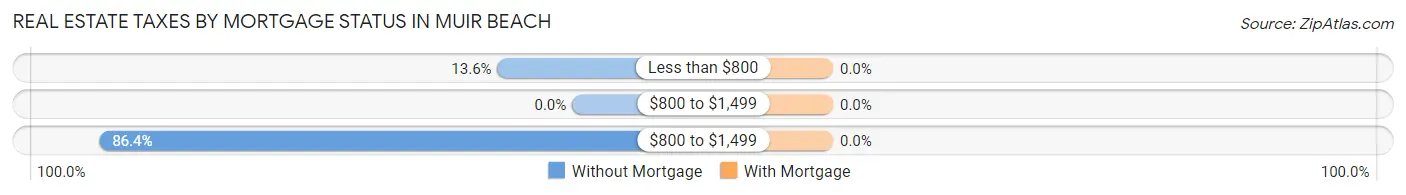
| Property Taxes | Without Mortgage | With Mortgage |
| Less than $800 | 6 (13.6%) | 0 (0.0%) |
| $800 to $1,499 | 0 (0.0%) | 0 (0.0%) |
| $800 to $1,499 | 38 (86.4%) | 0 (0.0%) |
| Total | 44 (100.0%) | 97 (100.0%) |
Health & Disability in Muir Beach
Health Insurance Coverage by Age in Muir Beach
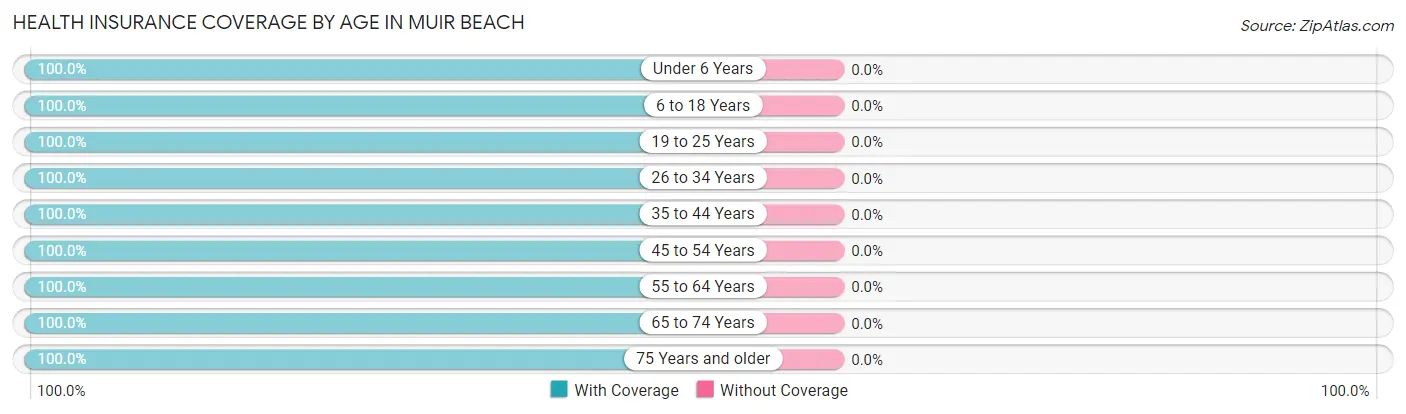
| Age Bracket | With Coverage | Without Coverage |
| Under 6 Years | 44 (100.0%) | 0 (0.0%) |
| 6 to 18 Years | 37 (100.0%) | 0 (0.0%) |
| 19 to 25 Years | 8 (100.0%) | 0 (0.0%) |
| 26 to 34 Years | 23 (100.0%) | 0 (0.0%) |
| 35 to 44 Years | 46 (100.0%) | 0 (0.0%) |
| 45 to 54 Years | 42 (100.0%) | 0 (0.0%) |
| 55 to 64 Years | 91 (100.0%) | 0 (0.0%) |
| 65 to 74 Years | 62 (100.0%) | 0 (0.0%) |
| 75 Years and older | 54 (100.0%) | 0 (0.0%) |
| Total | 407 (100.0%) | 0 (0.0%) |
Health Insurance Coverage by Citizenship Status in Muir Beach
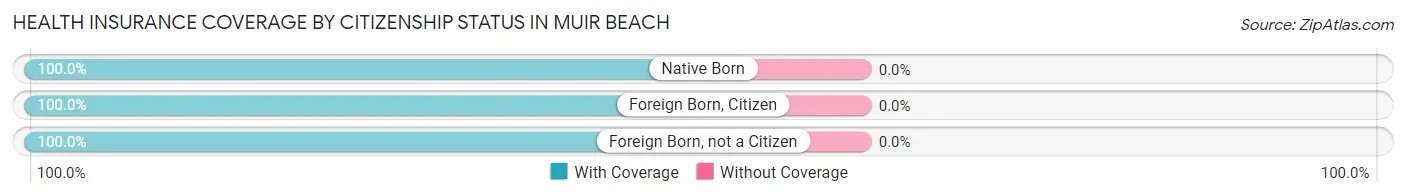
| Citizenship Status | With Coverage | Without Coverage |
| Native Born | 44 (100.0%) | 0 (0.0%) |
| Foreign Born, Citizen | 37 (100.0%) | 0 (0.0%) |
| Foreign Born, not a Citizen | 8 (100.0%) | 0 (0.0%) |
Health Insurance Coverage by Household Income in Muir Beach
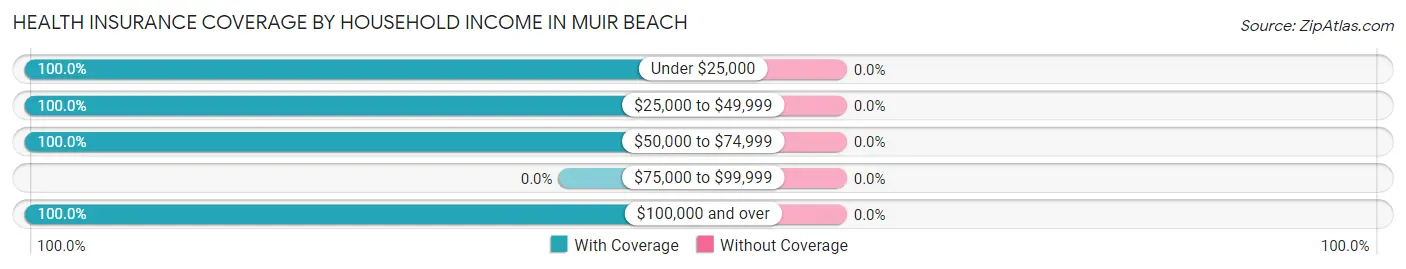
| Household Income | With Coverage | Without Coverage |
| Under $25,000 | 37 (100.0%) | 0 (0.0%) |
| $25,000 to $49,999 | 29 (100.0%) | 0 (0.0%) |
| $50,000 to $74,999 | 7 (100.0%) | 0 (0.0%) |
| $75,000 to $99,999 | 0 (0.0%) | 0 (0.0%) |
| $100,000 and over | 334 (100.0%) | 0 (0.0%) |
Public vs Private Health Insurance Coverage by Age in Muir Beach
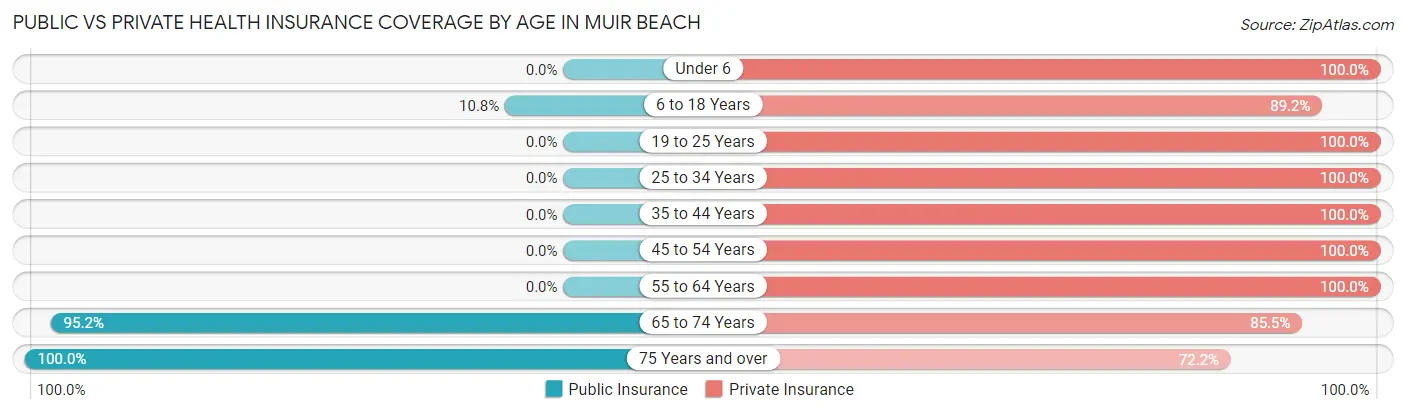
| Age Bracket | Public Insurance | Private Insurance |
| Under 6 | 0 (0.0%) | 44 (100.0%) |
| 6 to 18 Years | 4 (10.8%) | 33 (89.2%) |
| 19 to 25 Years | 0 (0.0%) | 8 (100.0%) |
| 25 to 34 Years | 0 (0.0%) | 23 (100.0%) |
| 35 to 44 Years | 0 (0.0%) | 46 (100.0%) |
| 45 to 54 Years | 0 (0.0%) | 42 (100.0%) |
| 55 to 64 Years | 0 (0.0%) | 91 (100.0%) |
| 65 to 74 Years | 59 (95.2%) | 53 (85.5%) |
| 75 Years and over | 54 (100.0%) | 39 (72.2%) |
| Total | 117 (28.7%) | 379 (93.1%) |
Disability Status by Sex by Age in Muir Beach
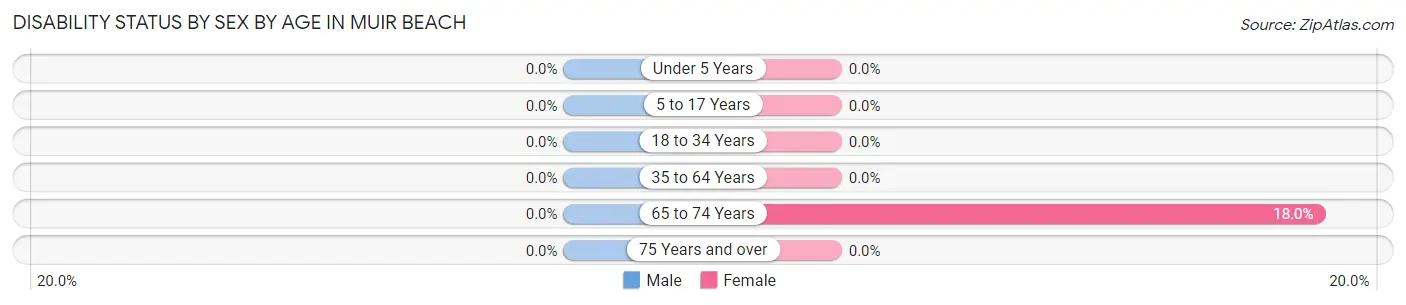
| Age Bracket | Male | Female |
| Under 5 Years | 0 (0.0%) | 0 (0.0%) |
| 5 to 17 Years | 0 (0.0%) | 0 (0.0%) |
| 18 to 34 Years | 0 (0.0%) | 0 (0.0%) |
| 35 to 64 Years | 0 (0.0%) | 0 (0.0%) |
| 65 to 74 Years | 0 (0.0%) | 7 (17.9%) |
| 75 Years and over | 0 (0.0%) | 0 (0.0%) |
Disability Class by Sex by Age in Muir Beach
Disability Class: Hearing Difficulty
| Age Bracket | Male | Female |
| Under 5 Years | 0 (0.0%) | 0 (0.0%) |
| 5 to 17 Years | 0 (0.0%) | 0 (0.0%) |
| 18 to 34 Years | 0 (0.0%) | 0 (0.0%) |
| 35 to 64 Years | 0 (0.0%) | 0 (0.0%) |
| 65 to 74 Years | 0 (0.0%) | 0 (0.0%) |
| 75 Years and over | 0 (0.0%) | 0 (0.0%) |
Disability Class: Vision Difficulty
| Age Bracket | Male | Female |
| Under 5 Years | 0 (0.0%) | 0 (0.0%) |
| 5 to 17 Years | 0 (0.0%) | 0 (0.0%) |
| 18 to 34 Years | 0 (0.0%) | 0 (0.0%) |
| 35 to 64 Years | 0 (0.0%) | 0 (0.0%) |
| 65 to 74 Years | 0 (0.0%) | 0 (0.0%) |
| 75 Years and over | 0 (0.0%) | 0 (0.0%) |
Disability Class: Cognitive Difficulty
| Age Bracket | Male | Female |
| 5 to 17 Years | 0 (0.0%) | 0 (0.0%) |
| 18 to 34 Years | 0 (0.0%) | 0 (0.0%) |
| 35 to 64 Years | 0 (0.0%) | 0 (0.0%) |
| 65 to 74 Years | 0 (0.0%) | 0 (0.0%) |
| 75 Years and over | 0 (0.0%) | 0 (0.0%) |
Disability Class: Ambulatory Difficulty
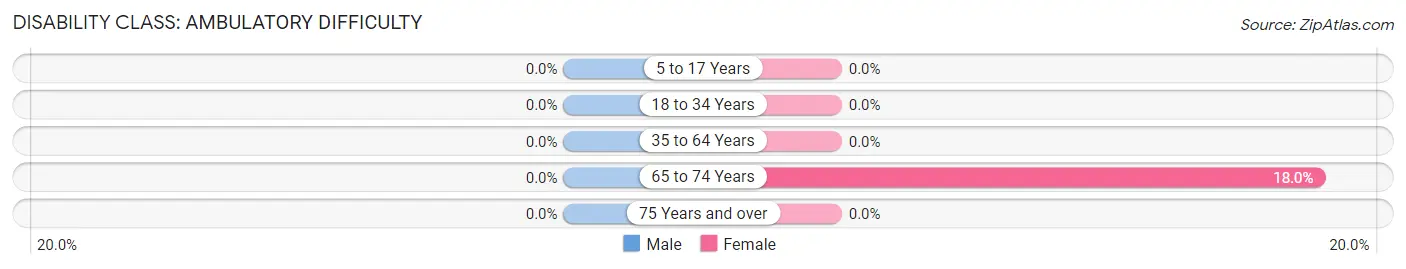
| Age Bracket | Male | Female |
| 5 to 17 Years | 0 (0.0%) | 0 (0.0%) |
| 18 to 34 Years | 0 (0.0%) | 0 (0.0%) |
| 35 to 64 Years | 0 (0.0%) | 0 (0.0%) |
| 65 to 74 Years | 0 (0.0%) | 7 (17.9%) |
| 75 Years and over | 0 (0.0%) | 0 (0.0%) |
Disability Class: Self-Care Difficulty
| Age Bracket | Male | Female |
| 5 to 17 Years | 0 (0.0%) | 0 (0.0%) |
| 18 to 34 Years | 0 (0.0%) | 0 (0.0%) |
| 35 to 64 Years | 0 (0.0%) | 0 (0.0%) |
| 65 to 74 Years | 0 (0.0%) | 0 (0.0%) |
| 75 Years and over | 0 (0.0%) | 0 (0.0%) |
Technology Access in Muir Beach
Computing Device Access in Muir Beach
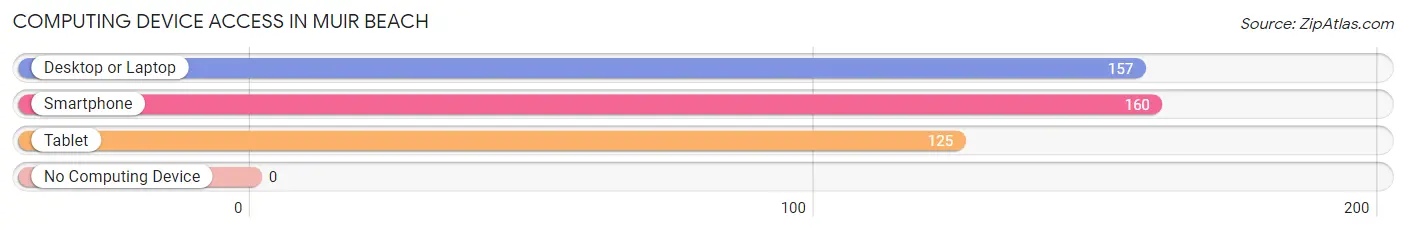
| Device Type | # Households | % Households |
| Desktop or Laptop | 157 | 92.3% |
| Smartphone | 160 | 94.1% |
| Tablet | 125 | 73.5% |
| No Computing Device | 0 | 0.0% |
| Total | 170 | 100.0% |
Internet Access in Muir Beach
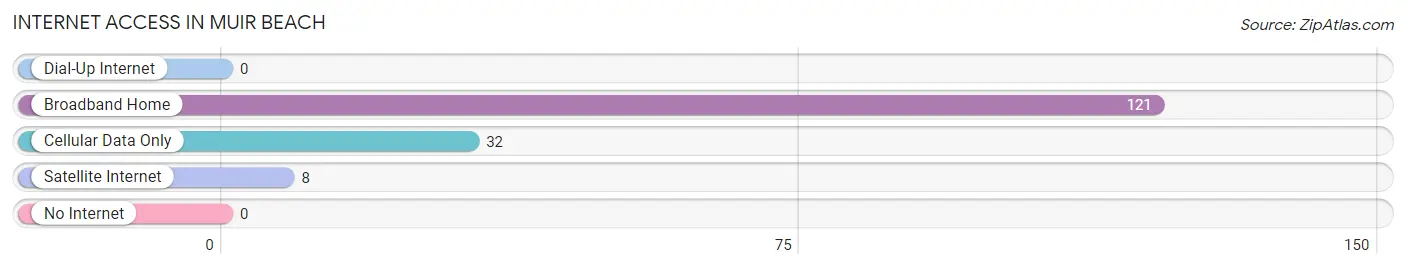
| Internet Type | # Households | % Households |
| Dial-Up Internet | 0 | 0.0% |
| Broadband Home | 121 | 71.2% |
| Cellular Data Only | 32 | 18.8% |
| Satellite Internet | 8 | 4.7% |
| No Internet | 0 | 0.0% |
| Total | 170 | 100.0% |
Muir Beach Summary
Muir Beach is a small unincorporated community located in Marin County, California, United States. It is situated on the Pacific Coast, approximately 15 miles (24 km) northwest of San Francisco. The community is named after John Muir, the naturalist and conservationist who founded the Sierra Club.
History
The area that is now Muir Beach was originally inhabited by the Coast Miwok Native American tribe. The first European settlers arrived in the area in the late 19th century, and the community was officially founded in the early 20th century. The area was originally known as “Big Lagoon”, and the first post office was established in 1906.
The community was named after John Muir, the naturalist and conservationist who founded the Sierra Club. Muir was a frequent visitor to the area, and he was instrumental in the establishment of the nearby Muir Woods National Monument.
Geography
Muir Beach is located in Marin County, California, approximately 15 miles (24 km) northwest of San Francisco. It is situated on the Pacific Coast, and is surrounded by the Golden Gate National Recreation Area. The community is located at an elevation of approximately 200 feet (61 m).
The area is characterized by a mild Mediterranean climate, with cool, wet winters and warm, dry summers. The average annual temperature is approximately 57°F (14°C).
Economy
The economy of Muir Beach is largely based on tourism. The area is a popular destination for outdoor recreation, and is home to several popular beaches, including Muir Beach, Stinson Beach, and Bolinas Beach. The area is also home to several popular restaurants and bars, as well as a number of small shops and galleries.
Demographics
As of the 2010 census, the population of Muir Beach was approximately 310 people. The racial makeup of the community was 94.2% White, 0.3% African American, 0.3% Native American, 1.3% Asian, 0.3% Pacific Islander, 1.3% from other races, and 2.6% from two or more races. The median household income was $90,000, and the median family income was $100,000.
Conclusion
Muir Beach is a small unincorporated community located in Marin County, California, United States. It is situated on the Pacific Coast, approximately 15 miles (24 km) northwest of San Francisco. The community is named after John Muir, the naturalist and conservationist who founded the Sierra Club. The area is characterized by a mild Mediterranean climate, with cool, wet winters and warm, dry summers. The economy of Muir Beach is largely based on tourism, and the population of the community was approximately 310 people as of the 2010 census.
Common Questions
What is Per Capita Income in Muir Beach?
Per Capita income in Muir Beach is $84,194.
What is the Median Family Income in Muir Beach?
Median Family Income in Muir Beach is $228,438.
What is the Median Household income in Muir Beach?
Median Household Income in Muir Beach is $198,229.
What is Income or Wage Gap in Muir Beach?
Income or Wage Gap in Muir Beach is 12.5%.
Women in Muir Beach earn 87.5 cents for every dollar earned by a man.
What is Inequality or Gini Index in Muir Beach?
Inequality or Gini Index in Muir Beach is 0.42.
What is the Total Population of Muir Beach?
Total Population of Muir Beach is 407.
What is the Total Male Population of Muir Beach?
Total Male Population of Muir Beach is 246.
What is the Total Female Population of Muir Beach?
Total Female Population of Muir Beach is 161.
What is the Ratio of Males per 100 Females in Muir Beach?
There are 152.80 Males per 100 Females in Muir Beach.
What is the Ratio of Females per 100 Males in Muir Beach?
There are 65.45 Females per 100 Males in Muir Beach.
What is the Median Population Age in Muir Beach?
Median Population Age in Muir Beach is 56.2 Years.
What is the Average Family Size in Muir Beach
Average Family Size in Muir Beach is 2.9 People.
What is the Average Household Size in Muir Beach
Average Household Size in Muir Beach is 2.4 People.
How Large is the Labor Force in Muir Beach?
There are 212 People in the Labor Forcein in Muir Beach.
What is the Percentage of People in the Labor Force in Muir Beach?
61.1% of People are in the Labor Force in Muir Beach.
What is the Unemployment Rate in Muir Beach?
Unemployment Rate in Muir Beach is 7.5%.