Pleasanton, CA Map & Demographics
Pleasanton Map
Pleasanton Overview
$83,240
PER CAPITA INCOME
$213,697
AVG FAMILY INCOME
$181,639
AVG HOUSEHOLD INCOME
46.1%
WAGE / INCOME GAP [ % ]
53.9¢/ $1
WAGE / INCOME GAP [ $ ]
0.44
INEQUALITY / GINI INDEX
78,691
TOTAL POPULATION
38,861
MALE POPULATION
39,830
FEMALE POPULATION
97.57
MALES / 100 FEMALES
102.49
FEMALES / 100 MALES
41.5
MEDIAN AGE
3.2
AVG FAMILY SIZE
2.8
AVG HOUSEHOLD SIZE
41,304
LABOR FORCE [ PEOPLE ]
65.9%
PERCENT IN LABOR FORCE
4.2%
UNEMPLOYMENT RATE
Pleasanton Area Codes
Income in Pleasanton
Income Overview in Pleasanton
Per Capita Income in Pleasanton is $83,240, while median incomes of families and households are $213,697 and $181,639 respectively.
| Characteristic | Number | Measure |
| Per Capita Income | 78,691 | $83,240 |
| Median Family Income | 21,661 | $213,697 |
| Mean Family Income | 21,661 | $265,155 |
| Median Household Income | 27,849 | $181,639 |
| Mean Household Income | 27,849 | $230,936 |
| Income Deficit | 21,661 | $0 |
| Wage / Income Gap (%) | 78,691 | 46.08% |
| Wage / Income Gap ($) | 78,691 | 53.92¢ per $1 |
| Gini / Inequality Index | 78,691 | 0.44 |
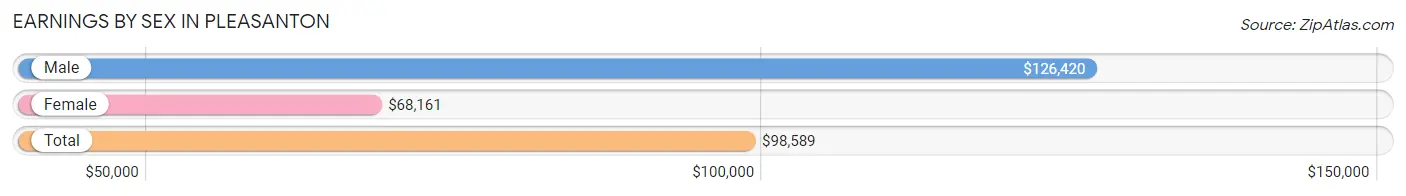
Earnings by Sex in Pleasanton
Average Earnings in Pleasanton are $98,589, $126,420 for men and $68,161 for women, a difference of 46.1%.
| Sex | Number | Average Earnings |
| Male | 23,582 (55.0%) | $126,420 |
| Female | 19,279 (45.0%) | $68,161 |
| Total | 42,861 (100.0%) | $98,589 |
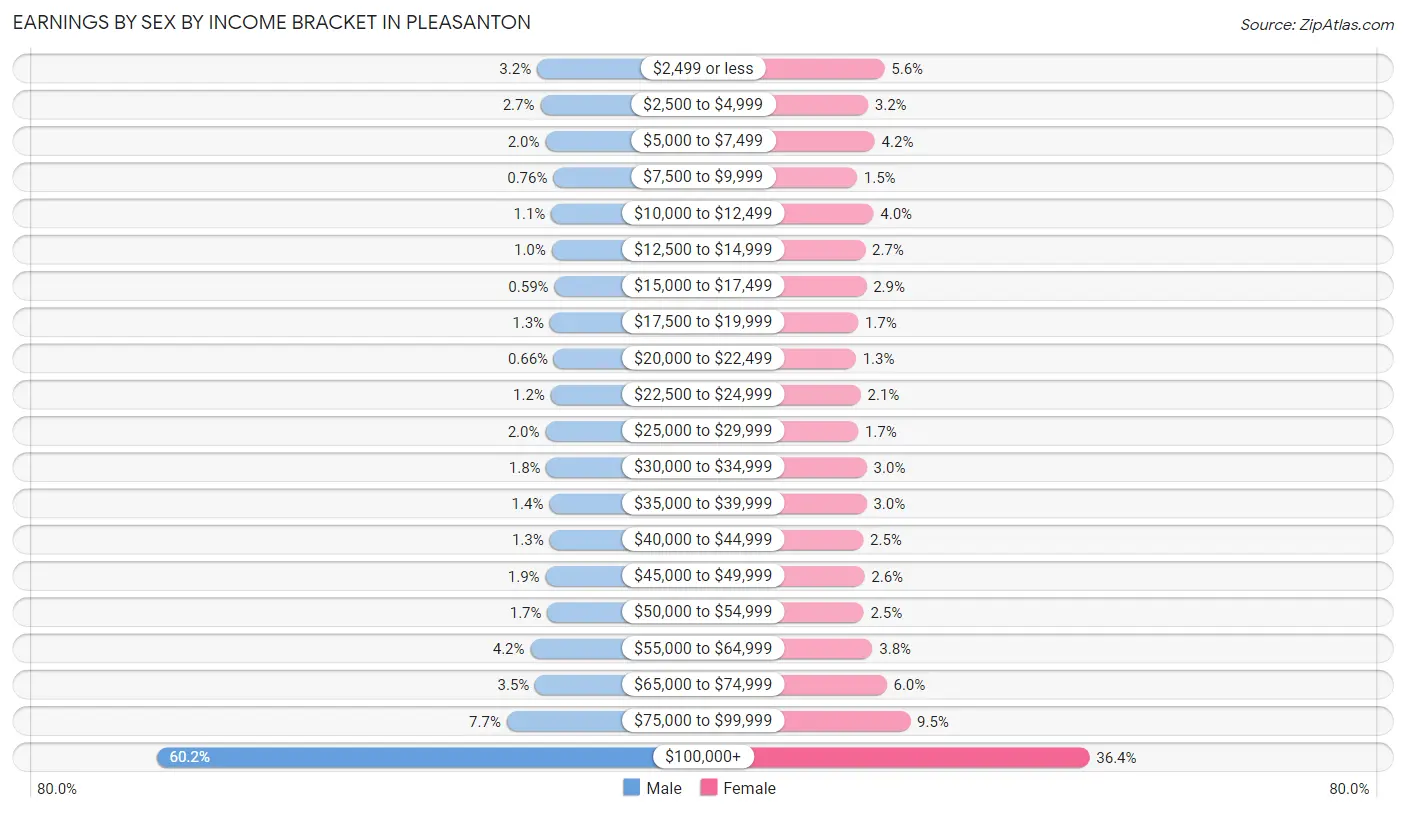
Earnings by Sex by Income Bracket in Pleasanton
The most common earnings brackets in Pleasanton are $100,000+ for men (14,201 | 60.2%) and $100,000+ for women (7,010 | 36.4%).
| Income | Male | Female |
| $2,499 or less | 755 (3.2%) | 1,086 (5.6%) |
| $2,500 to $4,999 | 636 (2.7%) | 609 (3.2%) |
| $5,000 to $7,499 | 461 (1.9%) | 806 (4.2%) |
| $7,500 to $9,999 | 180 (0.8%) | 291 (1.5%) |
| $10,000 to $12,499 | 255 (1.1%) | 767 (4.0%) |
| $12,500 to $14,999 | 237 (1.0%) | 526 (2.7%) |
| $15,000 to $17,499 | 139 (0.6%) | 561 (2.9%) |
| $17,500 to $19,999 | 296 (1.3%) | 321 (1.7%) |
| $20,000 to $22,499 | 156 (0.7%) | 258 (1.3%) |
| $22,500 to $24,999 | 272 (1.1%) | 399 (2.1%) |
| $25,000 to $29,999 | 459 (1.9%) | 323 (1.7%) |
| $30,000 to $34,999 | 421 (1.8%) | 574 (3.0%) |
| $35,000 to $39,999 | 324 (1.4%) | 569 (2.9%) |
| $40,000 to $44,999 | 312 (1.3%) | 473 (2.5%) |
| $45,000 to $49,999 | 457 (1.9%) | 507 (2.6%) |
| $50,000 to $54,999 | 389 (1.7%) | 482 (2.5%) |
| $55,000 to $64,999 | 987 (4.2%) | 738 (3.8%) |
| $65,000 to $74,999 | 819 (3.5%) | 1,149 (6.0%) |
| $75,000 to $99,999 | 1,826 (7.7%) | 1,830 (9.5%) |
| $100,000+ | 14,201 (60.2%) | 7,010 (36.4%) |
| Total | 23,582 (100.0%) | 19,279 (100.0%) |
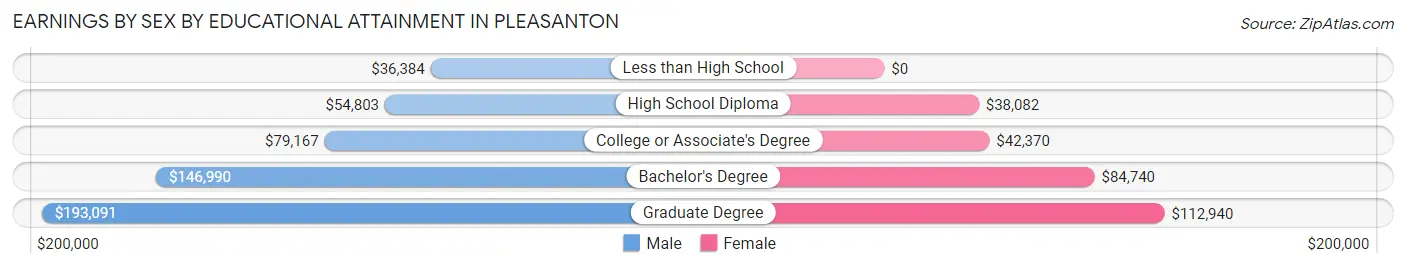
Earnings by Sex by Educational Attainment in Pleasanton
Average earnings in Pleasanton are $142,608 for men and $76,616 for women, a difference of 46.3%. Men with an educational attainment of graduate degree enjoy the highest average annual earnings of $193,091, while those with less than high school education earn the least with $36,384. Women with an educational attainment of graduate degree earn the most with the average annual earnings of $112,940, while those with high school diploma education have the smallest earnings of $38,082.
| Educational Attainment | Male Income | Female Income |
| Less than High School | $36,384 | $0 |
| High School Diploma | $54,803 | $38,082 |
| College or Associate's Degree | $79,167 | $42,370 |
| Bachelor's Degree | $146,990 | $84,740 |
| Graduate Degree | $193,091 | $112,940 |
| Total | $142,608 | $76,616 |
Family Income in Pleasanton
Family Income Brackets in Pleasanton
According to the Pleasanton family income data, there are 11,719 families falling into the $200,000+ income range, which is the most common income bracket and makes up 54.1% of all families. Conversely, the $10,000 to $14,999 income bracket is the least frequent group with only 130 families (0.6%) belonging to this category.
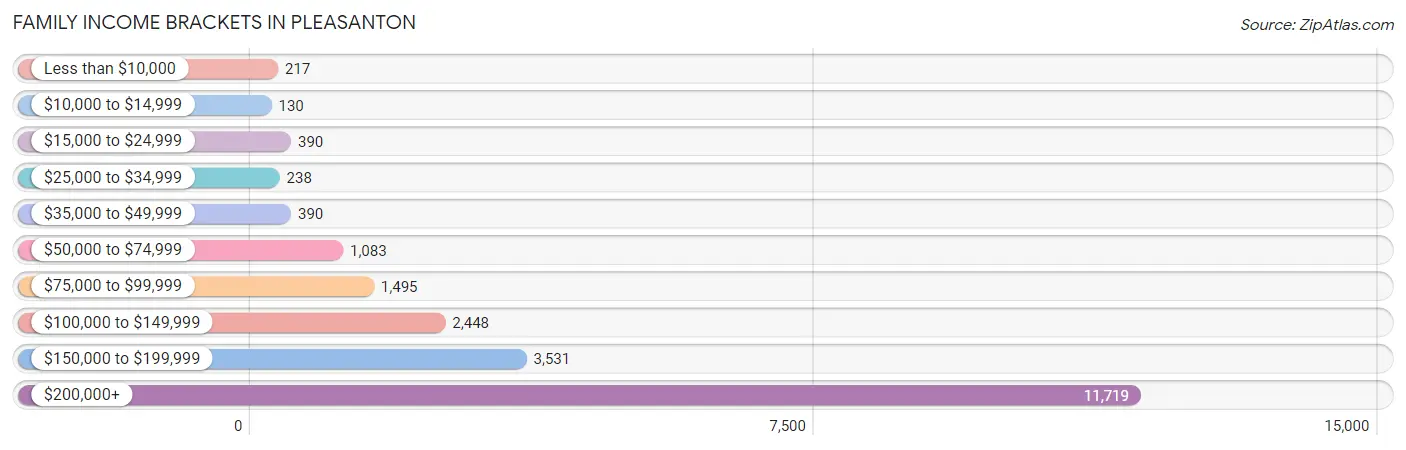
| Income Bracket | # Families | % Families |
| Less than $10,000 | 217 | 1.0% |
| $10,000 to $14,999 | 130 | 0.6% |
| $15,000 to $24,999 | 390 | 1.8% |
| $25,000 to $34,999 | 238 | 1.1% |
| $35,000 to $49,999 | 390 | 1.8% |
| $50,000 to $74,999 | 1,083 | 5.0% |
| $75,000 to $99,999 | 1,495 | 6.9% |
| $100,000 to $149,999 | 2,448 | 11.3% |
| $150,000 to $199,999 | 3,531 | 16.3% |
| $200,000+ | 11,719 | 54.1% |
Family Income by Famaliy Size in Pleasanton
4-person families (5,787 | 26.7%) account for the highest median family income in Pleasanton with $250,001 per family, while 2-person families (8,481 | 39.2%) have the highest median income of $85,220 per family member.
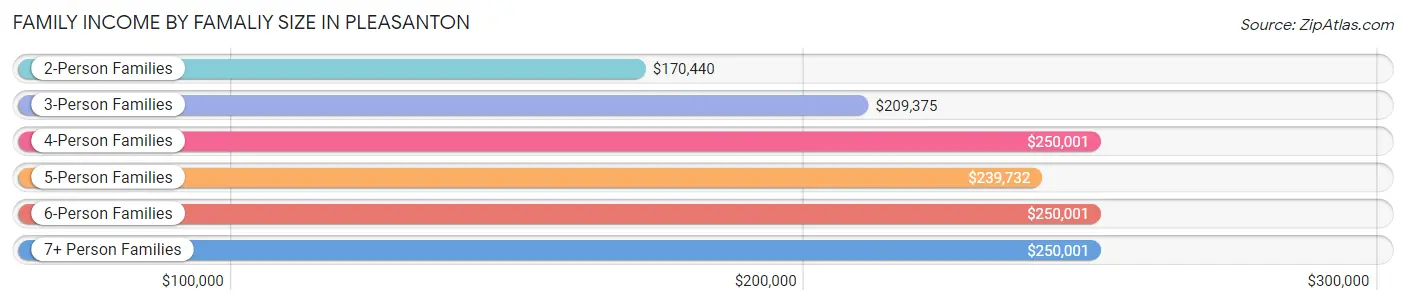
| Income Bracket | # Families | Median Income |
| 2-Person Families | 8,481 (39.2%) | $170,440 |
| 3-Person Families | 5,320 (24.6%) | $209,375 |
| 4-Person Families | 5,787 (26.7%) | $250,001 |
| 5-Person Families | 1,396 (6.4%) | $239,732 |
| 6-Person Families | 515 (2.4%) | $250,001 |
| 7+ Person Families | 162 (0.7%) | $250,001 |
| Total | 21,661 (100.0%) | $213,697 |
Family Income by Number of Earners in Pleasanton
The median family income in Pleasanton is $213,697, with families comprising 2 earners (10,660) having the highest median family income of $250,001, while families with no earners (2,354) have the lowest median family income of $87,978, accounting for 49.2% and 10.9% of families, respectively.
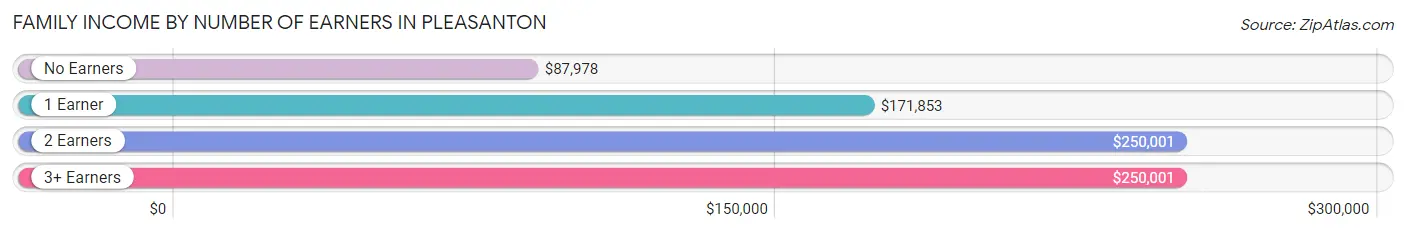
| Number of Earners | # Families | Median Income |
| No Earners | 2,354 (10.9%) | $87,978 |
| 1 Earner | 6,355 (29.3%) | $171,853 |
| 2 Earners | 10,660 (49.2%) | $250,001 |
| 3+ Earners | 2,292 (10.6%) | $250,001 |
| Total | 21,661 (100.0%) | $213,697 |
Household Income in Pleasanton
Household Income Brackets in Pleasanton
With 12,504 households falling in the category, the $200,000+ income range is the most frequent in Pleasanton, accounting for 44.9% of all households. In contrast, only 473 households (1.7%) fall into the $10,000 to $14,999 income bracket, making it the least populous group.
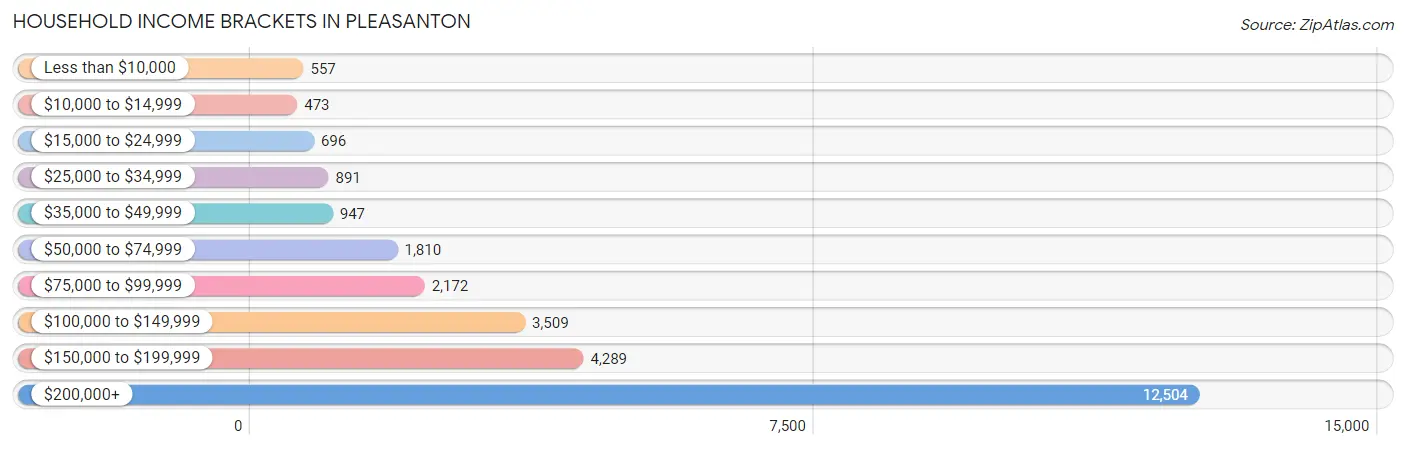
| Income Bracket | # Households | % Households |
| Less than $10,000 | 557 | 2.0% |
| $10,000 to $14,999 | 473 | 1.7% |
| $15,000 to $24,999 | 696 | 2.5% |
| $25,000 to $34,999 | 891 | 3.2% |
| $35,000 to $49,999 | 947 | 3.4% |
| $50,000 to $74,999 | 1,810 | 6.5% |
| $75,000 to $99,999 | 2,172 | 7.8% |
| $100,000 to $149,999 | 3,509 | 12.6% |
| $150,000 to $199,999 | 4,289 | 15.4% |
| $200,000+ | 12,504 | 44.9% |
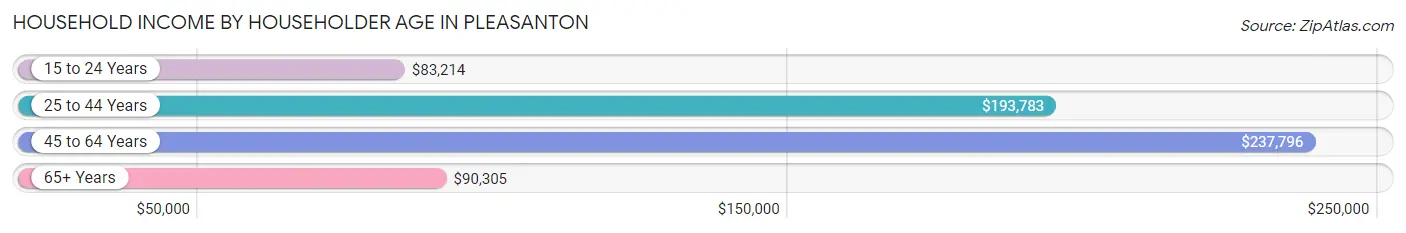
Household Income by Householder Age in Pleasanton
The median household income in Pleasanton is $181,639, with the highest median household income of $237,796 found in the 45 to 64 years age bracket for the primary householder. A total of 12,042 households (43.2%) fall into this category. Meanwhile, the 15 to 24 years age bracket for the primary householder has the lowest median household income of $83,214, with 138 households (0.5%) in this group.
| Income Bracket | # Households | Median Income |
| 15 to 24 Years | 138 (0.5%) | $83,214 |
| 25 to 44 Years | 8,862 (31.8%) | $193,783 |
| 45 to 64 Years | 12,042 (43.2%) | $237,796 |
| 65+ Years | 6,807 (24.4%) | $90,305 |
| Total | 27,849 (100.0%) | $181,639 |
Poverty in Pleasanton
Income Below Poverty by Sex and Age in Pleasanton
With 3.8% poverty level for males and 6.7% for females among the residents of Pleasanton, 15 year old males and 18 to 24 year old females are the most vulnerable to poverty, with 71 males (12.2%) and 429 females (18.8%) in their respective age groups living below the poverty level.
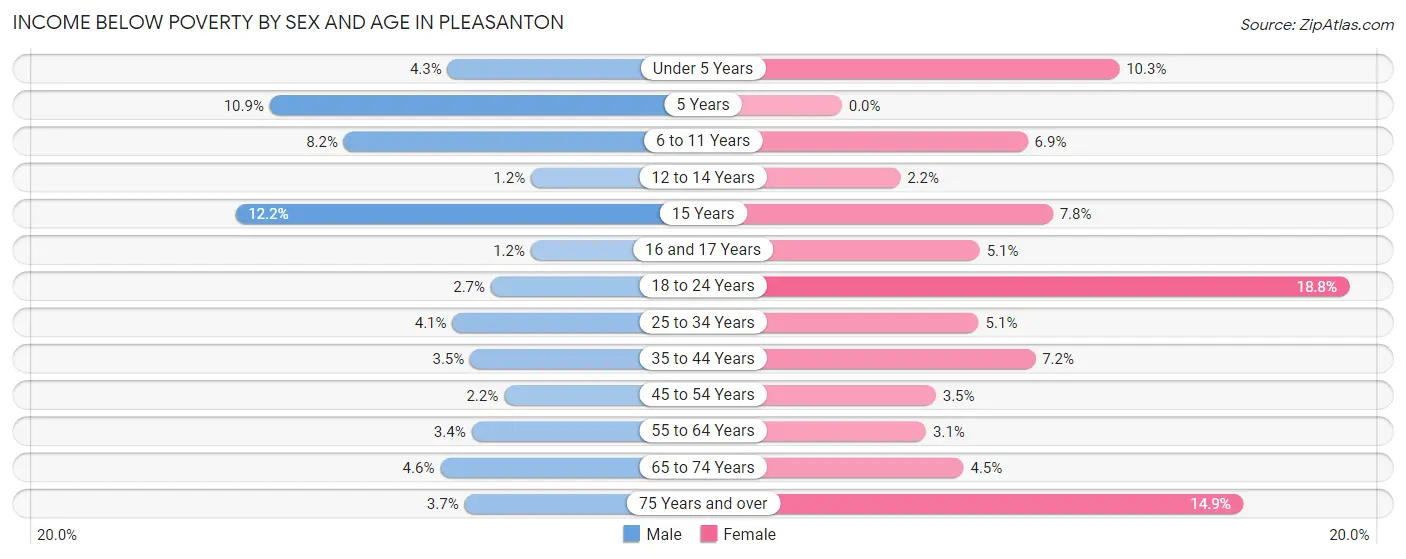
| Age Bracket | Male | Female |
| Under 5 Years | 74 (4.3%) | 187 (10.3%) |
| 5 Years | 57 (10.9%) | 0 (0.0%) |
| 6 to 11 Years | 252 (8.2%) | 234 (6.9%) |
| 12 to 14 Years | 24 (1.2%) | 40 (2.2%) |
| 15 Years | 71 (12.2%) | 39 (7.8%) |
| 16 and 17 Years | 15 (1.2%) | 63 (5.1%) |
| 18 to 24 Years | 65 (2.7%) | 429 (18.8%) |
| 25 to 34 Years | 172 (4.1%) | 210 (5.1%) |
| 35 to 44 Years | 210 (3.5%) | 436 (7.2%) |
| 45 to 54 Years | 137 (2.2%) | 204 (3.5%) |
| 55 to 64 Years | 183 (3.4%) | 161 (3.1%) |
| 65 to 74 Years | 134 (4.6%) | 167 (4.5%) |
| 75 Years and over | 88 (3.7%) | 490 (14.9%) |
| Total | 1,482 (3.8%) | 2,660 (6.7%) |
Income Above Poverty by Sex and Age in Pleasanton
According to the poverty statistics in Pleasanton, males aged 12 to 14 years and females aged 5 years are the age groups that are most secure financially, with 98.8% of males and 100.0% of females in these age groups living above the poverty line.
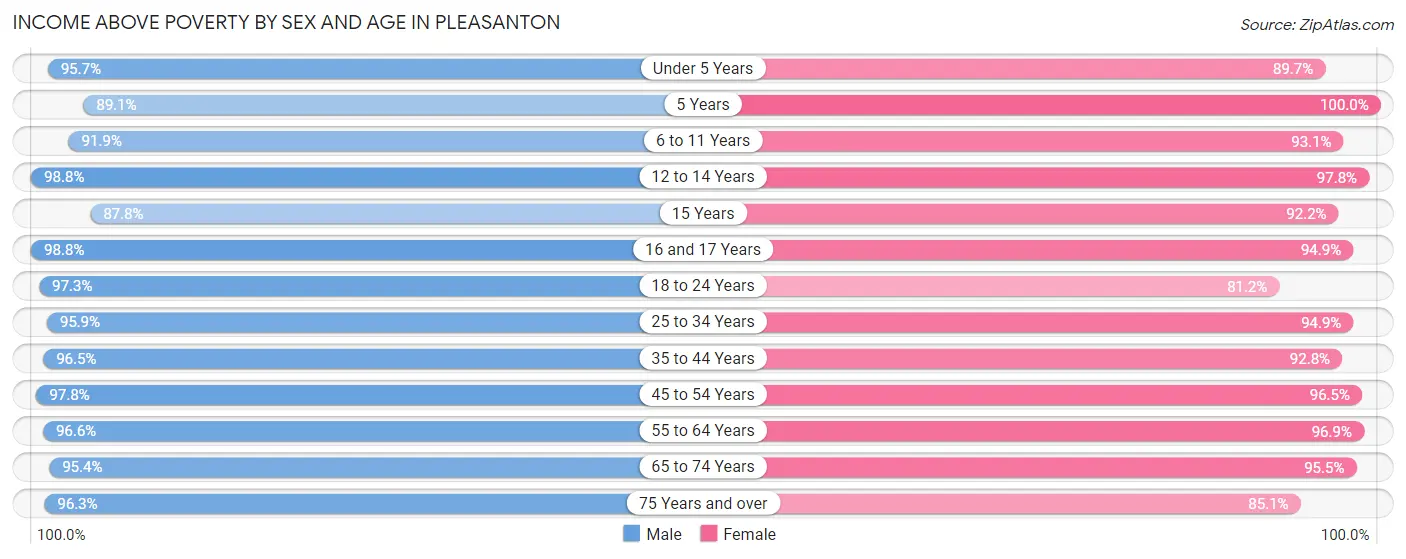
| Age Bracket | Male | Female |
| Under 5 Years | 1,647 (95.7%) | 1,628 (89.7%) |
| 5 Years | 466 (89.1%) | 494 (100.0%) |
| 6 to 11 Years | 2,839 (91.8%) | 3,155 (93.1%) |
| 12 to 14 Years | 1,969 (98.8%) | 1,800 (97.8%) |
| 15 Years | 512 (87.8%) | 459 (92.2%) |
| 16 and 17 Years | 1,228 (98.8%) | 1,167 (94.9%) |
| 18 to 24 Years | 2,348 (97.3%) | 1,851 (81.2%) |
| 25 to 34 Years | 4,007 (95.9%) | 3,923 (94.9%) |
| 35 to 44 Years | 5,859 (96.5%) | 5,637 (92.8%) |
| 45 to 54 Years | 6,092 (97.8%) | 5,639 (96.5%) |
| 55 to 64 Years | 5,183 (96.6%) | 4,990 (96.9%) |
| 65 to 74 Years | 2,799 (95.4%) | 3,525 (95.5%) |
| 75 Years and over | 2,309 (96.3%) | 2,802 (85.1%) |
| Total | 37,258 (96.2%) | 37,070 (93.3%) |
Income Below Poverty Among Married-Couple Families in Pleasanton
The poverty statistics for married-couple families in Pleasanton show that 1.9% or 368 of the total 18,880 families live below the poverty line. Families with 3 or 4 children have the highest poverty rate of 6.0%, comprising of 51 families. On the other hand, families with 5 or more children have the lowest poverty rate of 0.0%, which includes 0 families.
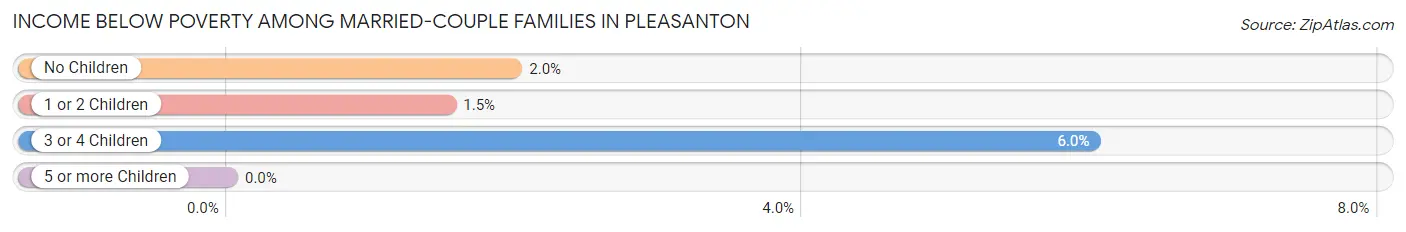
| Children | Above Poverty | Below Poverty |
| No Children | 9,195 (98.0%) | 186 (2.0%) |
| 1 or 2 Children | 8,491 (98.5%) | 131 (1.5%) |
| 3 or 4 Children | 798 (94.0%) | 51 (6.0%) |
| 5 or more Children | 28 (100.0%) | 0 (0.0%) |
| Total | 18,512 (98.1%) | 368 (1.9%) |
Income Below Poverty Among Single-Parent Households in Pleasanton
According to the poverty data in Pleasanton, 1.4% or 14 single-father households and 13.0% or 235 single-mother households are living below the poverty line. Among single-father households, those with 1 or 2 children have the highest poverty rate, with 14 households (2.6%) experiencing poverty. Likewise, among single-mother households, those with 1 or 2 children have the highest poverty rate, with 188 households (22.9%) falling below the poverty line.
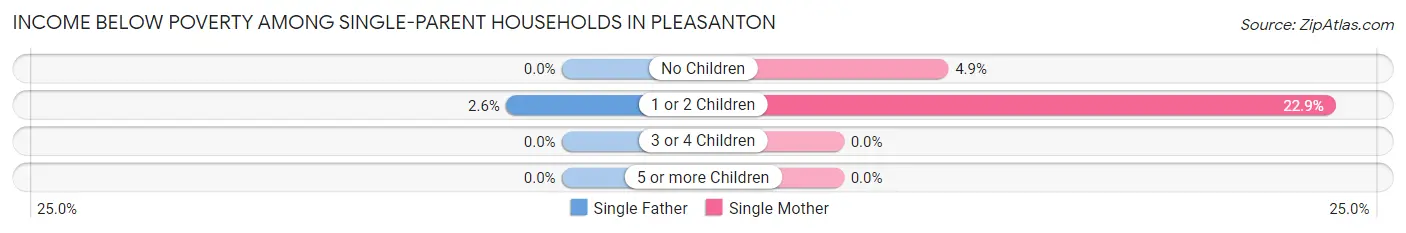
| Children | Single Father | Single Mother |
| No Children | 0 (0.0%) | 47 (4.9%) |
| 1 or 2 Children | 14 (2.6%) | 188 (22.9%) |
| 3 or 4 Children | 0 (0.0%) | 0 (0.0%) |
| 5 or more Children | 0 (0.0%) | 0 (0.0%) |
| Total | 14 (1.4%) | 235 (13.0%) |
Income Below Poverty Among Married-Couple vs Single-Parent Households in Pleasanton
The poverty data for Pleasanton shows that 368 of the married-couple family households (1.9%) and 249 of the single-parent households (8.9%) are living below the poverty level. Within the married-couple family households, those with 3 or 4 children have the highest poverty rate, with 51 households (6.0%) falling below the poverty line. Among the single-parent households, those with 1 or 2 children have the highest poverty rate, with 202 household (14.9%) living below poverty.
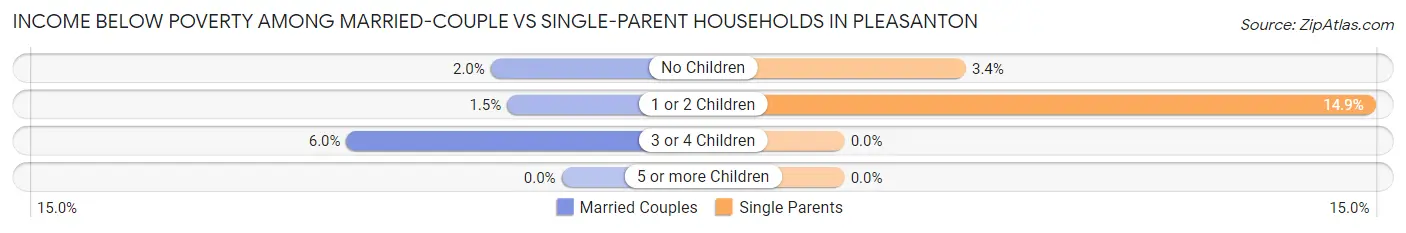
| Children | Married-Couple Families | Single-Parent Households |
| No Children | 186 (2.0%) | 47 (3.4%) |
| 1 or 2 Children | 131 (1.5%) | 202 (14.9%) |
| 3 or 4 Children | 51 (6.0%) | 0 (0.0%) |
| 5 or more Children | 0 (0.0%) | 0 (0.0%) |
| Total | 368 (1.9%) | 249 (8.9%) |
Race in Pleasanton
The most populous races in Pleasanton are White / Caucasian (35,934 | 45.7%), Asian (32,368 | 41.1%), and Hispanic or Latino (8,882 | 11.3%).
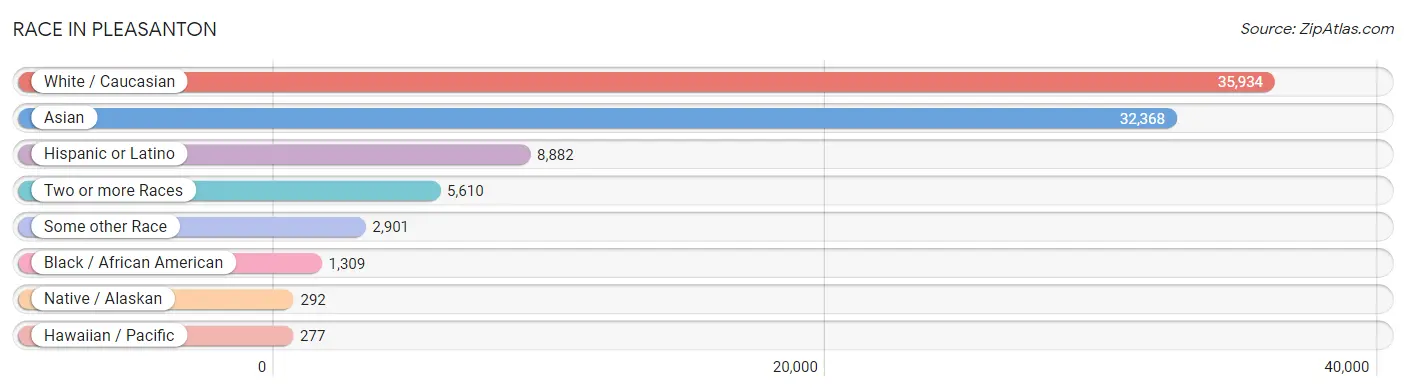
| Race | # Population | % Population |
| Asian | 32,368 | 41.1% |
| Black / African American | 1,309 | 1.7% |
| Hawaiian / Pacific | 277 | 0.4% |
| Hispanic or Latino | 8,882 | 11.3% |
| Native / Alaskan | 292 | 0.4% |
| White / Caucasian | 35,934 | 45.7% |
| Two or more Races | 5,610 | 7.1% |
| Some other Race | 2,901 | 3.7% |
| Total | 78,691 | 100.0% |
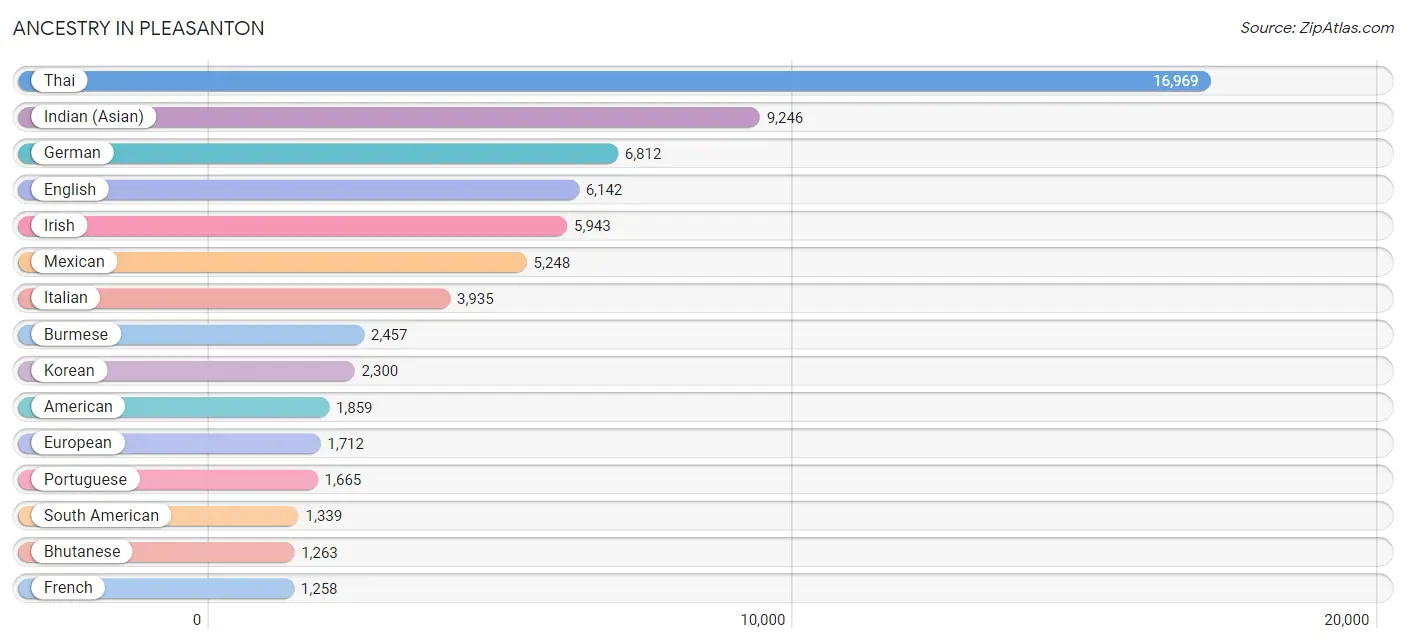
Ancestry in Pleasanton
The most populous ancestries reported in Pleasanton are Thai (16,969 | 21.6%), Indian (Asian) (9,246 | 11.7%), German (6,812 | 8.7%), English (6,142 | 7.8%), and Irish (5,943 | 7.5%), together accounting for 57.3% of all Pleasanton residents.
| Ancestry | # Population | % Population |
| Afghan | 341 | 0.4% |
| African | 171 | 0.2% |
| Alsatian | 27 | 0.0% |
| American | 1,859 | 2.4% |
| Apache | 80 | 0.1% |
| Arab | 593 | 0.7% |
| Argentinean | 84 | 0.1% |
| Armenian | 26 | 0.0% |
| Assyrian / Chaldean / Syriac | 16 | 0.0% |
| Australian | 27 | 0.0% |
| Austrian | 185 | 0.2% |
| Bangladeshi | 28 | 0.0% |
| Basque | 41 | 0.1% |
| Belgian | 22 | 0.0% |
| Bhutanese | 1,263 | 1.6% |
| Blackfeet | 19 | 0.0% |
| Bolivian | 82 | 0.1% |
| Brazilian | 75 | 0.1% |
| British | 948 | 1.2% |
| Bulgarian | 37 | 0.1% |
| Burmese | 2,457 | 3.1% |
| Cambodian | 25 | 0.0% |
| Canadian | 191 | 0.2% |
| Central American | 357 | 0.4% |
| Central American Indian | 122 | 0.2% |
| Cherokee | 83 | 0.1% |
| Chilean | 229 | 0.3% |
| Chippewa | 9 | 0.0% |
| Choctaw | 103 | 0.1% |
| Colombian | 336 | 0.4% |
| Comanche | 10 | 0.0% |
| Creek | 25 | 0.0% |
| Croatian | 135 | 0.2% |
| Cuban | 186 | 0.2% |
| Czech | 116 | 0.2% |
| Czechoslovakian | 10 | 0.0% |
| Danish | 464 | 0.6% |
| Dominican | 41 | 0.1% |
| Dutch | 609 | 0.8% |
| Eastern European | 148 | 0.2% |
| Egyptian | 219 | 0.3% |
| English | 6,142 | 7.8% |
| Estonian | 9 | 0.0% |
| Ethiopian | 73 | 0.1% |
| European | 1,712 | 2.2% |
| Filipino | 694 | 0.9% |
| Finnish | 243 | 0.3% |
| French | 1,258 | 1.6% |
| French Canadian | 256 | 0.3% |
| German | 6,812 | 8.7% |
| Ghanaian | 23 | 0.0% |
| Greek | 845 | 1.1% |
| Guamanian / Chamorro | 191 | 0.2% |
| Guatemalan | 49 | 0.1% |
| Honduran | 43 | 0.1% |
| Hungarian | 320 | 0.4% |
| Indian (Asian) | 9,246 | 11.7% |
| Indonesian | 33 | 0.0% |
| Iranian | 743 | 0.9% |
| Iraqi | 25 | 0.0% |
| Irish | 5,943 | 7.5% |
| Israeli | 69 | 0.1% |
| Italian | 3,935 | 5.0% |
| Jamaican | 160 | 0.2% |
| Jordanian | 77 | 0.1% |
| Korean | 2,300 | 2.9% |
| Laotian | 64 | 0.1% |
| Latvian | 21 | 0.0% |
| Lebanese | 120 | 0.2% |
| Lithuanian | 150 | 0.2% |
| Macedonian | 4 | 0.0% |
| Malaysian | 24 | 0.0% |
| Maltese | 9 | 0.0% |
| Mexican | 5,248 | 6.7% |
| Mexican American Indian | 123 | 0.2% |
| Native Hawaiian | 176 | 0.2% |
| Navajo | 4 | 0.0% |
| Nepalese | 24 | 0.0% |
| Nicaraguan | 69 | 0.1% |
| Northern European | 270 | 0.3% |
| Norwegian | 807 | 1.0% |
| Ottawa | 5 | 0.0% |
| Pakistani | 108 | 0.1% |
| Panamanian | 3 | 0.0% |
| Peruvian | 414 | 0.5% |
| Polish | 998 | 1.3% |
| Portuguese | 1,665 | 2.1% |
| Potawatomi | 21 | 0.0% |
| Puerto Rican | 765 | 1.0% |
| Romanian | 207 | 0.3% |
| Russian | 670 | 0.9% |
| Salvadoran | 193 | 0.3% |
| Samoan | 20 | 0.0% |
| Scandinavian | 153 | 0.2% |
| Scotch-Irish | 350 | 0.4% |
| Scottish | 1,086 | 1.4% |
| Seminole | 25 | 0.0% |
| Serbian | 55 | 0.1% |
| Slavic | 25 | 0.0% |
| Slovak | 56 | 0.1% |
| Slovene | 73 | 0.1% |
| South American | 1,339 | 1.7% |
| South American Indian | 88 | 0.1% |
| Spaniard | 423 | 0.5% |
| Spanish | 337 | 0.4% |
| Sri Lankan | 983 | 1.3% |
| Subsaharan African | 267 | 0.3% |
| Swedish | 1,040 | 1.3% |
| Swiss | 392 | 0.5% |
| Thai | 16,969 | 21.6% |
| Tohono O'Odham | 9 | 0.0% |
| Tongan | 3 | 0.0% |
| Trinidadian and Tobagonian | 44 | 0.1% |
| Turkish | 76 | 0.1% |
| Ukrainian | 259 | 0.3% |
| Ute | 30 | 0.0% |
| Venezuelan | 170 | 0.2% |
| Vietnamese | 71 | 0.1% |
| Welsh | 347 | 0.4% |
| Yugoslavian | 139 | 0.2% | View All 120 Rows |
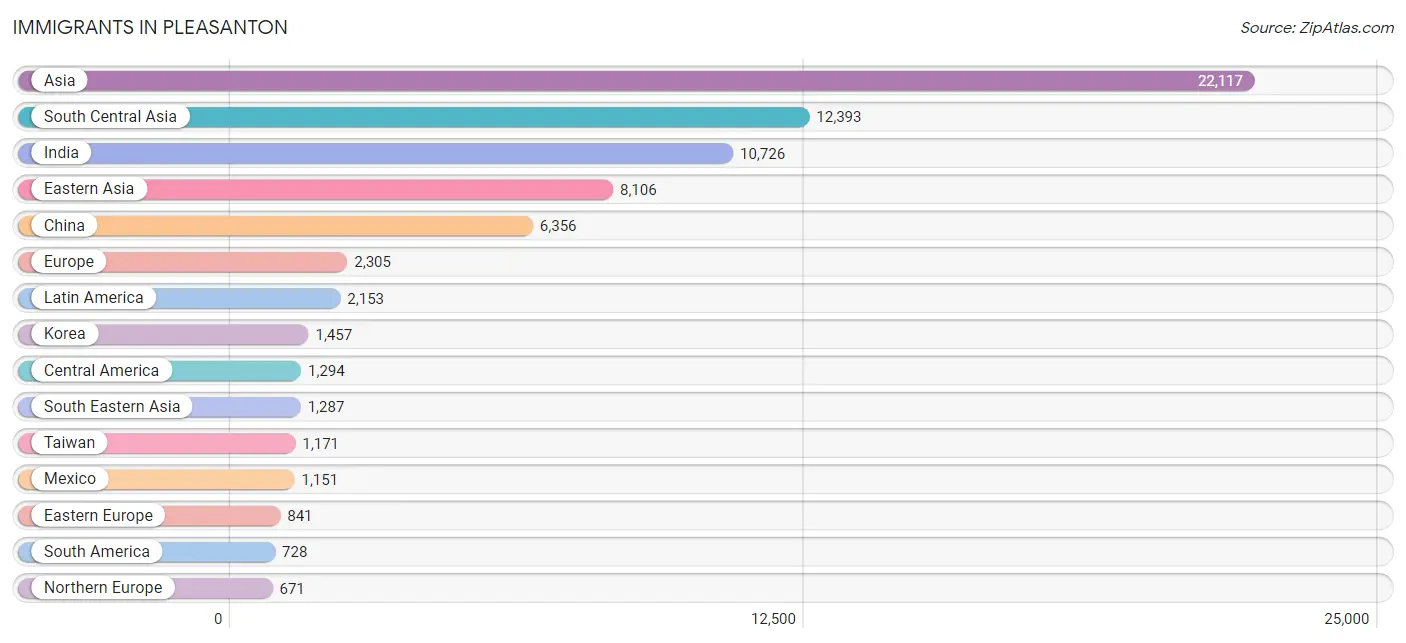
Immigrants in Pleasanton
The most numerous immigrant groups reported in Pleasanton came from Asia (22,117 | 28.1%), South Central Asia (12,393 | 15.8%), India (10,726 | 13.6%), Eastern Asia (8,106 | 10.3%), and China (6,356 | 8.1%), together accounting for 75.9% of all Pleasanton residents.
| Immigration Origin | # Population | % Population |
| Afghanistan | 473 | 0.6% |
| Africa | 402 | 0.5% |
| Argentina | 37 | 0.1% |
| Asia | 22,117 | 28.1% |
| Australia | 55 | 0.1% |
| Austria | 9 | 0.0% |
| Azores | 42 | 0.1% |
| Bangladesh | 216 | 0.3% |
| Belarus | 56 | 0.1% |
| Belgium | 27 | 0.0% |
| Bolivia | 82 | 0.1% |
| Bosnia and Herzegovina | 80 | 0.1% |
| Brazil | 148 | 0.2% |
| Bulgaria | 20 | 0.0% |
| Canada | 366 | 0.5% |
| Caribbean | 131 | 0.2% |
| Central America | 1,294 | 1.6% |
| Chile | 34 | 0.0% |
| China | 6,356 | 8.1% |
| Colombia | 17 | 0.0% |
| Congo | 19 | 0.0% |
| Croatia | 14 | 0.0% |
| Cuba | 22 | 0.0% |
| Czechoslovakia | 34 | 0.0% |
| Denmark | 15 | 0.0% |
| Eastern Africa | 138 | 0.2% |
| Eastern Asia | 8,106 | 10.3% |
| Eastern Europe | 841 | 1.1% |
| Egypt | 156 | 0.2% |
| El Salvador | 37 | 0.1% |
| England | 163 | 0.2% |
| Ethiopia | 100 | 0.1% |
| Europe | 2,305 | 2.9% |
| Fiji | 123 | 0.2% |
| France | 78 | 0.1% |
| Germany | 163 | 0.2% |
| Ghana | 23 | 0.0% |
| Greece | 27 | 0.0% |
| Guatemala | 49 | 0.1% |
| Honduras | 39 | 0.1% |
| Hong Kong | 350 | 0.4% |
| India | 10,726 | 13.6% |
| Indonesia | 65 | 0.1% |
| Iran | 479 | 0.6% |
| Iraq | 41 | 0.1% |
| Ireland | 19 | 0.0% |
| Israel | 104 | 0.1% |
| Italy | 119 | 0.2% |
| Jamaica | 77 | 0.1% |
| Japan | 268 | 0.3% |
| Jordan | 101 | 0.1% |
| Kazakhstan | 30 | 0.0% |
| Kenya | 38 | 0.1% |
| Korea | 1,457 | 1.8% |
| Kuwait | 47 | 0.1% |
| Laos | 8 | 0.0% |
| Latin America | 2,153 | 2.7% |
| Malaysia | 59 | 0.1% |
| Mexico | 1,151 | 1.5% |
| Middle Africa | 19 | 0.0% |
| Morocco | 26 | 0.0% |
| Nepal | 17 | 0.0% |
| Netherlands | 105 | 0.1% |
| Nicaragua | 15 | 0.0% |
| Nigeria | 6 | 0.0% |
| Northern Africa | 182 | 0.2% |
| Northern Europe | 671 | 0.9% |
| Norway | 23 | 0.0% |
| Oceania | 185 | 0.2% |
| Pakistan | 376 | 0.5% |
| Panama | 3 | 0.0% |
| Peru | 232 | 0.3% |
| Philippines | 621 | 0.8% |
| Poland | 145 | 0.2% |
| Portugal | 179 | 0.2% |
| Romania | 86 | 0.1% |
| Russia | 342 | 0.4% |
| Scotland | 44 | 0.1% |
| Serbia | 20 | 0.0% |
| Singapore | 32 | 0.0% |
| South Africa | 34 | 0.0% |
| South America | 728 | 0.9% |
| South Central Asia | 12,393 | 15.8% |
| South Eastern Asia | 1,287 | 1.6% |
| Southern Europe | 334 | 0.4% |
| Spain | 9 | 0.0% |
| Sri Lanka | 50 | 0.1% |
| Sweden | 19 | 0.0% |
| Switzerland | 77 | 0.1% |
| Taiwan | 1,171 | 1.5% |
| Thailand | 41 | 0.1% |
| Trinidad and Tobago | 32 | 0.0% |
| Turkey | 31 | 0.0% |
| Ukraine | 40 | 0.1% |
| Uzbekistan | 26 | 0.0% |
| Venezuela | 132 | 0.2% |
| Vietnam | 443 | 0.6% |
| Western Africa | 29 | 0.0% |
| Western Asia | 331 | 0.4% |
| Western Europe | 459 | 0.6% | View All 100 Rows |
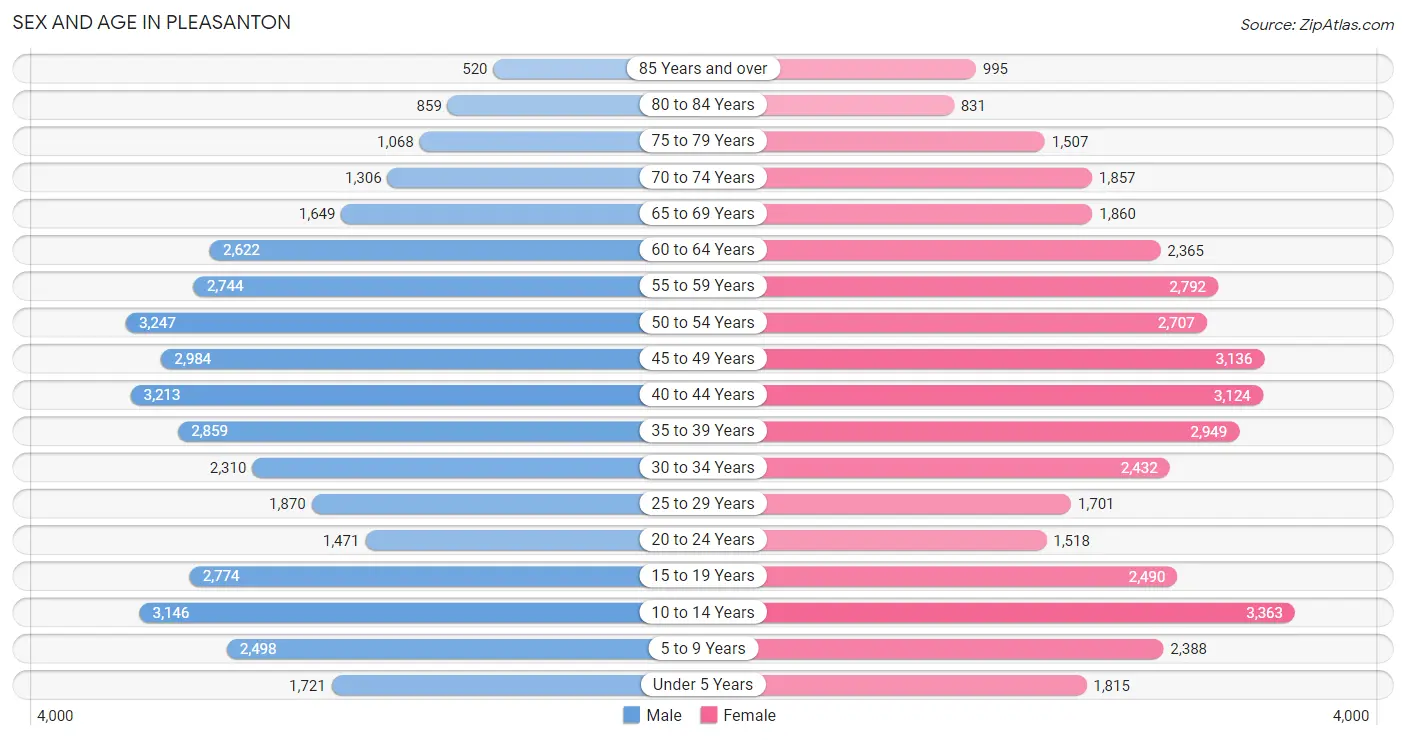
Sex and Age in Pleasanton
Sex and Age in Pleasanton
The most populous age groups in Pleasanton are 50 to 54 Years (3,247 | 8.4%) for men and 10 to 14 Years (3,363 | 8.4%) for women.
| Age Bracket | Male | Female |
| Under 5 Years | 1,721 (4.4%) | 1,815 (4.6%) |
| 5 to 9 Years | 2,498 (6.4%) | 2,388 (6.0%) |
| 10 to 14 Years | 3,146 (8.1%) | 3,363 (8.4%) |
| 15 to 19 Years | 2,774 (7.1%) | 2,490 (6.2%) |
| 20 to 24 Years | 1,471 (3.8%) | 1,518 (3.8%) |
| 25 to 29 Years | 1,870 (4.8%) | 1,701 (4.3%) |
| 30 to 34 Years | 2,310 (5.9%) | 2,432 (6.1%) |
| 35 to 39 Years | 2,859 (7.4%) | 2,949 (7.4%) |
| 40 to 44 Years | 3,213 (8.3%) | 3,124 (7.8%) |
| 45 to 49 Years | 2,984 (7.7%) | 3,136 (7.9%) |
| 50 to 54 Years | 3,247 (8.4%) | 2,707 (6.8%) |
| 55 to 59 Years | 2,744 (7.1%) | 2,792 (7.0%) |
| 60 to 64 Years | 2,622 (6.8%) | 2,365 (5.9%) |
| 65 to 69 Years | 1,649 (4.2%) | 1,860 (4.7%) |
| 70 to 74 Years | 1,306 (3.4%) | 1,857 (4.7%) |
| 75 to 79 Years | 1,068 (2.8%) | 1,507 (3.8%) |
| 80 to 84 Years | 859 (2.2%) | 831 (2.1%) |
| 85 Years and over | 520 (1.3%) | 995 (2.5%) |
| Total | 38,861 (100.0%) | 39,830 (100.0%) |
Families and Households in Pleasanton
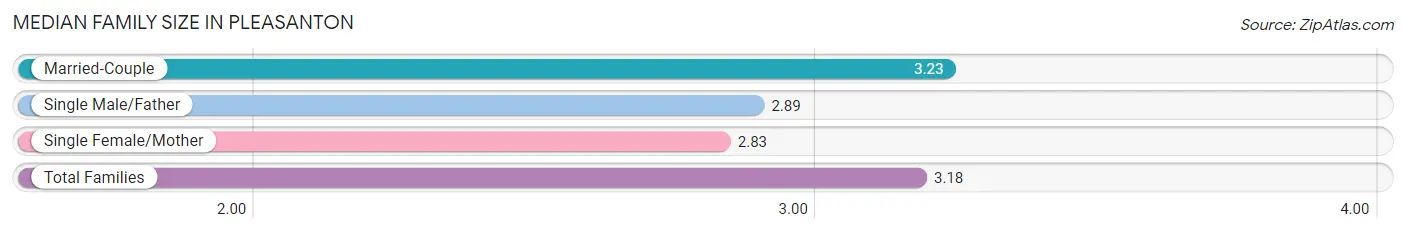
Median Family Size in Pleasanton
The median family size in Pleasanton is 3.18 persons per family, with married-couple families (18,880 | 87.2%) accounting for the largest median family size of 3.23 persons per family. On the other hand, single female/mother families (1,808 | 8.4%) represent the smallest median family size with 2.83 persons per family.
| Family Type | # Families | Family Size |
| Married-Couple | 18,880 (87.2%) | 3.23 |
| Single Male/Father | 973 (4.5%) | 2.89 |
| Single Female/Mother | 1,808 (8.4%) | 2.83 |
| Total Families | 21,661 (100.0%) | 3.18 |
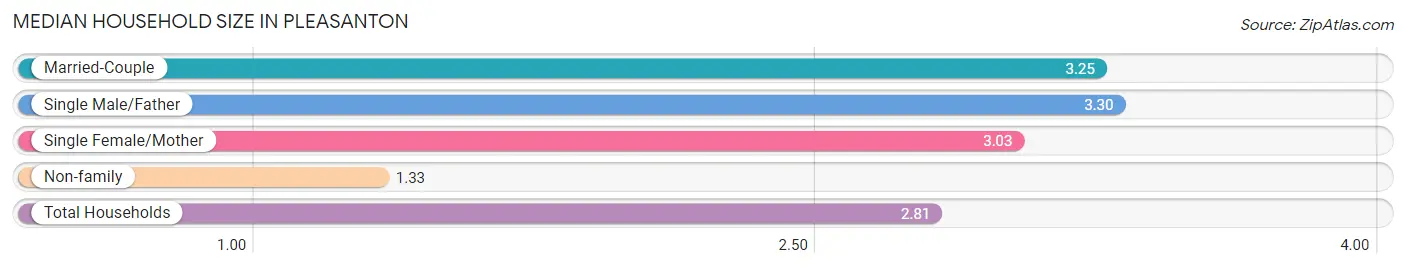
Median Household Size in Pleasanton
The median household size in Pleasanton is 2.81 persons per household, with single male/father households (973 | 3.5%) accounting for the largest median household size of 3.3 persons per household. non-family households (6,188 | 22.2%) represent the smallest median household size with 1.33 persons per household.
| Household Type | # Households | Household Size |
| Married-Couple | 18,880 (67.8%) | 3.25 |
| Single Male/Father | 973 (3.5%) | 3.30 |
| Single Female/Mother | 1,808 (6.5%) | 3.03 |
| Non-family | 6,188 (22.2%) | 1.33 |
| Total Households | 27,849 (100.0%) | 2.81 |
Household Size by Marriage Status in Pleasanton
Out of a total of 27,849 households in Pleasanton, 21,661 (77.8%) are family households, while 6,188 (22.2%) are nonfamily households. The most numerous type of family households are 2-person households, comprising 8,188, and the most common type of nonfamily households are 1-person households, comprising 5,059.
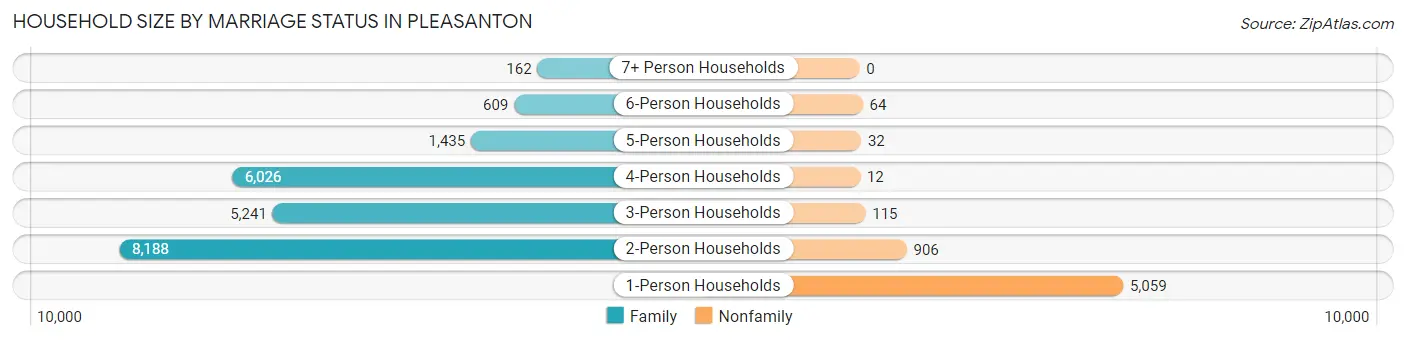
| Household Size | Family Households | Nonfamily Households |
| 1-Person Households | - | 5,059 (18.2%) |
| 2-Person Households | 8,188 (29.4%) | 906 (3.3%) |
| 3-Person Households | 5,241 (18.8%) | 115 (0.4%) |
| 4-Person Households | 6,026 (21.6%) | 12 (0.0%) |
| 5-Person Households | 1,435 (5.1%) | 32 (0.1%) |
| 6-Person Households | 609 (2.2%) | 64 (0.2%) |
| 7+ Person Households | 162 (0.6%) | 0 (0.0%) |
| Total | 21,661 (77.8%) | 6,188 (22.2%) |
Female Fertility in Pleasanton
Fertility by Age in Pleasanton
Average fertility rate in Pleasanton is 50.0 births per 1,000 women. Women in the age bracket of 20 to 34 years have the highest fertility rate with 92.0 births per 1,000 women. Women in the age bracket of 20 to 34 years acount for 58.7% of all women with births.
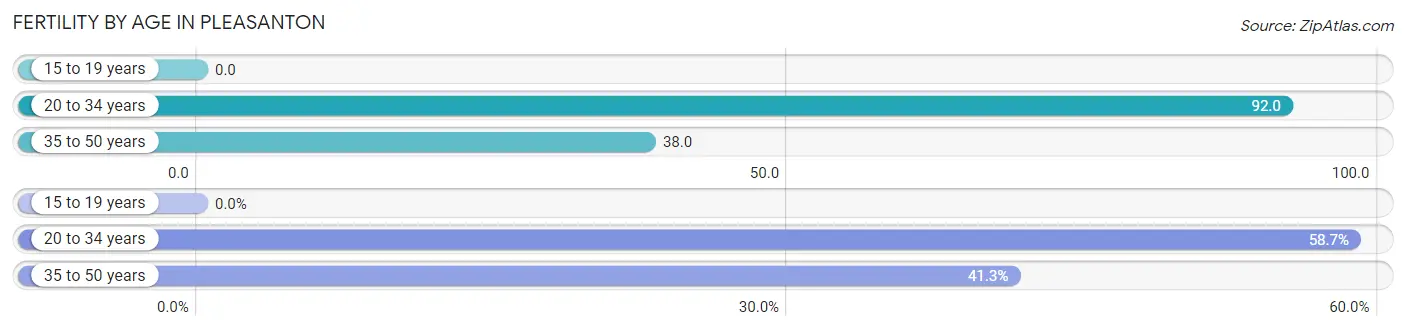
| Age Bracket | Women with Births | Births / 1,000 Women |
| 15 to 19 years | 0 (0.0%) | 0.0 |
| 20 to 34 years | 521 (58.7%) | 92.0 |
| 35 to 50 years | 367 (41.3%) | 38.0 |
| Total | 888 (100.0%) | 50.0 |
Fertility by Age by Marriage Status in Pleasanton
98.1% of women with births (888) in Pleasanton are married. The highest percentage of unmarried women with births falls into 35 to 50 years age bracket with 3.0% of them unmarried at the time of birth, while the lowest percentage of unmarried women with births belong to 20 to 34 years age bracket with 1.1% of them unmarried.
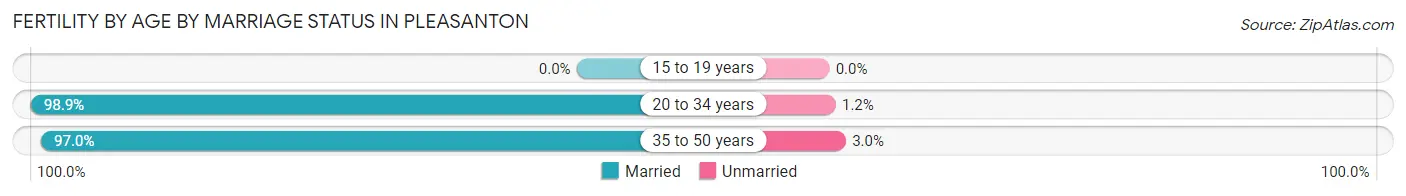
| Age Bracket | Married | Unmarried |
| 15 to 19 years | 0 (0.0%) | 0 (0.0%) |
| 20 to 34 years | 515 (98.9%) | 6 (1.1%) |
| 35 to 50 years | 356 (97.0%) | 11 (3.0%) |
| Total | 871 (98.1%) | 17 (1.9%) |
Fertility by Education in Pleasanton
Average fertility rate in Pleasanton is 50.0 births per 1,000 women. Women with the education attainment of graduate degree have the highest fertility rate of 70.0 births per 1,000 women, while women with the education attainment of college or associate's degree have the lowest fertility at 12.0 births per 1,000 women. Women with the education attainment of graduate degree represent 40.2% of all women with births.
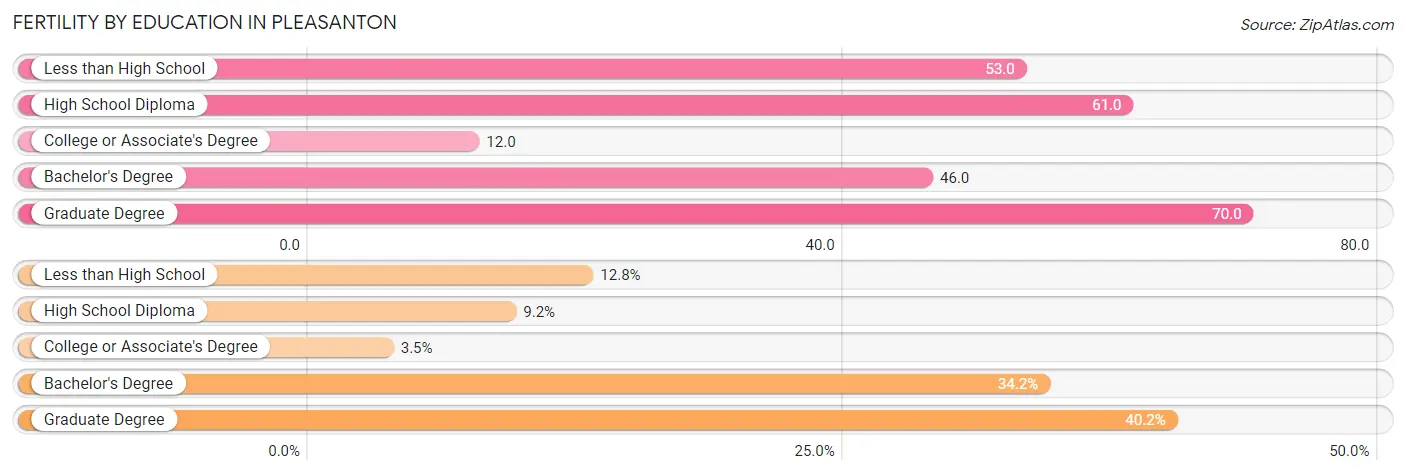
| Educational Attainment | Women with Births | Births / 1,000 Women |
| Less than High School | 114 (12.8%) | 53.0 |
| High School Diploma | 82 (9.2%) | 61.0 |
| College or Associate's Degree | 31 (3.5%) | 12.0 |
| Bachelor's Degree | 304 (34.2%) | 46.0 |
| Graduate Degree | 357 (40.2%) | 70.0 |
| Total | 888 (100.0%) | 50.0 |
Fertility by Education by Marriage Status in Pleasanton
1.9% of women with births in Pleasanton are unmarried. Women with the educational attainment of less than high school are most likely to be married with 100.0% of them married at childbirth, while women with the educational attainment of college or associate's degree are least likely to be married with 54.8% of them unmarried at childbirth.

| Educational Attainment | Married | Unmarried |
| Less than High School | 114 (100.0%) | 0 (0.0%) |
| High School Diploma | 82 (100.0%) | 0 (0.0%) |
| College or Associate's Degree | 14 (45.2%) | 17 (54.8%) |
| Bachelor's Degree | 304 (100.0%) | 0 (0.0%) |
| Graduate Degree | 357 (100.0%) | 0 (0.0%) |
| Total | 871 (98.1%) | 17 (1.9%) |
Employment Characteristics in Pleasanton
Employment by Class of Employer in Pleasanton
Among the 38,796 employed individuals in Pleasanton, private company employees (28,461 | 73.4%), not-for-profit organizations (2,585 | 6.7%), and local government employees (2,282 | 5.9%) make up the most common classes of employment.
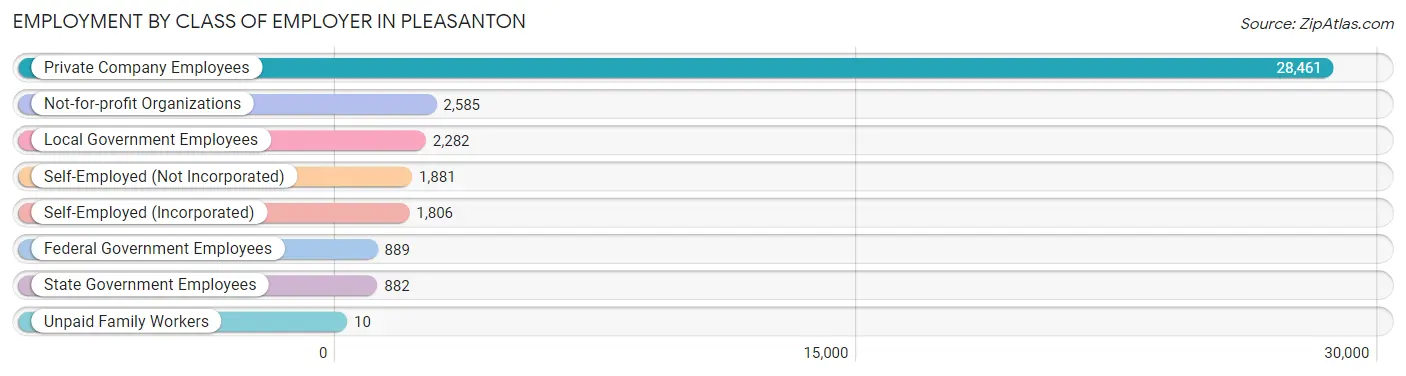
| Employer Class | # Employees | % Employees |
| Private Company Employees | 28,461 | 73.4% |
| Self-Employed (Incorporated) | 1,806 | 4.7% |
| Self-Employed (Not Incorporated) | 1,881 | 4.9% |
| Not-for-profit Organizations | 2,585 | 6.7% |
| Local Government Employees | 2,282 | 5.9% |
| State Government Employees | 882 | 2.3% |
| Federal Government Employees | 889 | 2.3% |
| Unpaid Family Workers | 10 | 0.0% |
| Total | 38,796 | 100.0% |
Employment Status by Age in Pleasanton
According to the labor force statistics for Pleasanton, out of the total population over 16 years of age (62,677), 65.9% or 41,304 individuals are in the labor force, with 4.2% or 1,735 of them unemployed. The age group with the highest labor force participation rate is 25 to 29 years, with 89.8% or 3,207 individuals in the labor force. Within the labor force, the 20 to 24 years age range has the highest percentage of unemployed individuals, with 11.5% or 245 of them being unemployed.
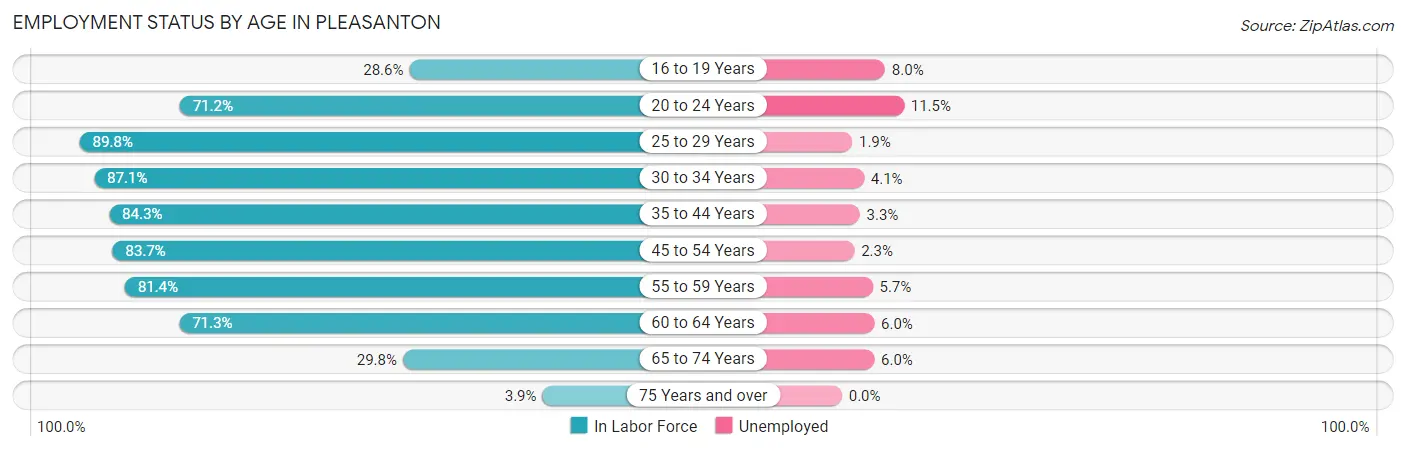
| Age Bracket | In Labor Force | Unemployed |
| 16 to 19 Years | 1,196 (28.6%) | 96 (8.0%) |
| 20 to 24 Years | 2,128 (71.2%) | 245 (11.5%) |
| 25 to 29 Years | 3,207 (89.8%) | 61 (1.9%) |
| 30 to 34 Years | 4,130 (87.1%) | 169 (4.1%) |
| 35 to 44 Years | 10,238 (84.3%) | 338 (3.3%) |
| 45 to 54 Years | 10,106 (83.7%) | 232 (2.3%) |
| 55 to 59 Years | 4,506 (81.4%) | 257 (5.7%) |
| 60 to 64 Years | 3,556 (71.3%) | 213 (6.0%) |
| 65 to 74 Years | 1,988 (29.8%) | 119 (6.0%) |
| 75 Years and over | 225 (3.9%) | 0 (0.0%) |
| Total | 41,304 (65.9%) | 1,735 (4.2%) |
Employment Status by Educational Attainment in Pleasanton
According to labor force statistics for Pleasanton, 83.0% of individuals (35,736) out of the total population between 25 and 64 years of age (43,055) are in the labor force, with 3.6% or 1,286 of them being unemployed. The group with the highest labor force participation rate are those with the educational attainment of bachelor's degree or higher, with 84.4% or 26,755 individuals in the labor force. Within the labor force, individuals with college / associate degree education have the highest percentage of unemployment, with 9.9% or 580 of them being unemployed.
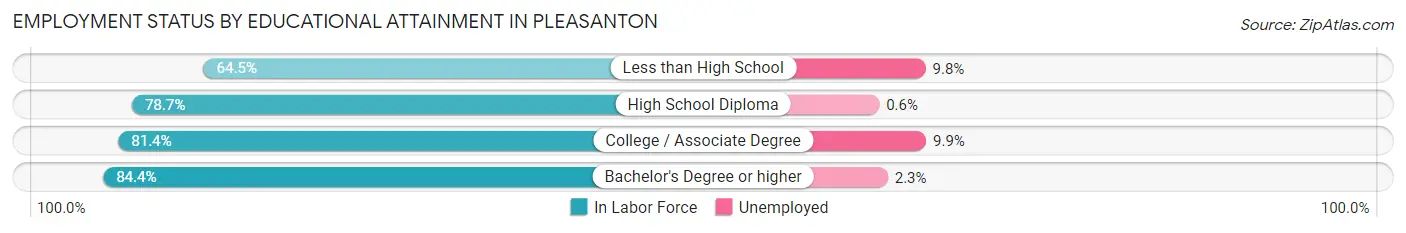
| Educational Attainment | In Labor Force | Unemployed |
| Less than High School | 611 (64.5%) | 93 (9.8%) |
| High School Diploma | 2,531 (78.7%) | 19 (0.6%) |
| College / Associate Degree | 5,854 (81.4%) | 712 (9.9%) |
| Bachelor's Degree or higher | 26,755 (84.4%) | 729 (2.3%) |
| Total | 35,736 (83.0%) | 1,550 (3.6%) |
Employment Occupations by Sex in Pleasanton
Management, Business, Science and Arts Occupations
The most common Management, Business, Science and Arts occupations in Pleasanton are Computers, Engineering & Science (8,731 | 22.1%), Management (7,892 | 20.0%), Computers & Mathematics (4,904 | 12.4%), Community & Social Service (4,265 | 10.8%), and Business & Financial (3,473 | 8.8%).
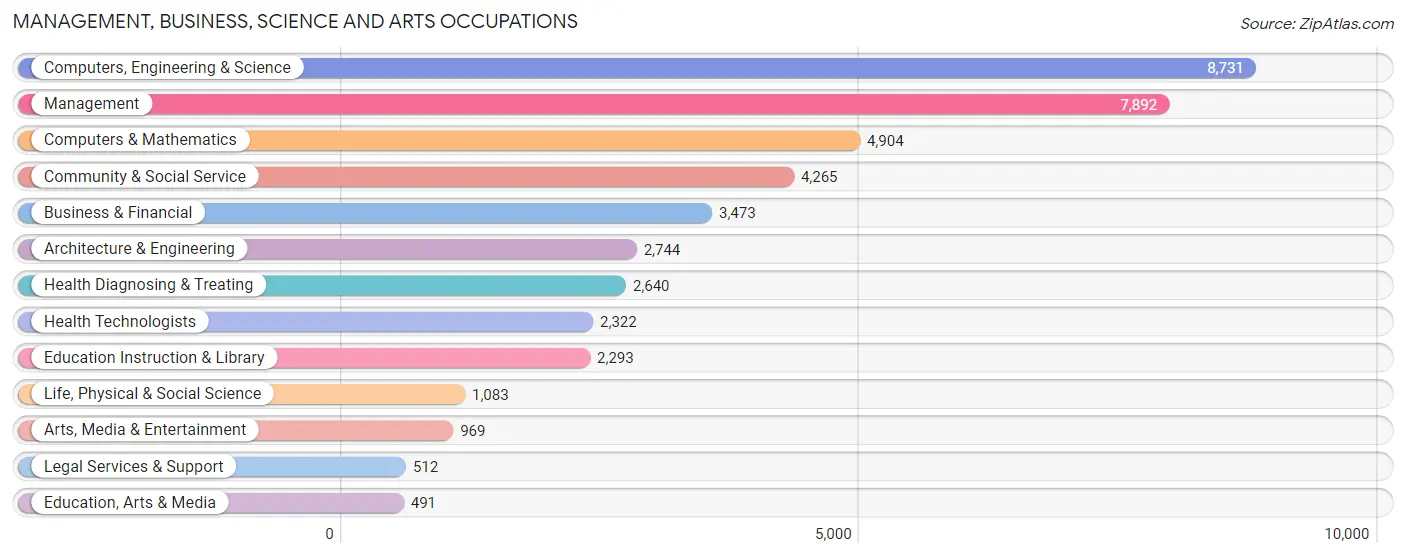
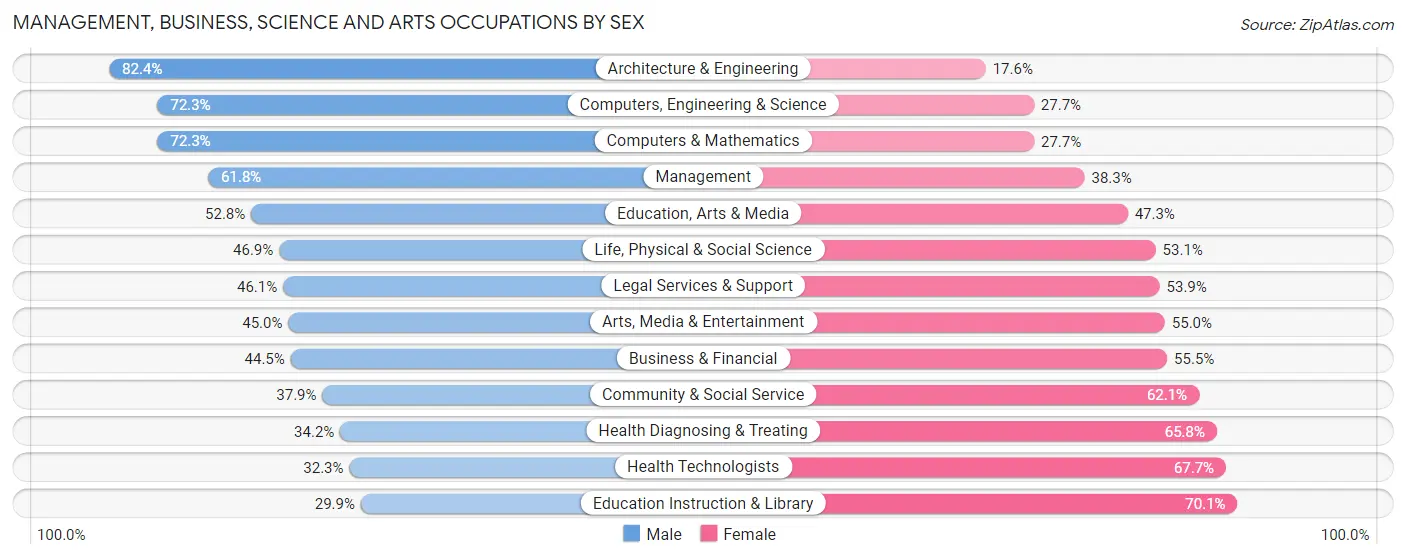
Management, Business, Science and Arts Occupations by Sex
Within the Management, Business, Science and Arts occupations in Pleasanton, the most male-oriented occupations are Architecture & Engineering (82.4%), Computers, Engineering & Science (72.3%), and Computers & Mathematics (72.3%), while the most female-oriented occupations are Education Instruction & Library (70.1%), Health Technologists (67.7%), and Health Diagnosing & Treating (65.8%).
| Occupation | Male | Female |
| Management | 4,873 (61.8%) | 3,019 (38.3%) |
| Business & Financial | 1,546 (44.5%) | 1,927 (55.5%) |
| Computers, Engineering & Science | 6,313 (72.3%) | 2,418 (27.7%) |
| Computers & Mathematics | 3,545 (72.3%) | 1,359 (27.7%) |
| Architecture & Engineering | 2,260 (82.4%) | 484 (17.6%) |
| Life, Physical & Social Science | 508 (46.9%) | 575 (53.1%) |
| Community & Social Service | 1,616 (37.9%) | 2,649 (62.1%) |
| Education, Arts & Media | 259 (52.7%) | 232 (47.2%) |
| Legal Services & Support | 236 (46.1%) | 276 (53.9%) |
| Education Instruction & Library | 685 (29.9%) | 1,608 (70.1%) |
| Arts, Media & Entertainment | 436 (45.0%) | 533 (55.0%) |
| Health Diagnosing & Treating | 902 (34.2%) | 1,738 (65.8%) |
| Health Technologists | 749 (32.3%) | 1,573 (67.7%) |
| Total (Category) | 15,250 (56.5%) | 11,751 (43.5%) |
| Total (Overall) | 22,254 (56.3%) | 17,263 (43.7%) |
Services Occupations
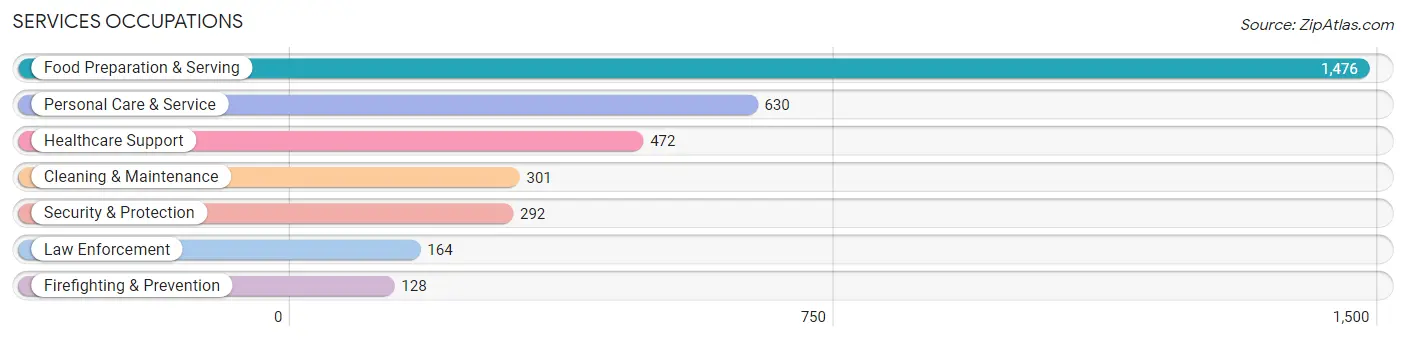
The most common Services occupations in Pleasanton are Food Preparation & Serving (1,476 | 3.7%), Personal Care & Service (630 | 1.6%), Healthcare Support (472 | 1.2%), Cleaning & Maintenance (301 | 0.8%), and Security & Protection (292 | 0.7%).
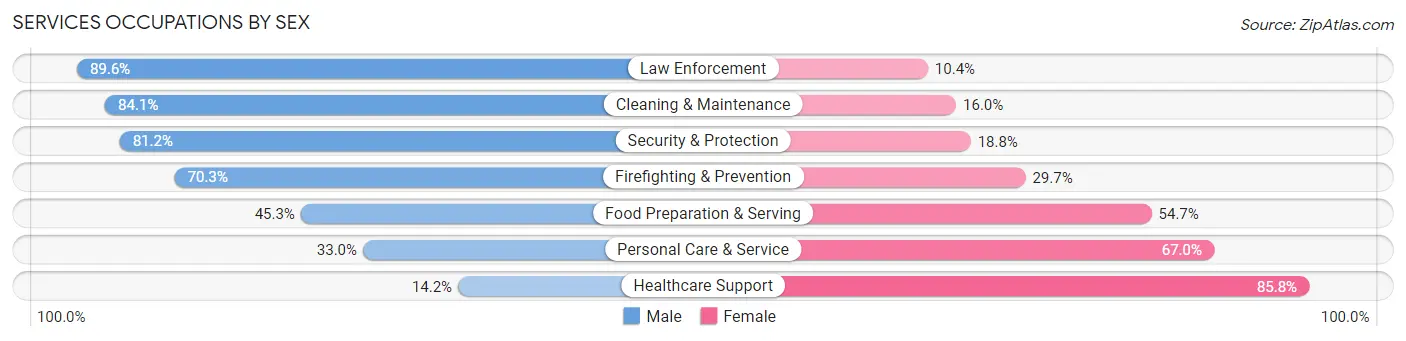
Services Occupations by Sex
Within the Services occupations in Pleasanton, the most male-oriented occupations are Law Enforcement (89.6%), Cleaning & Maintenance (84.1%), and Security & Protection (81.2%), while the most female-oriented occupations are Healthcare Support (85.8%), Personal Care & Service (67.0%), and Food Preparation & Serving (54.7%).
| Occupation | Male | Female |
| Healthcare Support | 67 (14.2%) | 405 (85.8%) |
| Security & Protection | 237 (81.2%) | 55 (18.8%) |
| Firefighting & Prevention | 90 (70.3%) | 38 (29.7%) |
| Law Enforcement | 147 (89.6%) | 17 (10.4%) |
| Food Preparation & Serving | 669 (45.3%) | 807 (54.7%) |
| Cleaning & Maintenance | 253 (84.1%) | 48 (16.0%) |
| Personal Care & Service | 208 (33.0%) | 422 (67.0%) |
| Total (Category) | 1,434 (45.2%) | 1,737 (54.8%) |
| Total (Overall) | 22,254 (56.3%) | 17,263 (43.7%) |
Sales and Office Occupations
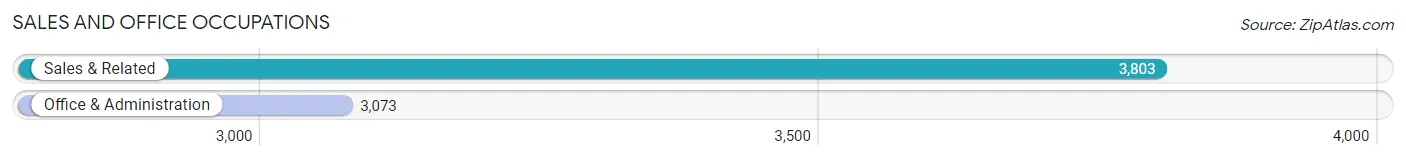
The most common Sales and Office occupations in Pleasanton are Sales & Related (3,803 | 9.6%), and Office & Administration (3,073 | 7.8%).
Sales and Office Occupations by Sex
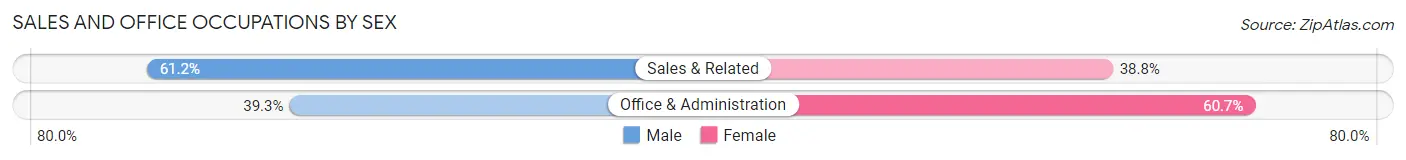
| Occupation | Male | Female |
| Sales & Related | 2,328 (61.2%) | 1,475 (38.8%) |
| Office & Administration | 1,207 (39.3%) | 1,866 (60.7%) |
| Total (Category) | 3,535 (51.4%) | 3,341 (48.6%) |
| Total (Overall) | 22,254 (56.3%) | 17,263 (43.7%) |
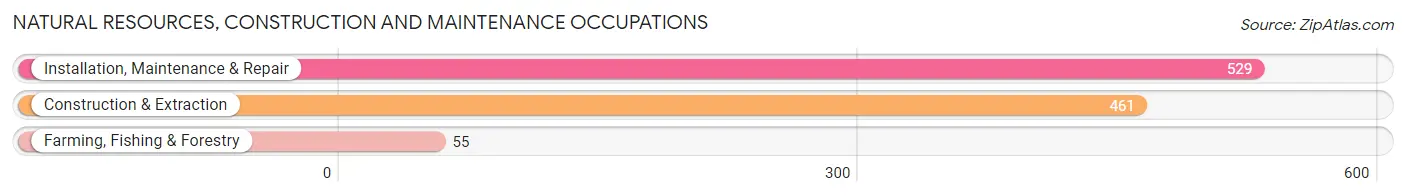
Natural Resources, Construction and Maintenance Occupations
The most common Natural Resources, Construction and Maintenance occupations in Pleasanton are Installation, Maintenance & Repair (529 | 1.3%), Construction & Extraction (461 | 1.2%), and Farming, Fishing & Forestry (55 | 0.1%).
Natural Resources, Construction and Maintenance Occupations by Sex
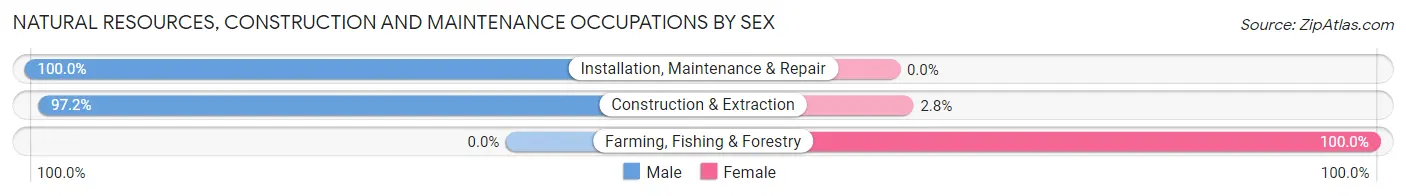
| Occupation | Male | Female |
| Farming, Fishing & Forestry | 0 (0.0%) | 55 (100.0%) |
| Construction & Extraction | 448 (97.2%) | 13 (2.8%) |
| Installation, Maintenance & Repair | 529 (100.0%) | 0 (0.0%) |
| Total (Category) | 977 (93.5%) | 68 (6.5%) |
| Total (Overall) | 22,254 (56.3%) | 17,263 (43.7%) |
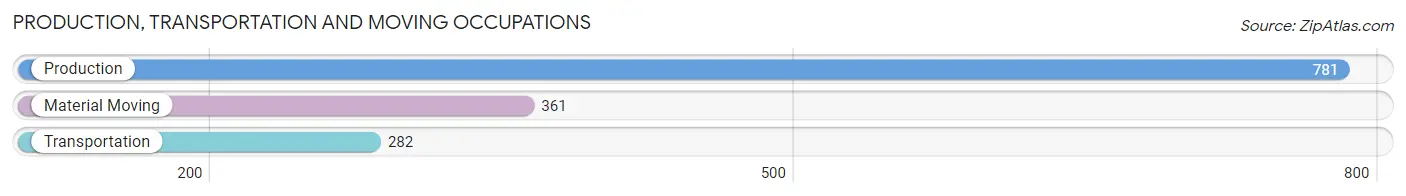
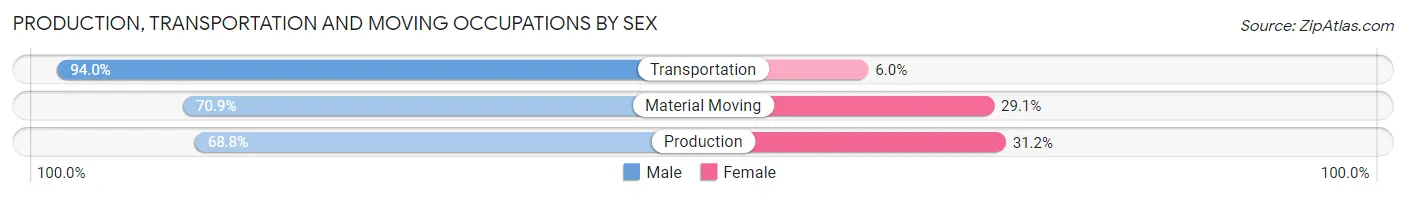
Production, Transportation and Moving Occupations
The most common Production, Transportation and Moving occupations in Pleasanton are Production (781 | 2.0%), Material Moving (361 | 0.9%), and Transportation (282 | 0.7%).
Production, Transportation and Moving Occupations by Sex
| Occupation | Male | Female |
| Production | 537 (68.8%) | 244 (31.2%) |
| Transportation | 265 (94.0%) | 17 (6.0%) |
| Material Moving | 256 (70.9%) | 105 (29.1%) |
| Total (Category) | 1,058 (74.3%) | 366 (25.7%) |
| Total (Overall) | 22,254 (56.3%) | 17,263 (43.7%) |
Employment Industries by Sex in Pleasanton
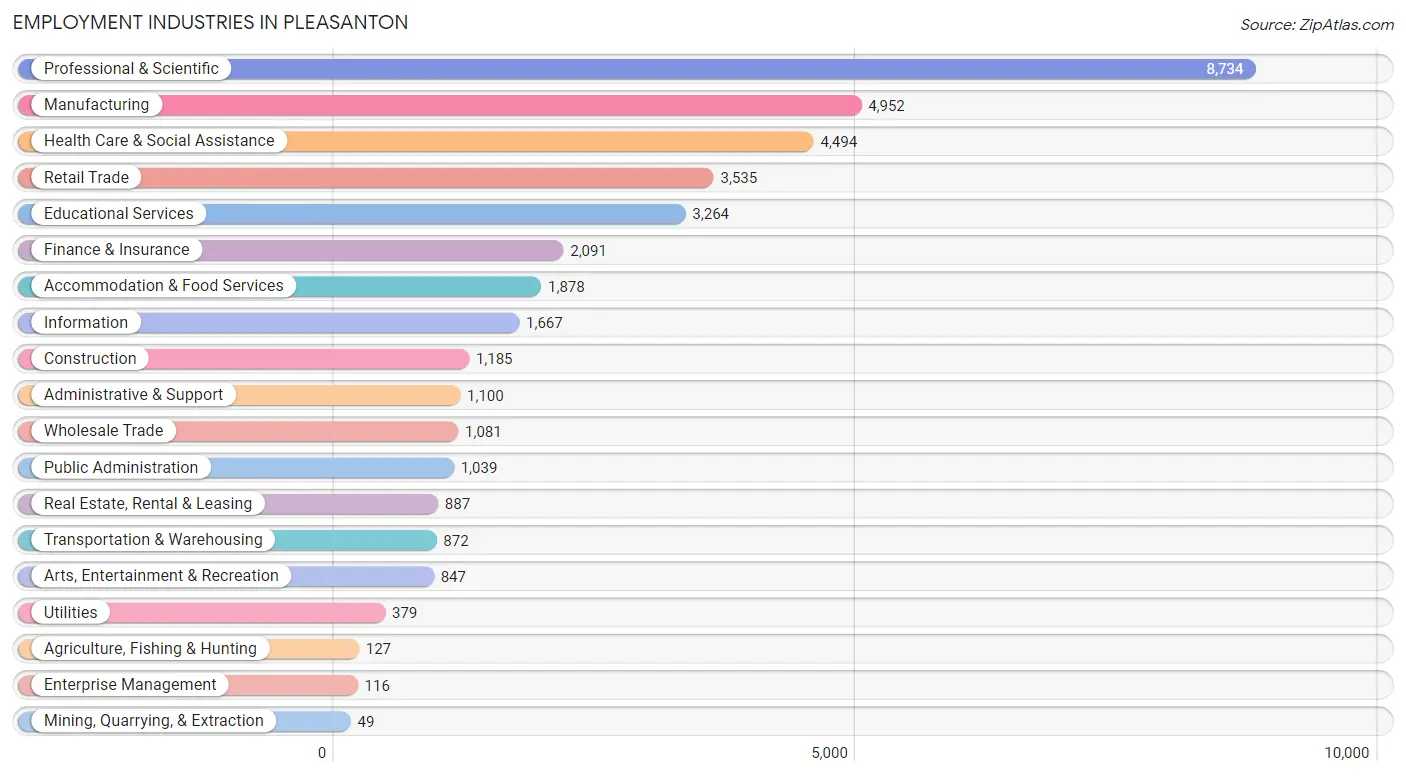
Employment Industries in Pleasanton
The major employment industries in Pleasanton include Professional & Scientific (8,734 | 22.1%), Manufacturing (4,952 | 12.5%), Health Care & Social Assistance (4,494 | 11.4%), Retail Trade (3,535 | 8.9%), and Educational Services (3,264 | 8.3%).
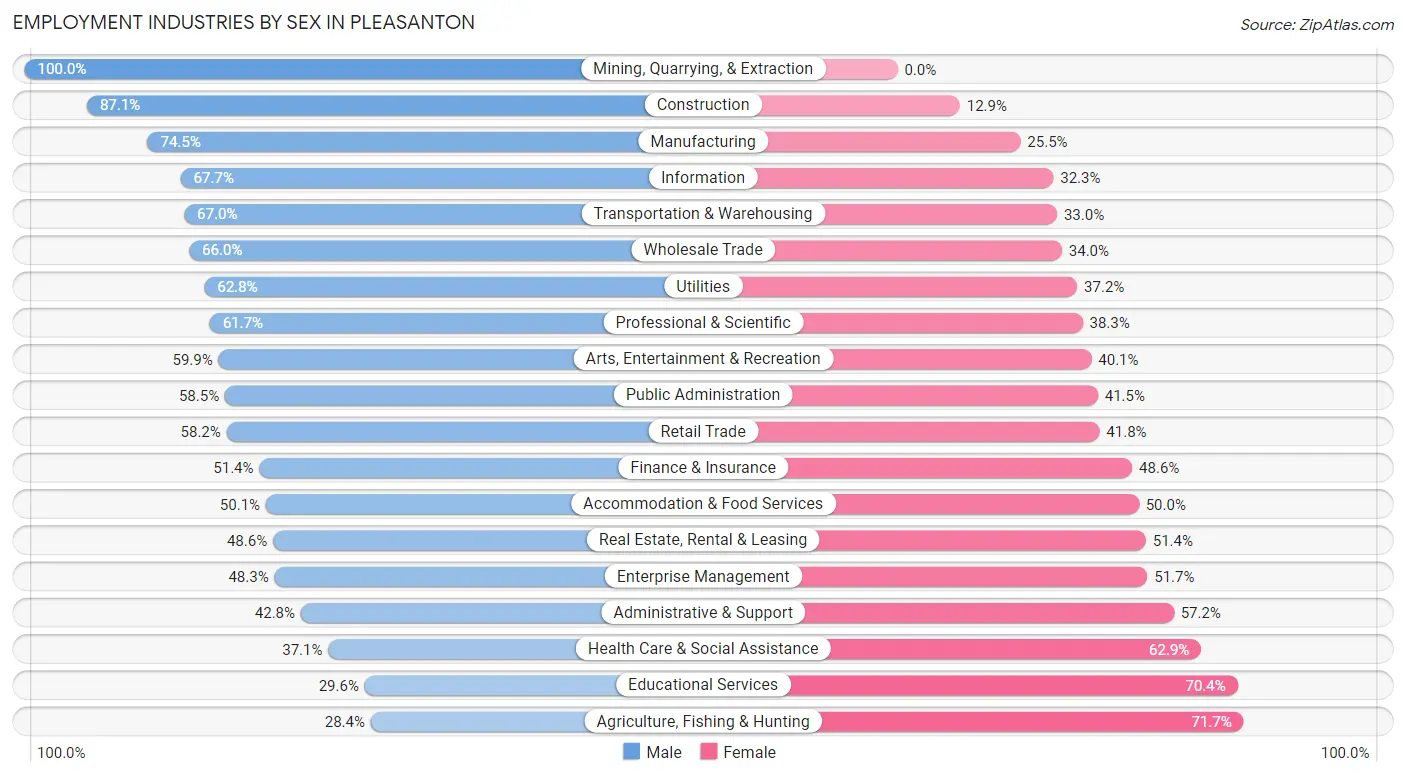
Employment Industries by Sex in Pleasanton
The Pleasanton industries that see more men than women are Mining, Quarrying, & Extraction (100.0%), Construction (87.1%), and Manufacturing (74.5%), whereas the industries that tend to have a higher number of women are Agriculture, Fishing & Hunting (71.7%), Educational Services (70.4%), and Health Care & Social Assistance (62.9%).
| Industry | Male | Female |
| Agriculture, Fishing & Hunting | 36 (28.3%) | 91 (71.7%) |
| Mining, Quarrying, & Extraction | 49 (100.0%) | 0 (0.0%) |
| Construction | 1,032 (87.1%) | 153 (12.9%) |
| Manufacturing | 3,691 (74.5%) | 1,261 (25.5%) |
| Wholesale Trade | 713 (66.0%) | 368 (34.0%) |
| Retail Trade | 2,057 (58.2%) | 1,478 (41.8%) |
| Transportation & Warehousing | 584 (67.0%) | 288 (33.0%) |
| Utilities | 238 (62.8%) | 141 (37.2%) |
| Information | 1,129 (67.7%) | 538 (32.3%) |
| Finance & Insurance | 1,075 (51.4%) | 1,016 (48.6%) |
| Real Estate, Rental & Leasing | 431 (48.6%) | 456 (51.4%) |
| Professional & Scientific | 5,387 (61.7%) | 3,347 (38.3%) |
| Enterprise Management | 56 (48.3%) | 60 (51.7%) |
| Administrative & Support | 471 (42.8%) | 629 (57.2%) |
| Educational Services | 966 (29.6%) | 2,298 (70.4%) |
| Health Care & Social Assistance | 1,669 (37.1%) | 2,825 (62.9%) |
| Arts, Entertainment & Recreation | 507 (59.9%) | 340 (40.1%) |
| Accommodation & Food Services | 940 (50.0%) | 938 (49.9%) |
| Public Administration | 608 (58.5%) | 431 (41.5%) |
| Total | 22,254 (56.3%) | 17,263 (43.7%) |
Education in Pleasanton
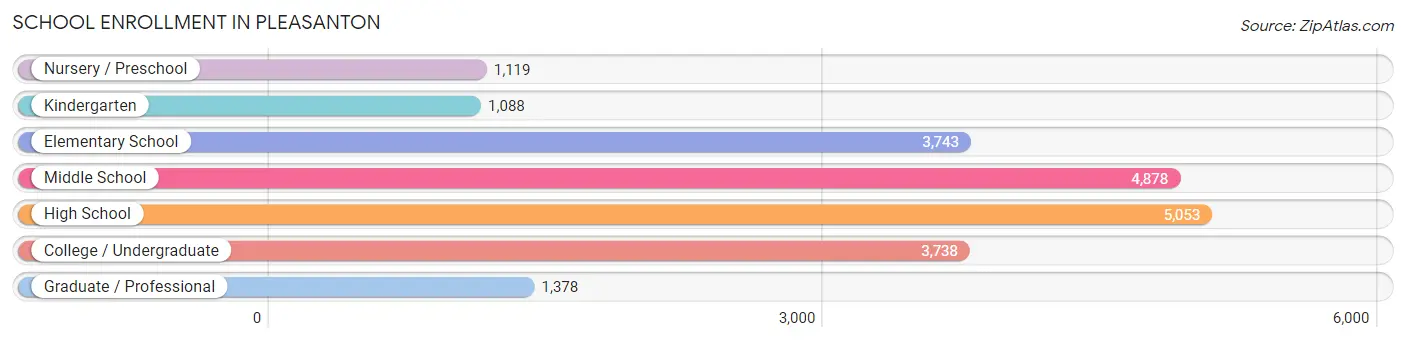
School Enrollment in Pleasanton
The most common levels of schooling among the 20,997 students in Pleasanton are high school (5,053 | 24.1%), middle school (4,878 | 23.2%), and elementary school (3,743 | 17.8%).
| School Level | # Students | % Students |
| Nursery / Preschool | 1,119 | 5.3% |
| Kindergarten | 1,088 | 5.2% |
| Elementary School | 3,743 | 17.8% |
| Middle School | 4,878 | 23.2% |
| High School | 5,053 | 24.1% |
| College / Undergraduate | 3,738 | 17.8% |
| Graduate / Professional | 1,378 | 6.6% |
| Total | 20,997 | 100.0% |
School Enrollment by Age by Funding Source in Pleasanton
Out of a total of 20,997 students who are enrolled in schools in Pleasanton, 2,919 (13.9%) attend a private institution, while the remaining 18,078 (86.1%) are enrolled in public schools. The age group of 3 to 4 year olds has the highest likelihood of being enrolled in private schools, with 526 (63.5% in the age bracket) enrolled. Conversely, the age group of 10 to 14 year olds has the lowest likelihood of being enrolled in a private school, with 6,095 (96.0% in the age bracket) attending a public institution.
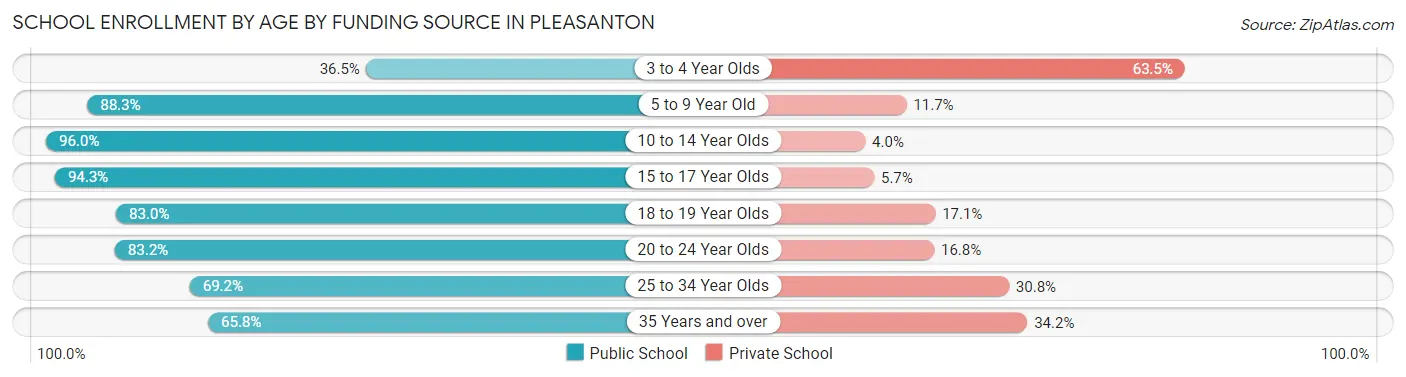
| Age Bracket | Public School | Private School |
| 3 to 4 Year Olds | 302 (36.5%) | 526 (63.5%) |
| 5 to 9 Year Old | 4,119 (88.3%) | 545 (11.7%) |
| 10 to 14 Year Olds | 6,095 (96.0%) | 254 (4.0%) |
| 15 to 17 Year Olds | 3,284 (94.3%) | 197 (5.7%) |
| 18 to 19 Year Olds | 1,226 (83.0%) | 252 (17.1%) |
| 20 to 24 Year Olds | 1,166 (83.2%) | 236 (16.8%) |
| 25 to 34 Year Olds | 1,050 (69.2%) | 467 (30.8%) |
| 35 Years and over | 841 (65.8%) | 437 (34.2%) |
| Total | 18,078 (86.1%) | 2,919 (13.9%) |
Educational Attainment by Field of Study in Pleasanton
Engineering (8,538 | 21.1%), business (5,987 | 14.8%), computers & mathematics (4,903 | 12.1%), science & technology (3,230 | 8.0%), and social sciences (3,015 | 7.4%) are the most common fields of study among 40,485 individuals in Pleasanton who have obtained a bachelor's degree or higher.
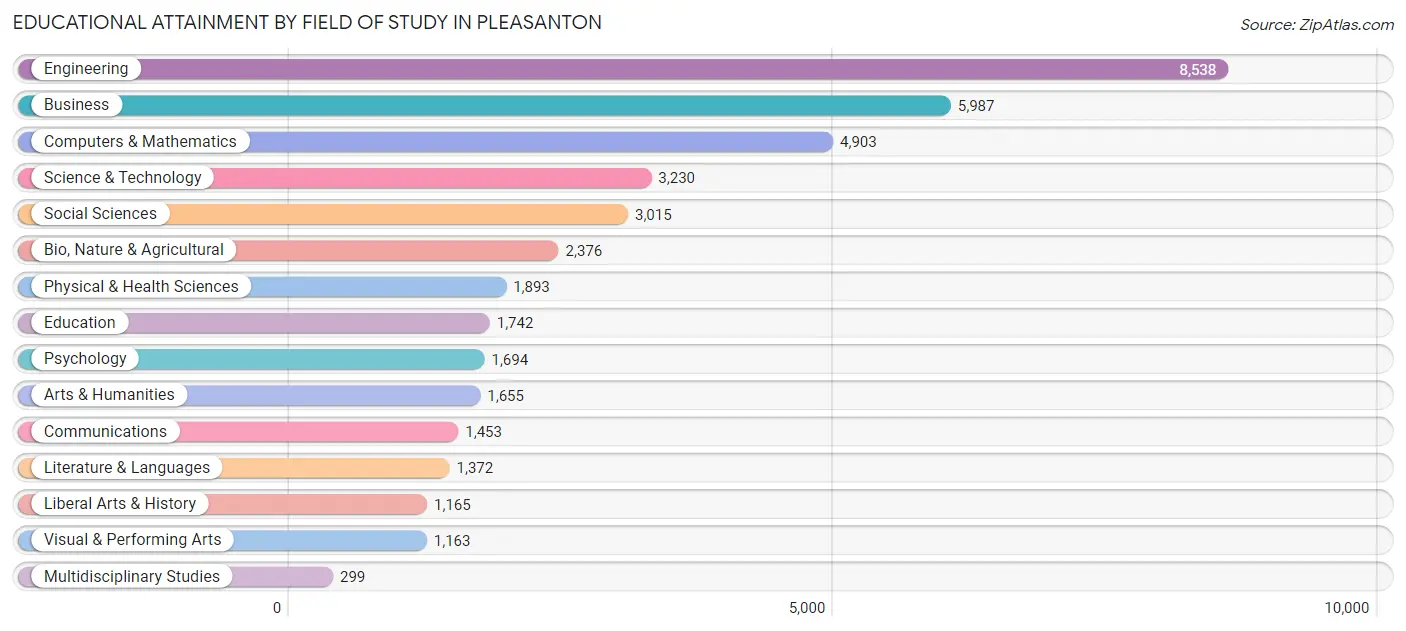
| Field of Study | # Graduates | % Graduates |
| Computers & Mathematics | 4,903 | 12.1% |
| Bio, Nature & Agricultural | 2,376 | 5.9% |
| Physical & Health Sciences | 1,893 | 4.7% |
| Psychology | 1,694 | 4.2% |
| Social Sciences | 3,015 | 7.4% |
| Engineering | 8,538 | 21.1% |
| Multidisciplinary Studies | 299 | 0.7% |
| Science & Technology | 3,230 | 8.0% |
| Business | 5,987 | 14.8% |
| Education | 1,742 | 4.3% |
| Literature & Languages | 1,372 | 3.4% |
| Liberal Arts & History | 1,165 | 2.9% |
| Visual & Performing Arts | 1,163 | 2.9% |
| Communications | 1,453 | 3.6% |
| Arts & Humanities | 1,655 | 4.1% |
| Total | 40,485 | 100.0% |
Transportation & Commute in Pleasanton
Vehicle Availability by Sex in Pleasanton
The most prevalent vehicle ownership categories in Pleasanton are males with 2 vehicles (10,144, accounting for 46.5%) and females with 2 vehicles (8,247, making up 60.0%).
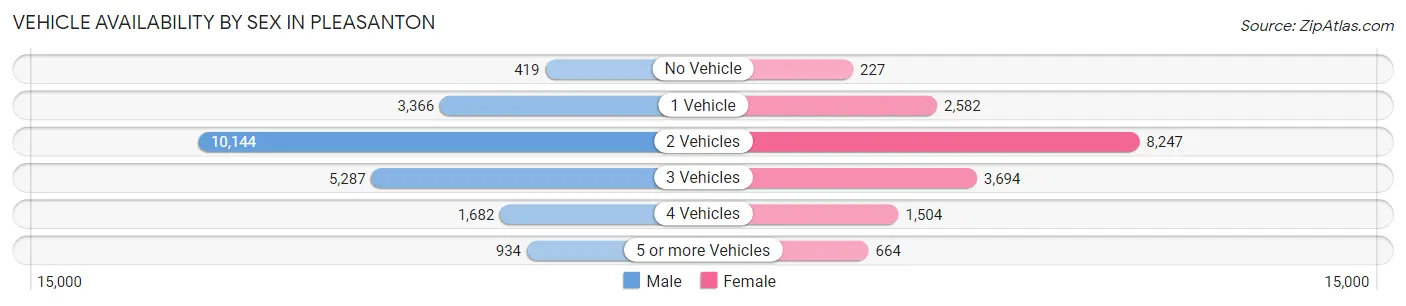
| Vehicles Available | Male | Female |
| No Vehicle | 419 (1.9%) | 227 (1.3%) |
| 1 Vehicle | 3,366 (15.4%) | 2,582 (15.3%) |
| 2 Vehicles | 10,144 (46.5%) | 8,247 (48.7%) |
| 3 Vehicles | 5,287 (24.2%) | 3,694 (21.8%) |
| 4 Vehicles | 1,682 (7.7%) | 1,504 (8.9%) |
| 5 or more Vehicles | 934 (4.3%) | 664 (3.9%) |
| Total | 21,832 (100.0%) | 16,918 (100.0%) |
Commute Time in Pleasanton
The most frequently occuring commute durations in Pleasanton are 60 to 89 minutes (4,782 commuters, 16.3%), 10 to 14 minutes (4,244 commuters, 14.4%), and 15 to 19 minutes (3,610 commuters, 12.3%).
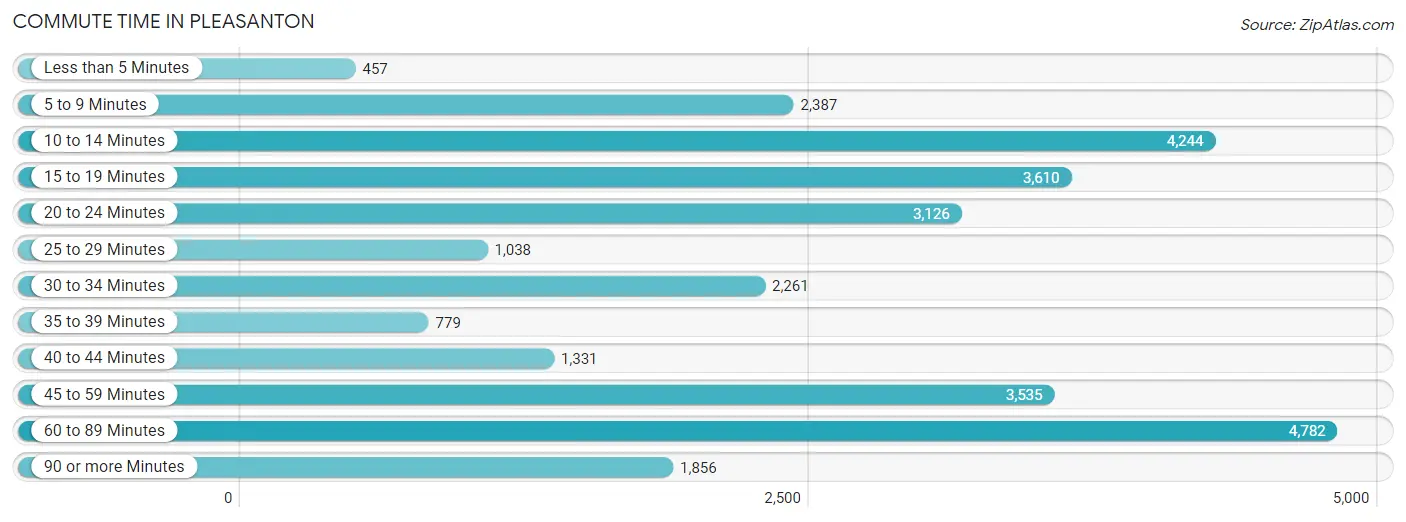
| Commute Time | # Commuters | % Commuters |
| Less than 5 Minutes | 457 | 1.5% |
| 5 to 9 Minutes | 2,387 | 8.1% |
| 10 to 14 Minutes | 4,244 | 14.4% |
| 15 to 19 Minutes | 3,610 | 12.3% |
| 20 to 24 Minutes | 3,126 | 10.6% |
| 25 to 29 Minutes | 1,038 | 3.5% |
| 30 to 34 Minutes | 2,261 | 7.7% |
| 35 to 39 Minutes | 779 | 2.6% |
| 40 to 44 Minutes | 1,331 | 4.5% |
| 45 to 59 Minutes | 3,535 | 12.0% |
| 60 to 89 Minutes | 4,782 | 16.3% |
| 90 or more Minutes | 1,856 | 6.3% |
Commute Time by Sex in Pleasanton
The most common commute times in Pleasanton are 60 to 89 minutes (3,068 commuters, 18.0%) for males and 15 to 19 minutes (2,121 commuters, 17.1%) for females.
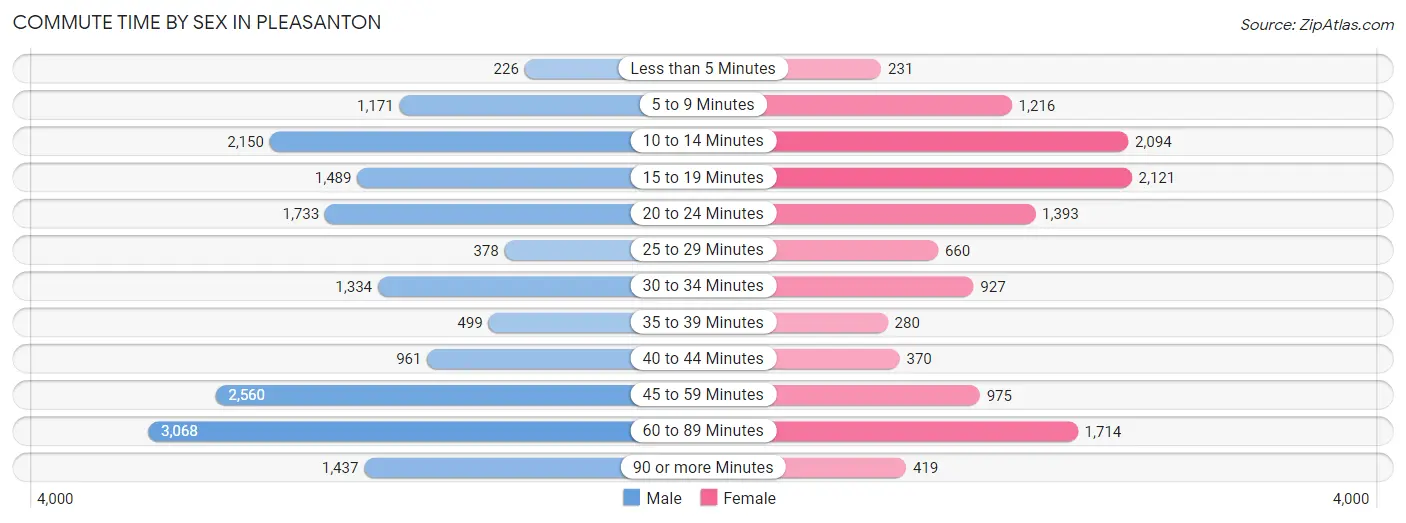
| Commute Time | Male | Female |
| Less than 5 Minutes | 226 (1.3%) | 231 (1.9%) |
| 5 to 9 Minutes | 1,171 (6.9%) | 1,216 (9.8%) |
| 10 to 14 Minutes | 2,150 (12.6%) | 2,094 (16.9%) |
| 15 to 19 Minutes | 1,489 (8.8%) | 2,121 (17.1%) |
| 20 to 24 Minutes | 1,733 (10.2%) | 1,393 (11.2%) |
| 25 to 29 Minutes | 378 (2.2%) | 660 (5.3%) |
| 30 to 34 Minutes | 1,334 (7.8%) | 927 (7.5%) |
| 35 to 39 Minutes | 499 (2.9%) | 280 (2.3%) |
| 40 to 44 Minutes | 961 (5.7%) | 370 (3.0%) |
| 45 to 59 Minutes | 2,560 (15.0%) | 975 (7.9%) |
| 60 to 89 Minutes | 3,068 (18.0%) | 1,714 (13.8%) |
| 90 or more Minutes | 1,437 (8.5%) | 419 (3.4%) |
Time of Departure to Work by Sex in Pleasanton
The most frequent times of departure to work in Pleasanton are 8:00 AM to 8:29 AM (2,979, 17.5%) for males and 9:00 AM to 9:59 AM (1,895, 15.3%) for females.
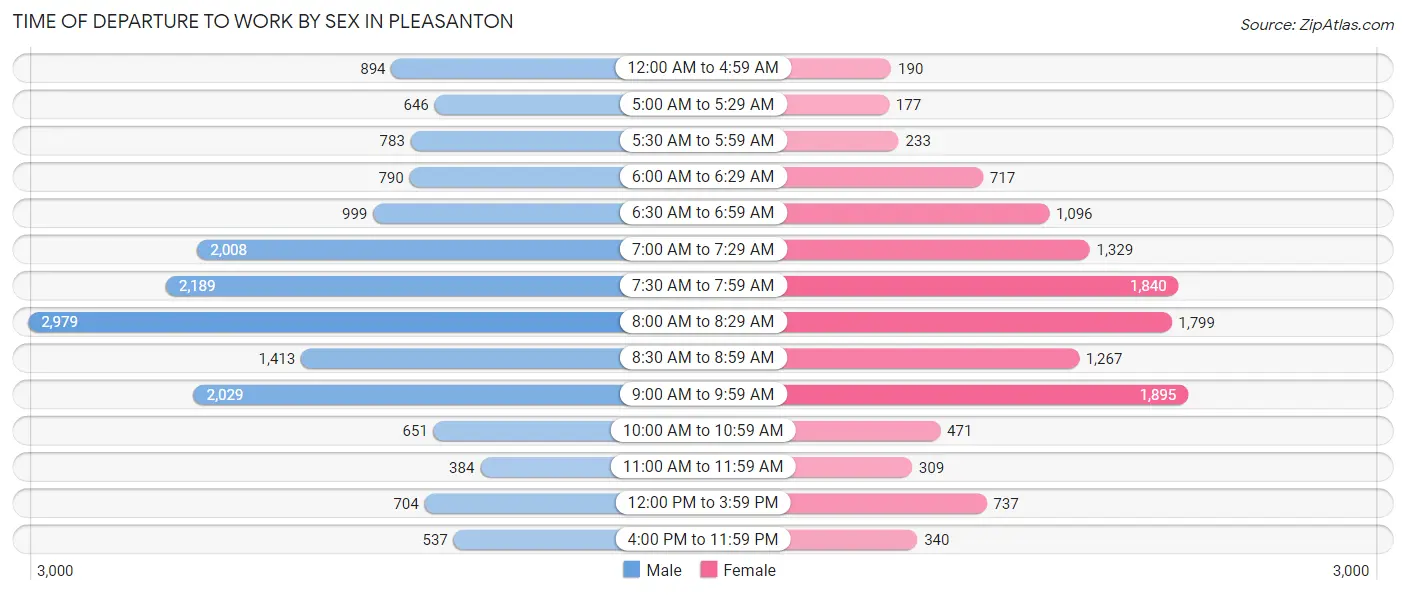
| Time of Departure | Male | Female |
| 12:00 AM to 4:59 AM | 894 (5.3%) | 190 (1.5%) |
| 5:00 AM to 5:29 AM | 646 (3.8%) | 177 (1.4%) |
| 5:30 AM to 5:59 AM | 783 (4.6%) | 233 (1.9%) |
| 6:00 AM to 6:29 AM | 790 (4.6%) | 717 (5.8%) |
| 6:30 AM to 6:59 AM | 999 (5.9%) | 1,096 (8.8%) |
| 7:00 AM to 7:29 AM | 2,008 (11.8%) | 1,329 (10.7%) |
| 7:30 AM to 7:59 AM | 2,189 (12.9%) | 1,840 (14.8%) |
| 8:00 AM to 8:29 AM | 2,979 (17.5%) | 1,799 (14.5%) |
| 8:30 AM to 8:59 AM | 1,413 (8.3%) | 1,267 (10.2%) |
| 9:00 AM to 9:59 AM | 2,029 (11.9%) | 1,895 (15.3%) |
| 10:00 AM to 10:59 AM | 651 (3.8%) | 471 (3.8%) |
| 11:00 AM to 11:59 AM | 384 (2.3%) | 309 (2.5%) |
| 12:00 PM to 3:59 PM | 704 (4.1%) | 737 (5.9%) |
| 4:00 PM to 11:59 PM | 537 (3.2%) | 340 (2.7%) |
| Total | 17,006 (100.0%) | 12,400 (100.0%) |
Housing Occupancy in Pleasanton
Occupancy by Ownership in Pleasanton
Of the total 27,849 dwellings in Pleasanton, owner-occupied units account for 18,986 (68.2%), while renter-occupied units make up 8,863 (31.8%).
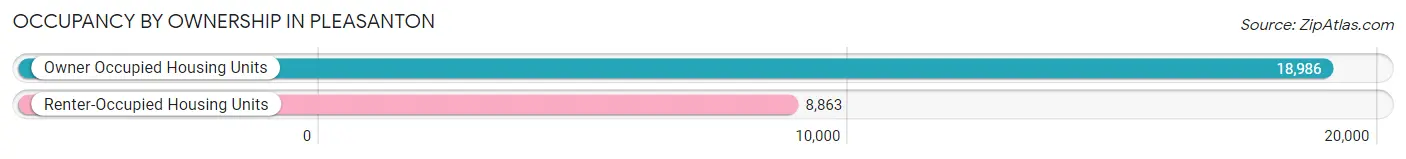
| Occupancy | # Housing Units | % Housing Units |
| Owner Occupied Housing Units | 18,986 | 68.2% |
| Renter-Occupied Housing Units | 8,863 | 31.8% |
| Total Occupied Housing Units | 27,849 | 100.0% |
Occupancy by Household Size in Pleasanton
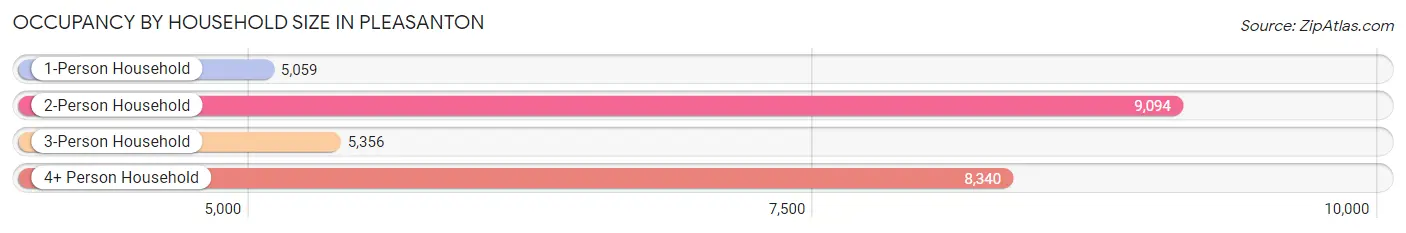
| Household Size | # Housing Units | % Housing Units |
| 1-Person Household | 5,059 | 18.2% |
| 2-Person Household | 9,094 | 32.7% |
| 3-Person Household | 5,356 | 19.2% |
| 4+ Person Household | 8,340 | 29.9% |
| Total Housing Units | 27,849 | 100.0% |
Occupancy by Ownership by Household Size in Pleasanton
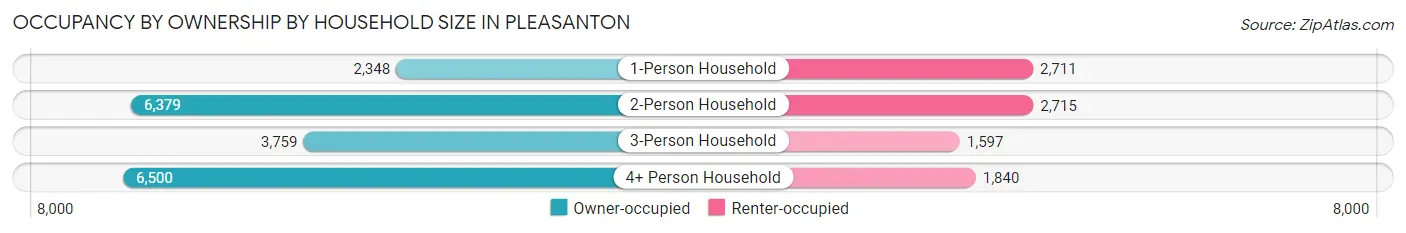
| Household Size | Owner-occupied | Renter-occupied |
| 1-Person Household | 2,348 (46.4%) | 2,711 (53.6%) |
| 2-Person Household | 6,379 (70.2%) | 2,715 (29.8%) |
| 3-Person Household | 3,759 (70.2%) | 1,597 (29.8%) |
| 4+ Person Household | 6,500 (77.9%) | 1,840 (22.1%) |
| Total Housing Units | 18,986 (68.2%) | 8,863 (31.8%) |
Occupancy by Educational Attainment in Pleasanton
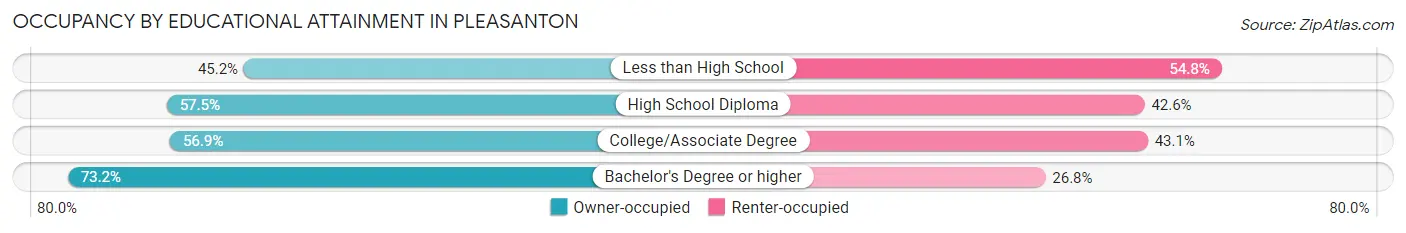
| Household Size | Owner-occupied | Renter-occupied |
| Less than High School | 316 (45.2%) | 383 (54.8%) |
| High School Diploma | 1,165 (57.5%) | 863 (42.5%) |
| College/Associate Degree | 3,062 (56.9%) | 2,317 (43.1%) |
| Bachelor's Degree or higher | 14,443 (73.2%) | 5,300 (26.8%) |
Occupancy by Age of Householder in Pleasanton
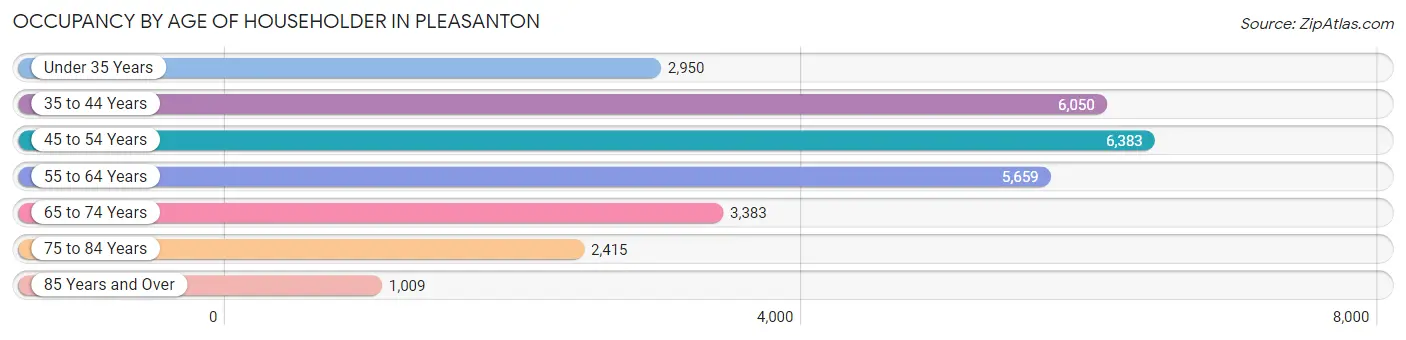
| Age Bracket | # Households | % Households |
| Under 35 Years | 2,950 | 10.6% |
| 35 to 44 Years | 6,050 | 21.7% |
| 45 to 54 Years | 6,383 | 22.9% |
| 55 to 64 Years | 5,659 | 20.3% |
| 65 to 74 Years | 3,383 | 12.1% |
| 75 to 84 Years | 2,415 | 8.7% |
| 85 Years and Over | 1,009 | 3.6% |
| Total | 27,849 | 100.0% |
Housing Finances in Pleasanton
Median Income by Occupancy in Pleasanton
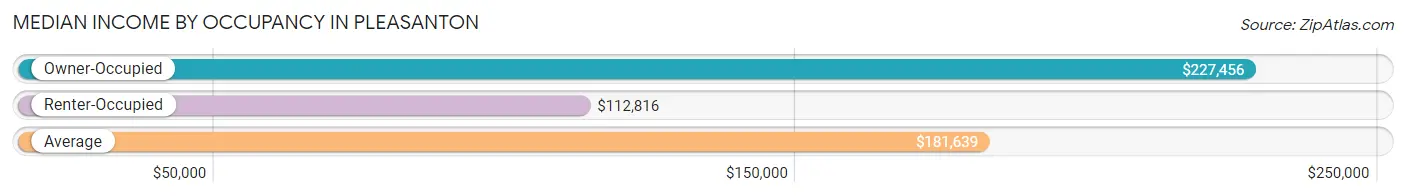
| Occupancy Type | # Households | Median Income |
| Owner-Occupied | 18,986 (68.2%) | $227,456 |
| Renter-Occupied | 8,863 (31.8%) | $112,816 |
| Average | 27,849 (100.0%) | $181,639 |
Occupancy by Householder Income Bracket in Pleasanton
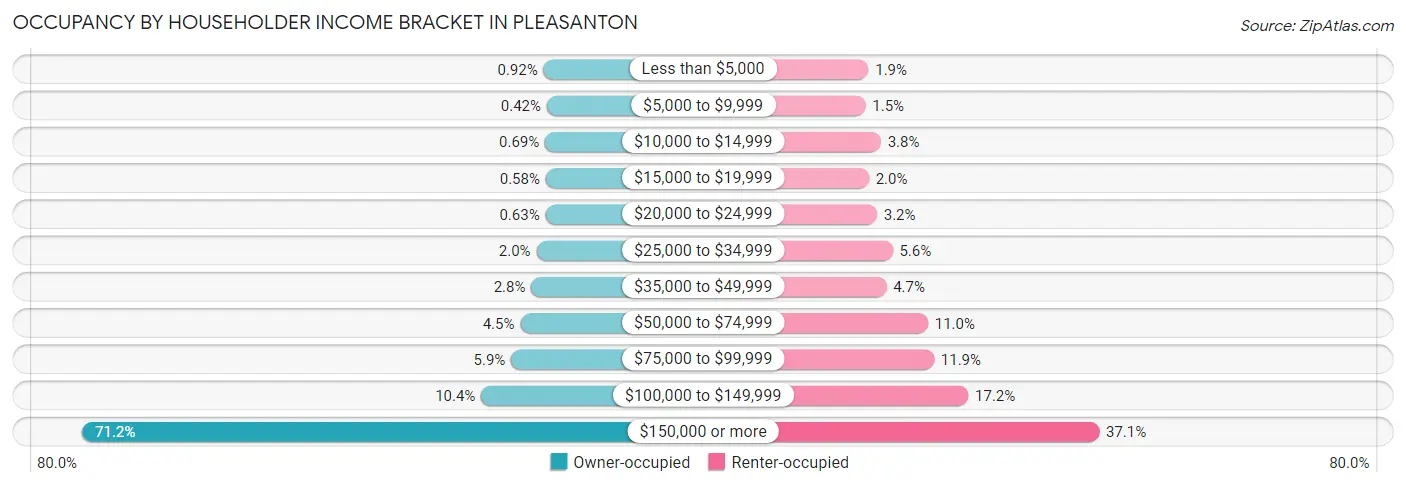
| Income Bracket | Owner-occupied | Renter-occupied |
| Less than $5,000 | 175 (0.9%) | 172 (1.9%) |
| $5,000 to $9,999 | 80 (0.4%) | 132 (1.5%) |
| $10,000 to $14,999 | 131 (0.7%) | 340 (3.8%) |
| $15,000 to $19,999 | 110 (0.6%) | 177 (2.0%) |
| $20,000 to $24,999 | 120 (0.6%) | 287 (3.2%) |
| $25,000 to $34,999 | 380 (2.0%) | 499 (5.6%) |
| $35,000 to $49,999 | 530 (2.8%) | 414 (4.7%) |
| $50,000 to $74,999 | 846 (4.5%) | 976 (11.0%) |
| $75,000 to $99,999 | 1,113 (5.9%) | 1,057 (11.9%) |
| $100,000 to $149,999 | 1,978 (10.4%) | 1,520 (17.2%) |
| $150,000 or more | 13,523 (71.2%) | 3,289 (37.1%) |
| Total | 18,986 (100.0%) | 8,863 (100.0%) |
Monthly Housing Cost Tiers in Pleasanton
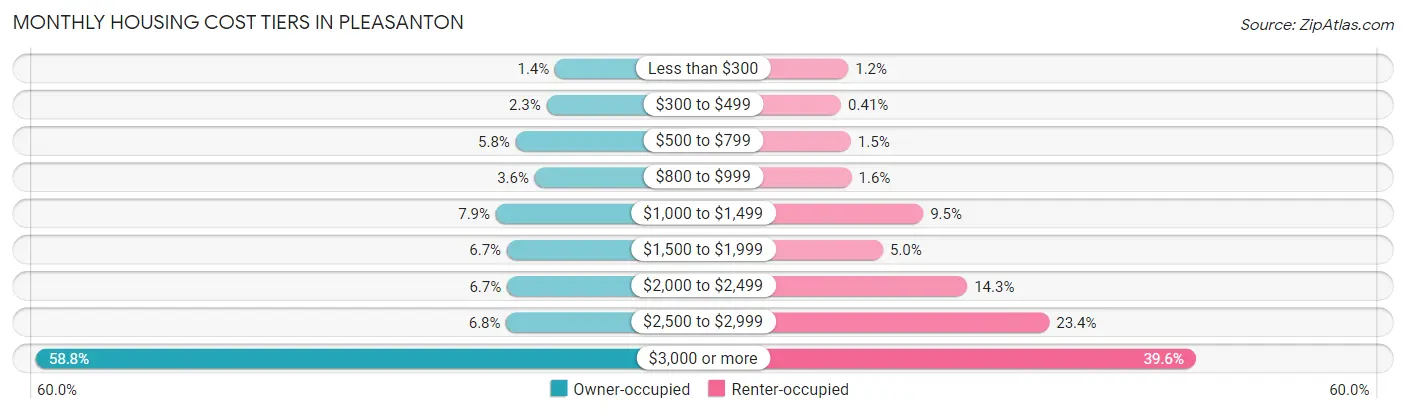
| Monthly Cost | Owner-occupied | Renter-occupied |
| Less than $300 | 264 (1.4%) | 106 (1.2%) |
| $300 to $499 | 442 (2.3%) | 36 (0.4%) |
| $500 to $799 | 1,091 (5.8%) | 132 (1.5%) |
| $800 to $999 | 691 (3.6%) | 139 (1.6%) |
| $1,000 to $1,499 | 1,508 (7.9%) | 840 (9.5%) |
| $1,500 to $1,999 | 1,276 (6.7%) | 446 (5.0%) |
| $2,000 to $2,499 | 1,272 (6.7%) | 1,271 (14.3%) |
| $2,500 to $2,999 | 1,288 (6.8%) | 2,075 (23.4%) |
| $3,000 or more | 11,154 (58.8%) | 3,508 (39.6%) |
| Total | 18,986 (100.0%) | 8,863 (100.0%) |
Physical Housing Characteristics in Pleasanton
Housing Structures in Pleasanton
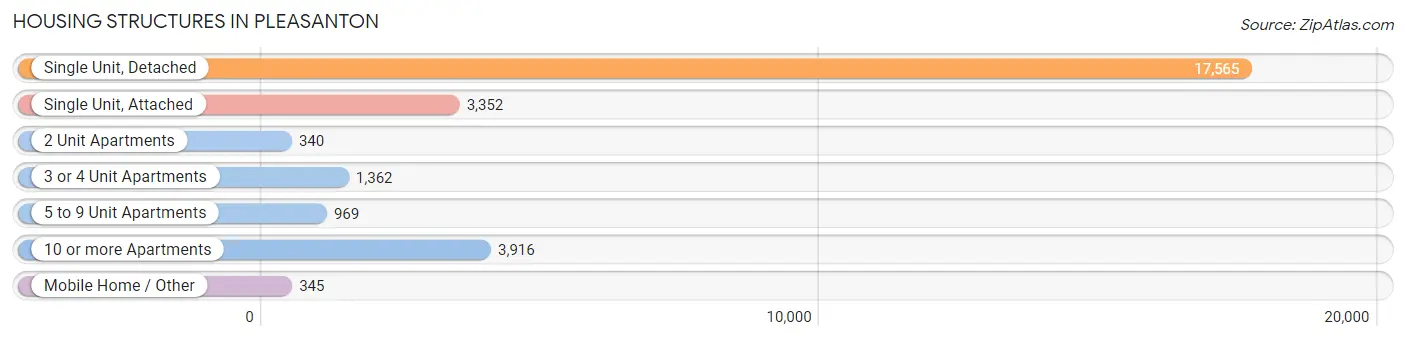
| Structure Type | # Housing Units | % Housing Units |
| Single Unit, Detached | 17,565 | 63.1% |
| Single Unit, Attached | 3,352 | 12.0% |
| 2 Unit Apartments | 340 | 1.2% |
| 3 or 4 Unit Apartments | 1,362 | 4.9% |
| 5 to 9 Unit Apartments | 969 | 3.5% |
| 10 or more Apartments | 3,916 | 14.1% |
| Mobile Home / Other | 345 | 1.2% |
| Total | 27,849 | 100.0% |
Housing Structures by Occupancy in Pleasanton
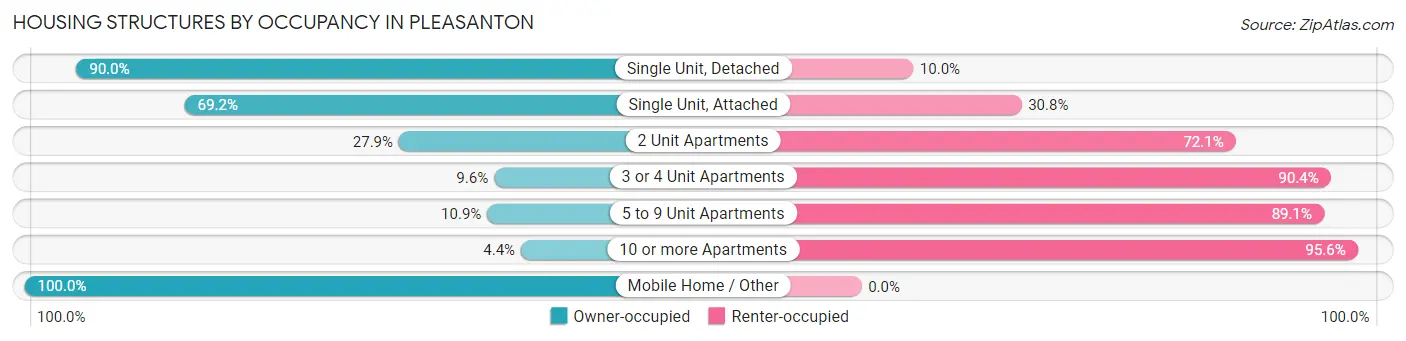
| Structure Type | Owner-occupied | Renter-occupied |
| Single Unit, Detached | 15,816 (90.0%) | 1,749 (10.0%) |
| Single Unit, Attached | 2,319 (69.2%) | 1,033 (30.8%) |
| 2 Unit Apartments | 95 (27.9%) | 245 (72.1%) |
| 3 or 4 Unit Apartments | 131 (9.6%) | 1,231 (90.4%) |
| 5 to 9 Unit Apartments | 106 (10.9%) | 863 (89.1%) |
| 10 or more Apartments | 174 (4.4%) | 3,742 (95.6%) |
| Mobile Home / Other | 345 (100.0%) | 0 (0.0%) |
| Total | 18,986 (68.2%) | 8,863 (31.8%) |
Housing Structures by Number of Rooms in Pleasanton
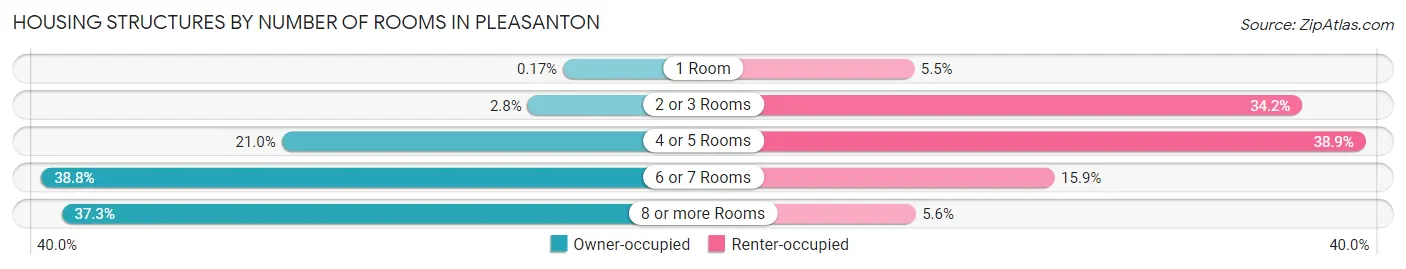
| Number of Rooms | Owner-occupied | Renter-occupied |
| 1 Room | 32 (0.2%) | 485 (5.5%) |
| 2 or 3 Rooms | 530 (2.8%) | 3,031 (34.2%) |
| 4 or 5 Rooms | 3,986 (21.0%) | 3,448 (38.9%) |
| 6 or 7 Rooms | 7,361 (38.8%) | 1,405 (15.9%) |
| 8 or more Rooms | 7,077 (37.3%) | 494 (5.6%) |
| Total | 18,986 (100.0%) | 8,863 (100.0%) |
Housing Structure by Heating Type in Pleasanton
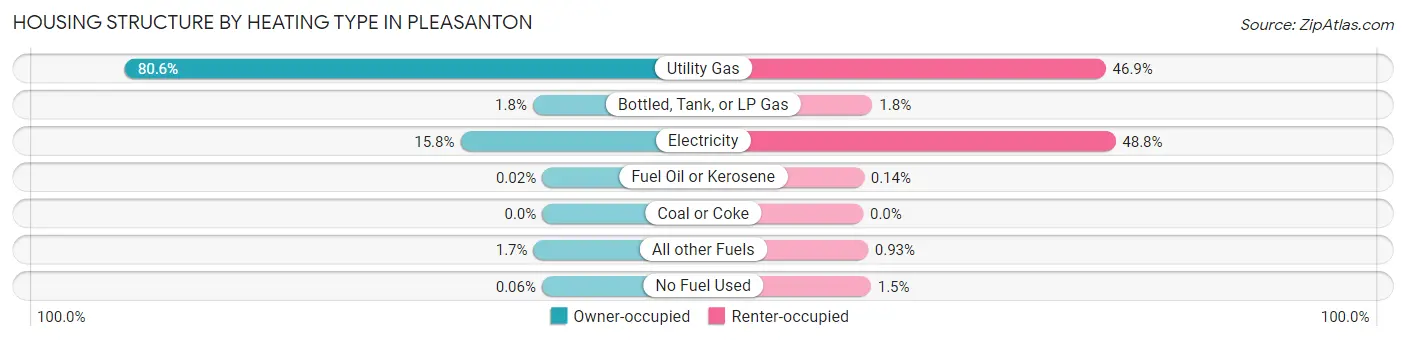
| Heating Type | Owner-occupied | Renter-occupied |
| Utility Gas | 15,307 (80.6%) | 4,154 (46.9%) |
| Bottled, Tank, or LP Gas | 343 (1.8%) | 160 (1.8%) |
| Electricity | 3,001 (15.8%) | 4,322 (48.8%) |
| Fuel Oil or Kerosene | 3 (0.0%) | 12 (0.1%) |
| Coal or Coke | 0 (0.0%) | 0 (0.0%) |
| All other Fuels | 321 (1.7%) | 82 (0.9%) |
| No Fuel Used | 11 (0.1%) | 133 (1.5%) |
| Total | 18,986 (100.0%) | 8,863 (100.0%) |
Household Vehicle Usage in Pleasanton
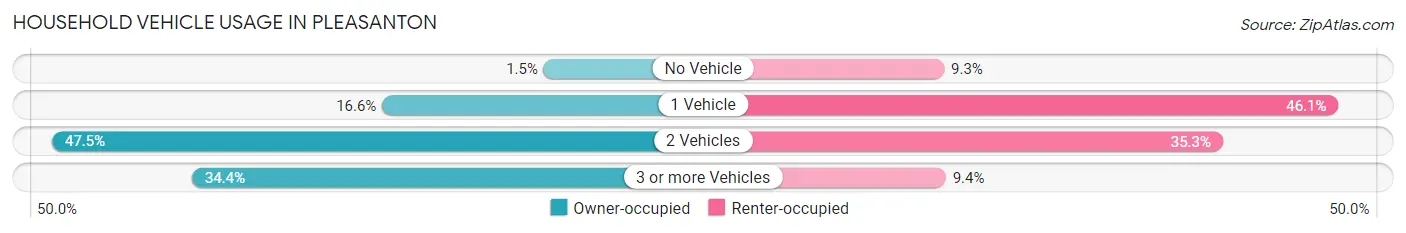
| Vehicles per Household | Owner-occupied | Renter-occupied |
| No Vehicle | 291 (1.5%) | 821 (9.3%) |
| 1 Vehicle | 3,156 (16.6%) | 4,082 (46.1%) |
| 2 Vehicles | 9,010 (47.5%) | 3,126 (35.3%) |
| 3 or more Vehicles | 6,529 (34.4%) | 834 (9.4%) |
| Total | 18,986 (100.0%) | 8,863 (100.0%) |
Real Estate & Mortgages in Pleasanton
Real Estate and Mortgage Overview in Pleasanton
| Characteristic | Without Mortgage | With Mortgage |
| Housing Units | 5,090 | 13,896 |
| Median Property Value | $1,242,700 | $1,363,900 |
| Median Household Income | $154,873 | $10,843 |
| Monthly Housing Costs | $1,079 | $10,817 |
| Real Estate Taxes | $6,619 | $203 |
Property Value by Mortgage Status in Pleasanton
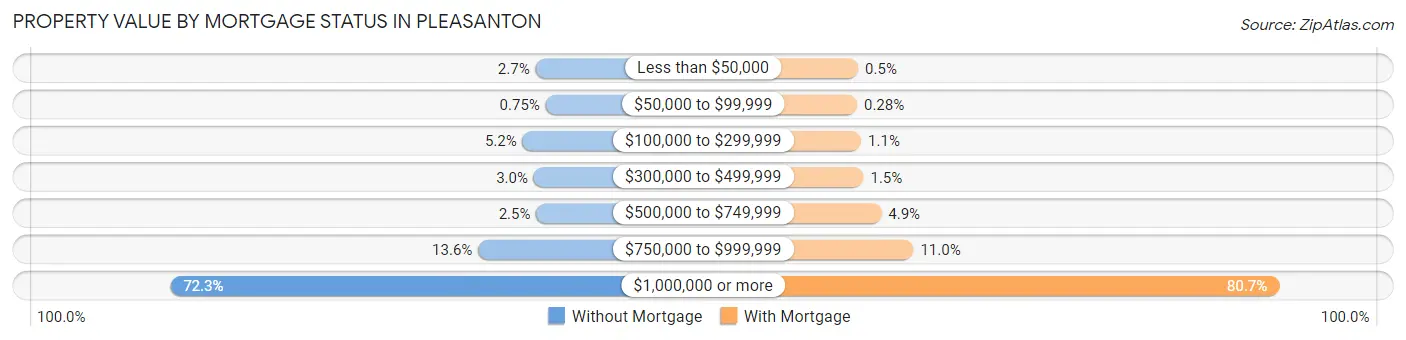
| Property Value | Without Mortgage | With Mortgage |
| Less than $50,000 | 137 (2.7%) | 70 (0.5%) |
| $50,000 to $99,999 | 38 (0.7%) | 39 (0.3%) |
| $100,000 to $299,999 | 262 (5.1%) | 148 (1.1%) |
| $300,000 to $499,999 | 153 (3.0%) | 211 (1.5%) |
| $500,000 to $749,999 | 129 (2.5%) | 683 (4.9%) |
| $750,000 to $999,999 | 693 (13.6%) | 1,534 (11.0%) |
| $1,000,000 or more | 3,678 (72.3%) | 11,211 (80.7%) |
| Total | 5,090 (100.0%) | 13,896 (100.0%) |
Household Income by Mortgage Status in Pleasanton
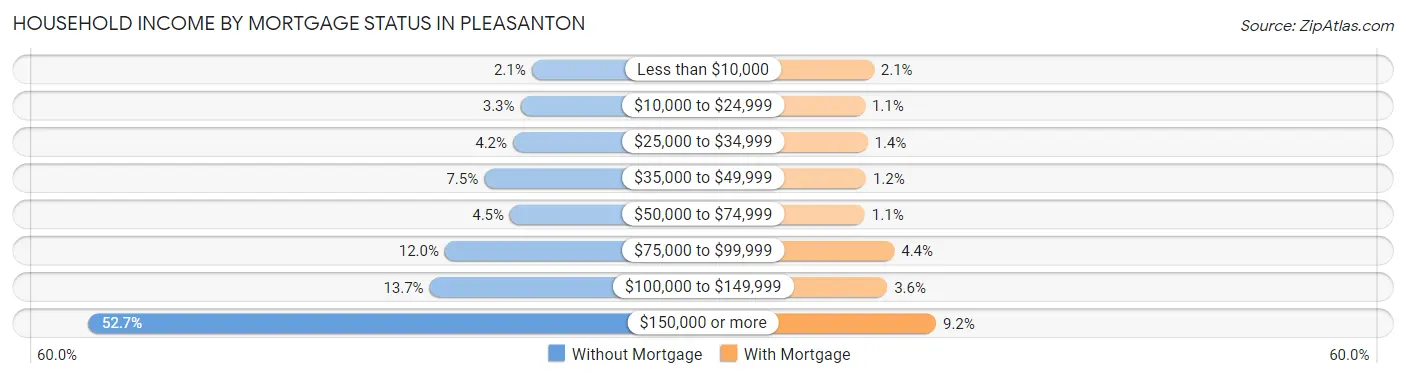
| Household Income | Without Mortgage | With Mortgage |
| Less than $10,000 | 105 (2.1%) | 290 (2.1%) |
| $10,000 to $24,999 | 170 (3.3%) | 150 (1.1%) |
| $25,000 to $34,999 | 214 (4.2%) | 191 (1.4%) |
| $35,000 to $49,999 | 381 (7.5%) | 166 (1.2%) |
| $50,000 to $74,999 | 231 (4.5%) | 149 (1.1%) |
| $75,000 to $99,999 | 610 (12.0%) | 615 (4.4%) |
| $100,000 to $149,999 | 699 (13.7%) | 503 (3.6%) |
| $150,000 or more | 2,680 (52.6%) | 1,279 (9.2%) |
| Total | 5,090 (100.0%) | 13,896 (100.0%) |
Property Value to Household Income Ratio in Pleasanton
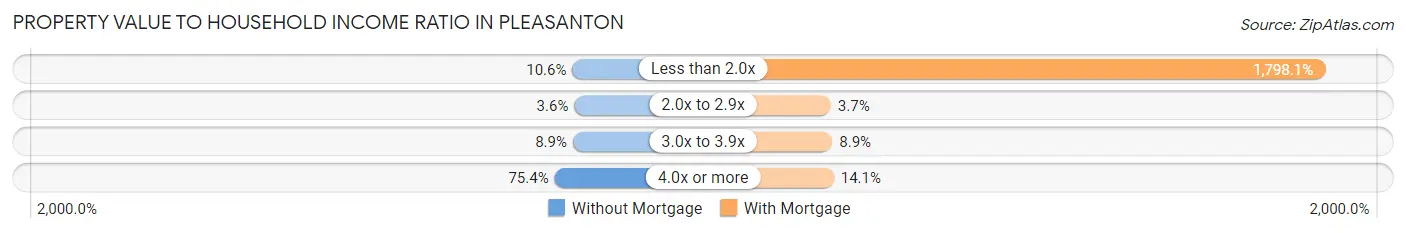
| Value-to-Income Ratio | Without Mortgage | With Mortgage |
| Less than 2.0x | 537 (10.5%) | 249,870 (1,798.1%) |
| 2.0x to 2.9x | 185 (3.6%) | 507 (3.6%) |
| 3.0x to 3.9x | 453 (8.9%) | 1,234 (8.9%) |
| 4.0x or more | 3,837 (75.4%) | 1,963 (14.1%) |
| Total | 5,090 (100.0%) | 13,896 (100.0%) |
Real Estate Taxes by Mortgage Status in Pleasanton
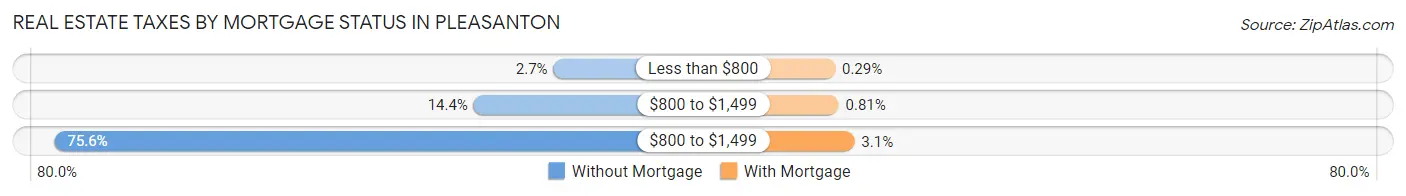
| Property Taxes | Without Mortgage | With Mortgage |
| Less than $800 | 139 (2.7%) | 40 (0.3%) |
| $800 to $1,499 | 732 (14.4%) | 112 (0.8%) |
| $800 to $1,499 | 3,850 (75.6%) | 434 (3.1%) |
| Total | 5,090 (100.0%) | 13,896 (100.0%) |
Health & Disability in Pleasanton
Health Insurance Coverage by Age in Pleasanton
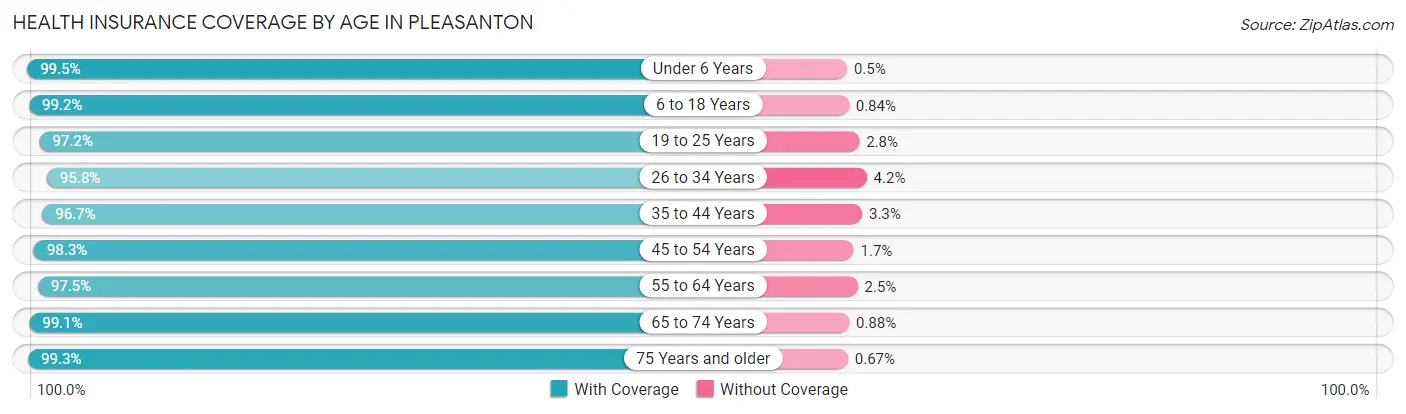
| Age Bracket | With Coverage | Without Coverage |
| Under 6 Years | 4,532 (99.5%) | 23 (0.5%) |
| 6 to 18 Years | 14,974 (99.2%) | 127 (0.8%) |
| 19 to 25 Years | 4,375 (97.2%) | 125 (2.8%) |
| 26 to 34 Years | 7,028 (95.8%) | 306 (4.2%) |
| 35 to 44 Years | 11,730 (96.7%) | 402 (3.3%) |
| 45 to 54 Years | 11,831 (98.3%) | 209 (1.7%) |
| 55 to 64 Years | 10,256 (97.5%) | 261 (2.5%) |
| 65 to 74 Years | 6,567 (99.1%) | 58 (0.9%) |
| 75 Years and older | 5,651 (99.3%) | 38 (0.7%) |
| Total | 76,944 (98.0%) | 1,549 (2.0%) |
Health Insurance Coverage by Citizenship Status in Pleasanton
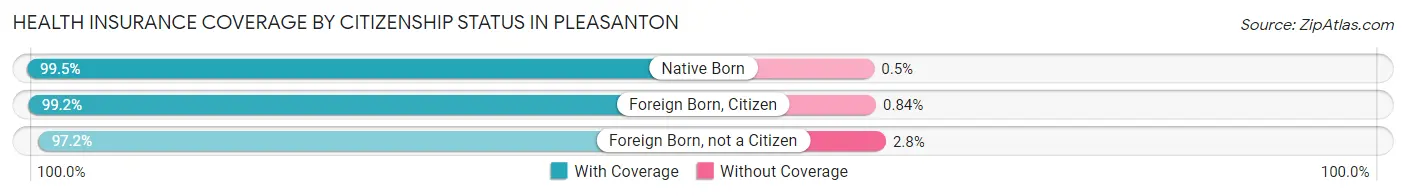
| Citizenship Status | With Coverage | Without Coverage |
| Native Born | 4,532 (99.5%) | 23 (0.5%) |
| Foreign Born, Citizen | 14,974 (99.2%) | 127 (0.8%) |
| Foreign Born, not a Citizen | 4,375 (97.2%) | 125 (2.8%) |
Health Insurance Coverage by Household Income in Pleasanton
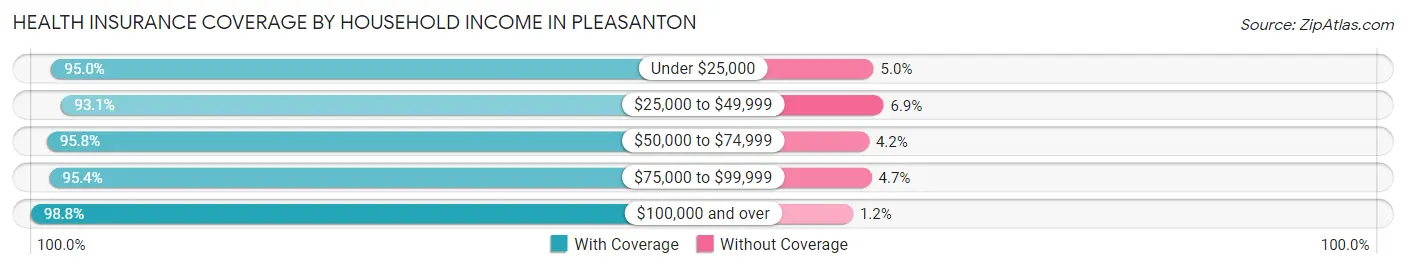
| Household Income | With Coverage | Without Coverage |
| Under $25,000 | 3,434 (95.0%) | 182 (5.0%) |
| $25,000 to $49,999 | 2,814 (93.1%) | 208 (6.9%) |
| $50,000 to $74,999 | 3,684 (95.8%) | 160 (4.2%) |
| $75,000 to $99,999 | 4,735 (95.4%) | 231 (4.6%) |
| $100,000 and over | 61,995 (98.8%) | 728 (1.2%) |
Public vs Private Health Insurance Coverage by Age in Pleasanton
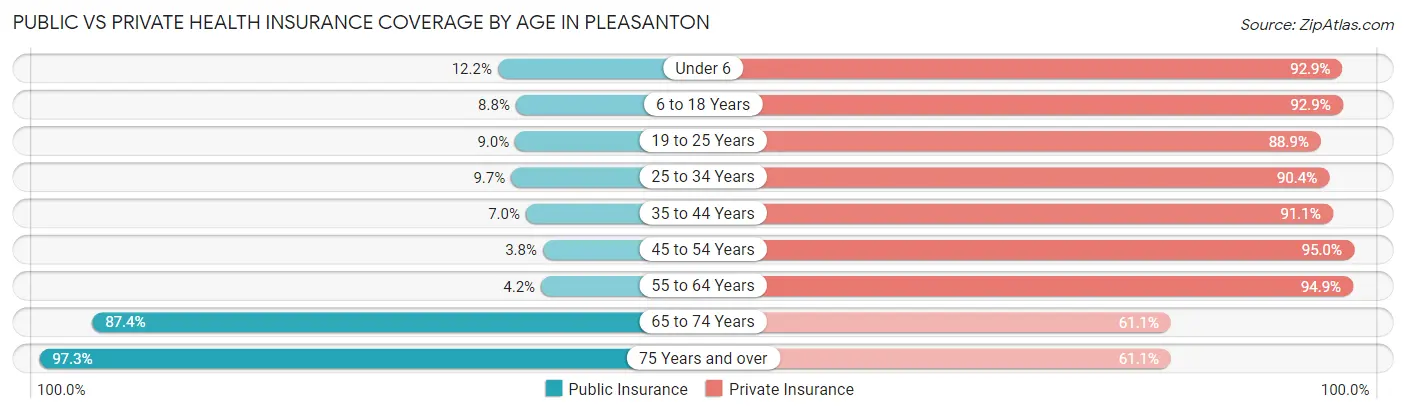
| Age Bracket | Public Insurance | Private Insurance |
| Under 6 | 555 (12.2%) | 4,231 (92.9%) |
| 6 to 18 Years | 1,335 (8.8%) | 14,033 (92.9%) |
| 19 to 25 Years | 403 (9.0%) | 4,000 (88.9%) |
| 25 to 34 Years | 712 (9.7%) | 6,632 (90.4%) |
| 35 to 44 Years | 846 (7.0%) | 11,051 (91.1%) |
| 45 to 54 Years | 460 (3.8%) | 11,442 (95.0%) |
| 55 to 64 Years | 438 (4.2%) | 9,978 (94.9%) |
| 65 to 74 Years | 5,793 (87.4%) | 4,046 (61.1%) |
| 75 Years and over | 5,534 (97.3%) | 3,474 (61.1%) |
| Total | 16,076 (20.5%) | 68,887 (87.8%) |
Disability Status by Sex by Age in Pleasanton
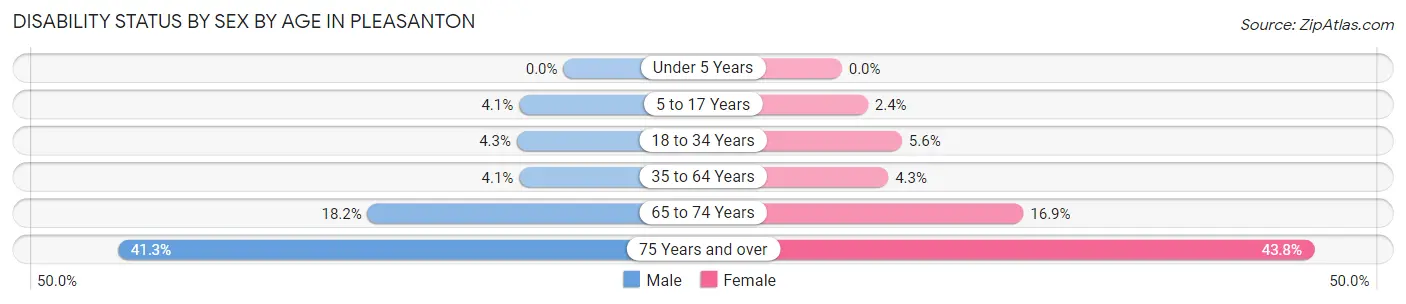
| Age Bracket | Male | Female |
| Under 5 Years | 0 (0.0%) | 0 (0.0%) |
| 5 to 17 Years | 307 (4.1%) | 181 (2.4%) |
| 18 to 34 Years | 285 (4.3%) | 358 (5.6%) |
| 35 to 64 Years | 723 (4.1%) | 734 (4.3%) |
| 65 to 74 Years | 533 (18.2%) | 622 (16.9%) |
| 75 Years and over | 991 (41.3%) | 1,442 (43.8%) |
Disability Class by Sex by Age in Pleasanton
Disability Class: Hearing Difficulty
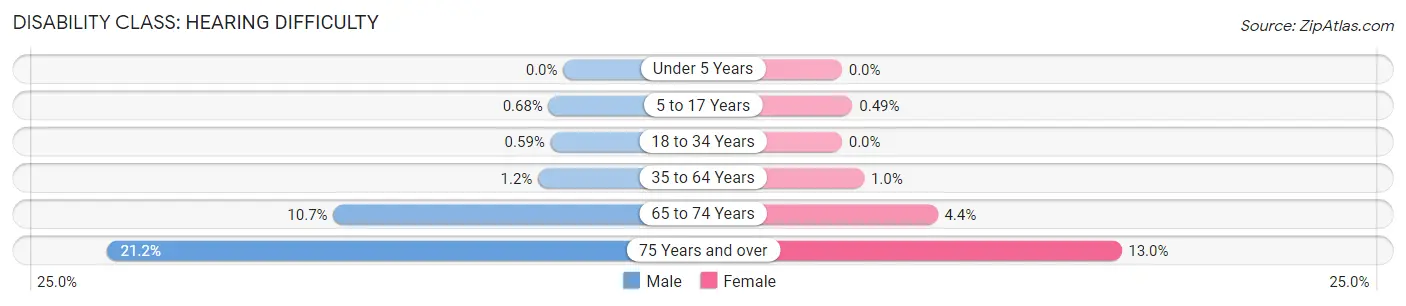
| Age Bracket | Male | Female |
| Under 5 Years | 0 (0.0%) | 0 (0.0%) |
| 5 to 17 Years | 51 (0.7%) | 37 (0.5%) |
| 18 to 34 Years | 39 (0.6%) | 0 (0.0%) |
| 35 to 64 Years | 207 (1.2%) | 175 (1.0%) |
| 65 to 74 Years | 313 (10.7%) | 164 (4.4%) |
| 75 Years and over | 507 (21.1%) | 427 (13.0%) |
Disability Class: Vision Difficulty
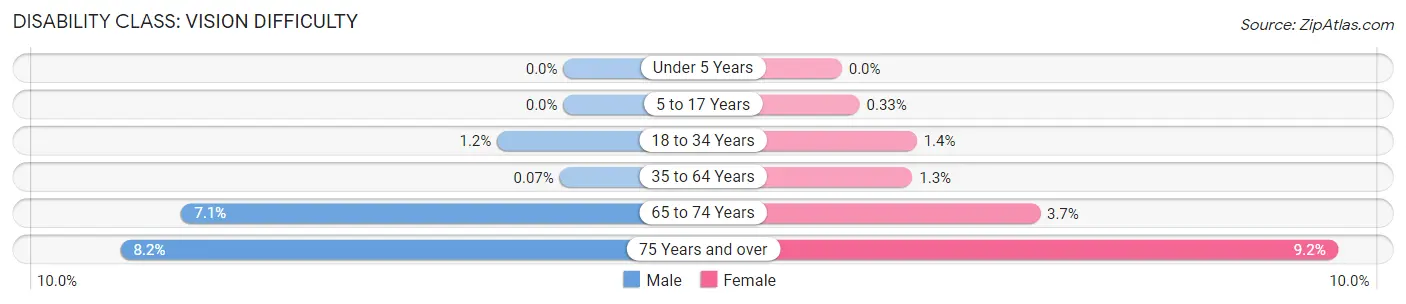
| Age Bracket | Male | Female |
| Under 5 Years | 0 (0.0%) | 0 (0.0%) |
| 5 to 17 Years | 0 (0.0%) | 25 (0.3%) |
| 18 to 34 Years | 81 (1.2%) | 89 (1.4%) |
| 35 to 64 Years | 13 (0.1%) | 223 (1.3%) |
| 65 to 74 Years | 208 (7.1%) | 136 (3.7%) |
| 75 Years and over | 197 (8.2%) | 303 (9.2%) |
Disability Class: Cognitive Difficulty
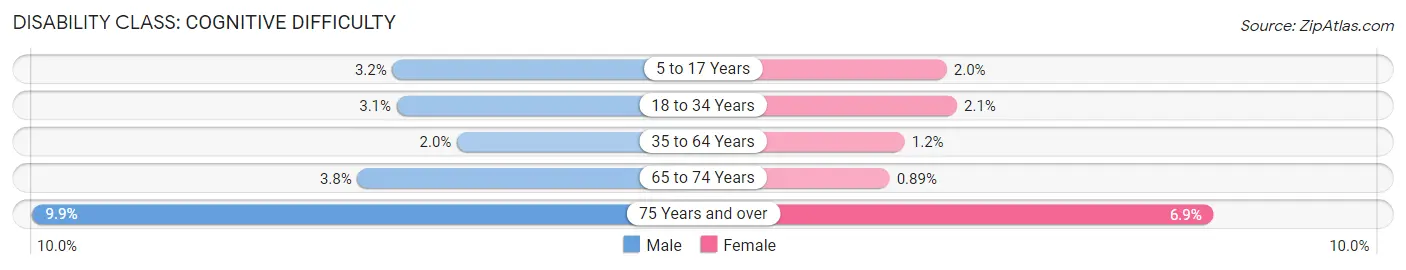
| Age Bracket | Male | Female |
| 5 to 17 Years | 237 (3.2%) | 146 (1.9%) |
| 18 to 34 Years | 204 (3.1%) | 137 (2.1%) |
| 35 to 64 Years | 347 (2.0%) | 199 (1.2%) |
| 65 to 74 Years | 112 (3.8%) | 33 (0.9%) |
| 75 Years and over | 236 (9.9%) | 227 (6.9%) |
Disability Class: Ambulatory Difficulty
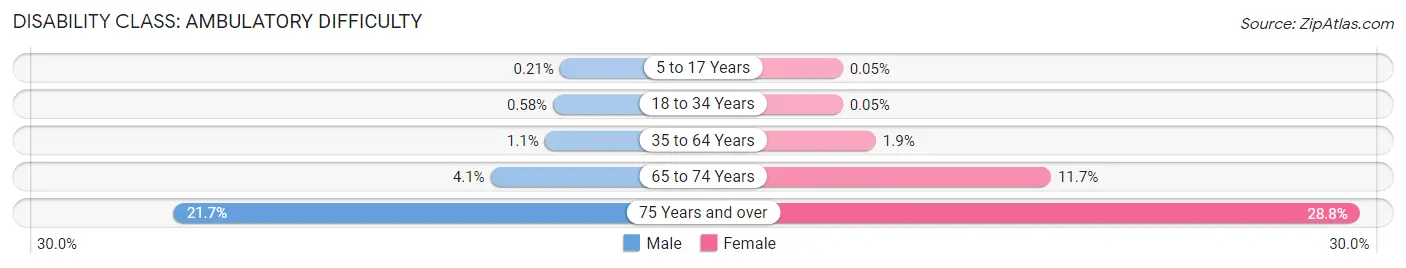
| Age Bracket | Male | Female |
| 5 to 17 Years | 16 (0.2%) | 4 (0.1%) |
| 18 to 34 Years | 38 (0.6%) | 3 (0.1%) |
| 35 to 64 Years | 185 (1.1%) | 324 (1.9%) |
| 65 to 74 Years | 119 (4.1%) | 430 (11.7%) |
| 75 Years and over | 520 (21.7%) | 949 (28.8%) |
Disability Class: Self-Care Difficulty
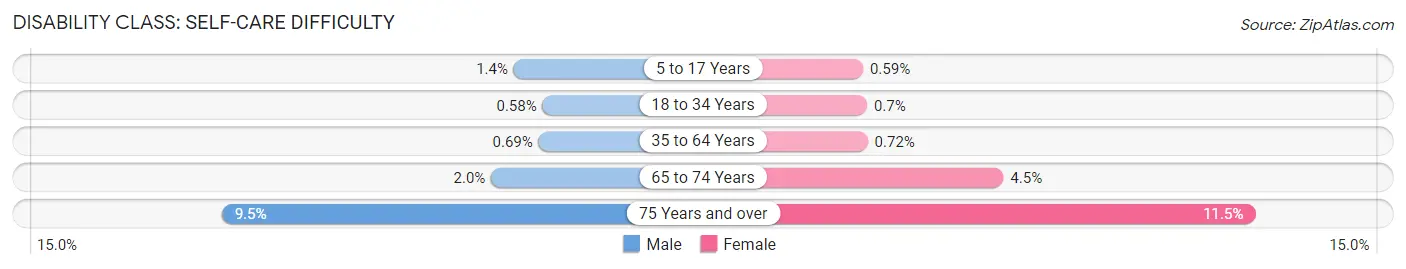
| Age Bracket | Male | Female |
| 5 to 17 Years | 103 (1.4%) | 44 (0.6%) |
| 18 to 34 Years | 38 (0.6%) | 45 (0.7%) |
| 35 to 64 Years | 121 (0.7%) | 122 (0.7%) |
| 65 to 74 Years | 59 (2.0%) | 166 (4.5%) |
| 75 Years and over | 228 (9.5%) | 379 (11.5%) |
Technology Access in Pleasanton
Computing Device Access in Pleasanton
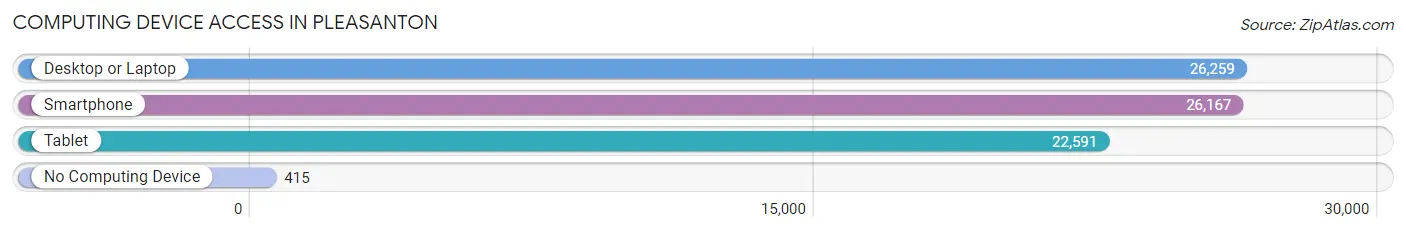
| Device Type | # Households | % Households |
| Desktop or Laptop | 26,259 | 94.3% |
| Smartphone | 26,167 | 94.0% |
| Tablet | 22,591 | 81.1% |
| No Computing Device | 415 | 1.5% |
| Total | 27,849 | 100.0% |
Internet Access in Pleasanton
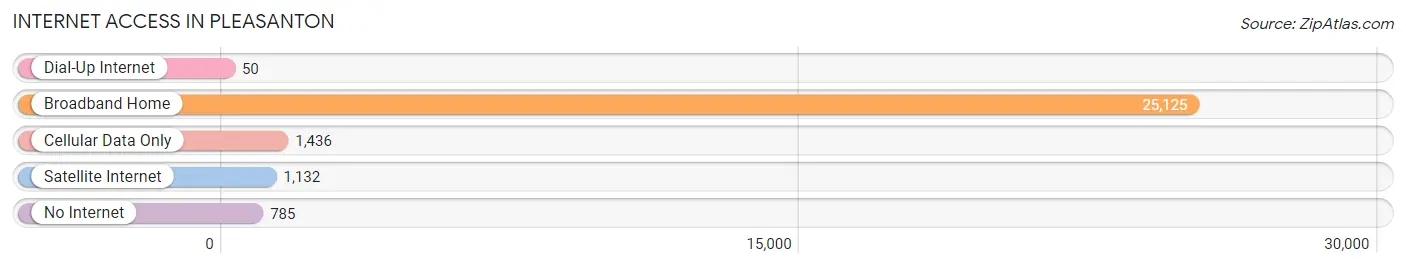
| Internet Type | # Households | % Households |
| Dial-Up Internet | 50 | 0.2% |
| Broadband Home | 25,125 | 90.2% |
| Cellular Data Only | 1,436 | 5.2% |
| Satellite Internet | 1,132 | 4.1% |
| No Internet | 785 | 2.8% |
| Total | 27,849 | 100.0% |
Pleasanton Summary
Pleasanton, California is a city located in Alameda County, in the San Francisco Bay Area. It is situated about 25 miles east of Oakland and 30 miles southeast of San Francisco. The city has a population of 81,000 people, making it the largest city in the Tri-Valley region.
History
Pleasanton was founded in 1869 by John W. Kottinger, a former soldier in the Mexican-American War. He named the city after his friend, Union Army General Alfred Pleasonton. The city was incorporated in 1894 and has since grown to become a major suburb of the San Francisco Bay Area.
Geography
Pleasanton is located in the Tri-Valley region of the San Francisco Bay Area. It is situated in the foothills of the Diablo Range, which provides a scenic backdrop to the city. The city is bordered by Dublin to the north, Livermore to the east, Sunol to the south, and San Ramon to the west. The city covers an area of 24.2 square miles and has an elevation of 545 feet.
Economy
Pleasanton is home to a diverse economy, with a mix of retail, manufacturing, and technology companies. The city is home to several major employers, including Safeway, Kaiser Permanente, Oracle, Workday, and Ross Stores. The city also has a thriving retail sector, with several shopping centers and malls.
Demographics
As of the 2010 census, the population of Pleasanton was 81,000. The racial makeup of the city was 68.2% White, 11.3% Asian, 8.2% Hispanic or Latino, and 6.2% African American. The median household income was $118,000, and the median age was 40.
Pleasanton is a diverse and vibrant city, with a strong sense of community. The city is home to a variety of parks, trails, and recreational facilities, making it a great place to live and work. With its close proximity to the Bay Area, Pleasanton is an ideal place to call home.
Common Questions
What is Per Capita Income in Pleasanton?
Per Capita income in Pleasanton is $83,240.
What is the Median Family Income in Pleasanton?
Median Family Income in Pleasanton is $213,697.
What is the Median Household income in Pleasanton?
Median Household Income in Pleasanton is $181,639.
What is Income or Wage Gap in Pleasanton?
Income or Wage Gap in Pleasanton is 46.1%.
Women in Pleasanton earn 53.9 cents for every dollar earned by a man.
What is Inequality or Gini Index in Pleasanton?
Inequality or Gini Index in Pleasanton is 0.44.
What is the Total Population of Pleasanton?
Total Population of Pleasanton is 78,691.
What is the Total Male Population of Pleasanton?
Total Male Population of Pleasanton is 38,861.
What is the Total Female Population of Pleasanton?
Total Female Population of Pleasanton is 39,830.
What is the Ratio of Males per 100 Females in Pleasanton?
There are 97.57 Males per 100 Females in Pleasanton.
What is the Ratio of Females per 100 Males in Pleasanton?
There are 102.49 Females per 100 Males in Pleasanton.
What is the Median Population Age in Pleasanton?
Median Population Age in Pleasanton is 41.5 Years.
What is the Average Family Size in Pleasanton
Average Family Size in Pleasanton is 3.2 People.
What is the Average Household Size in Pleasanton
Average Household Size in Pleasanton is 2.8 People.
How Large is the Labor Force in Pleasanton?
There are 41,304 People in the Labor Forcein in Pleasanton.
What is the Percentage of People in the Labor Force in Pleasanton?
65.9% of People are in the Labor Force in Pleasanton.
What is the Unemployment Rate in Pleasanton?
Unemployment Rate in Pleasanton is 4.2%.