Santa Clara, CA Map & Demographics
Santa Clara Map
Santa Clara Overview
$78,084
PER CAPITA INCOME
$189,381
AVG FAMILY INCOME
$165,352
AVG HOUSEHOLD INCOME
39.8%
WAGE / INCOME GAP [ % ]
60.2¢/ $1
WAGE / INCOME GAP [ $ ]
$14,699
FAMILY INCOME DEFICIT
0.45
INEQUALITY / GINI INDEX
128,058
TOTAL POPULATION
67,490
MALE POPULATION
60,568
FEMALE POPULATION
111.43
MALES / 100 FEMALES
89.74
FEMALES / 100 MALES
34.5
MEDIAN AGE
3.1
AVG FAMILY SIZE
2.6
AVG HOUSEHOLD SIZE
76,721
LABOR FORCE [ PEOPLE ]
71.6%
PERCENT IN LABOR FORCE
4.2%
UNEMPLOYMENT RATE
Santa Clara Area Codes
Income in Santa Clara
Income Overview in Santa Clara
Per Capita Income in Santa Clara is $78,084, while median incomes of families and households are $189,381 and $165,352 respectively.
| Characteristic | Number | Measure |
| Per Capita Income | 128,058 | $78,084 |
| Median Family Income | 30,506 | $189,381 |
| Mean Family Income | 30,506 | $235,438 |
| Median Household Income | 47,434 | $165,352 |
| Mean Household Income | 47,434 | $206,379 |
| Income Deficit | 30,506 | $14,699 |
| Wage / Income Gap (%) | 128,058 | 39.83% |
| Wage / Income Gap ($) | 128,058 | 60.17¢ per $1 |
| Gini / Inequality Index | 128,058 | 0.45 |
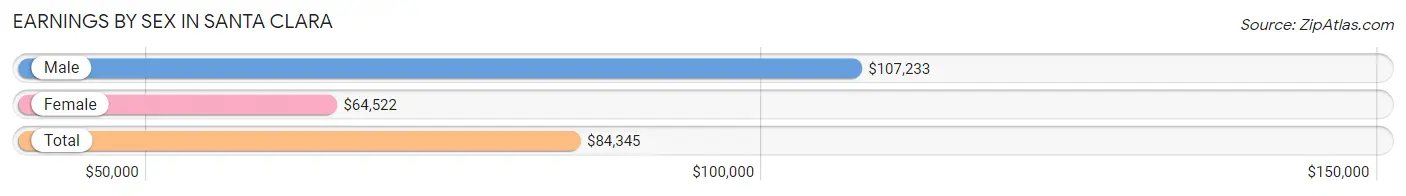
Earnings by Sex in Santa Clara
Average Earnings in Santa Clara are $84,345, $107,233 for men and $64,522 for women, a difference of 39.8%.
| Sex | Number | Average Earnings |
| Male | 45,353 (57.1%) | $107,233 |
| Female | 34,085 (42.9%) | $64,522 |
| Total | 79,438 (100.0%) | $84,345 |
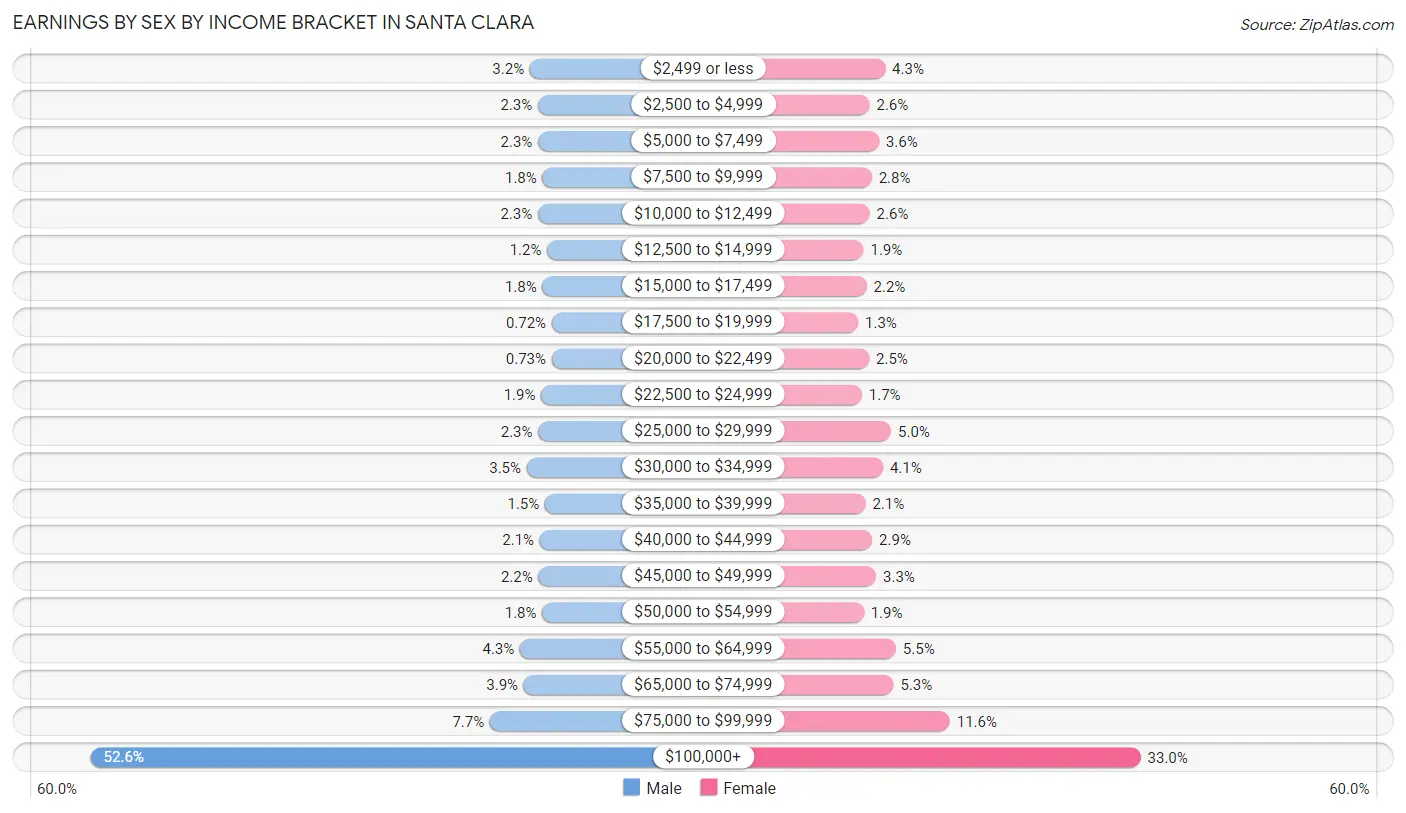
Earnings by Sex by Income Bracket in Santa Clara
The most common earnings brackets in Santa Clara are $100,000+ for men (23,843 | 52.6%) and $100,000+ for women (11,257 | 33.0%).
| Income | Male | Female |
| $2,499 or less | 1,447 (3.2%) | 1,469 (4.3%) |
| $2,500 to $4,999 | 1,035 (2.3%) | 874 (2.6%) |
| $5,000 to $7,499 | 1,031 (2.3%) | 1,232 (3.6%) |
| $7,500 to $9,999 | 805 (1.8%) | 954 (2.8%) |
| $10,000 to $12,499 | 1,035 (2.3%) | 876 (2.6%) |
| $12,500 to $14,999 | 562 (1.2%) | 640 (1.9%) |
| $15,000 to $17,499 | 806 (1.8%) | 759 (2.2%) |
| $17,500 to $19,999 | 328 (0.7%) | 432 (1.3%) |
| $20,000 to $22,499 | 331 (0.7%) | 857 (2.5%) |
| $22,500 to $24,999 | 871 (1.9%) | 576 (1.7%) |
| $25,000 to $29,999 | 1,022 (2.2%) | 1,699 (5.0%) |
| $30,000 to $34,999 | 1,606 (3.5%) | 1,386 (4.1%) |
| $35,000 to $39,999 | 678 (1.5%) | 715 (2.1%) |
| $40,000 to $44,999 | 937 (2.1%) | 971 (2.9%) |
| $45,000 to $49,999 | 1,012 (2.2%) | 1,121 (3.3%) |
| $50,000 to $54,999 | 816 (1.8%) | 649 (1.9%) |
| $55,000 to $64,999 | 1,949 (4.3%) | 1,883 (5.5%) |
| $65,000 to $74,999 | 1,755 (3.9%) | 1,788 (5.2%) |
| $75,000 to $99,999 | 3,484 (7.7%) | 3,947 (11.6%) |
| $100,000+ | 23,843 (52.6%) | 11,257 (33.0%) |
| Total | 45,353 (100.0%) | 34,085 (100.0%) |
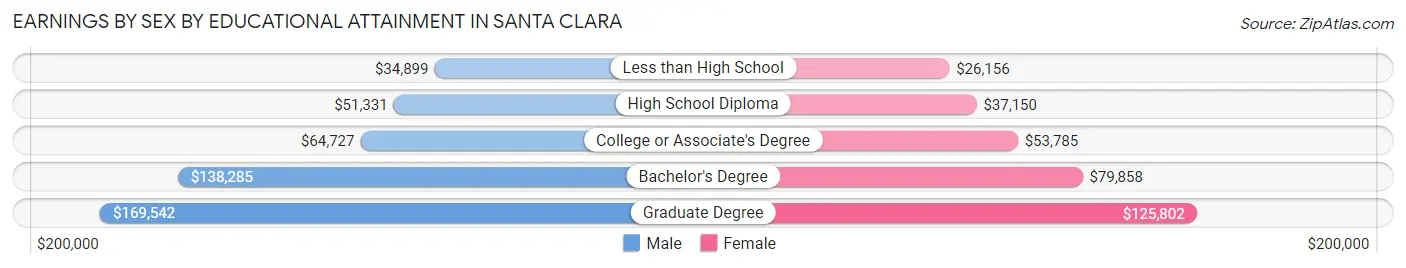
Earnings by Sex by Educational Attainment in Santa Clara
Average earnings in Santa Clara are $125,141 for men and $77,784 for women, a difference of 37.8%. Men with an educational attainment of graduate degree enjoy the highest average annual earnings of $169,542, while those with less than high school education earn the least with $34,899. Women with an educational attainment of graduate degree earn the most with the average annual earnings of $125,802, while those with less than high school education have the smallest earnings of $26,156.
| Educational Attainment | Male Income | Female Income |
| Less than High School | $34,899 | $26,156 |
| High School Diploma | $51,331 | $37,150 |
| College or Associate's Degree | $64,727 | $53,785 |
| Bachelor's Degree | $138,285 | $79,858 |
| Graduate Degree | $169,542 | $125,802 |
| Total | $125,141 | $77,784 |
Family Income in Santa Clara
Family Income Brackets in Santa Clara
According to the Santa Clara family income data, there are 14,185 families falling into the $200,000+ income range, which is the most common income bracket and makes up 46.5% of all families. Conversely, the $10,000 to $14,999 income bracket is the least frequent group with only 153 families (0.5%) belonging to this category.
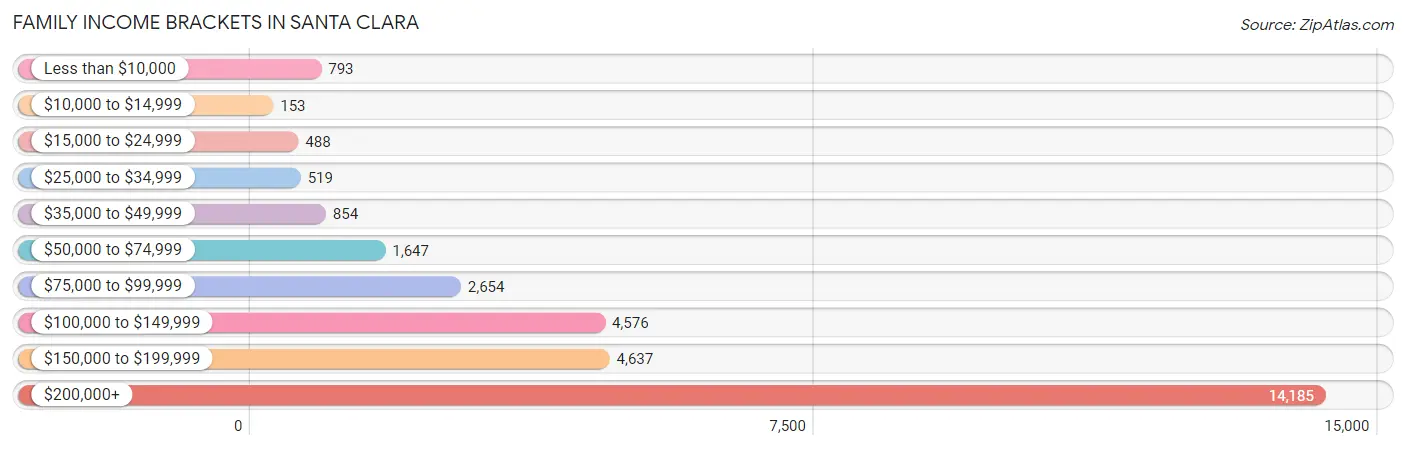
| Income Bracket | # Families | % Families |
| Less than $10,000 | 793 | 2.6% |
| $10,000 to $14,999 | 153 | 0.5% |
| $15,000 to $24,999 | 488 | 1.6% |
| $25,000 to $34,999 | 519 | 1.7% |
| $35,000 to $49,999 | 854 | 2.8% |
| $50,000 to $74,999 | 1,647 | 5.4% |
| $75,000 to $99,999 | 2,654 | 8.7% |
| $100,000 to $149,999 | 4,576 | 15.0% |
| $150,000 to $199,999 | 4,637 | 15.2% |
| $200,000+ | 14,185 | 46.5% |
Family Income by Famaliy Size in Santa Clara
7+ person families (446 | 1.5%) account for the highest median family income in Santa Clara with $223,523 per family, while 2-person families (13,378 | 43.9%) have the highest median income of $84,219 per family member.
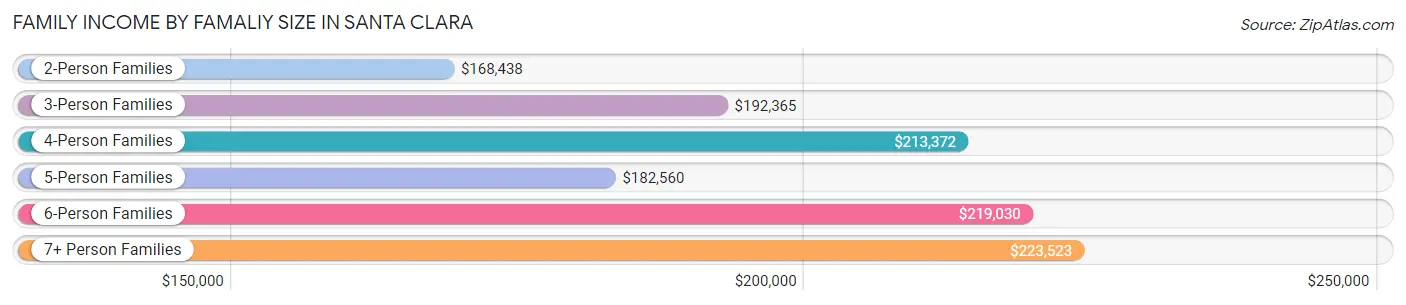
| Income Bracket | # Families | Median Income |
| 2-Person Families | 13,378 (43.9%) | $168,438 |
| 3-Person Families | 8,384 (27.5%) | $192,365 |
| 4-Person Families | 5,994 (19.7%) | $213,372 |
| 5-Person Families | 1,523 (5.0%) | $182,560 |
| 6-Person Families | 781 (2.6%) | $219,030 |
| 7+ Person Families | 446 (1.5%) | $223,523 |
| Total | 30,506 (100.0%) | $189,381 |
Family Income by Number of Earners in Santa Clara
The median family income in Santa Clara is $189,381, with families comprising 2 earners (15,592) having the highest median family income of $243,340, while families with no earners (2,132) have the lowest median family income of $61,154, accounting for 51.1% and 7.0% of families, respectively.
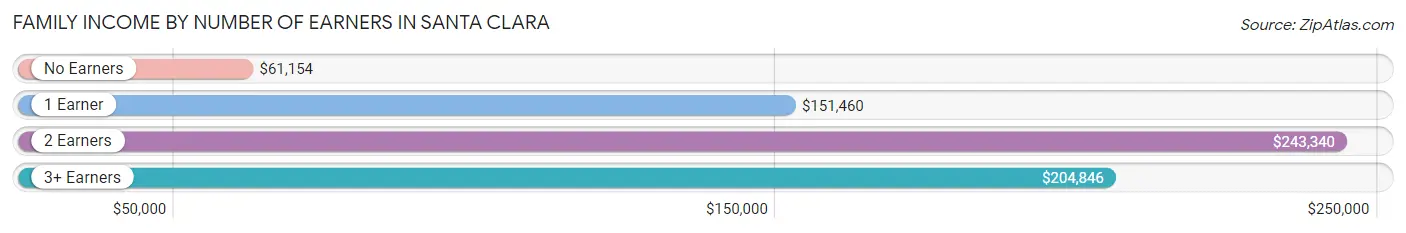
| Number of Earners | # Families | Median Income |
| No Earners | 2,132 (7.0%) | $61,154 |
| 1 Earner | 9,474 (31.1%) | $151,460 |
| 2 Earners | 15,592 (51.1%) | $243,340 |
| 3+ Earners | 3,308 (10.8%) | $204,846 |
| Total | 30,506 (100.0%) | $189,381 |
Household Income in Santa Clara
Household Income Brackets in Santa Clara
With 18,879 households falling in the category, the $200,000+ income range is the most frequent in Santa Clara, accounting for 39.8% of all households. In contrast, only 522 households (1.1%) fall into the $10,000 to $14,999 income bracket, making it the least populous group.
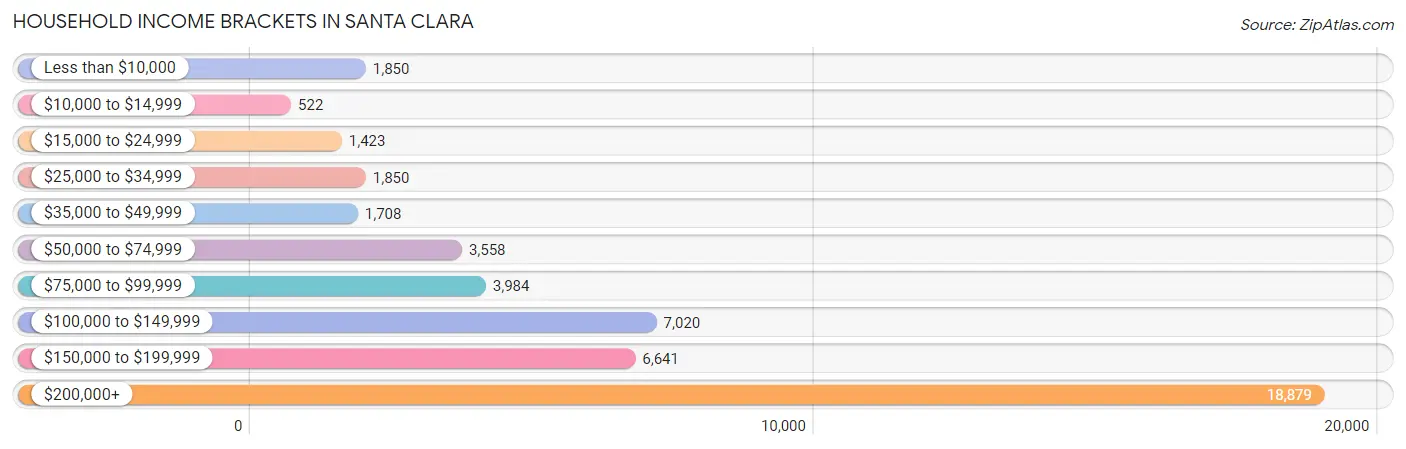
| Income Bracket | # Households | % Households |
| Less than $10,000 | 1,850 | 3.9% |
| $10,000 to $14,999 | 522 | 1.1% |
| $15,000 to $24,999 | 1,423 | 3.0% |
| $25,000 to $34,999 | 1,850 | 3.9% |
| $35,000 to $49,999 | 1,708 | 3.6% |
| $50,000 to $74,999 | 3,558 | 7.5% |
| $75,000 to $99,999 | 3,984 | 8.4% |
| $100,000 to $149,999 | 7,020 | 14.8% |
| $150,000 to $199,999 | 6,641 | 14.0% |
| $200,000+ | 18,879 | 39.8% |
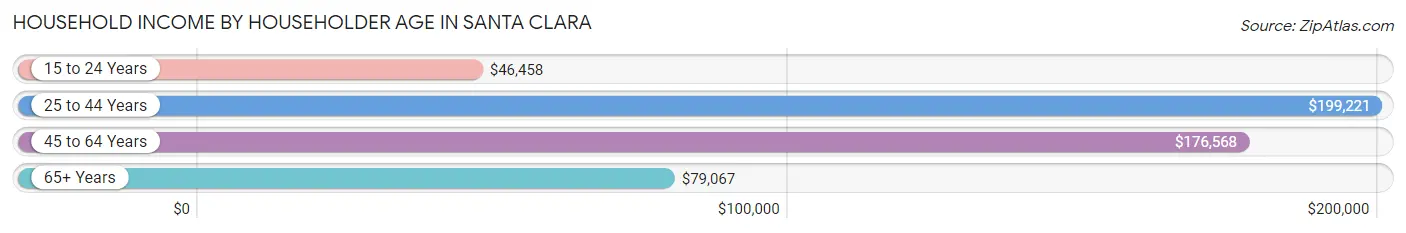
Household Income by Householder Age in Santa Clara
The median household income in Santa Clara is $165,352, with the highest median household income of $199,221 found in the 25 to 44 years age bracket for the primary householder. A total of 22,919 households (48.3%) fall into this category. Meanwhile, the 15 to 24 years age bracket for the primary householder has the lowest median household income of $46,458, with 2,149 households (4.5%) in this group.
| Income Bracket | # Households | Median Income |
| 15 to 24 Years | 2,149 (4.5%) | $46,458 |
| 25 to 44 Years | 22,919 (48.3%) | $199,221 |
| 45 to 64 Years | 14,405 (30.4%) | $176,568 |
| 65+ Years | 7,961 (16.8%) | $79,067 |
| Total | 47,434 (100.0%) | $165,352 |
Poverty in Santa Clara
Income Below Poverty by Sex and Age in Santa Clara
With 8.0% poverty level for males and 8.1% for females among the residents of Santa Clara, 18 to 24 year old males and 18 to 24 year old females are the most vulnerable to poverty, with 1,812 males (30.8%) and 1,283 females (28.1%) in their respective age groups living below the poverty level.
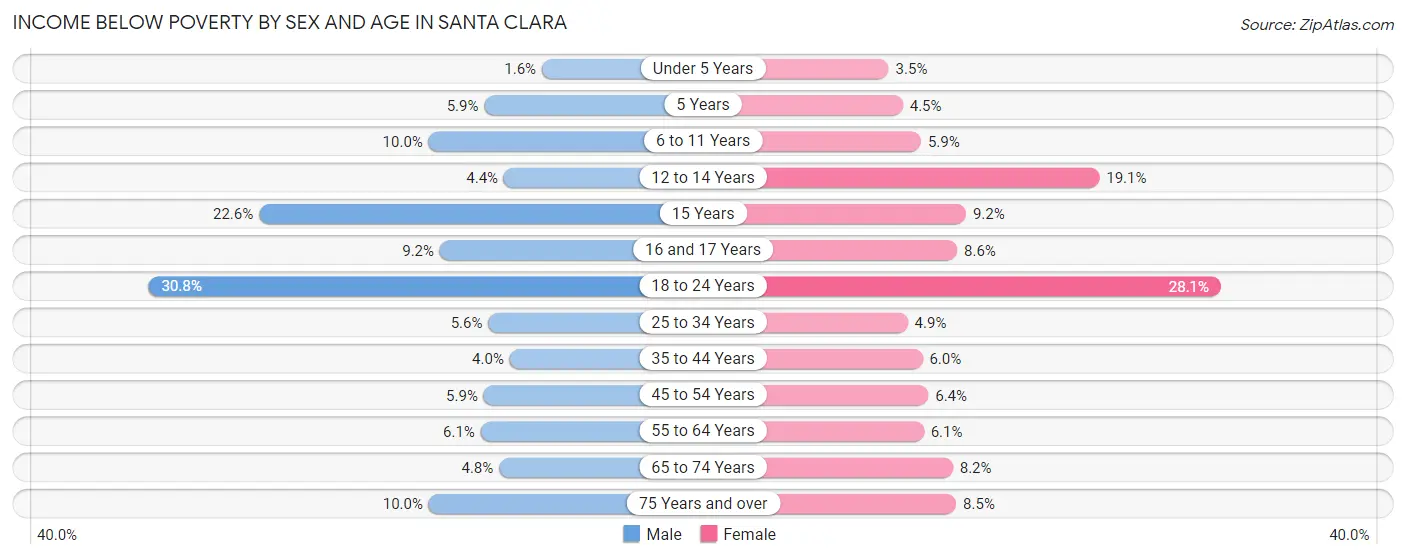
| Age Bracket | Male | Female |
| Under 5 Years | 68 (1.6%) | 113 (3.5%) |
| 5 Years | 42 (5.9%) | 36 (4.5%) |
| 6 to 11 Years | 399 (10.0%) | 204 (5.9%) |
| 12 to 14 Years | 68 (4.4%) | 255 (19.1%) |
| 15 Years | 124 (22.6%) | 73 (9.2%) |
| 16 and 17 Years | 95 (9.2%) | 88 (8.6%) |
| 18 to 24 Years | 1,812 (30.8%) | 1,283 (28.1%) |
| 25 to 34 Years | 862 (5.6%) | 636 (4.9%) |
| 35 to 44 Years | 421 (4.0%) | 555 (6.0%) |
| 45 to 54 Years | 480 (5.9%) | 415 (6.4%) |
| 55 to 64 Years | 402 (6.1%) | 424 (6.1%) |
| 65 to 74 Years | 185 (4.8%) | 317 (8.2%) |
| 75 Years and over | 263 (10.0%) | 329 (8.5%) |
| Total | 5,221 (8.0%) | 4,728 (8.1%) |
Income Above Poverty by Sex and Age in Santa Clara
According to the poverty statistics in Santa Clara, males aged under 5 years and females aged under 5 years are the age groups that are most secure financially, with 98.4% of males and 96.5% of females in these age groups living above the poverty line.
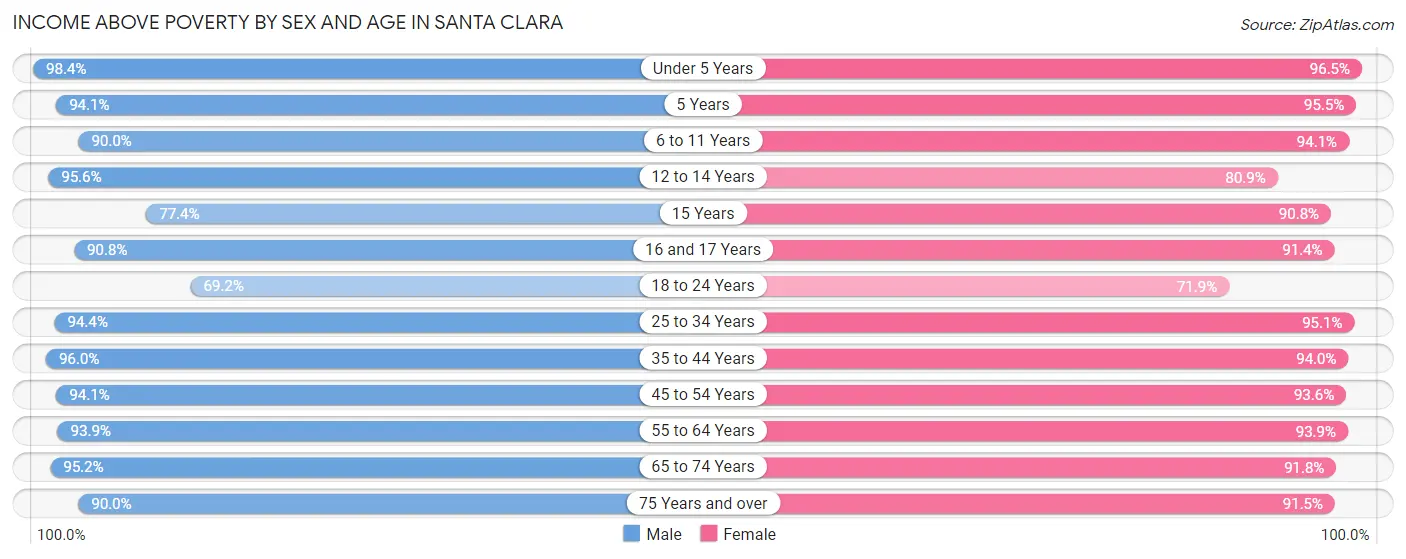
| Age Bracket | Male | Female |
| Under 5 Years | 4,222 (98.4%) | 3,137 (96.5%) |
| 5 Years | 674 (94.1%) | 759 (95.5%) |
| 6 to 11 Years | 3,591 (90.0%) | 3,267 (94.1%) |
| 12 to 14 Years | 1,475 (95.6%) | 1,079 (80.9%) |
| 15 Years | 425 (77.4%) | 719 (90.8%) |
| 16 and 17 Years | 941 (90.8%) | 940 (91.4%) |
| 18 to 24 Years | 4,071 (69.2%) | 3,277 (71.9%) |
| 25 to 34 Years | 14,616 (94.4%) | 12,382 (95.1%) |
| 35 to 44 Years | 10,164 (96.0%) | 8,713 (94.0%) |
| 45 to 54 Years | 7,637 (94.1%) | 6,045 (93.6%) |
| 55 to 64 Years | 6,150 (93.9%) | 6,549 (93.9%) |
| 65 to 74 Years | 3,693 (95.2%) | 3,528 (91.8%) |
| 75 Years and over | 2,370 (90.0%) | 3,546 (91.5%) |
| Total | 60,029 (92.0%) | 53,941 (91.9%) |
Income Below Poverty Among Married-Couple Families in Santa Clara
The poverty statistics for married-couple families in Santa Clara show that 3.2% or 794 of the total 24,860 families live below the poverty line. Families with 3 or 4 children have the highest poverty rate of 8.2%, comprising of 67 families. On the other hand, families with 5 or more children have the lowest poverty rate of 0.0%, which includes 0 families.
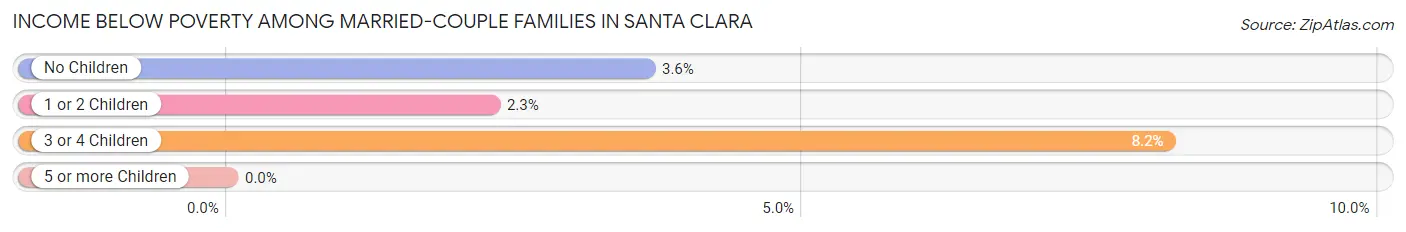
| Children | Above Poverty | Below Poverty |
| No Children | 12,866 (96.4%) | 485 (3.6%) |
| 1 or 2 Children | 10,377 (97.7%) | 242 (2.3%) |
| 3 or 4 Children | 754 (91.8%) | 67 (8.2%) |
| 5 or more Children | 69 (100.0%) | 0 (0.0%) |
| Total | 24,066 (96.8%) | 794 (3.2%) |
Income Below Poverty Among Single-Parent Households in Santa Clara
According to the poverty data in Santa Clara, 5.9% or 132 single-father households and 9.1% or 312 single-mother households are living below the poverty line. Among single-father households, those with 3 or 4 children have the highest poverty rate, with 5 households (20.8%) experiencing poverty. Likewise, among single-mother households, those with 5 or more children have the highest poverty rate, with 28 households (100.0%) falling below the poverty line.
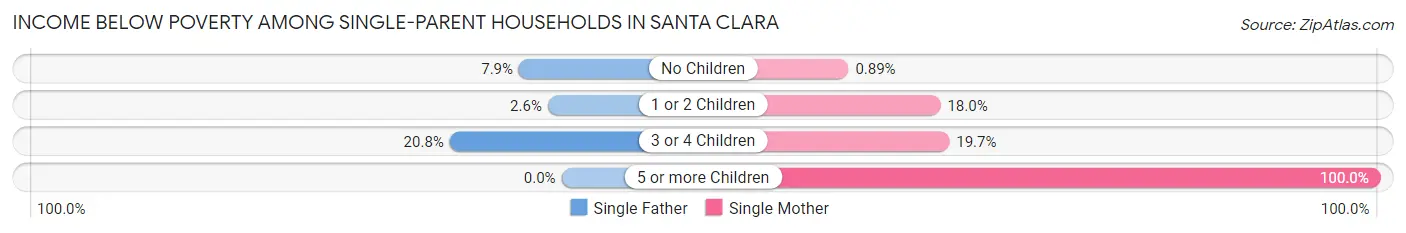
| Children | Single Father | Single Mother |
| No Children | 104 (7.9%) | 17 (0.9%) |
| 1 or 2 Children | 23 (2.6%) | 255 (18.0%) |
| 3 or 4 Children | 5 (20.8%) | 12 (19.7%) |
| 5 or more Children | 0 (0.0%) | 28 (100.0%) |
| Total | 132 (5.9%) | 312 (9.1%) |
Income Below Poverty Among Married-Couple vs Single-Parent Households in Santa Clara
The poverty data for Santa Clara shows that 794 of the married-couple family households (3.2%) and 444 of the single-parent households (7.9%) are living below the poverty level. Within the married-couple family households, those with 3 or 4 children have the highest poverty rate, with 67 households (8.2%) falling below the poverty line. Among the single-parent households, those with 5 or more children have the highest poverty rate, with 28 household (100.0%) living below poverty.
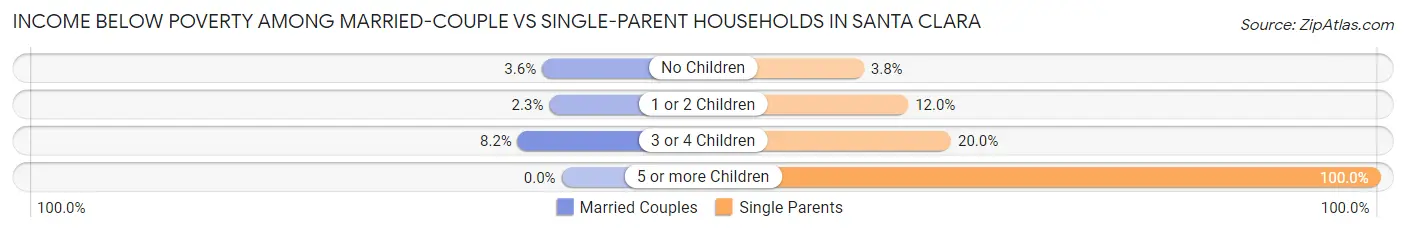
| Children | Married-Couple Families | Single-Parent Households |
| No Children | 485 (3.6%) | 121 (3.8%) |
| 1 or 2 Children | 242 (2.3%) | 278 (12.0%) |
| 3 or 4 Children | 67 (8.2%) | 17 (20.0%) |
| 5 or more Children | 0 (0.0%) | 28 (100.0%) |
| Total | 794 (3.2%) | 444 (7.9%) |
Race in Santa Clara
The most populous races in Santa Clara are Asian (60,451 | 47.2%), White / Caucasian (44,501 | 34.7%), and Hispanic or Latino (19,544 | 15.3%).
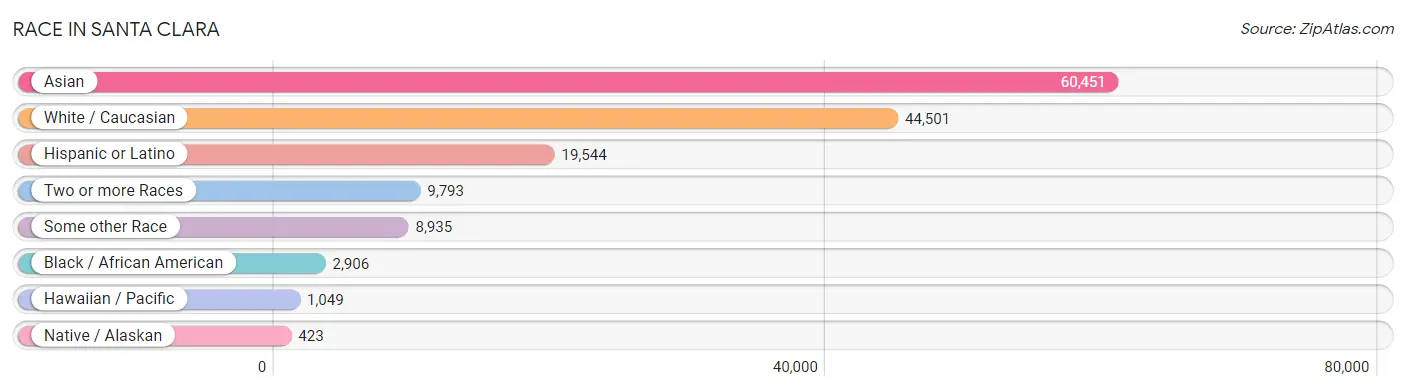
| Race | # Population | % Population |
| Asian | 60,451 | 47.2% |
| Black / African American | 2,906 | 2.3% |
| Hawaiian / Pacific | 1,049 | 0.8% |
| Hispanic or Latino | 19,544 | 15.3% |
| Native / Alaskan | 423 | 0.3% |
| White / Caucasian | 44,501 | 34.7% |
| Two or more Races | 9,793 | 7.6% |
| Some other Race | 8,935 | 7.0% |
| Total | 128,058 | 100.0% |
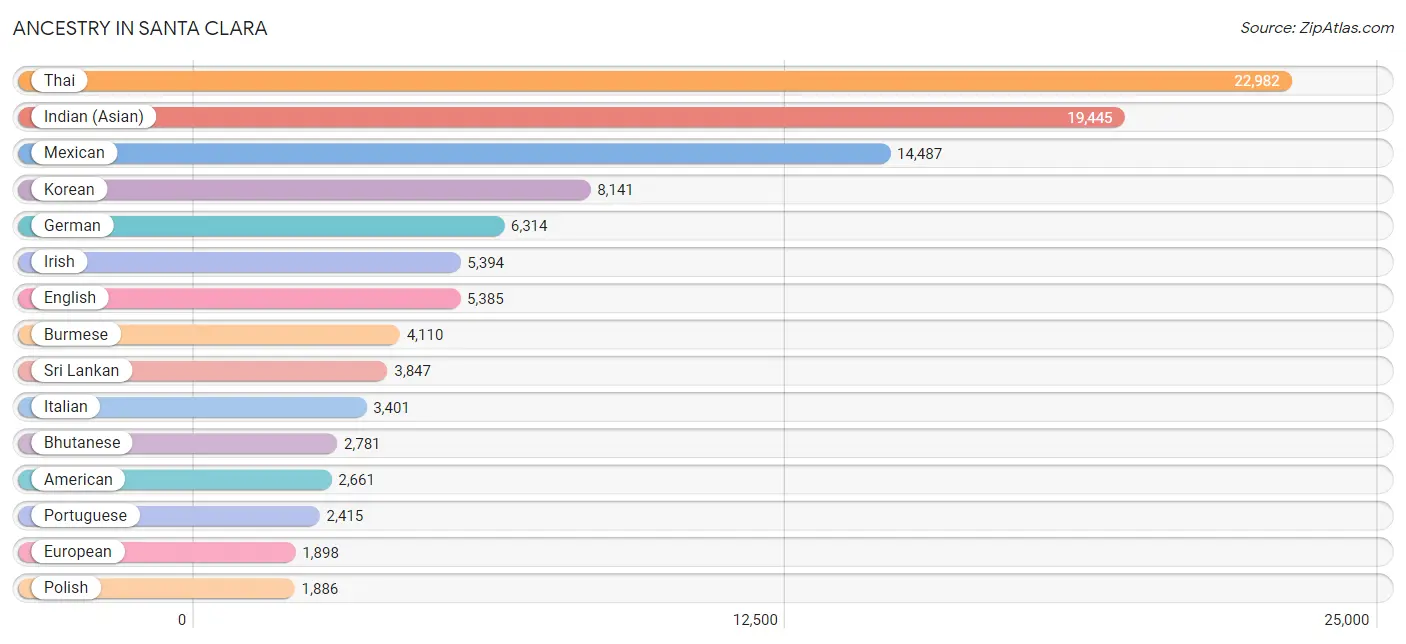
Ancestry in Santa Clara
The most populous ancestries reported in Santa Clara are Thai (22,982 | 17.9%), Indian (Asian) (19,445 | 15.2%), Mexican (14,487 | 11.3%), Korean (8,141 | 6.4%), and German (6,314 | 4.9%), together accounting for 55.7% of all Santa Clara residents.
| Ancestry | # Population | % Population |
| Afghan | 32 | 0.0% |
| African | 194 | 0.2% |
| Albanian | 12 | 0.0% |
| American | 2,661 | 2.1% |
| Apache | 122 | 0.1% |
| Arab | 1,286 | 1.0% |
| Argentinean | 148 | 0.1% |
| Armenian | 89 | 0.1% |
| Assyrian / Chaldean / Syriac | 10 | 0.0% |
| Australian | 78 | 0.1% |
| Austrian | 132 | 0.1% |
| Bangladeshi | 177 | 0.1% |
| Barbadian | 17 | 0.0% |
| Basque | 27 | 0.0% |
| Belgian | 63 | 0.1% |
| Bhutanese | 2,781 | 2.2% |
| Bolivian | 71 | 0.1% |
| Brazilian | 375 | 0.3% |
| British | 955 | 0.7% |
| British West Indian | 10 | 0.0% |
| Bulgarian | 25 | 0.0% |
| Burmese | 4,110 | 3.2% |
| Cambodian | 6 | 0.0% |
| Canadian | 376 | 0.3% |
| Central American | 1,304 | 1.0% |
| Central American Indian | 13 | 0.0% |
| Cherokee | 119 | 0.1% |
| Chilean | 270 | 0.2% |
| Chinese | 20 | 0.0% |
| Chippewa | 26 | 0.0% |
| Choctaw | 44 | 0.0% |
| Colombian | 335 | 0.3% |
| Comanche | 52 | 0.0% |
| Costa Rican | 59 | 0.1% |
| Croatian | 288 | 0.2% |
| Cuban | 287 | 0.2% |
| Czech | 283 | 0.2% |
| Czechoslovakian | 46 | 0.0% |
| Danish | 295 | 0.2% |
| Dutch | 842 | 0.7% |
| Eastern European | 225 | 0.2% |
| Ecuadorian | 24 | 0.0% |
| Egyptian | 124 | 0.1% |
| English | 5,385 | 4.2% |
| Ethiopian | 248 | 0.2% |
| European | 1,898 | 1.5% |
| Filipino | 1,401 | 1.1% |
| Finnish | 133 | 0.1% |
| French | 1,394 | 1.1% |
| French Canadian | 252 | 0.2% |
| German | 6,314 | 4.9% |
| Greek | 351 | 0.3% |
| Guamanian / Chamorro | 126 | 0.1% |
| Guatemalan | 365 | 0.3% |
| Haitian | 22 | 0.0% |
| Honduran | 87 | 0.1% |
| Hungarian | 278 | 0.2% |
| Indian (Asian) | 19,445 | 15.2% |
| Indonesian | 173 | 0.1% |
| Iranian | 1,032 | 0.8% |
| Irish | 5,394 | 4.2% |
| Iroquois | 7 | 0.0% |
| Israeli | 89 | 0.1% |
| Italian | 3,401 | 2.7% |
| Jamaican | 21 | 0.0% |
| Japanese | 116 | 0.1% |
| Jordanian | 5 | 0.0% |
| Kenyan | 230 | 0.2% |
| Korean | 8,141 | 6.4% |
| Laotian | 380 | 0.3% |
| Latvian | 40 | 0.0% |
| Lebanese | 327 | 0.3% |
| Lithuanian | 219 | 0.2% |
| Malaysian | 131 | 0.1% |
| Mexican | 14,487 | 11.3% |
| Mexican American Indian | 198 | 0.2% |
| Mongolian | 61 | 0.1% |
| Moroccan | 126 | 0.1% |
| Native Hawaiian | 200 | 0.2% |
| Navajo | 50 | 0.0% |
| Nicaraguan | 338 | 0.3% |
| Nigerian | 352 | 0.3% |
| Northern European | 274 | 0.2% |
| Norwegian | 900 | 0.7% |
| Okinawan | 67 | 0.1% |
| Ottawa | 191 | 0.2% |
| Pakistani | 276 | 0.2% |
| Palestinian | 261 | 0.2% |
| Panamanian | 111 | 0.1% |
| Pennsylvania German | 8 | 0.0% |
| Peruvian | 249 | 0.2% |
| Polish | 1,886 | 1.5% |
| Portuguese | 2,415 | 1.9% |
| Puerto Rican | 353 | 0.3% |
| Romanian | 38 | 0.0% |
| Russian | 1,371 | 1.1% |
| Salvadoran | 344 | 0.3% |
| Samoan | 192 | 0.2% |
| Scandinavian | 252 | 0.2% |
| Scotch-Irish | 226 | 0.2% |
| Scottish | 1,137 | 0.9% |
| Seminole | 12 | 0.0% |
| Serbian | 59 | 0.1% |
| Slavic | 129 | 0.1% |
| Slovak | 66 | 0.1% |
| Slovene | 10 | 0.0% |
| Somali | 234 | 0.2% |
| South African | 54 | 0.0% |
| South American | 1,173 | 0.9% |
| Spaniard | 591 | 0.5% |
| Spanish | 517 | 0.4% |
| Spanish American Indian | 17 | 0.0% |
| Sri Lankan | 3,847 | 3.0% |
| Subsaharan African | 1,263 | 1.0% |
| Swedish | 991 | 0.8% |
| Swiss | 217 | 0.2% |
| Syrian | 155 | 0.1% |
| Thai | 22,982 | 17.9% |
| Tongan | 280 | 0.2% |
| Trinidadian and Tobagonian | 40 | 0.0% |
| Turkish | 482 | 0.4% |
| Ukrainian | 602 | 0.5% |
| Uruguayan | 5 | 0.0% |
| Venezuelan | 71 | 0.1% |
| Vietnamese | 262 | 0.2% |
| Welsh | 361 | 0.3% |
| Yaqui | 81 | 0.1% |
| Yugoslavian | 216 | 0.2% | View All 128 Rows |
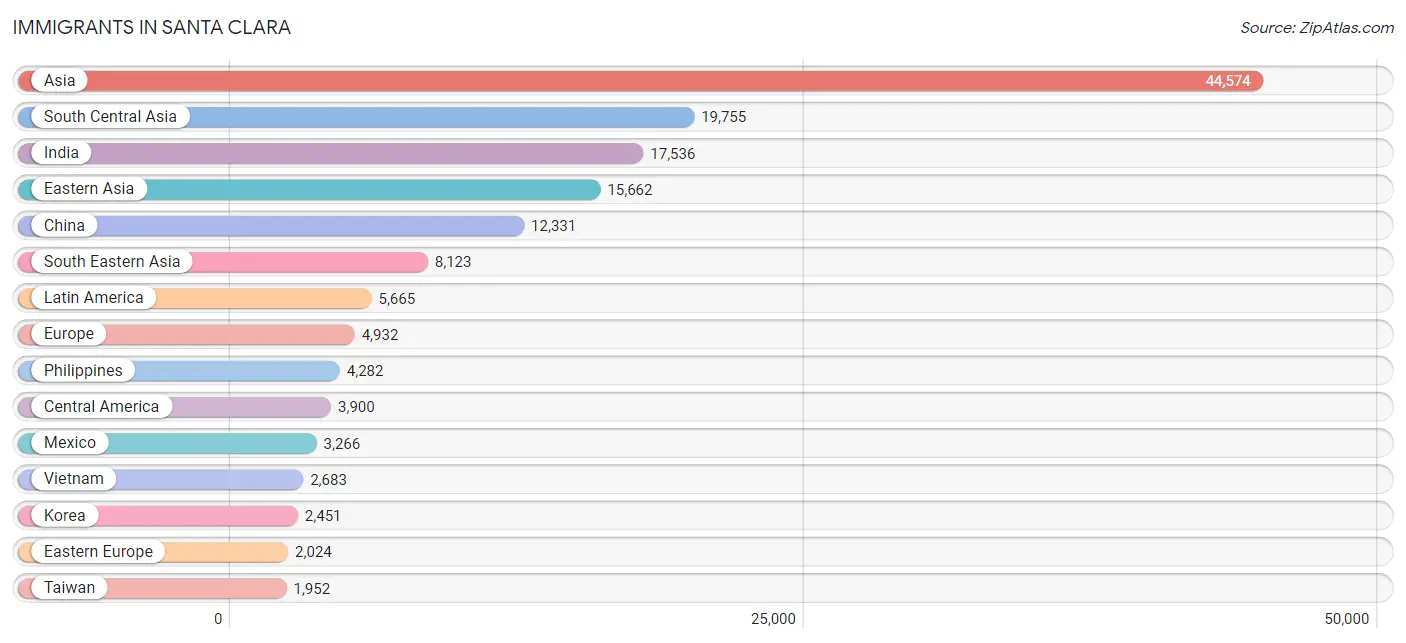
Immigrants in Santa Clara
The most numerous immigrant groups reported in Santa Clara came from Asia (44,574 | 34.8%), South Central Asia (19,755 | 15.4%), India (17,536 | 13.7%), Eastern Asia (15,662 | 12.2%), and China (12,331 | 9.6%), together accounting for 85.8% of all Santa Clara residents.
| Immigration Origin | # Population | % Population |
| Afghanistan | 63 | 0.1% |
| Africa | 1,210 | 0.9% |
| Argentina | 111 | 0.1% |
| Asia | 44,574 | 34.8% |
| Australia | 112 | 0.1% |
| Austria | 53 | 0.0% |
| Azores | 188 | 0.2% |
| Bangladesh | 202 | 0.2% |
| Belarus | 115 | 0.1% |
| Belgium | 25 | 0.0% |
| Bolivia | 55 | 0.0% |
| Bosnia and Herzegovina | 107 | 0.1% |
| Brazil | 717 | 0.6% |
| Bulgaria | 25 | 0.0% |
| Cambodia | 23 | 0.0% |
| Canada | 662 | 0.5% |
| Caribbean | 53 | 0.0% |
| Central America | 3,900 | 3.0% |
| Chile | 235 | 0.2% |
| China | 12,331 | 9.6% |
| Colombia | 226 | 0.2% |
| Costa Rica | 27 | 0.0% |
| Croatia | 59 | 0.1% |
| Cuba | 38 | 0.0% |
| Czechoslovakia | 7 | 0.0% |
| Eastern Africa | 703 | 0.5% |
| Eastern Asia | 15,662 | 12.2% |
| Eastern Europe | 2,024 | 1.6% |
| Ecuador | 24 | 0.0% |
| Egypt | 119 | 0.1% |
| El Salvador | 233 | 0.2% |
| England | 119 | 0.1% |
| Eritrea | 74 | 0.1% |
| Ethiopia | 92 | 0.1% |
| Europe | 4,932 | 3.8% |
| Fiji | 392 | 0.3% |
| France | 295 | 0.2% |
| Germany | 503 | 0.4% |
| Greece | 80 | 0.1% |
| Guatemala | 234 | 0.2% |
| Honduras | 64 | 0.1% |
| Hong Kong | 775 | 0.6% |
| Hungary | 31 | 0.0% |
| India | 17,536 | 13.7% |
| Indonesia | 458 | 0.4% |
| Iran | 1,037 | 0.8% |
| Iraq | 35 | 0.0% |
| Ireland | 55 | 0.0% |
| Israel | 104 | 0.1% |
| Italy | 116 | 0.1% |
| Japan | 842 | 0.7% |
| Jordan | 162 | 0.1% |
| Kazakhstan | 78 | 0.1% |
| Kenya | 222 | 0.2% |
| Korea | 2,451 | 1.9% |
| Kuwait | 31 | 0.0% |
| Laos | 53 | 0.0% |
| Latin America | 5,665 | 4.4% |
| Latvia | 41 | 0.0% |
| Lebanon | 272 | 0.2% |
| Lithuania | 89 | 0.1% |
| Malaysia | 108 | 0.1% |
| Mexico | 3,266 | 2.5% |
| Middle Africa | 26 | 0.0% |
| Moldova | 83 | 0.1% |
| Morocco | 88 | 0.1% |
| Nepal | 192 | 0.2% |
| Netherlands | 141 | 0.1% |
| Nicaragua | 64 | 0.1% |
| Nigeria | 210 | 0.2% |
| Northern Africa | 212 | 0.2% |
| Northern Europe | 800 | 0.6% |
| Norway | 4 | 0.0% |
| Oceania | 705 | 0.5% |
| Pakistan | 366 | 0.3% |
| Panama | 12 | 0.0% |
| Peru | 281 | 0.2% |
| Philippines | 4,282 | 3.3% |
| Poland | 297 | 0.2% |
| Portugal | 696 | 0.5% |
| Romania | 28 | 0.0% |
| Russia | 533 | 0.4% |
| Saudi Arabia | 56 | 0.0% |
| Scotland | 6 | 0.0% |
| Singapore | 243 | 0.2% |
| Somalia | 297 | 0.2% |
| South Africa | 59 | 0.1% |
| South America | 1,712 | 1.3% |
| South Central Asia | 19,755 | 15.4% |
| South Eastern Asia | 8,123 | 6.3% |
| Southern Europe | 1,055 | 0.8% |
| Spain | 163 | 0.1% |
| Sri Lanka | 216 | 0.2% |
| Sweden | 19 | 0.0% |
| Switzerland | 25 | 0.0% |
| Syria | 21 | 0.0% |
| Taiwan | 1,952 | 1.5% |
| Thailand | 128 | 0.1% |
| Trinidad and Tobago | 15 | 0.0% |
| Turkey | 164 | 0.1% |
| Ukraine | 428 | 0.3% |
| Uruguay | 5 | 0.0% |
| Uzbekistan | 65 | 0.1% |
| Venezuela | 58 | 0.1% |
| Vietnam | 2,683 | 2.1% |
| Western Africa | 210 | 0.2% |
| Western Asia | 1,007 | 0.8% |
| Western Europe | 1,042 | 0.8% |
| Zimbabwe | 18 | 0.0% | View All 109 Rows |
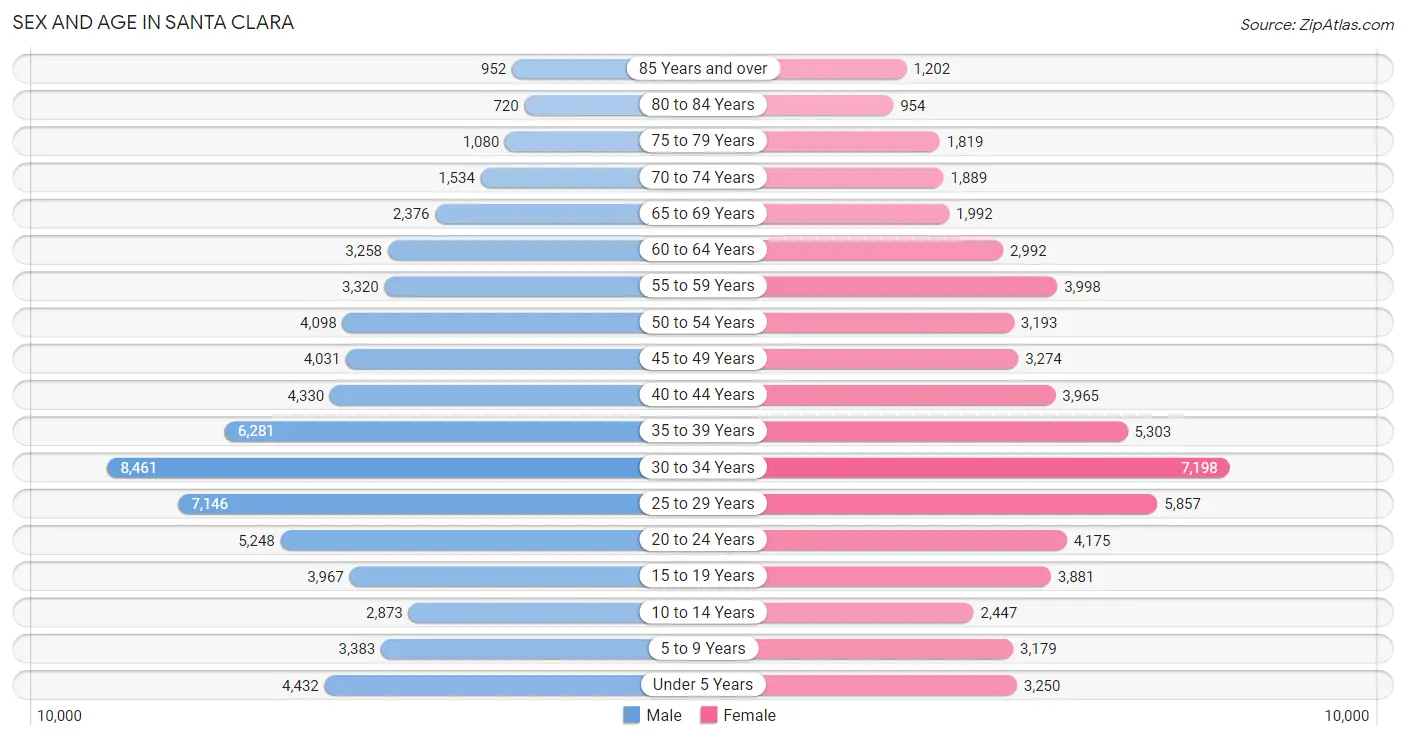
Sex and Age in Santa Clara
Sex and Age in Santa Clara
The most populous age groups in Santa Clara are 30 to 34 Years (8,461 | 12.5%) for men and 30 to 34 Years (7,198 | 11.9%) for women.
| Age Bracket | Male | Female |
| Under 5 Years | 4,432 (6.6%) | 3,250 (5.4%) |
| 5 to 9 Years | 3,383 (5.0%) | 3,179 (5.2%) |
| 10 to 14 Years | 2,873 (4.3%) | 2,447 (4.0%) |
| 15 to 19 Years | 3,967 (5.9%) | 3,881 (6.4%) |
| 20 to 24 Years | 5,248 (7.8%) | 4,175 (6.9%) |
| 25 to 29 Years | 7,146 (10.6%) | 5,857 (9.7%) |
| 30 to 34 Years | 8,461 (12.5%) | 7,198 (11.9%) |
| 35 to 39 Years | 6,281 (9.3%) | 5,303 (8.8%) |
| 40 to 44 Years | 4,330 (6.4%) | 3,965 (6.6%) |
| 45 to 49 Years | 4,031 (6.0%) | 3,274 (5.4%) |
| 50 to 54 Years | 4,098 (6.1%) | 3,193 (5.3%) |
| 55 to 59 Years | 3,320 (4.9%) | 3,998 (6.6%) |
| 60 to 64 Years | 3,258 (4.8%) | 2,992 (4.9%) |
| 65 to 69 Years | 2,376 (3.5%) | 1,992 (3.3%) |
| 70 to 74 Years | 1,534 (2.3%) | 1,889 (3.1%) |
| 75 to 79 Years | 1,080 (1.6%) | 1,819 (3.0%) |
| 80 to 84 Years | 720 (1.1%) | 954 (1.6%) |
| 85 Years and over | 952 (1.4%) | 1,202 (2.0%) |
| Total | 67,490 (100.0%) | 60,568 (100.0%) |
Families and Households in Santa Clara
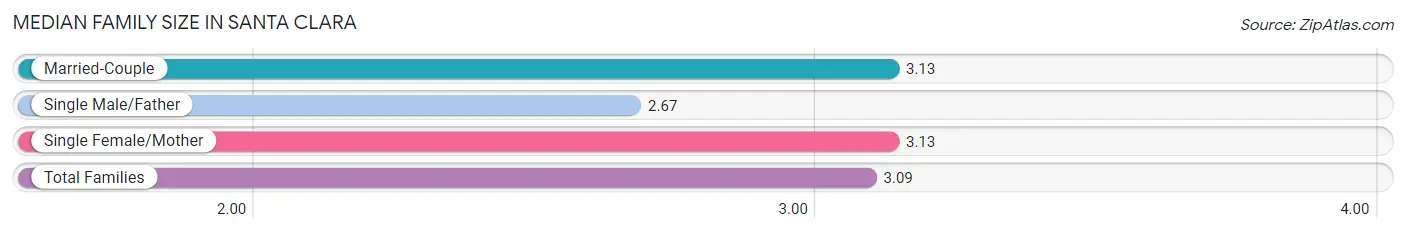
Median Family Size in Santa Clara
The median family size in Santa Clara is 3.09 persons per family, with married-couple families (24,860 | 81.5%) accounting for the largest median family size of 3.13 persons per family. On the other hand, single male/father families (2,233 | 7.3%) represent the smallest median family size with 2.67 persons per family.
| Family Type | # Families | Family Size |
| Married-Couple | 24,860 (81.5%) | 3.13 |
| Single Male/Father | 2,233 (7.3%) | 2.67 |
| Single Female/Mother | 3,413 (11.2%) | 3.13 |
| Total Families | 30,506 (100.0%) | 3.09 |
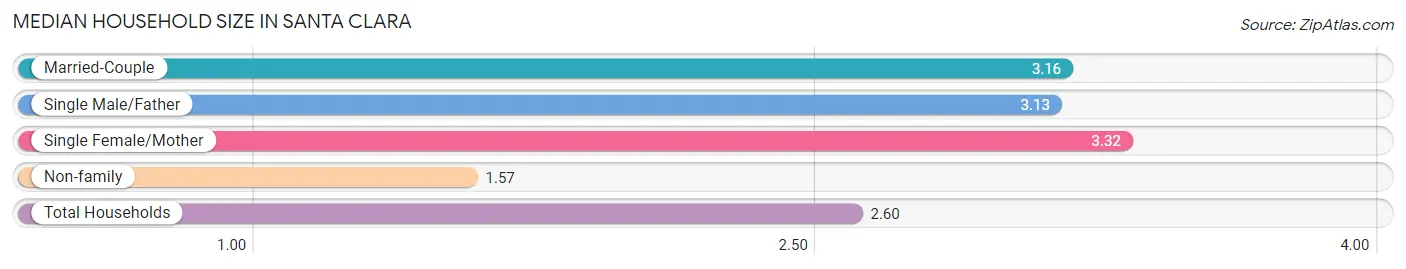
Median Household Size in Santa Clara
The median household size in Santa Clara is 2.60 persons per household, with single female/mother households (3,413 | 7.2%) accounting for the largest median household size of 3.32 persons per household. non-family households (16,928 | 35.7%) represent the smallest median household size with 1.57 persons per household.
| Household Type | # Households | Household Size |
| Married-Couple | 24,860 (52.4%) | 3.16 |
| Single Male/Father | 2,233 (4.7%) | 3.13 |
| Single Female/Mother | 3,413 (7.2%) | 3.32 |
| Non-family | 16,928 (35.7%) | 1.57 |
| Total Households | 47,434 (100.0%) | 2.60 |
Household Size by Marriage Status in Santa Clara
Out of a total of 47,434 households in Santa Clara, 30,506 (64.3%) are family households, while 16,928 (35.7%) are nonfamily households. The most numerous type of family households are 2-person households, comprising 12,527, and the most common type of nonfamily households are 1-person households, comprising 11,360.
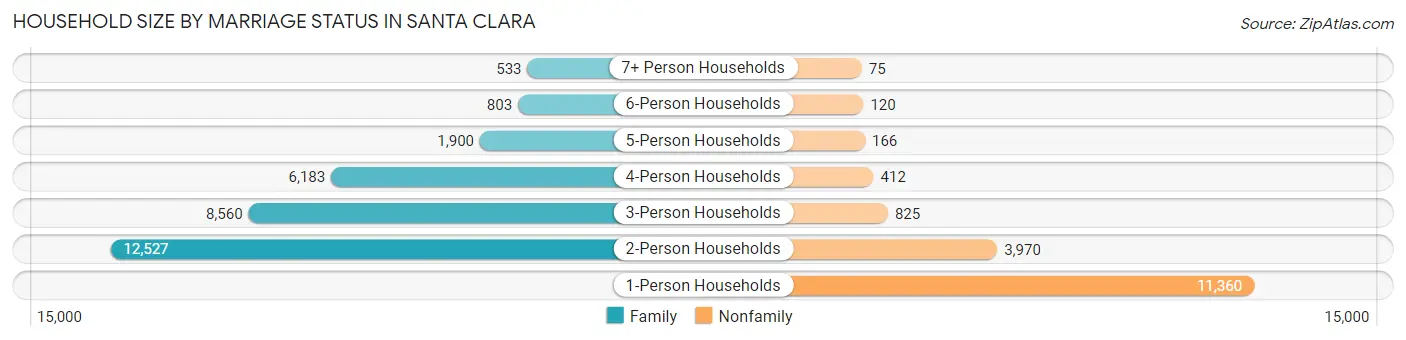
| Household Size | Family Households | Nonfamily Households |
| 1-Person Households | - | 11,360 (23.9%) |
| 2-Person Households | 12,527 (26.4%) | 3,970 (8.4%) |
| 3-Person Households | 8,560 (18.0%) | 825 (1.7%) |
| 4-Person Households | 6,183 (13.0%) | 412 (0.9%) |
| 5-Person Households | 1,900 (4.0%) | 166 (0.4%) |
| 6-Person Households | 803 (1.7%) | 120 (0.3%) |
| 7+ Person Households | 533 (1.1%) | 75 (0.2%) |
| Total | 30,506 (64.3%) | 16,928 (35.7%) |
Female Fertility in Santa Clara
Fertility by Age in Santa Clara
Average fertility rate in Santa Clara is 43.0 births per 1,000 women. Women in the age bracket of 20 to 34 years have the highest fertility rate with 57.0 births per 1,000 women. Women in the age bracket of 20 to 34 years acount for 66.4% of all women with births.
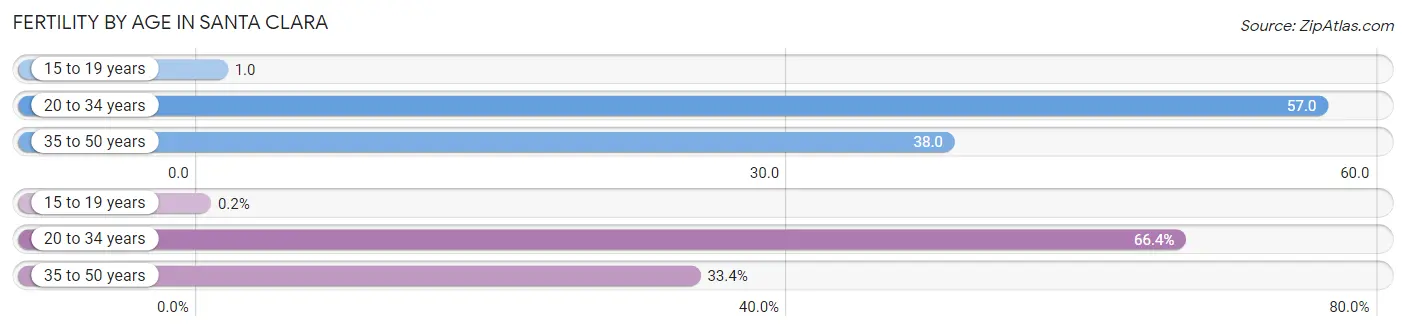
| Age Bracket | Women with Births | Births / 1,000 Women |
| 15 to 19 years | 3 (0.2%) | 1.0 |
| 20 to 34 years | 987 (66.4%) | 57.0 |
| 35 to 50 years | 497 (33.4%) | 38.0 |
| Total | 1,487 (100.0%) | 43.0 |
Fertility by Age by Marriage Status in Santa Clara
90.9% of women with births (1,487) in Santa Clara are married. The highest percentage of unmarried women with births falls into 15 to 19 years age bracket with 100.0% of them unmarried at the time of birth, while the lowest percentage of unmarried women with births belong to 20 to 34 years age bracket with 7.3% of them unmarried.
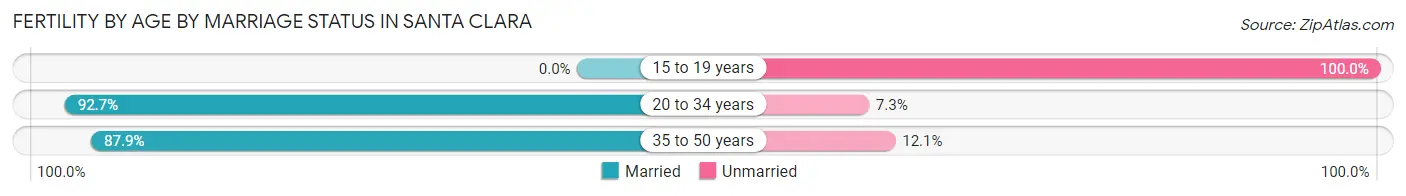
| Age Bracket | Married | Unmarried |
| 15 to 19 years | 0 (0.0%) | 3 (100.0%) |
| 20 to 34 years | 915 (92.7%) | 72 (7.3%) |
| 35 to 50 years | 437 (87.9%) | 60 (12.1%) |
| Total | 1,352 (90.9%) | 135 (9.1%) |
Fertility by Education in Santa Clara
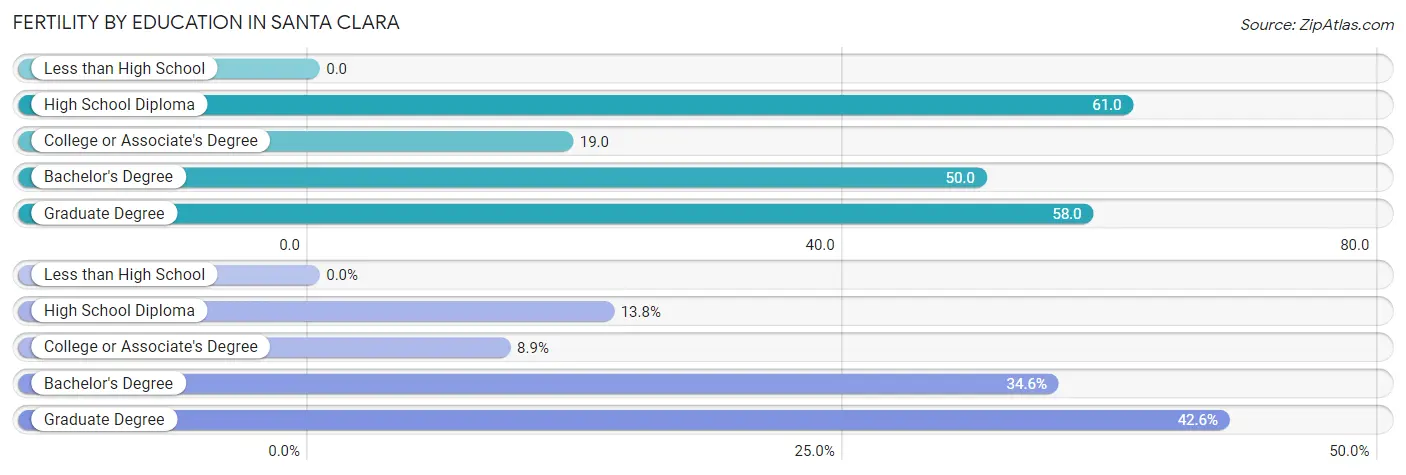
| Educational Attainment | Women with Births | Births / 1,000 Women |
| Less than High School | 0 (0.0%) | 0.0 |
| High School Diploma | 205 (13.8%) | 61.0 |
| College or Associate's Degree | 133 (8.9%) | 19.0 |
| Bachelor's Degree | 515 (34.6%) | 50.0 |
| Graduate Degree | 634 (42.6%) | 58.0 |
| Total | 1,487 (100.0%) | 43.0 |
Fertility by Education by Marriage Status in Santa Clara
9.1% of women with births in Santa Clara are unmarried. Women with the educational attainment of bachelor's degree are most likely to be married with 99.0% of them married at childbirth, while women with the educational attainment of high school diploma are least likely to be married with 41.0% of them unmarried at childbirth.
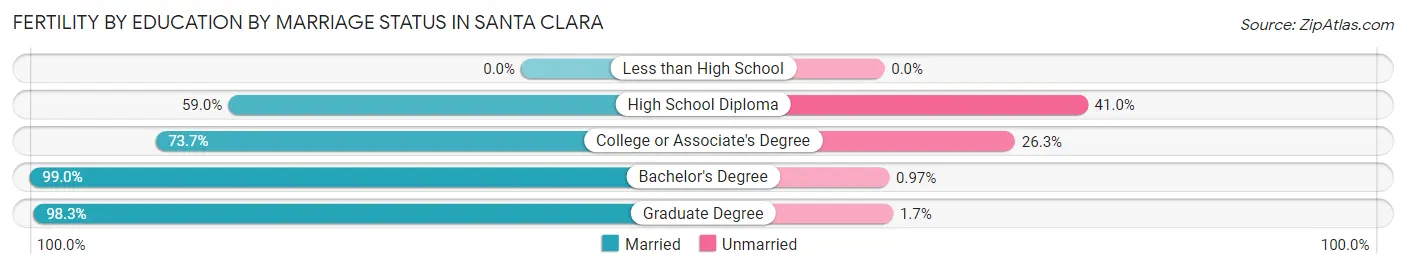
| Educational Attainment | Married | Unmarried |
| Less than High School | 0 (0.0%) | 0 (0.0%) |
| High School Diploma | 121 (59.0%) | 84 (41.0%) |
| College or Associate's Degree | 98 (73.7%) | 35 (26.3%) |
| Bachelor's Degree | 510 (99.0%) | 5 (1.0%) |
| Graduate Degree | 623 (98.3%) | 11 (1.7%) |
| Total | 1,352 (90.9%) | 135 (9.1%) |
Employment Characteristics in Santa Clara
Employment by Class of Employer in Santa Clara
Among the 71,984 employed individuals in Santa Clara, private company employees (56,929 | 79.1%), not-for-profit organizations (4,999 | 6.9%), and local government employees (4,340 | 6.0%) make up the most common classes of employment.
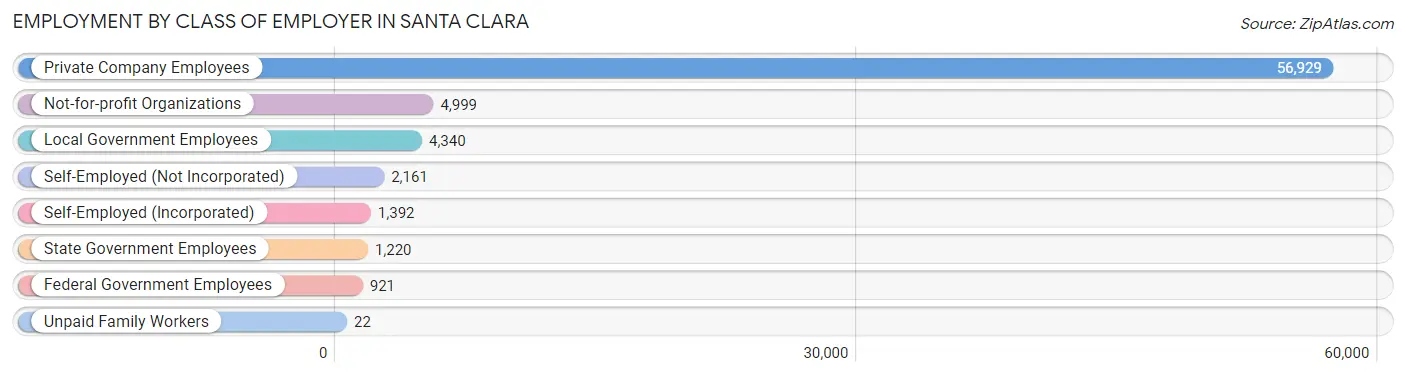
| Employer Class | # Employees | % Employees |
| Private Company Employees | 56,929 | 79.1% |
| Self-Employed (Incorporated) | 1,392 | 1.9% |
| Self-Employed (Not Incorporated) | 2,161 | 3.0% |
| Not-for-profit Organizations | 4,999 | 6.9% |
| Local Government Employees | 4,340 | 6.0% |
| State Government Employees | 1,220 | 1.7% |
| Federal Government Employees | 921 | 1.3% |
| Unpaid Family Workers | 22 | 0.0% |
| Total | 71,984 | 100.0% |
Employment Status by Age in Santa Clara
According to the labor force statistics for Santa Clara, out of the total population over 16 years of age (107,152), 71.6% or 76,721 individuals are in the labor force, with 4.2% or 3,222 of them unemployed. The age group with the highest labor force participation rate is 30 to 34 years, with 88.8% or 13,905 individuals in the labor force. Within the labor force, the 55 to 59 years age range has the highest percentage of unemployed individuals, with 7.4% or 439 of them being unemployed.
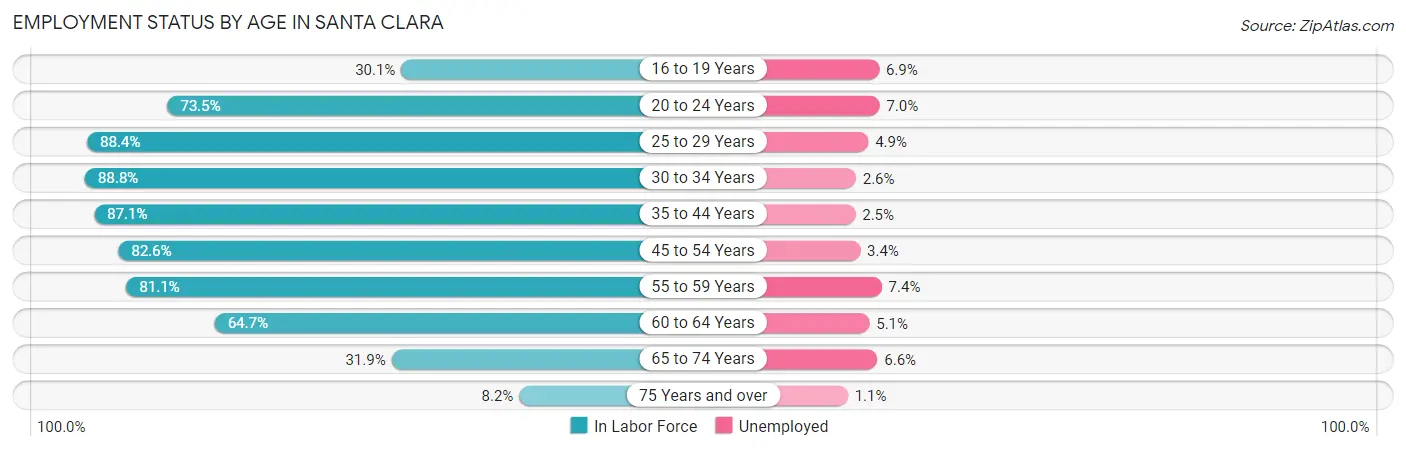
| Age Bracket | In Labor Force | Unemployed |
| 16 to 19 Years | 1,958 (30.1%) | 135 (6.9%) |
| 20 to 24 Years | 6,926 (73.5%) | 485 (7.0%) |
| 25 to 29 Years | 11,495 (88.4%) | 563 (4.9%) |
| 30 to 34 Years | 13,905 (88.8%) | 362 (2.6%) |
| 35 to 44 Years | 17,315 (87.1%) | 433 (2.5%) |
| 45 to 54 Years | 12,056 (82.6%) | 410 (3.4%) |
| 55 to 59 Years | 5,935 (81.1%) | 439 (7.4%) |
| 60 to 64 Years | 4,044 (64.7%) | 206 (5.1%) |
| 65 to 74 Years | 2,485 (31.9%) | 164 (6.6%) |
| 75 Years and over | 552 (8.2%) | 6 (1.1%) |
| Total | 76,721 (71.6%) | 3,222 (4.2%) |
Employment Status by Educational Attainment in Santa Clara
According to labor force statistics for Santa Clara, 84.4% of individuals (64,739) out of the total population between 25 and 64 years of age (76,705) are in the labor force, with 3.7% or 2,395 of them being unemployed. The group with the highest labor force participation rate are those with the educational attainment of bachelor's degree or higher, with 87.4% or 46,091 individuals in the labor force. Within the labor force, individuals with less than high school education have the highest percentage of unemployment, with 11.2% or 292 of them being unemployed.
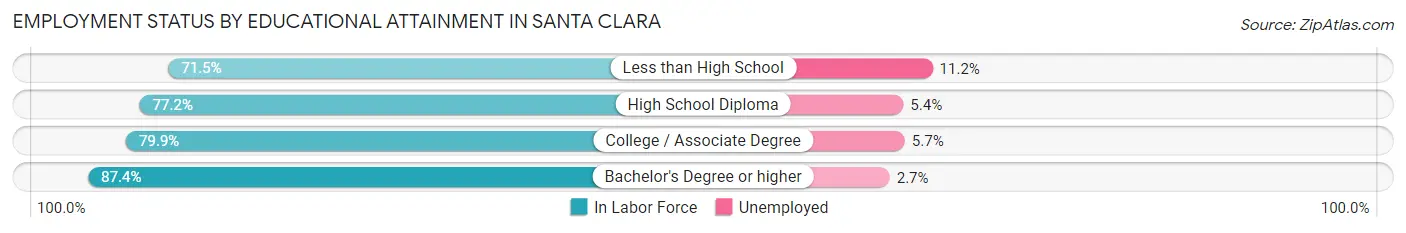
| Educational Attainment | In Labor Force | Unemployed |
| Less than High School | 2,606 (71.5%) | 408 (11.2%) |
| High School Diploma | 5,650 (77.2%) | 395 (5.4%) |
| College / Associate Degree | 10,391 (79.9%) | 741 (5.7%) |
| Bachelor's Degree or higher | 46,091 (87.4%) | 1,424 (2.7%) |
| Total | 64,739 (84.4%) | 2,838 (3.7%) |
Employment Occupations by Sex in Santa Clara
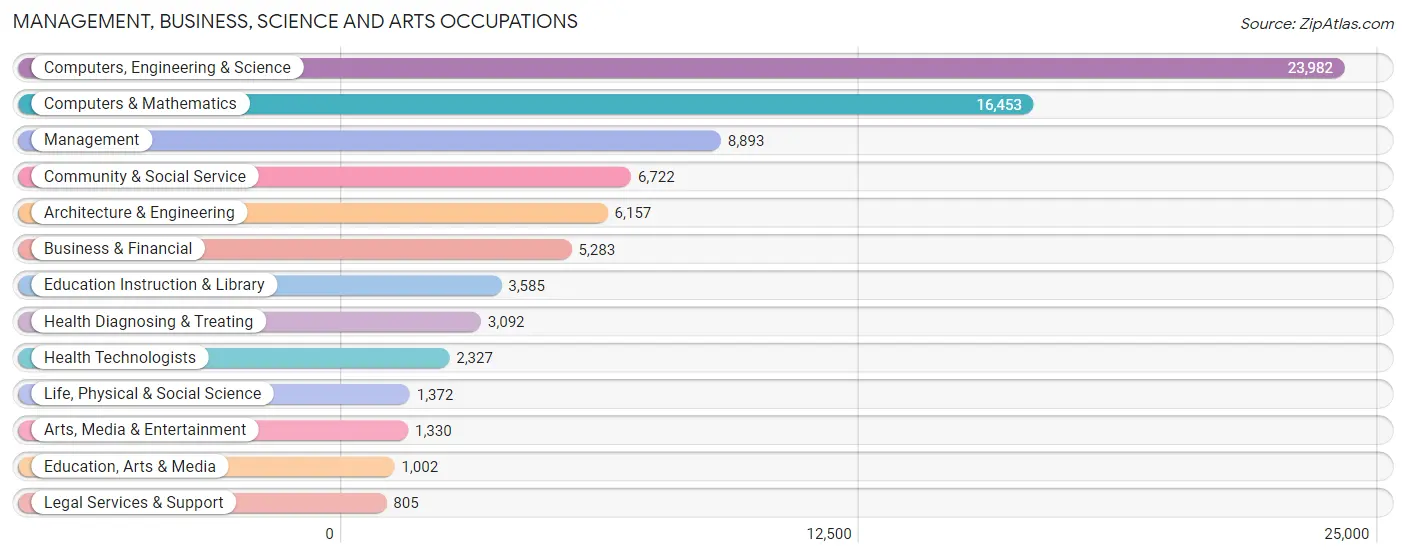
Management, Business, Science and Arts Occupations
The most common Management, Business, Science and Arts occupations in Santa Clara are Computers, Engineering & Science (23,982 | 32.7%), Computers & Mathematics (16,453 | 22.5%), Management (8,893 | 12.1%), Community & Social Service (6,722 | 9.2%), and Architecture & Engineering (6,157 | 8.4%).
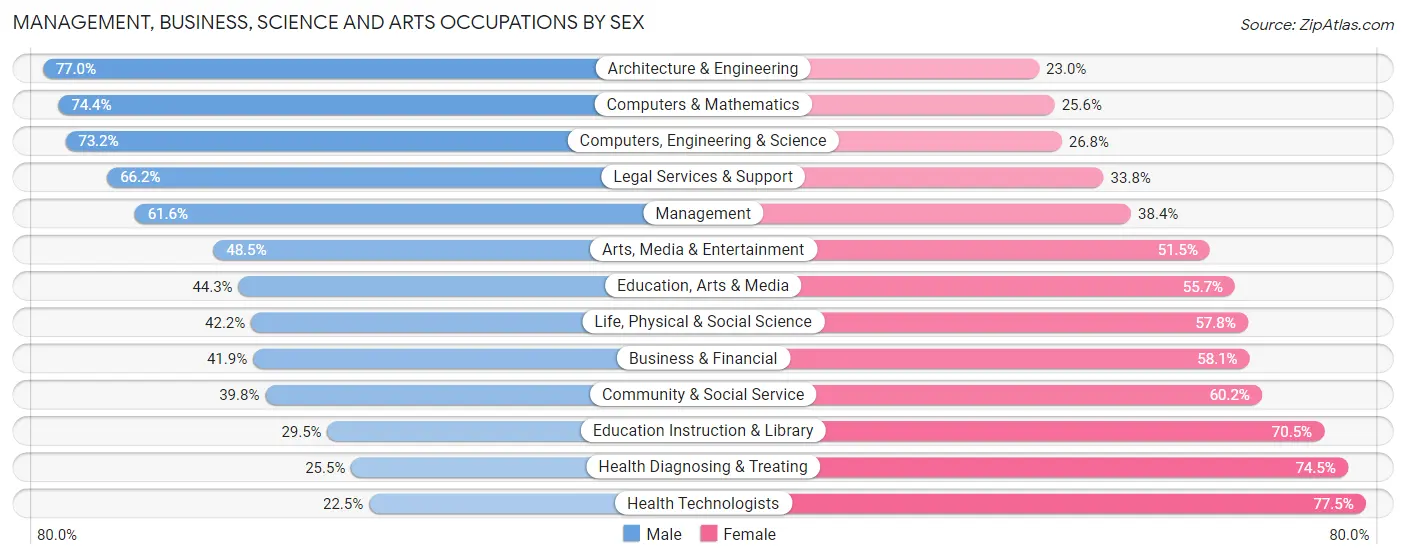
Management, Business, Science and Arts Occupations by Sex
Within the Management, Business, Science and Arts occupations in Santa Clara, the most male-oriented occupations are Architecture & Engineering (77.0%), Computers & Mathematics (74.4%), and Computers, Engineering & Science (73.2%), while the most female-oriented occupations are Health Technologists (77.5%), Health Diagnosing & Treating (74.5%), and Education Instruction & Library (70.5%).
| Occupation | Male | Female |
| Management | 5,480 (61.6%) | 3,413 (38.4%) |
| Business & Financial | 2,213 (41.9%) | 3,070 (58.1%) |
| Computers, Engineering & Science | 17,554 (73.2%) | 6,428 (26.8%) |
| Computers & Mathematics | 12,236 (74.4%) | 4,217 (25.6%) |
| Architecture & Engineering | 4,739 (77.0%) | 1,418 (23.0%) |
| Life, Physical & Social Science | 579 (42.2%) | 793 (57.8%) |
| Community & Social Service | 2,678 (39.8%) | 4,044 (60.2%) |
| Education, Arts & Media | 444 (44.3%) | 558 (55.7%) |
| Legal Services & Support | 533 (66.2%) | 272 (33.8%) |
| Education Instruction & Library | 1,056 (29.5%) | 2,529 (70.5%) |
| Arts, Media & Entertainment | 645 (48.5%) | 685 (51.5%) |
| Health Diagnosing & Treating | 788 (25.5%) | 2,304 (74.5%) |
| Health Technologists | 524 (22.5%) | 1,803 (77.5%) |
| Total (Category) | 28,713 (59.9%) | 19,259 (40.2%) |
| Total (Overall) | 42,296 (57.7%) | 30,978 (42.3%) |
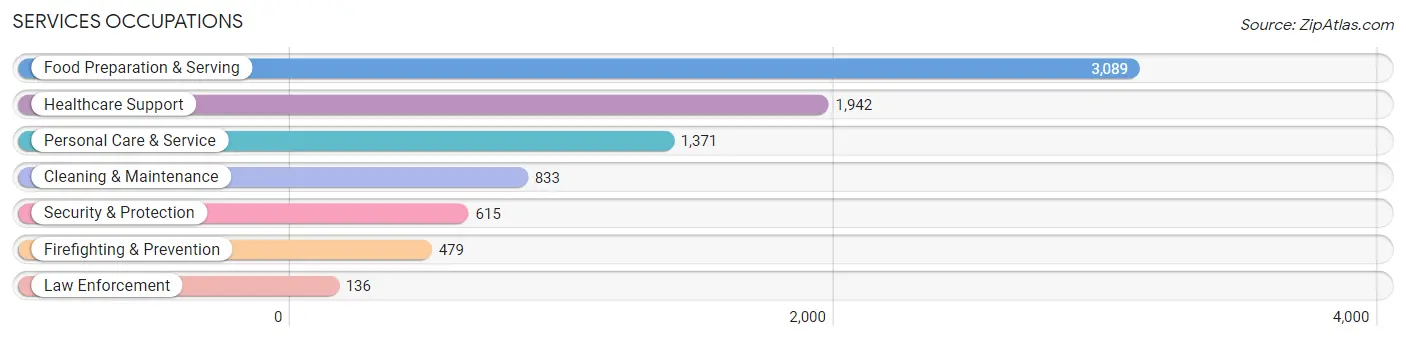
Services Occupations
The most common Services occupations in Santa Clara are Food Preparation & Serving (3,089 | 4.2%), Healthcare Support (1,942 | 2.6%), Personal Care & Service (1,371 | 1.9%), Cleaning & Maintenance (833 | 1.1%), and Security & Protection (615 | 0.8%).
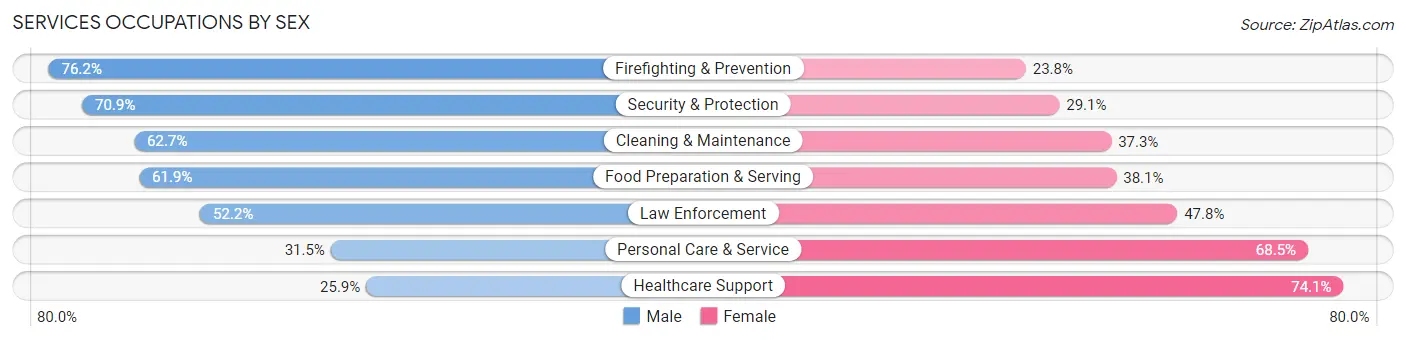
Services Occupations by Sex
Within the Services occupations in Santa Clara, the most male-oriented occupations are Firefighting & Prevention (76.2%), Security & Protection (70.9%), and Cleaning & Maintenance (62.7%), while the most female-oriented occupations are Healthcare Support (74.1%), Personal Care & Service (68.5%), and Law Enforcement (47.8%).
| Occupation | Male | Female |
| Healthcare Support | 503 (25.9%) | 1,439 (74.1%) |
| Security & Protection | 436 (70.9%) | 179 (29.1%) |
| Firefighting & Prevention | 365 (76.2%) | 114 (23.8%) |
| Law Enforcement | 71 (52.2%) | 65 (47.8%) |
| Food Preparation & Serving | 1,911 (61.9%) | 1,178 (38.1%) |
| Cleaning & Maintenance | 522 (62.7%) | 311 (37.3%) |
| Personal Care & Service | 432 (31.5%) | 939 (68.5%) |
| Total (Category) | 3,804 (48.5%) | 4,046 (51.5%) |
| Total (Overall) | 42,296 (57.7%) | 30,978 (42.3%) |
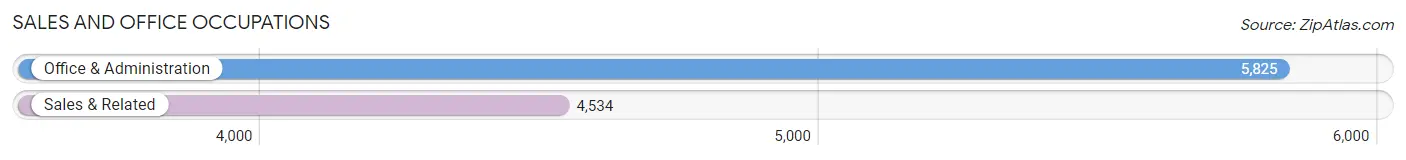
Sales and Office Occupations
The most common Sales and Office occupations in Santa Clara are Office & Administration (5,825 | 8.0%), and Sales & Related (4,534 | 6.2%).
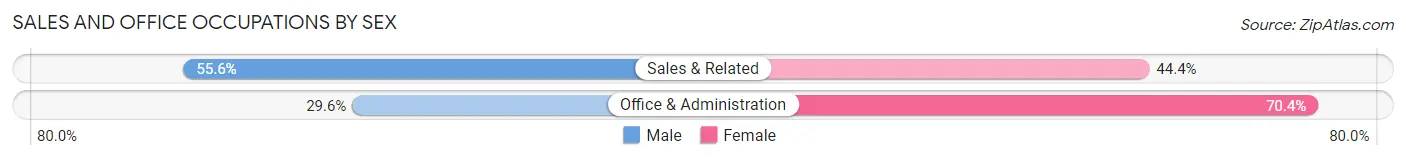
Sales and Office Occupations by Sex
| Occupation | Male | Female |
| Sales & Related | 2,519 (55.6%) | 2,015 (44.4%) |
| Office & Administration | 1,724 (29.6%) | 4,101 (70.4%) |
| Total (Category) | 4,243 (41.0%) | 6,116 (59.0%) |
| Total (Overall) | 42,296 (57.7%) | 30,978 (42.3%) |
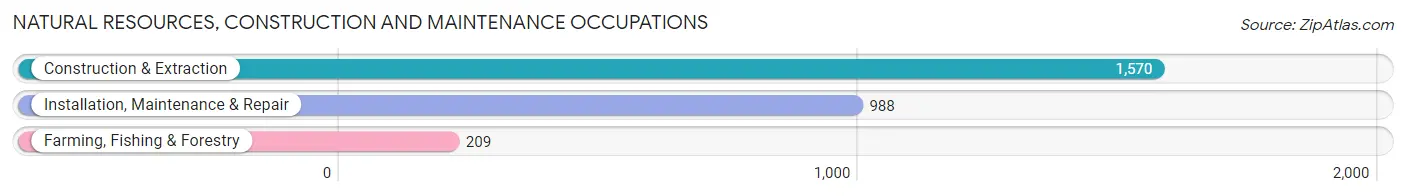
Natural Resources, Construction and Maintenance Occupations
The most common Natural Resources, Construction and Maintenance occupations in Santa Clara are Construction & Extraction (1,570 | 2.1%), Installation, Maintenance & Repair (988 | 1.3%), and Farming, Fishing & Forestry (209 | 0.3%).
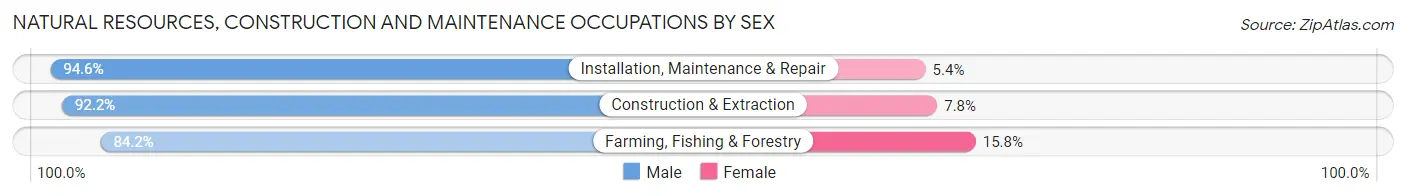
Natural Resources, Construction and Maintenance Occupations by Sex
| Occupation | Male | Female |
| Farming, Fishing & Forestry | 176 (84.2%) | 33 (15.8%) |
| Construction & Extraction | 1,448 (92.2%) | 122 (7.8%) |
| Installation, Maintenance & Repair | 935 (94.6%) | 53 (5.4%) |
| Total (Category) | 2,559 (92.5%) | 208 (7.5%) |
| Total (Overall) | 42,296 (57.7%) | 30,978 (42.3%) |
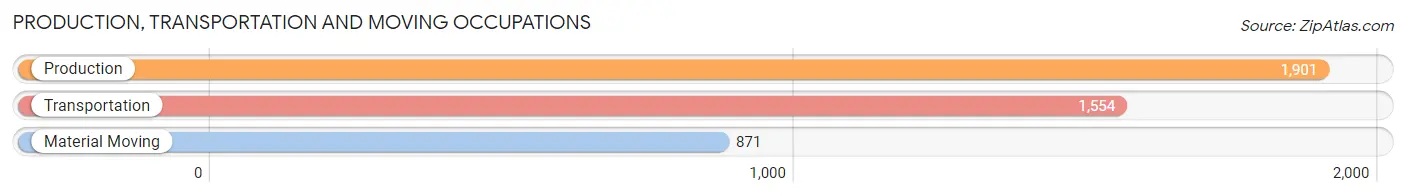
Production, Transportation and Moving Occupations
The most common Production, Transportation and Moving occupations in Santa Clara are Production (1,901 | 2.6%), Transportation (1,554 | 2.1%), and Material Moving (871 | 1.2%).
Production, Transportation and Moving Occupations by Sex
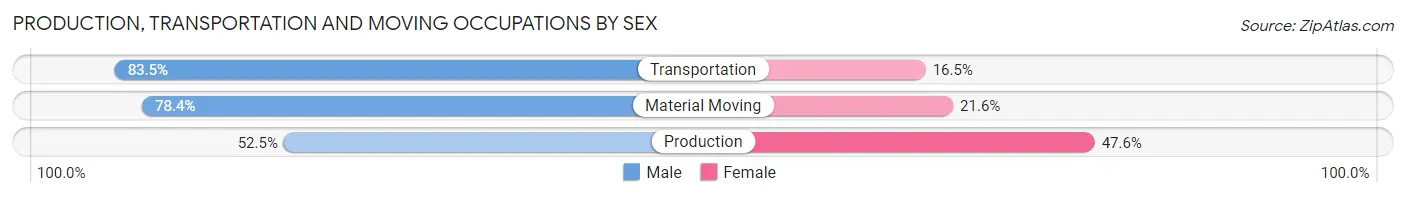
| Occupation | Male | Female |
| Production | 997 (52.4%) | 904 (47.5%) |
| Transportation | 1,297 (83.5%) | 257 (16.5%) |
| Material Moving | 683 (78.4%) | 188 (21.6%) |
| Total (Category) | 2,977 (68.8%) | 1,349 (31.2%) |
| Total (Overall) | 42,296 (57.7%) | 30,978 (42.3%) |
Employment Industries by Sex in Santa Clara
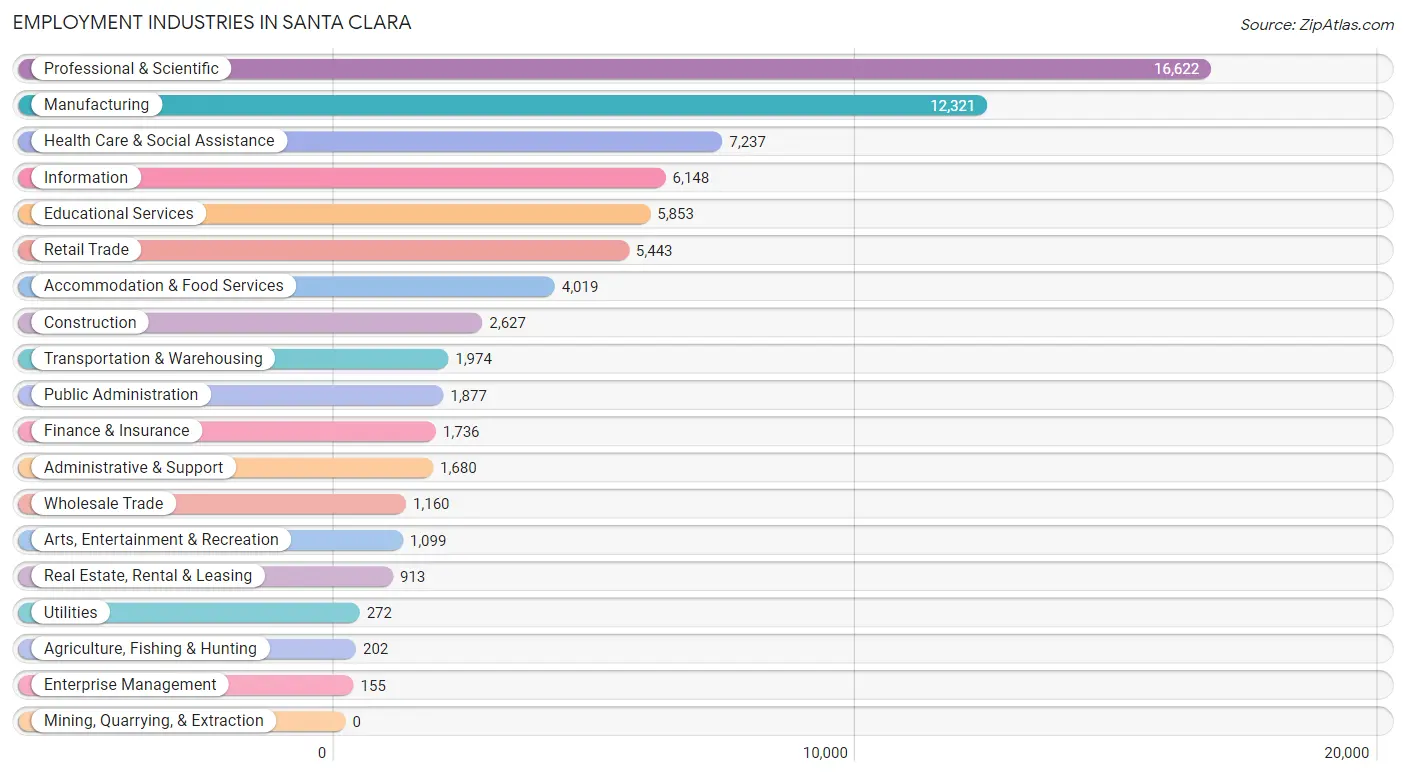
Employment Industries in Santa Clara
The major employment industries in Santa Clara include Professional & Scientific (16,622 | 22.7%), Manufacturing (12,321 | 16.8%), Health Care & Social Assistance (7,237 | 9.9%), Information (6,148 | 8.4%), and Educational Services (5,853 | 8.0%).
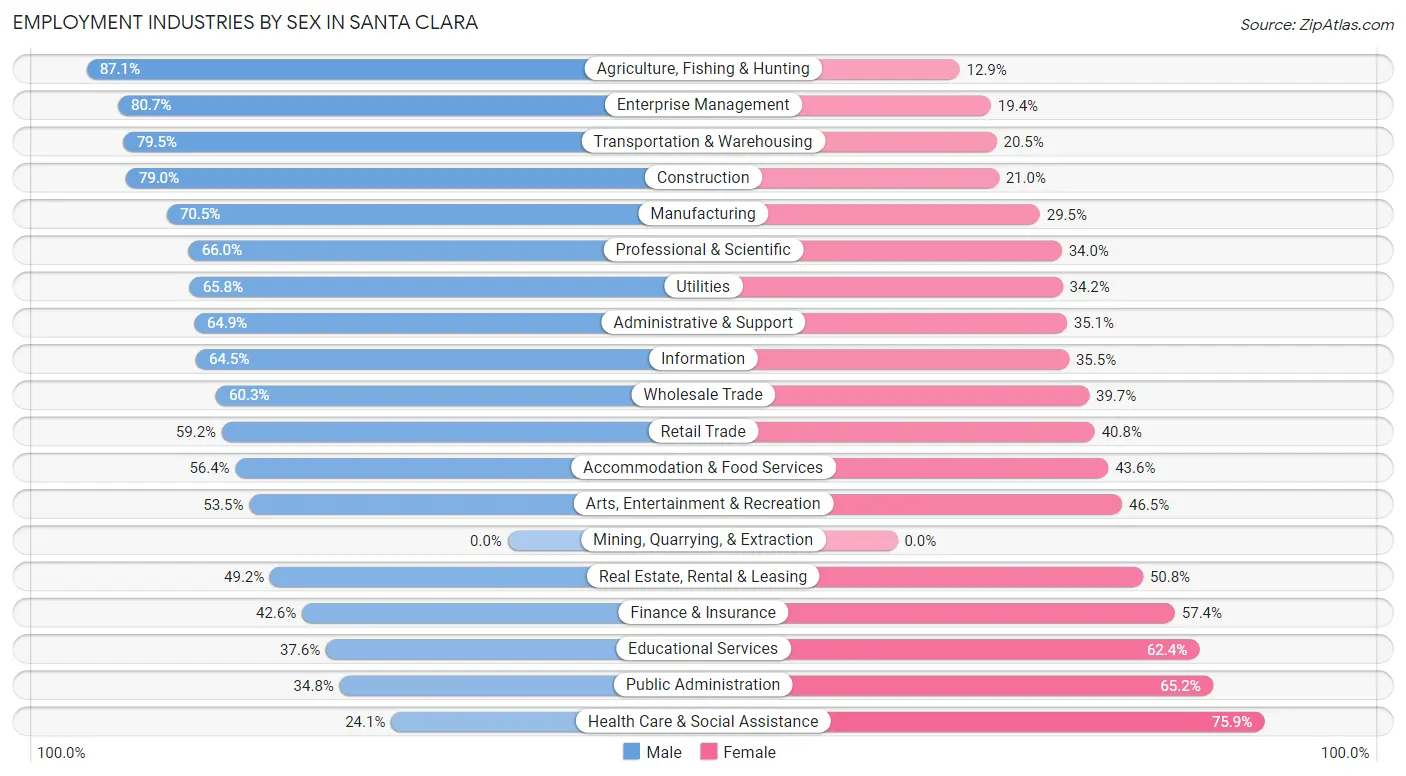
Employment Industries by Sex in Santa Clara
The Santa Clara industries that see more men than women are Agriculture, Fishing & Hunting (87.1%), Enterprise Management (80.6%), and Transportation & Warehousing (79.5%), whereas the industries that tend to have a higher number of women are Health Care & Social Assistance (75.9%), Public Administration (65.2%), and Educational Services (62.4%).
| Industry | Male | Female |
| Agriculture, Fishing & Hunting | 176 (87.1%) | 26 (12.9%) |
| Mining, Quarrying, & Extraction | 0 (0.0%) | 0 (0.0%) |
| Construction | 2,076 (79.0%) | 551 (21.0%) |
| Manufacturing | 8,690 (70.5%) | 3,631 (29.5%) |
| Wholesale Trade | 700 (60.3%) | 460 (39.7%) |
| Retail Trade | 3,220 (59.2%) | 2,223 (40.8%) |
| Transportation & Warehousing | 1,569 (79.5%) | 405 (20.5%) |
| Utilities | 179 (65.8%) | 93 (34.2%) |
| Information | 3,965 (64.5%) | 2,183 (35.5%) |
| Finance & Insurance | 739 (42.6%) | 997 (57.4%) |
| Real Estate, Rental & Leasing | 449 (49.2%) | 464 (50.8%) |
| Professional & Scientific | 10,971 (66.0%) | 5,651 (34.0%) |
| Enterprise Management | 125 (80.6%) | 30 (19.4%) |
| Administrative & Support | 1,091 (64.9%) | 589 (35.1%) |
| Educational Services | 2,200 (37.6%) | 3,653 (62.4%) |
| Health Care & Social Assistance | 1,745 (24.1%) | 5,492 (75.9%) |
| Arts, Entertainment & Recreation | 588 (53.5%) | 511 (46.5%) |
| Accommodation & Food Services | 2,265 (56.4%) | 1,754 (43.6%) |
| Public Administration | 653 (34.8%) | 1,224 (65.2%) |
| Total | 42,296 (57.7%) | 30,978 (42.3%) |
Education in Santa Clara
School Enrollment in Santa Clara
The most common levels of schooling among the 31,911 students in Santa Clara are college / undergraduate (10,535 | 33.0%), elementary school (4,710 | 14.8%), and high school (4,479 | 14.0%).
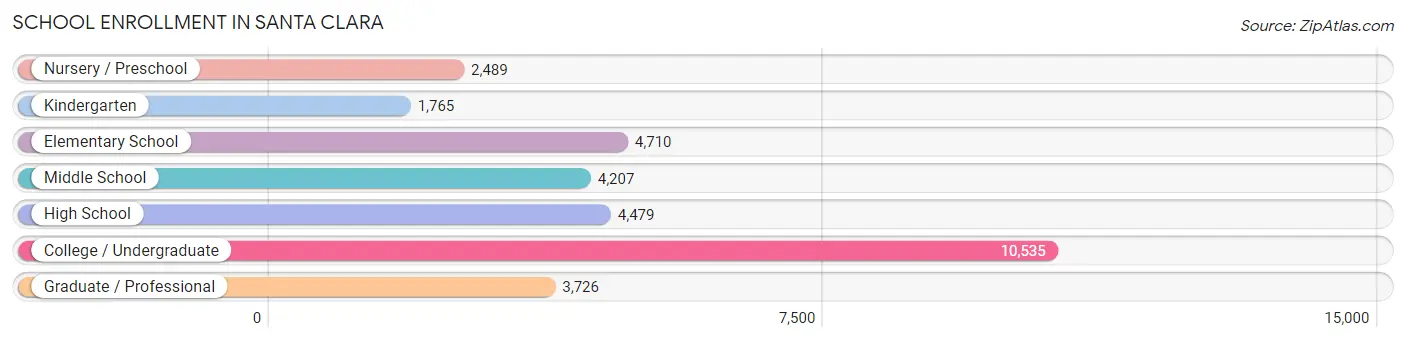
| School Level | # Students | % Students |
| Nursery / Preschool | 2,489 | 7.8% |
| Kindergarten | 1,765 | 5.5% |
| Elementary School | 4,710 | 14.8% |
| Middle School | 4,207 | 13.2% |
| High School | 4,479 | 14.0% |
| College / Undergraduate | 10,535 | 33.0% |
| Graduate / Professional | 3,726 | 11.7% |
| Total | 31,911 | 100.0% |
School Enrollment by Age by Funding Source in Santa Clara
Out of a total of 31,911 students who are enrolled in schools in Santa Clara, 12,094 (37.9%) attend a private institution, while the remaining 19,817 (62.1%) are enrolled in public schools. The age group of 3 to 4 year olds has the highest likelihood of being enrolled in private schools, with 1,395 (67.0% in the age bracket) enrolled. Conversely, the age group of 15 to 17 year olds has the lowest likelihood of being enrolled in a private school, with 2,925 (85.4% in the age bracket) attending a public institution.
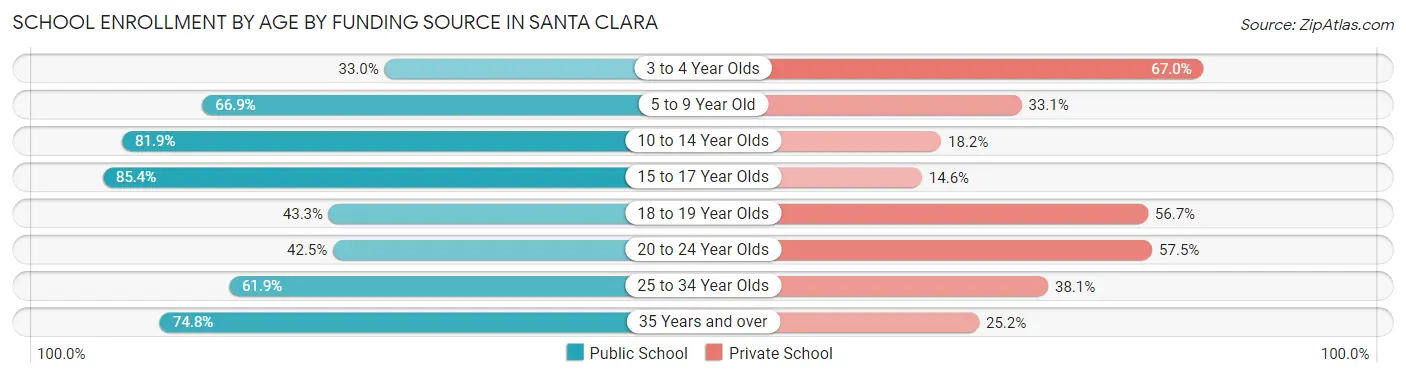
| Age Bracket | Public School | Private School |
| 3 to 4 Year Olds | 686 (33.0%) | 1,395 (67.0%) |
| 5 to 9 Year Old | 4,269 (66.9%) | 2,115 (33.1%) |
| 10 to 14 Year Olds | 4,310 (81.9%) | 956 (18.1%) |
| 15 to 17 Year Olds | 2,925 (85.4%) | 499 (14.6%) |
| 18 to 19 Year Olds | 1,722 (43.3%) | 2,252 (56.7%) |
| 20 to 24 Year Olds | 2,311 (42.5%) | 3,121 (57.5%) |
| 25 to 34 Year Olds | 1,928 (61.9%) | 1,185 (38.1%) |
| 35 Years and over | 1,673 (74.8%) | 564 (25.2%) |
| Total | 19,817 (62.1%) | 12,094 (37.9%) |
Educational Attainment by Field of Study in Santa Clara
Engineering (17,975 | 28.4%), computers & mathematics (10,818 | 17.1%), business (7,930 | 12.6%), science & technology (4,238 | 6.7%), and social sciences (3,581 | 5.7%) are the most common fields of study among 63,192 individuals in Santa Clara who have obtained a bachelor's degree or higher.
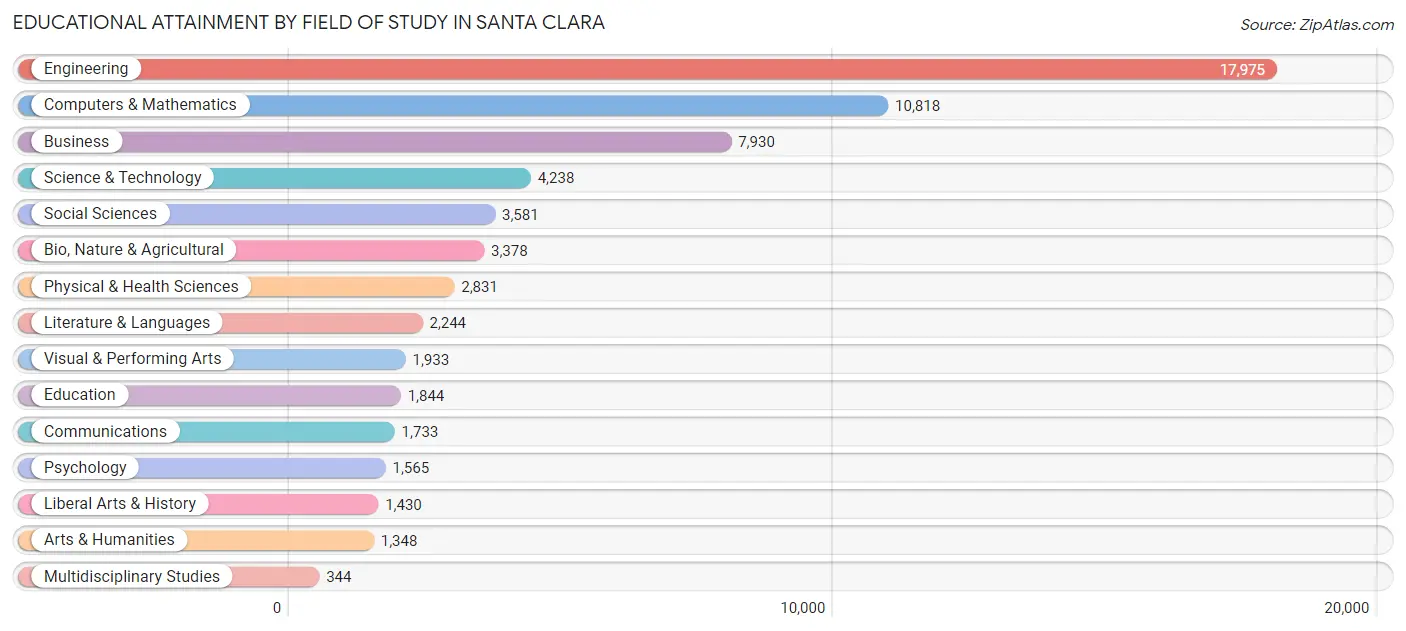
| Field of Study | # Graduates | % Graduates |
| Computers & Mathematics | 10,818 | 17.1% |
| Bio, Nature & Agricultural | 3,378 | 5.3% |
| Physical & Health Sciences | 2,831 | 4.5% |
| Psychology | 1,565 | 2.5% |
| Social Sciences | 3,581 | 5.7% |
| Engineering | 17,975 | 28.4% |
| Multidisciplinary Studies | 344 | 0.5% |
| Science & Technology | 4,238 | 6.7% |
| Business | 7,930 | 12.6% |
| Education | 1,844 | 2.9% |
| Literature & Languages | 2,244 | 3.5% |
| Liberal Arts & History | 1,430 | 2.3% |
| Visual & Performing Arts | 1,933 | 3.1% |
| Communications | 1,733 | 2.7% |
| Arts & Humanities | 1,348 | 2.1% |
| Total | 63,192 | 100.0% |
Transportation & Commute in Santa Clara
Vehicle Availability by Sex in Santa Clara
The most prevalent vehicle ownership categories in Santa Clara are males with 2 vehicles (18,195, accounting for 44.4%) and females with 2 vehicles (13,654, making up 61.6%).
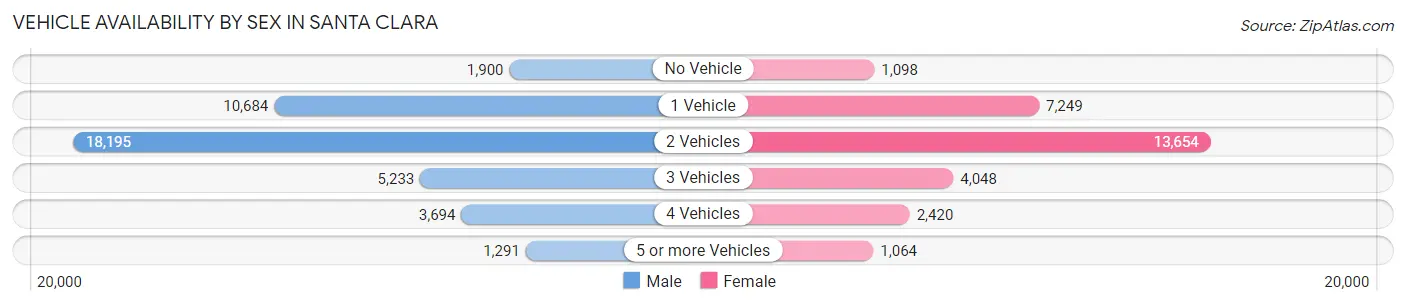
| Vehicles Available | Male | Female |
| No Vehicle | 1,900 (4.6%) | 1,098 (3.7%) |
| 1 Vehicle | 10,684 (26.1%) | 7,249 (24.5%) |
| 2 Vehicles | 18,195 (44.4%) | 13,654 (46.2%) |
| 3 Vehicles | 5,233 (12.8%) | 4,048 (13.7%) |
| 4 Vehicles | 3,694 (9.0%) | 2,420 (8.2%) |
| 5 or more Vehicles | 1,291 (3.2%) | 1,064 (3.6%) |
| Total | 40,997 (100.0%) | 29,533 (100.0%) |
Commute Time in Santa Clara
The most frequently occuring commute durations in Santa Clara are 15 to 19 minutes (12,189 commuters, 21.7%), 20 to 24 minutes (10,390 commuters, 18.5%), and 30 to 34 minutes (8,100 commuters, 14.4%).
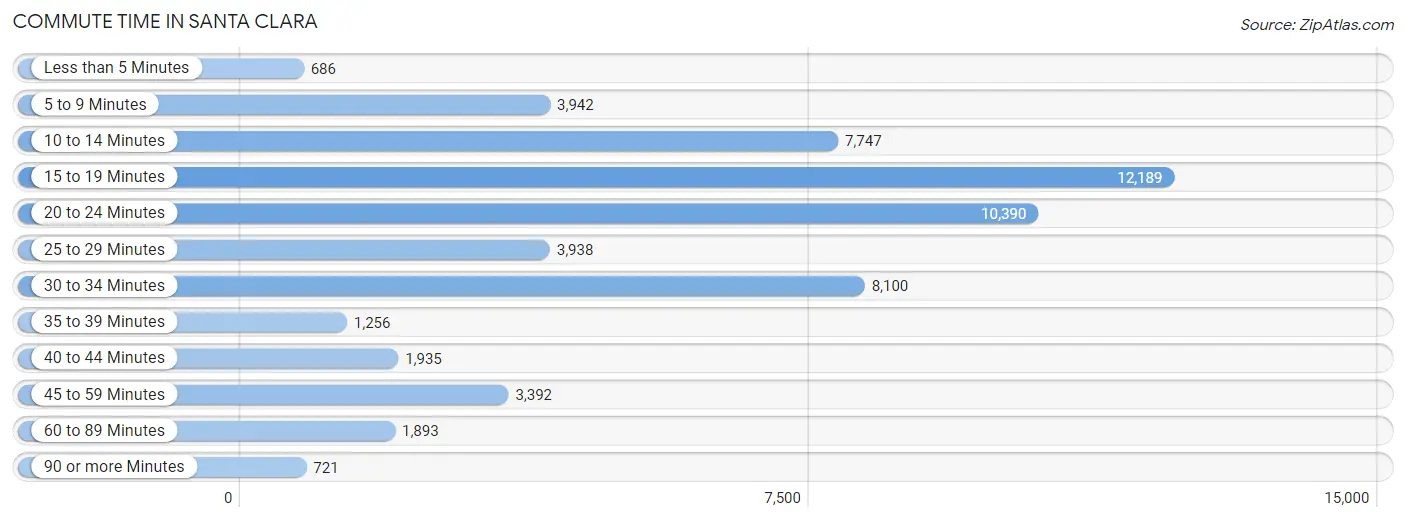
| Commute Time | # Commuters | % Commuters |
| Less than 5 Minutes | 686 | 1.2% |
| 5 to 9 Minutes | 3,942 | 7.0% |
| 10 to 14 Minutes | 7,747 | 13.8% |
| 15 to 19 Minutes | 12,189 | 21.7% |
| 20 to 24 Minutes | 10,390 | 18.5% |
| 25 to 29 Minutes | 3,938 | 7.0% |
| 30 to 34 Minutes | 8,100 | 14.4% |
| 35 to 39 Minutes | 1,256 | 2.2% |
| 40 to 44 Minutes | 1,935 | 3.4% |
| 45 to 59 Minutes | 3,392 | 6.0% |
| 60 to 89 Minutes | 1,893 | 3.4% |
| 90 or more Minutes | 721 | 1.3% |
Commute Time by Sex in Santa Clara
The most common commute times in Santa Clara are 15 to 19 minutes (7,262 commuters, 22.2%) for males and 15 to 19 minutes (4,927 commuters, 21.0%) for females.
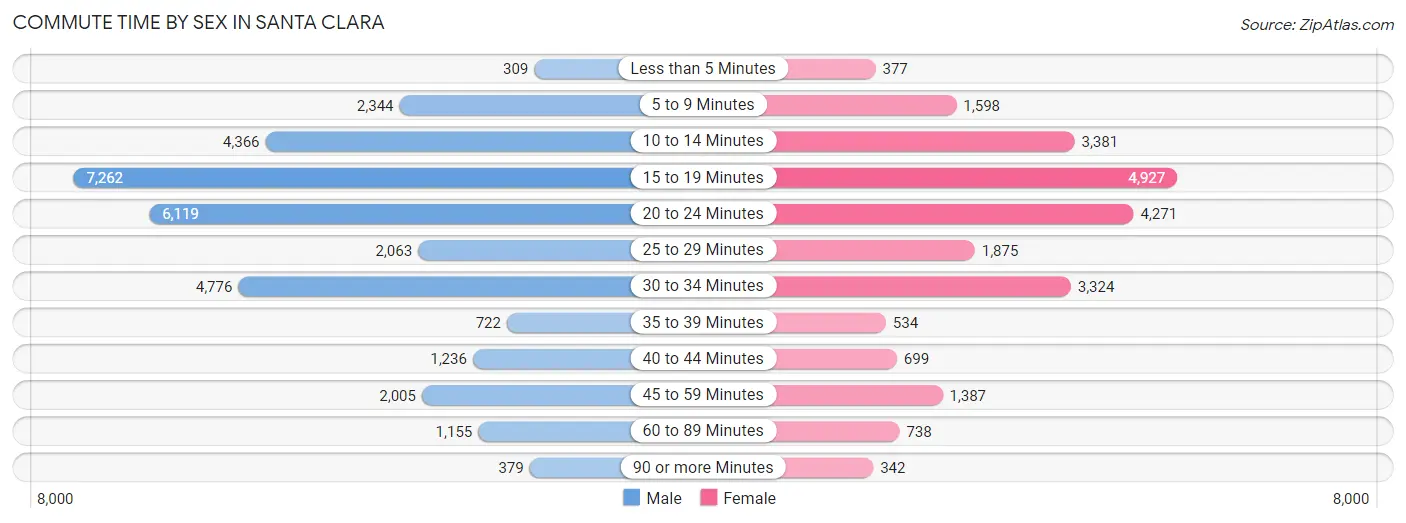
| Commute Time | Male | Female |
| Less than 5 Minutes | 309 (0.9%) | 377 (1.6%) |
| 5 to 9 Minutes | 2,344 (7.2%) | 1,598 (6.8%) |
| 10 to 14 Minutes | 4,366 (13.3%) | 3,381 (14.4%) |
| 15 to 19 Minutes | 7,262 (22.2%) | 4,927 (21.0%) |
| 20 to 24 Minutes | 6,119 (18.7%) | 4,271 (18.2%) |
| 25 to 29 Minutes | 2,063 (6.3%) | 1,875 (8.0%) |
| 30 to 34 Minutes | 4,776 (14.6%) | 3,324 (14.2%) |
| 35 to 39 Minutes | 722 (2.2%) | 534 (2.3%) |
| 40 to 44 Minutes | 1,236 (3.8%) | 699 (3.0%) |
| 45 to 59 Minutes | 2,005 (6.1%) | 1,387 (5.9%) |
| 60 to 89 Minutes | 1,155 (3.5%) | 738 (3.2%) |
| 90 or more Minutes | 379 (1.2%) | 342 (1.5%) |
Time of Departure to Work by Sex in Santa Clara
The most frequent times of departure to work in Santa Clara are 9:00 AM to 9:59 AM (6,747, 20.6%) for males and 8:00 AM to 8:29 AM (4,146, 17.7%) for females.
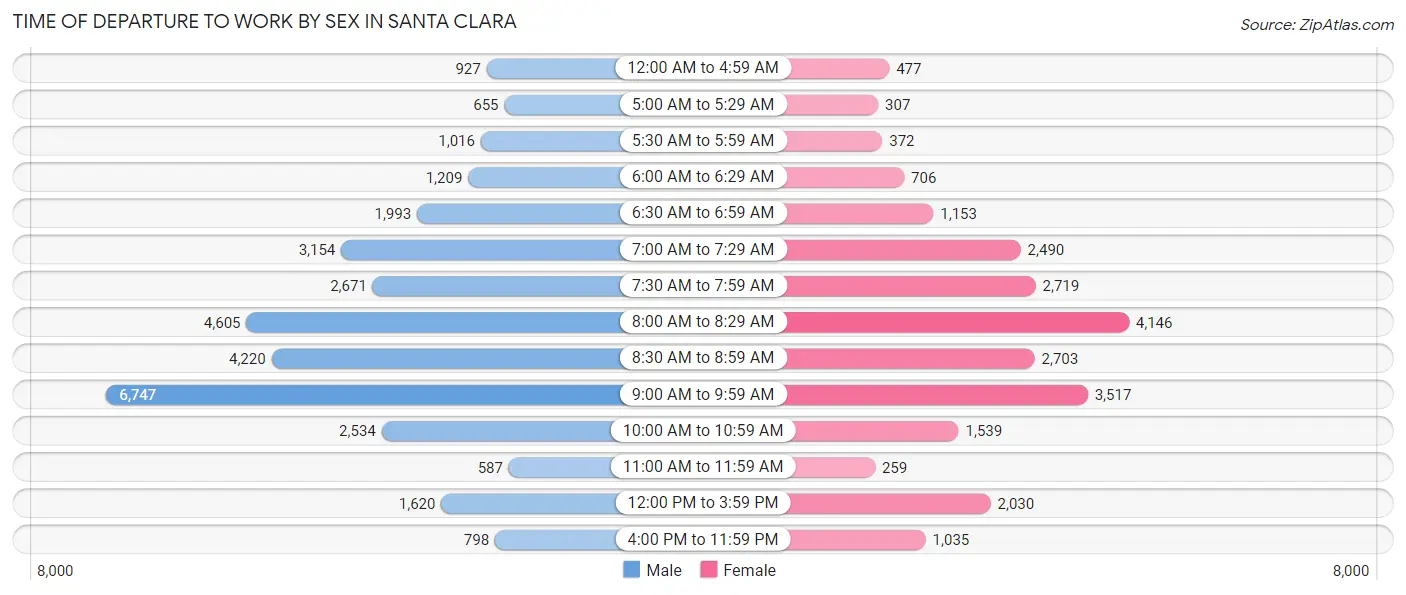
| Time of Departure | Male | Female |
| 12:00 AM to 4:59 AM | 927 (2.8%) | 477 (2.0%) |
| 5:00 AM to 5:29 AM | 655 (2.0%) | 307 (1.3%) |
| 5:30 AM to 5:59 AM | 1,016 (3.1%) | 372 (1.6%) |
| 6:00 AM to 6:29 AM | 1,209 (3.7%) | 706 (3.0%) |
| 6:30 AM to 6:59 AM | 1,993 (6.1%) | 1,153 (4.9%) |
| 7:00 AM to 7:29 AM | 3,154 (9.6%) | 2,490 (10.6%) |
| 7:30 AM to 7:59 AM | 2,671 (8.2%) | 2,719 (11.6%) |
| 8:00 AM to 8:29 AM | 4,605 (14.1%) | 4,146 (17.7%) |
| 8:30 AM to 8:59 AM | 4,220 (12.9%) | 2,703 (11.5%) |
| 9:00 AM to 9:59 AM | 6,747 (20.6%) | 3,517 (15.0%) |
| 10:00 AM to 10:59 AM | 2,534 (7.7%) | 1,539 (6.6%) |
| 11:00 AM to 11:59 AM | 587 (1.8%) | 259 (1.1%) |
| 12:00 PM to 3:59 PM | 1,620 (5.0%) | 2,030 (8.7%) |
| 4:00 PM to 11:59 PM | 798 (2.4%) | 1,035 (4.4%) |
| Total | 32,736 (100.0%) | 23,453 (100.0%) |
Housing Occupancy in Santa Clara
Occupancy by Ownership in Santa Clara
Of the total 47,434 dwellings in Santa Clara, owner-occupied units account for 19,872 (41.9%), while renter-occupied units make up 27,562 (58.1%).
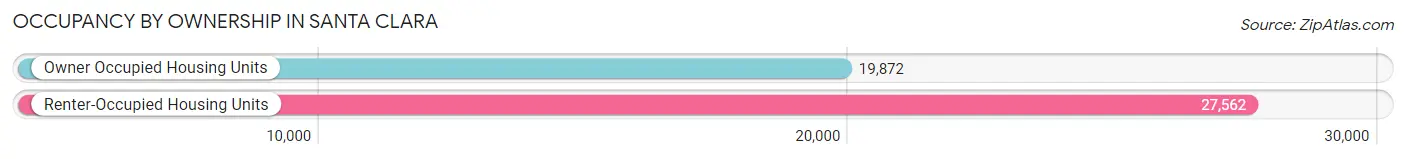
| Occupancy | # Housing Units | % Housing Units |
| Owner Occupied Housing Units | 19,872 | 41.9% |
| Renter-Occupied Housing Units | 27,562 | 58.1% |
| Total Occupied Housing Units | 47,434 | 100.0% |
Occupancy by Household Size in Santa Clara
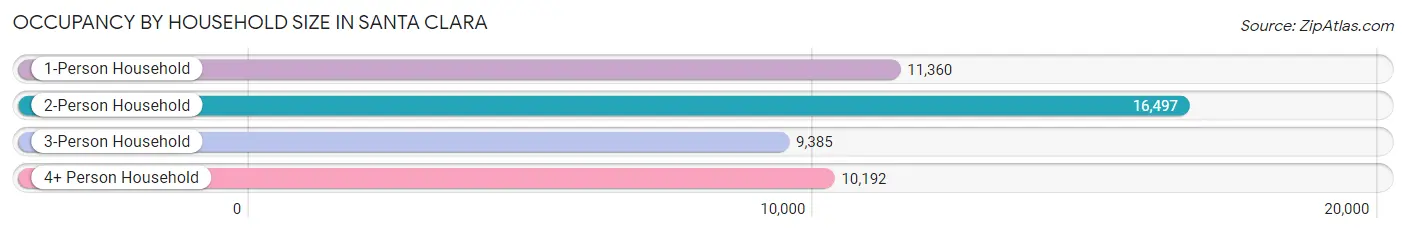
| Household Size | # Housing Units | % Housing Units |
| 1-Person Household | 11,360 | 23.9% |
| 2-Person Household | 16,497 | 34.8% |
| 3-Person Household | 9,385 | 19.8% |
| 4+ Person Household | 10,192 | 21.5% |
| Total Housing Units | 47,434 | 100.0% |
Occupancy by Ownership by Household Size in Santa Clara
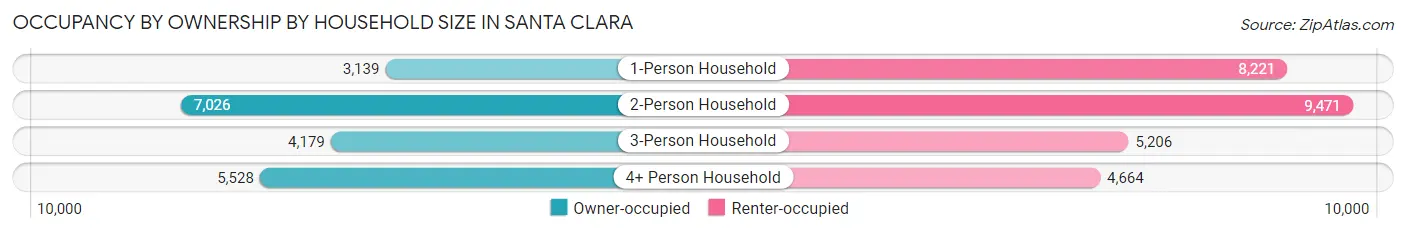
| Household Size | Owner-occupied | Renter-occupied |
| 1-Person Household | 3,139 (27.6%) | 8,221 (72.4%) |
| 2-Person Household | 7,026 (42.6%) | 9,471 (57.4%) |
| 3-Person Household | 4,179 (44.5%) | 5,206 (55.5%) |
| 4+ Person Household | 5,528 (54.2%) | 4,664 (45.8%) |
| Total Housing Units | 19,872 (41.9%) | 27,562 (58.1%) |
Occupancy by Educational Attainment in Santa Clara
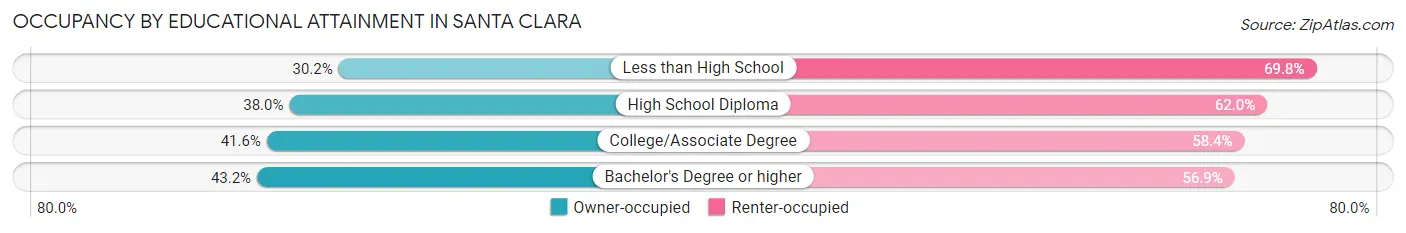
| Household Size | Owner-occupied | Renter-occupied |
| Less than High School | 581 (30.2%) | 1,342 (69.8%) |
| High School Diploma | 1,527 (38.0%) | 2,489 (62.0%) |
| College/Associate Degree | 3,801 (41.6%) | 5,336 (58.4%) |
| Bachelor's Degree or higher | 13,963 (43.1%) | 18,395 (56.9%) |
Occupancy by Age of Householder in Santa Clara
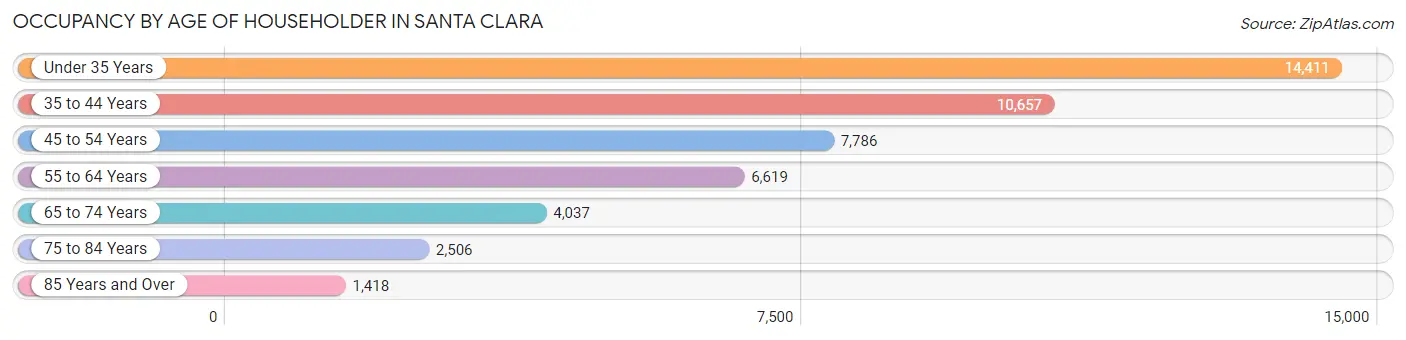
| Age Bracket | # Households | % Households |
| Under 35 Years | 14,411 | 30.4% |
| 35 to 44 Years | 10,657 | 22.5% |
| 45 to 54 Years | 7,786 | 16.4% |
| 55 to 64 Years | 6,619 | 14.0% |
| 65 to 74 Years | 4,037 | 8.5% |
| 75 to 84 Years | 2,506 | 5.3% |
| 85 Years and Over | 1,418 | 3.0% |
| Total | 47,434 | 100.0% |
Housing Finances in Santa Clara
Median Income by Occupancy in Santa Clara
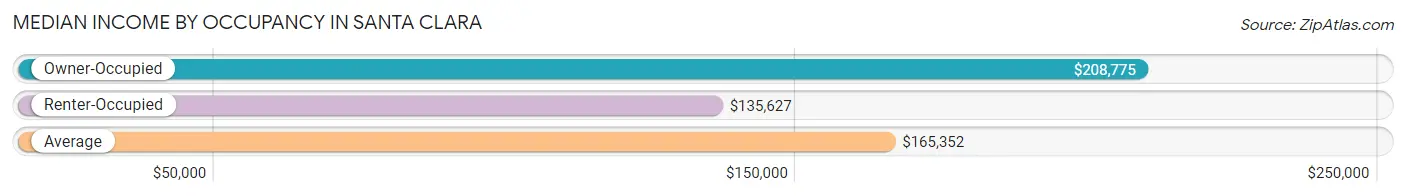
| Occupancy Type | # Households | Median Income |
| Owner-Occupied | 19,872 (41.9%) | $208,775 |
| Renter-Occupied | 27,562 (58.1%) | $135,627 |
| Average | 47,434 (100.0%) | $165,352 |
Occupancy by Householder Income Bracket in Santa Clara
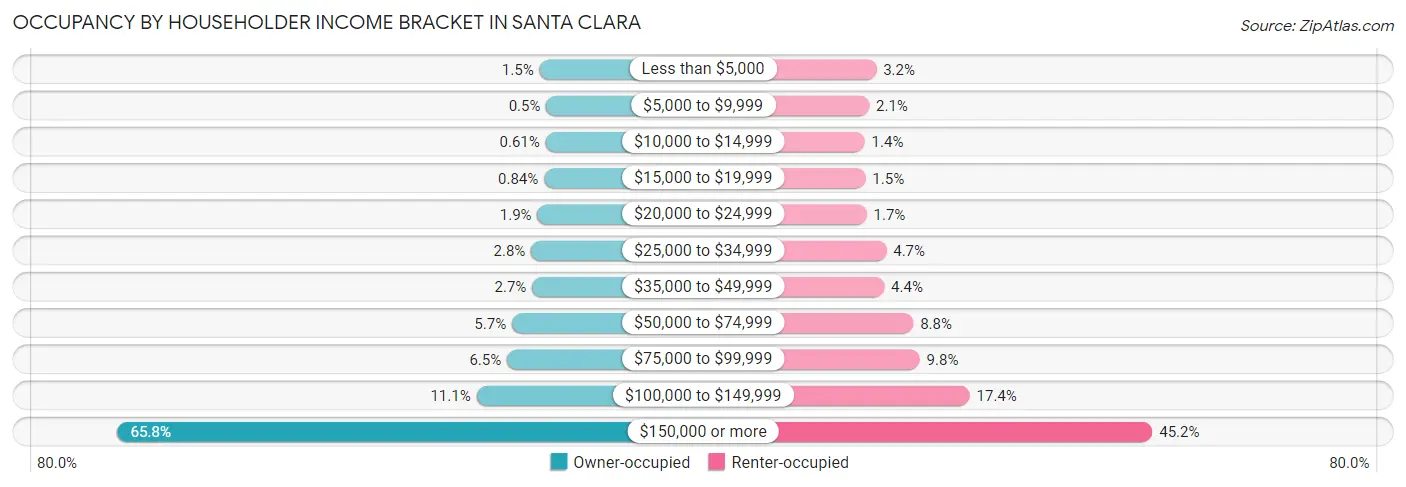
| Income Bracket | Owner-occupied | Renter-occupied |
| Less than $5,000 | 307 (1.5%) | 869 (3.2%) |
| $5,000 to $9,999 | 99 (0.5%) | 567 (2.1%) |
| $10,000 to $14,999 | 122 (0.6%) | 383 (1.4%) |
| $15,000 to $19,999 | 167 (0.8%) | 414 (1.5%) |
| $20,000 to $24,999 | 370 (1.9%) | 466 (1.7%) |
| $25,000 to $34,999 | 558 (2.8%) | 1,291 (4.7%) |
| $35,000 to $49,999 | 527 (2.6%) | 1,202 (4.4%) |
| $50,000 to $74,999 | 1,138 (5.7%) | 2,423 (8.8%) |
| $75,000 to $99,999 | 1,290 (6.5%) | 2,692 (9.8%) |
| $100,000 to $149,999 | 2,213 (11.1%) | 4,791 (17.4%) |
| $150,000 or more | 13,081 (65.8%) | 12,464 (45.2%) |
| Total | 19,872 (100.0%) | 27,562 (100.0%) |
Monthly Housing Cost Tiers in Santa Clara
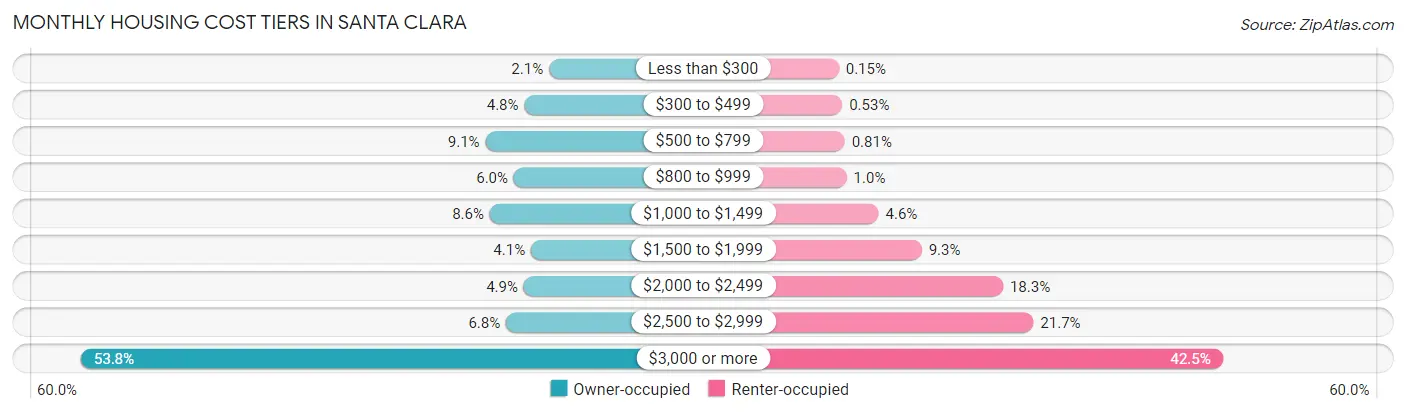
| Monthly Cost | Owner-occupied | Renter-occupied |
| Less than $300 | 411 (2.1%) | 42 (0.2%) |
| $300 to $499 | 951 (4.8%) | 146 (0.5%) |
| $500 to $799 | 1,806 (9.1%) | 223 (0.8%) |
| $800 to $999 | 1,182 (5.9%) | 282 (1.0%) |
| $1,000 to $1,499 | 1,711 (8.6%) | 1,253 (4.5%) |
| $1,500 to $1,999 | 807 (4.1%) | 2,567 (9.3%) |
| $2,000 to $2,499 | 964 (4.9%) | 5,042 (18.3%) |
| $2,500 to $2,999 | 1,353 (6.8%) | 5,967 (21.6%) |
| $3,000 or more | 10,687 (53.8%) | 11,724 (42.5%) |
| Total | 19,872 (100.0%) | 27,562 (100.0%) |
Physical Housing Characteristics in Santa Clara
Housing Structures in Santa Clara
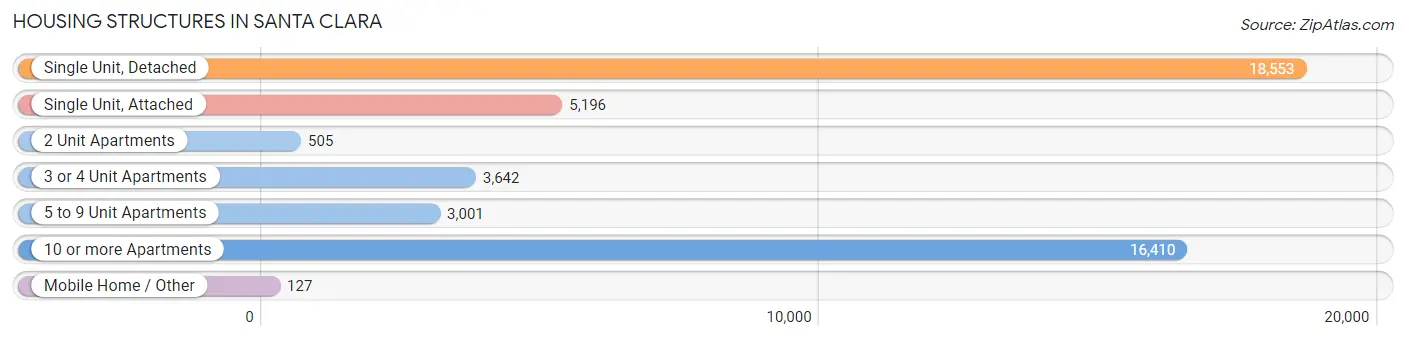
| Structure Type | # Housing Units | % Housing Units |
| Single Unit, Detached | 18,553 | 39.1% |
| Single Unit, Attached | 5,196 | 11.0% |
| 2 Unit Apartments | 505 | 1.1% |
| 3 or 4 Unit Apartments | 3,642 | 7.7% |
| 5 to 9 Unit Apartments | 3,001 | 6.3% |
| 10 or more Apartments | 16,410 | 34.6% |
| Mobile Home / Other | 127 | 0.3% |
| Total | 47,434 | 100.0% |
Housing Structures by Occupancy in Santa Clara
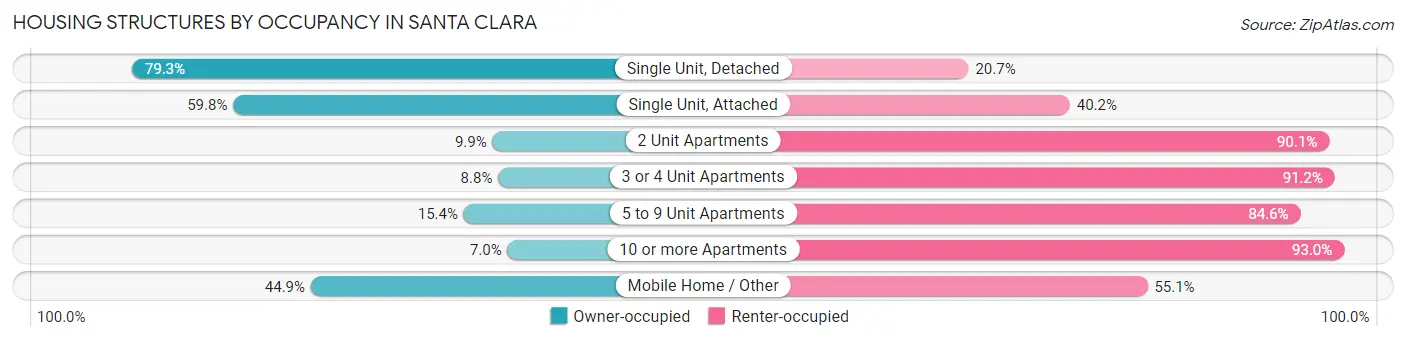
| Structure Type | Owner-occupied | Renter-occupied |
| Single Unit, Detached | 14,720 (79.3%) | 3,833 (20.7%) |
| Single Unit, Attached | 3,109 (59.8%) | 2,087 (40.2%) |
| 2 Unit Apartments | 50 (9.9%) | 455 (90.1%) |
| 3 or 4 Unit Apartments | 321 (8.8%) | 3,321 (91.2%) |
| 5 to 9 Unit Apartments | 463 (15.4%) | 2,538 (84.6%) |
| 10 or more Apartments | 1,152 (7.0%) | 15,258 (93.0%) |
| Mobile Home / Other | 57 (44.9%) | 70 (55.1%) |
| Total | 19,872 (41.9%) | 27,562 (58.1%) |
Housing Structures by Number of Rooms in Santa Clara
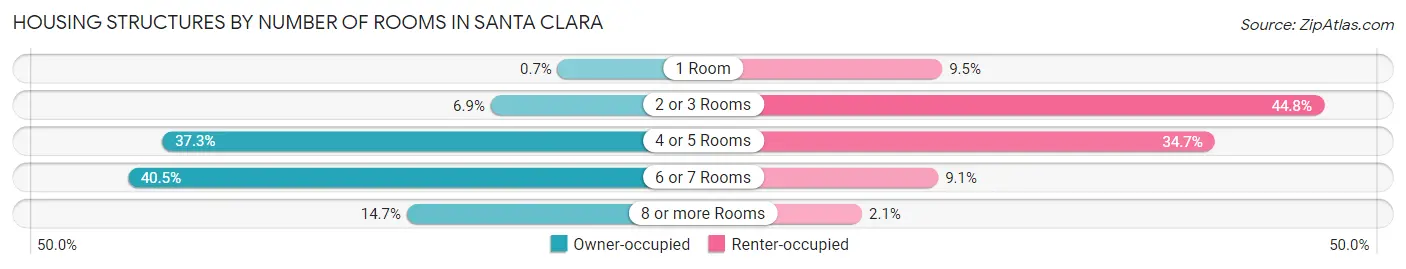
| Number of Rooms | Owner-occupied | Renter-occupied |
| 1 Room | 139 (0.7%) | 2,608 (9.5%) |
| 2 or 3 Rooms | 1,370 (6.9%) | 12,335 (44.8%) |
| 4 or 5 Rooms | 7,411 (37.3%) | 9,549 (34.6%) |
| 6 or 7 Rooms | 8,040 (40.5%) | 2,506 (9.1%) |
| 8 or more Rooms | 2,912 (14.6%) | 564 (2.1%) |
| Total | 19,872 (100.0%) | 27,562 (100.0%) |
Housing Structure by Heating Type in Santa Clara
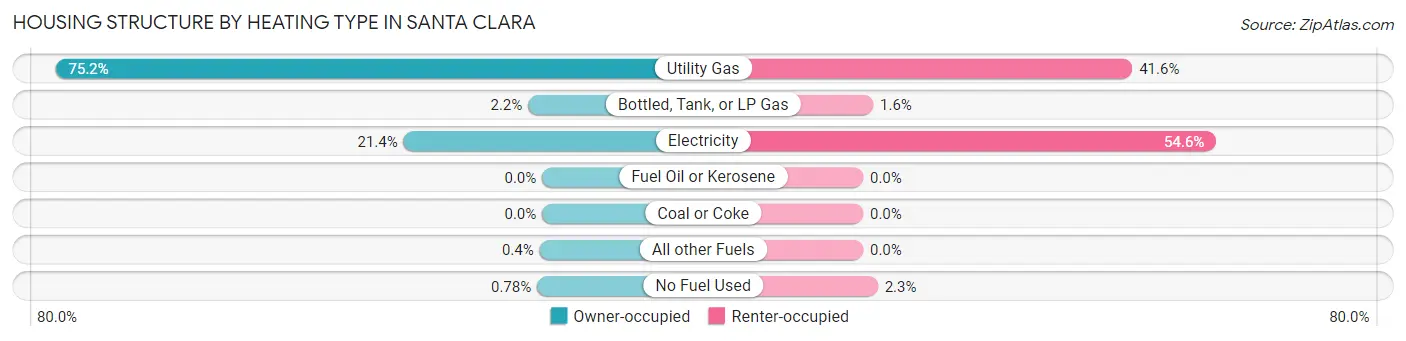
| Heating Type | Owner-occupied | Renter-occupied |
| Utility Gas | 14,952 (75.2%) | 11,469 (41.6%) |
| Bottled, Tank, or LP Gas | 429 (2.2%) | 426 (1.5%) |
| Electricity | 4,256 (21.4%) | 15,042 (54.6%) |
| Fuel Oil or Kerosene | 0 (0.0%) | 0 (0.0%) |
| Coal or Coke | 0 (0.0%) | 0 (0.0%) |
| All other Fuels | 80 (0.4%) | 0 (0.0%) |
| No Fuel Used | 155 (0.8%) | 625 (2.3%) |
| Total | 19,872 (100.0%) | 27,562 (100.0%) |
Household Vehicle Usage in Santa Clara
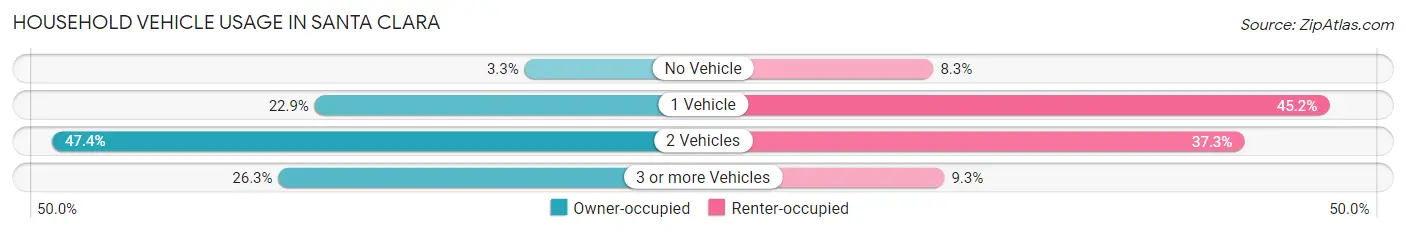
| Vehicles per Household | Owner-occupied | Renter-occupied |
| No Vehicle | 662 (3.3%) | 2,278 (8.3%) |
| 1 Vehicle | 4,554 (22.9%) | 12,454 (45.2%) |
| 2 Vehicles | 9,428 (47.4%) | 10,269 (37.3%) |
| 3 or more Vehicles | 5,228 (26.3%) | 2,561 (9.3%) |
| Total | 19,872 (100.0%) | 27,562 (100.0%) |
Real Estate & Mortgages in Santa Clara
Real Estate and Mortgage Overview in Santa Clara
| Characteristic | Without Mortgage | With Mortgage |
| Housing Units | 6,247 | 13,625 |
| Median Property Value | $1,367,900 | $1,460,600 |
| Median Household Income | $129,958 | $10,326 |
| Monthly Housing Costs | $815 | $10,587 |
| Real Estate Taxes | $5,039 | $86 |
Property Value by Mortgage Status in Santa Clara
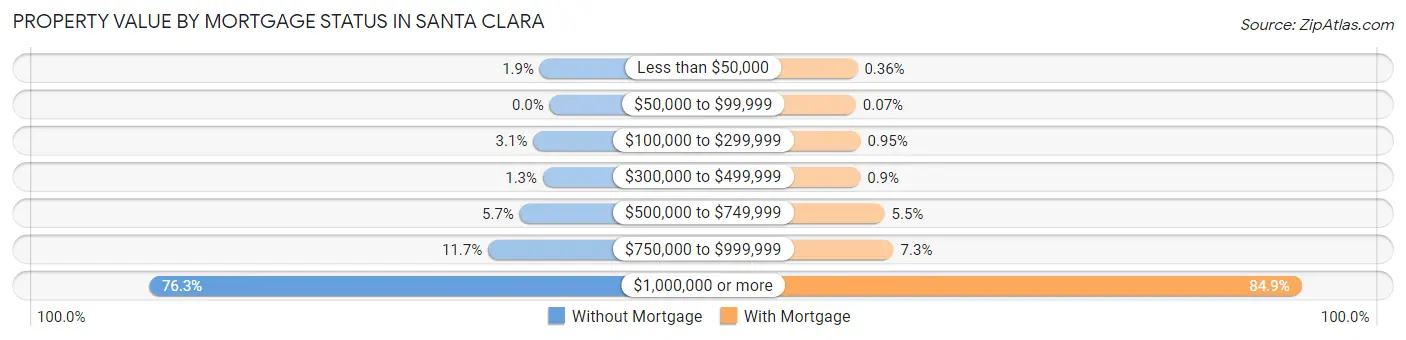
| Property Value | Without Mortgage | With Mortgage |
| Less than $50,000 | 117 (1.9%) | 49 (0.4%) |
| $50,000 to $99,999 | 0 (0.0%) | 10 (0.1%) |
| $100,000 to $299,999 | 195 (3.1%) | 129 (0.9%) |
| $300,000 to $499,999 | 80 (1.3%) | 122 (0.9%) |
| $500,000 to $749,999 | 356 (5.7%) | 753 (5.5%) |
| $750,000 to $999,999 | 732 (11.7%) | 989 (7.3%) |
| $1,000,000 or more | 4,767 (76.3%) | 11,573 (84.9%) |
| Total | 6,247 (100.0%) | 13,625 (100.0%) |
Household Income by Mortgage Status in Santa Clara
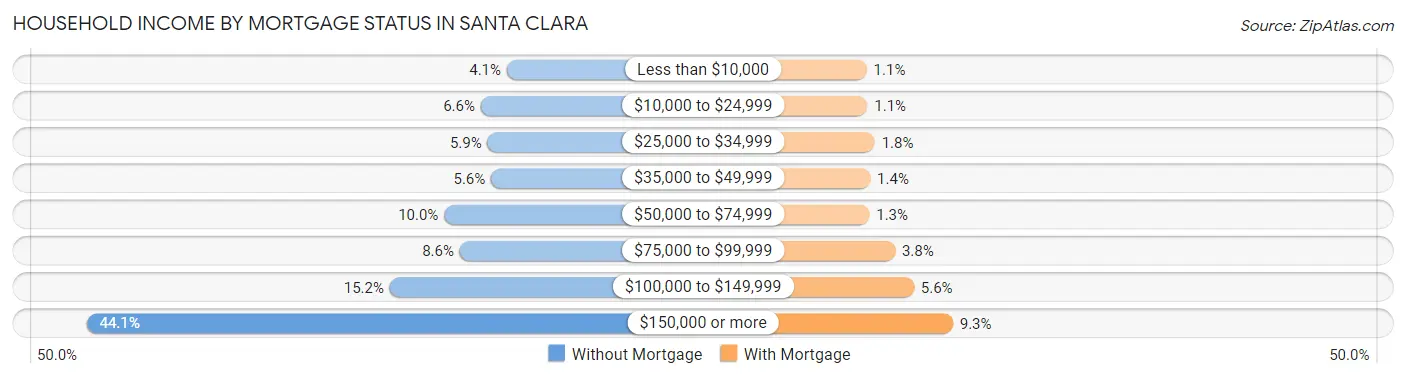
| Household Income | Without Mortgage | With Mortgage |
| Less than $10,000 | 254 (4.1%) | 145 (1.1%) |
| $10,000 to $24,999 | 409 (6.6%) | 152 (1.1%) |
| $25,000 to $34,999 | 369 (5.9%) | 250 (1.8%) |
| $35,000 to $49,999 | 348 (5.6%) | 189 (1.4%) |
| $50,000 to $74,999 | 627 (10.0%) | 179 (1.3%) |
| $75,000 to $99,999 | 534 (8.6%) | 511 (3.7%) |
| $100,000 to $149,999 | 951 (15.2%) | 756 (5.6%) |
| $150,000 or more | 2,755 (44.1%) | 1,262 (9.3%) |
| Total | 6,247 (100.0%) | 13,625 (100.0%) |
Property Value to Household Income Ratio in Santa Clara
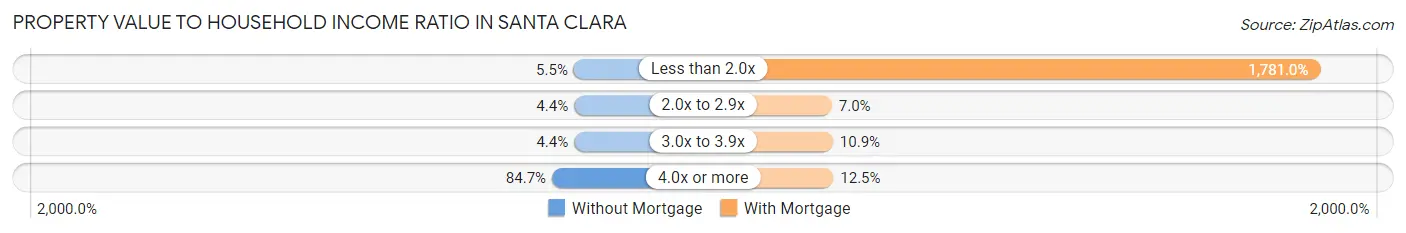
| Value-to-Income Ratio | Without Mortgage | With Mortgage |
| Less than 2.0x | 341 (5.5%) | 242,665 (1,781.0%) |
| 2.0x to 2.9x | 275 (4.4%) | 949 (7.0%) |
| 3.0x to 3.9x | 274 (4.4%) | 1,478 (10.8%) |
| 4.0x or more | 5,294 (84.7%) | 1,700 (12.5%) |
| Total | 6,247 (100.0%) | 13,625 (100.0%) |
Real Estate Taxes by Mortgage Status in Santa Clara
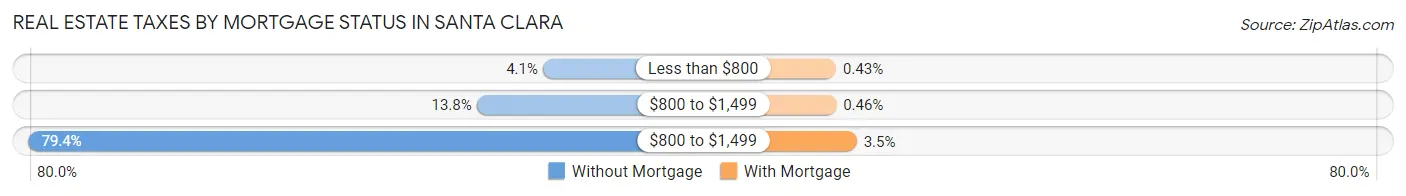
| Property Taxes | Without Mortgage | With Mortgage |
| Less than $800 | 258 (4.1%) | 59 (0.4%) |
| $800 to $1,499 | 863 (13.8%) | 62 (0.5%) |
| $800 to $1,499 | 4,962 (79.4%) | 472 (3.5%) |
| Total | 6,247 (100.0%) | 13,625 (100.0%) |
Health & Disability in Santa Clara
Health Insurance Coverage by Age in Santa Clara
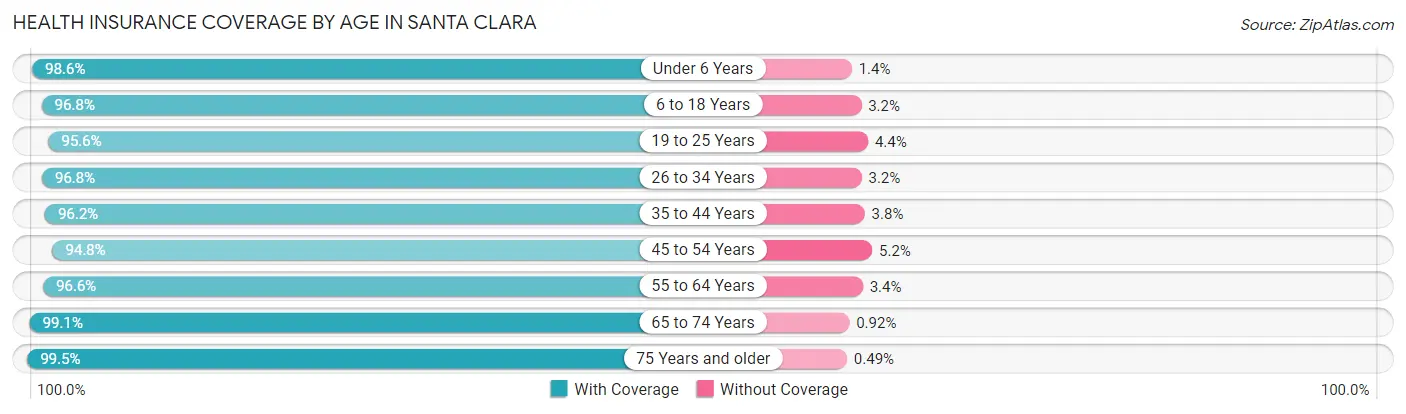
| Age Bracket | With Coverage | Without Coverage |
| Under 6 Years | 9,072 (98.6%) | 128 (1.4%) |
| 6 to 18 Years | 15,205 (96.8%) | 496 (3.2%) |
| 19 to 25 Years | 13,401 (95.6%) | 620 (4.4%) |
| 26 to 34 Years | 25,609 (96.8%) | 848 (3.2%) |
| 35 to 44 Years | 19,030 (96.2%) | 751 (3.8%) |
| 45 to 54 Years | 13,822 (94.8%) | 755 (5.2%) |
| 55 to 64 Years | 13,061 (96.6%) | 464 (3.4%) |
| 65 to 74 Years | 7,652 (99.1%) | 71 (0.9%) |
| 75 Years and older | 6,476 (99.5%) | 32 (0.5%) |
| Total | 123,328 (96.7%) | 4,165 (3.3%) |
Health Insurance Coverage by Citizenship Status in Santa Clara
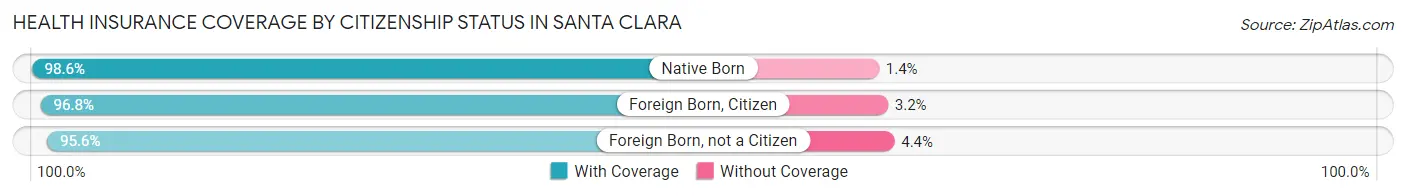
| Citizenship Status | With Coverage | Without Coverage |
| Native Born | 9,072 (98.6%) | 128 (1.4%) |
| Foreign Born, Citizen | 15,205 (96.8%) | 496 (3.2%) |
| Foreign Born, not a Citizen | 13,401 (95.6%) | 620 (4.4%) |
Health Insurance Coverage by Household Income in Santa Clara
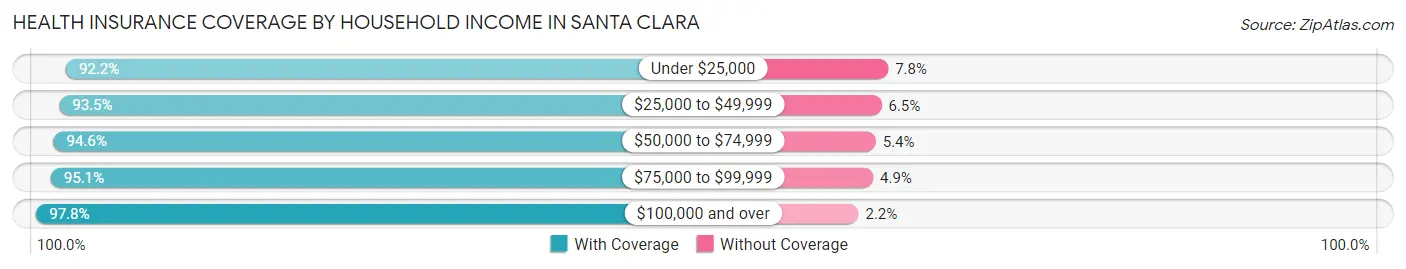
| Household Income | With Coverage | Without Coverage |
| Under $25,000 | 6,632 (92.2%) | 558 (7.8%) |
| $25,000 to $49,999 | 7,138 (93.5%) | 497 (6.5%) |
| $50,000 to $74,999 | 7,058 (94.6%) | 405 (5.4%) |
| $75,000 to $99,999 | 8,989 (95.1%) | 466 (4.9%) |
| $100,000 and over | 89,573 (97.8%) | 2,015 (2.2%) |
Public vs Private Health Insurance Coverage by Age in Santa Clara
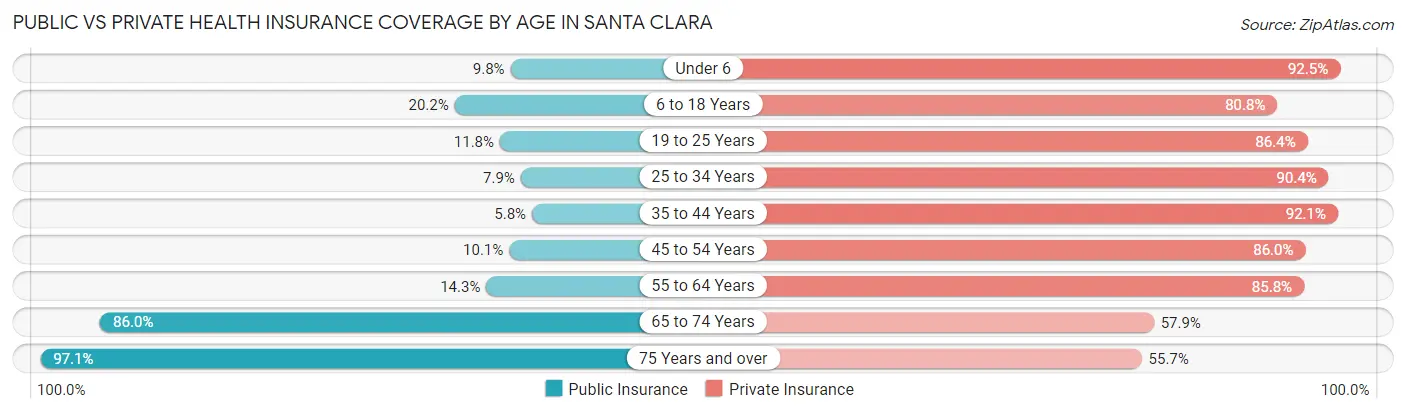
| Age Bracket | Public Insurance | Private Insurance |
| Under 6 | 903 (9.8%) | 8,506 (92.5%) |
| 6 to 18 Years | 3,171 (20.2%) | 12,689 (80.8%) |
| 19 to 25 Years | 1,651 (11.8%) | 12,118 (86.4%) |
| 25 to 34 Years | 2,096 (7.9%) | 23,906 (90.4%) |
| 35 to 44 Years | 1,155 (5.8%) | 18,209 (92.0%) |
| 45 to 54 Years | 1,468 (10.1%) | 12,541 (86.0%) |
| 55 to 64 Years | 1,936 (14.3%) | 11,601 (85.8%) |
| 65 to 74 Years | 6,640 (86.0%) | 4,471 (57.9%) |
| 75 Years and over | 6,319 (97.1%) | 3,622 (55.6%) |
| Total | 25,339 (19.9%) | 107,663 (84.5%) |
Disability Status by Sex by Age in Santa Clara
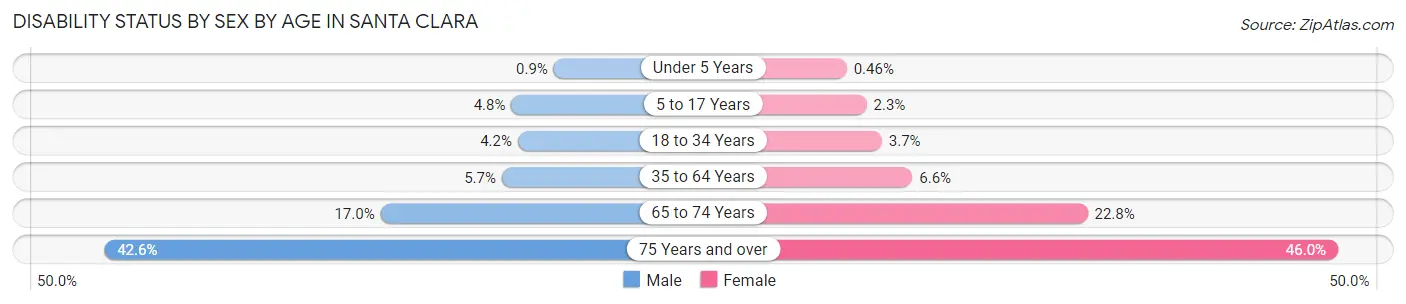
| Age Bracket | Male | Female |
| Under 5 Years | 40 (0.9%) | 15 (0.5%) |
| 5 to 17 Years | 380 (4.8%) | 172 (2.3%) |
| 18 to 34 Years | 976 (4.2%) | 717 (3.7%) |
| 35 to 64 Years | 1,439 (5.7%) | 1,487 (6.6%) |
| 65 to 74 Years | 658 (17.0%) | 877 (22.8%) |
| 75 Years and over | 1,122 (42.6%) | 1,784 (46.0%) |
Disability Class by Sex by Age in Santa Clara
Disability Class: Hearing Difficulty
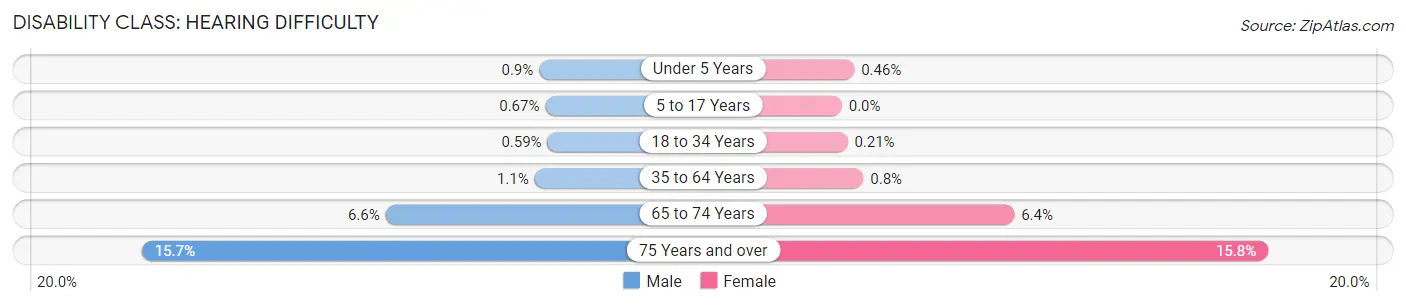
| Age Bracket | Male | Female |
| Under 5 Years | 40 (0.9%) | 15 (0.5%) |
| 5 to 17 Years | 53 (0.7%) | 0 (0.0%) |
| 18 to 34 Years | 136 (0.6%) | 41 (0.2%) |
| 35 to 64 Years | 269 (1.1%) | 182 (0.8%) |
| 65 to 74 Years | 256 (6.6%) | 246 (6.4%) |
| 75 Years and over | 412 (15.7%) | 613 (15.8%) |
Disability Class: Vision Difficulty
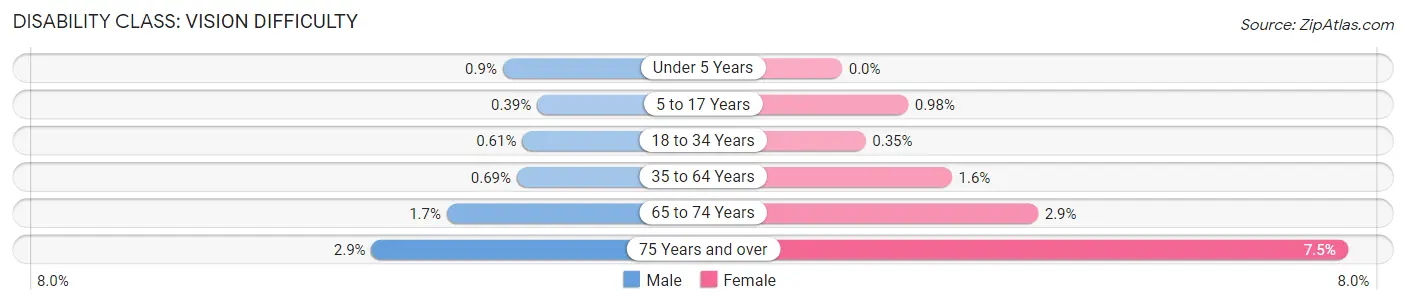
| Age Bracket | Male | Female |
| Under 5 Years | 40 (0.9%) | 0 (0.0%) |
| 5 to 17 Years | 31 (0.4%) | 73 (1.0%) |
| 18 to 34 Years | 142 (0.6%) | 67 (0.4%) |
| 35 to 64 Years | 175 (0.7%) | 370 (1.6%) |
| 65 to 74 Years | 67 (1.7%) | 112 (2.9%) |
| 75 Years and over | 75 (2.9%) | 291 (7.5%) |
Disability Class: Cognitive Difficulty
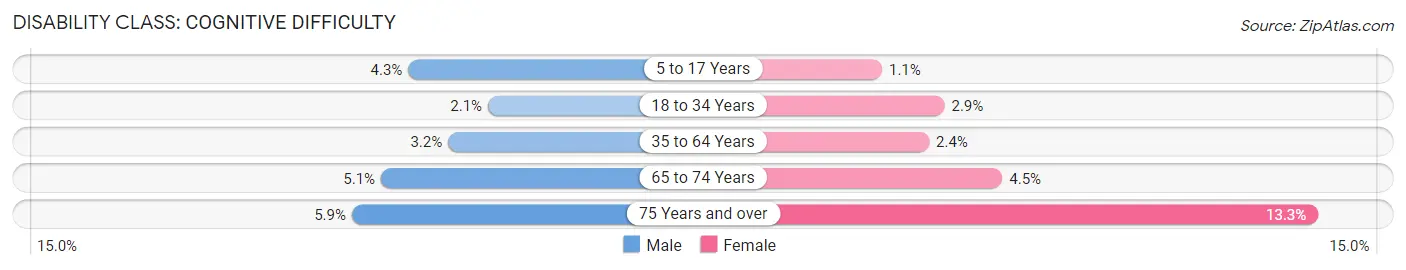
| Age Bracket | Male | Female |
| 5 to 17 Years | 340 (4.3%) | 84 (1.1%) |
| 18 to 34 Years | 486 (2.1%) | 551 (2.9%) |
| 35 to 64 Years | 809 (3.2%) | 552 (2.4%) |
| 65 to 74 Years | 197 (5.1%) | 172 (4.5%) |
| 75 Years and over | 155 (5.9%) | 514 (13.3%) |
Disability Class: Ambulatory Difficulty
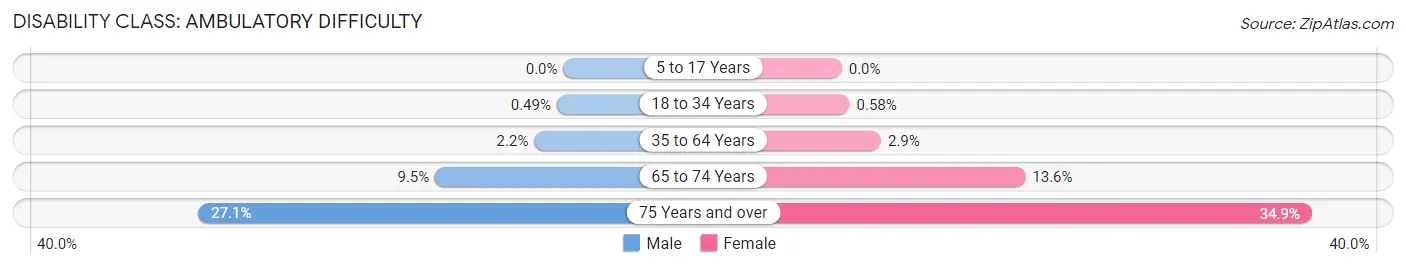
| Age Bracket | Male | Female |
| 5 to 17 Years | 0 (0.0%) | 0 (0.0%) |
| 18 to 34 Years | 113 (0.5%) | 112 (0.6%) |
| 35 to 64 Years | 544 (2.2%) | 660 (2.9%) |
| 65 to 74 Years | 369 (9.5%) | 524 (13.6%) |
| 75 Years and over | 714 (27.1%) | 1,352 (34.9%) |
Disability Class: Self-Care Difficulty
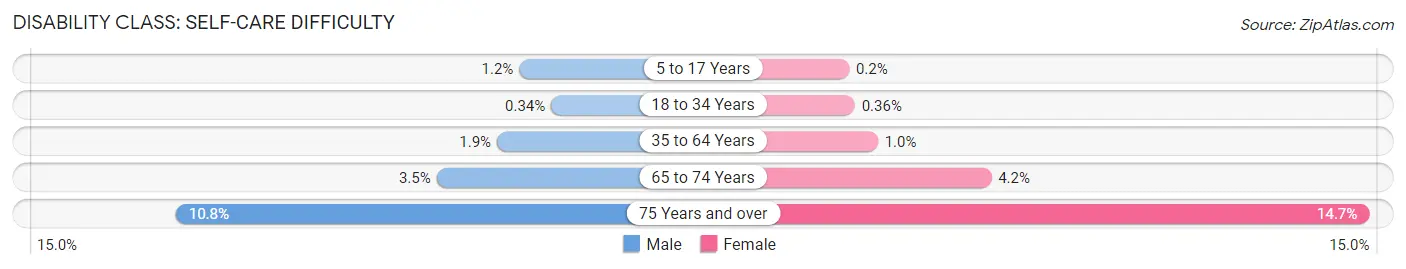
| Age Bracket | Male | Female |
| 5 to 17 Years | 97 (1.2%) | 15 (0.2%) |
| 18 to 34 Years | 78 (0.3%) | 70 (0.4%) |
| 35 to 64 Years | 467 (1.8%) | 226 (1.0%) |
| 65 to 74 Years | 137 (3.5%) | 160 (4.2%) |
| 75 Years and over | 284 (10.8%) | 569 (14.7%) |
Technology Access in Santa Clara
Computing Device Access in Santa Clara
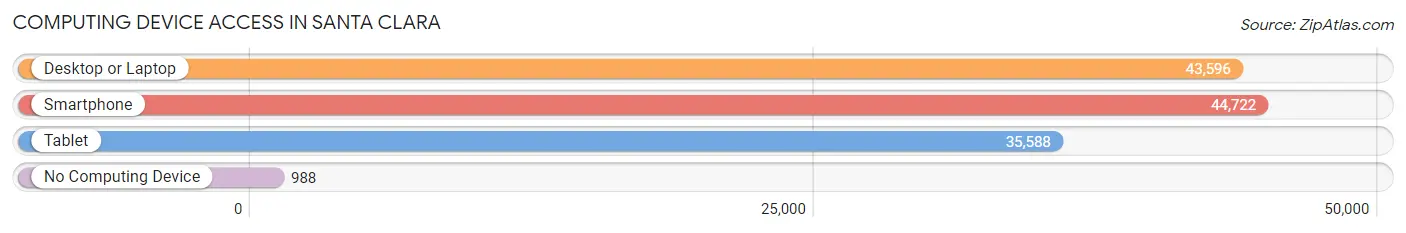
| Device Type | # Households | % Households |
| Desktop or Laptop | 43,596 | 91.9% |
| Smartphone | 44,722 | 94.3% |
| Tablet | 35,588 | 75.0% |
| No Computing Device | 988 | 2.1% |
| Total | 47,434 | 100.0% |
Internet Access in Santa Clara
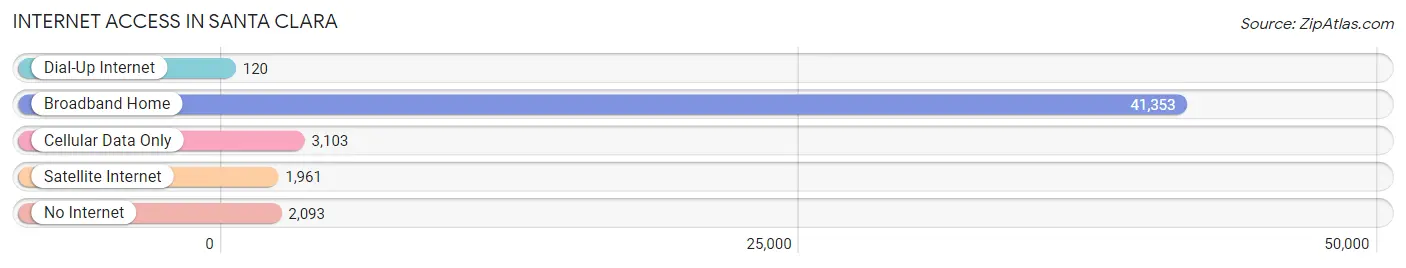
| Internet Type | # Households | % Households |
| Dial-Up Internet | 120 | 0.3% |
| Broadband Home | 41,353 | 87.2% |
| Cellular Data Only | 3,103 | 6.5% |
| Satellite Internet | 1,961 | 4.1% |
| No Internet | 2,093 | 4.4% |
| Total | 47,434 | 100.0% |
Santa Clara Summary
Santa Clara is a city located in the heart of Silicon Valley in Santa Clara County, California. It is the ninth most populous city in the state and the third most populous city in the San Francisco Bay Area. Santa Clara is home to the headquarters of many high-tech companies, including Intel, Applied Materials, and Nvidia. It is also home to Santa Clara University, the oldest institution of higher learning in the state of California.
History
The area that is now Santa Clara was originally inhabited by the Ohlone people, who lived in the area for thousands of years before the arrival of Europeans. The first Europeans to settle in the area were the Spanish, who established the Mission Santa Clara de Asís in 1777. The mission was the eighth of 21 missions established in California by the Spanish. The mission was named after Saint Clare of Assisi, the patron saint of the Franciscan order.
The mission was secularized in 1833 and the land was divided among the local Native Americans and Mexican settlers. In 1852, the town of Santa Clara was incorporated, and the city was officially incorporated in 1872.
In the late 19th century, Santa Clara became a major agricultural center, producing fruits, vegetables, and nuts. The city was also home to several wineries and breweries.
In the early 20th century, Santa Clara began to experience rapid growth due to the development of the electronics industry. The city was home to several major electronics companies, including Hewlett-Packard, IBM, and Fairchild Semiconductor.
Geography
Santa Clara is located in the center of Silicon Valley, in Santa Clara County, California. It is bordered by San Jose to the north, Sunnyvale to the east, Mountain View to the south, and Cupertino to the west. The city covers an area of 18.4 square miles and has a population of 121,717 as of the 2010 census.
The city is located in the Santa Clara Valley, which is surrounded by the Santa Cruz Mountains to the west and the Diablo Range to the east. The city is situated at the confluence of the Guadalupe and San Tomas Aquino Creeks.
Economy
Santa Clara is a major center of the technology industry, and is home to the headquarters of many high-tech companies, including Intel, Applied Materials, and Nvidia. The city is also home to several venture capital firms, including Kleiner Perkins Caufield & Byers and Sequoia Capital.
The city is also home to several major medical centers, including the Santa Clara Valley Medical Center and the Stanford University Medical Center.
Demographics
As of the 2010 census, Santa Clara had a population of 121,717. The racial makeup of the city was 57.2% White, 2.2% African American, 0.6% Native American, 28.2% Asian, 0.2% Pacific Islander, 6.7% from other races, and 5.1% from two or more races. Hispanic or Latino of any race were 18.2% of the population.
The median income for a household in the city was $90,945, and the median income for a family was $106,817. The per capita income for the city was $41,845. About 6.2% of families and 8.3% of the population were below the poverty line, including 10.2% of those under age 18 and 6.2% of those age 65 or over.
Common Questions
What is Per Capita Income in Santa Clara?
Per Capita income in Santa Clara is $78,084.
What is the Median Family Income in Santa Clara?
Median Family Income in Santa Clara is $189,381.
What is the Median Household income in Santa Clara?
Median Household Income in Santa Clara is $165,352.
What is Income or Wage Gap in Santa Clara?
Income or Wage Gap in Santa Clara is 39.8%.
Women in Santa Clara earn 60.2 cents for every dollar earned by a man.
What is Family Income Deficit in Santa Clara?
Family Income Deficit in Santa Clara is $14,699.
Families that are below poverty line in Santa Clara earn $14,699 less on average than the poverty threshold level.
What is Inequality or Gini Index in Santa Clara?
Inequality or Gini Index in Santa Clara is 0.45.
What is the Total Population of Santa Clara?
Total Population of Santa Clara is 128,058.
What is the Total Male Population of Santa Clara?
Total Male Population of Santa Clara is 67,490.
What is the Total Female Population of Santa Clara?
Total Female Population of Santa Clara is 60,568.
What is the Ratio of Males per 100 Females in Santa Clara?
There are 111.43 Males per 100 Females in Santa Clara.
What is the Ratio of Females per 100 Males in Santa Clara?
There are 89.74 Females per 100 Males in Santa Clara.
What is the Median Population Age in Santa Clara?
Median Population Age in Santa Clara is 34.5 Years.
What is the Average Family Size in Santa Clara
Average Family Size in Santa Clara is 3.1 People.
What is the Average Household Size in Santa Clara
Average Household Size in Santa Clara is 2.6 People.
How Large is the Labor Force in Santa Clara?
There are 76,721 People in the Labor Forcein in Santa Clara.
What is the Percentage of People in the Labor Force in Santa Clara?
71.6% of People are in the Labor Force in Santa Clara.
What is the Unemployment Rate in Santa Clara?
Unemployment Rate in Santa Clara is 4.2%.