Desert Center, CA Map & Demographics
Desert Center Map
Desert Center Overview
$31,393
PER CAPITA INCOME
$76,563
AVG FAMILY INCOME
$77,500
AVG HOUSEHOLD INCOME
0.35
INEQUALITY / GINI INDEX
191
TOTAL POPULATION
118
MALE POPULATION
73
FEMALE POPULATION
161.64
MALES / 100 FEMALES
61.86
FEMALES / 100 MALES
49.9
MEDIAN AGE
2.3
AVG FAMILY SIZE
2.8
AVG HOUSEHOLD SIZE
79
LABOR FORCE [ PEOPLE ]
45.1%
PERCENT IN LABOR FORCE
11.4%
UNEMPLOYMENT RATE
Desert Center Zip Codes
Income in Desert Center
Income Overview in Desert Center
Per Capita Income in Desert Center is $31,393, while median incomes of families and households are $76,563 and $77,500 respectively.
| Characteristic | Number | Measure |
| Per Capita Income | 191 | $31,393 |
| Median Family Income | 49 | $76,563 |
| Mean Family Income | 49 | $67,012 |
| Median Household Income | 68 | $77,500 |
| Mean Household Income | 68 | $85,307 |
| Income Deficit | 49 | $0 |
| Wage / Income Gap (%) | 191 | 0.00% |
| Wage / Income Gap ($) | 191 | 100.00¢ per $1 |
| Gini / Inequality Index | 191 | 0.35 |
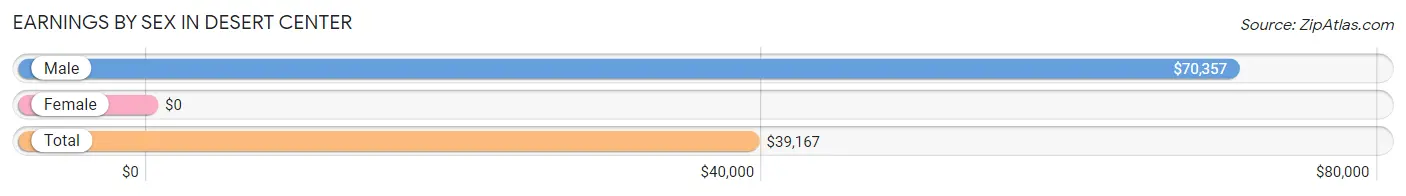
Earnings by Sex in Desert Center
| Sex | Number | Average Earnings |
| Male | 38 (51.3%) | $70,357 |
| Female | 36 (48.6%) | $0 |
| Total | 74 (100.0%) | $39,167 |
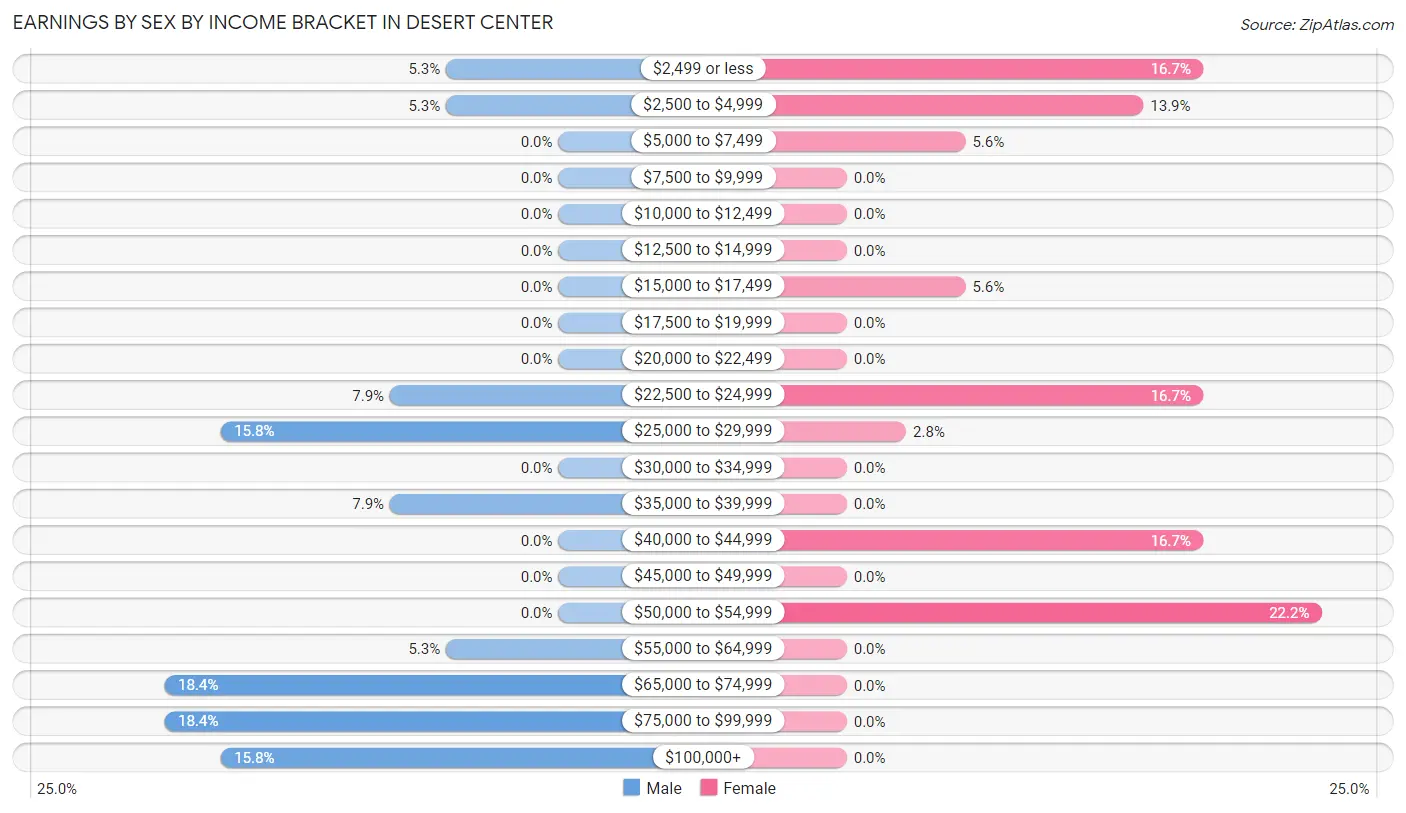
Earnings by Sex by Income Bracket in Desert Center
The most common earnings brackets in Desert Center are $65,000 to $74,999 for men (7 | 18.4%) and $50,000 to $54,999 for women (8 | 22.2%).
| Income | Male | Female |
| $2,499 or less | 2 (5.3%) | 6 (16.7%) |
| $2,500 to $4,999 | 2 (5.3%) | 5 (13.9%) |
| $5,000 to $7,499 | 0 (0.0%) | 2 (5.6%) |
| $7,500 to $9,999 | 0 (0.0%) | 0 (0.0%) |
| $10,000 to $12,499 | 0 (0.0%) | 0 (0.0%) |
| $12,500 to $14,999 | 0 (0.0%) | 0 (0.0%) |
| $15,000 to $17,499 | 0 (0.0%) | 2 (5.6%) |
| $17,500 to $19,999 | 0 (0.0%) | 0 (0.0%) |
| $20,000 to $22,499 | 0 (0.0%) | 0 (0.0%) |
| $22,500 to $24,999 | 3 (7.9%) | 6 (16.7%) |
| $25,000 to $29,999 | 6 (15.8%) | 1 (2.8%) |
| $30,000 to $34,999 | 0 (0.0%) | 0 (0.0%) |
| $35,000 to $39,999 | 3 (7.9%) | 0 (0.0%) |
| $40,000 to $44,999 | 0 (0.0%) | 6 (16.7%) |
| $45,000 to $49,999 | 0 (0.0%) | 0 (0.0%) |
| $50,000 to $54,999 | 0 (0.0%) | 8 (22.2%) |
| $55,000 to $64,999 | 2 (5.3%) | 0 (0.0%) |
| $65,000 to $74,999 | 7 (18.4%) | 0 (0.0%) |
| $75,000 to $99,999 | 7 (18.4%) | 0 (0.0%) |
| $100,000+ | 6 (15.8%) | 0 (0.0%) |
| Total | 38 (100.0%) | 36 (100.0%) |
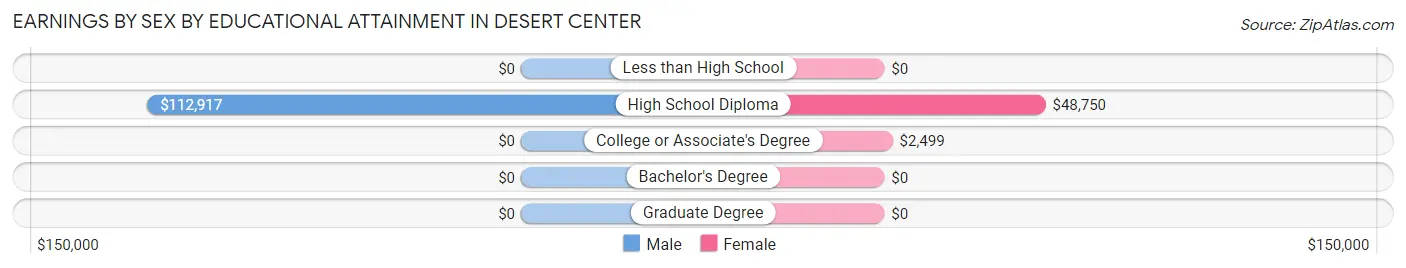
Earnings by Sex by Educational Attainment in Desert Center
| Educational Attainment | Male Income | Female Income |
| Less than High School | - | - |
| High School Diploma | $112,917 | $48,750 |
| College or Associate's Degree | - | - |
| Bachelor's Degree | - | - |
| Graduate Degree | - | - |
| Total | $70,893 | $0 |
Family Income in Desert Center
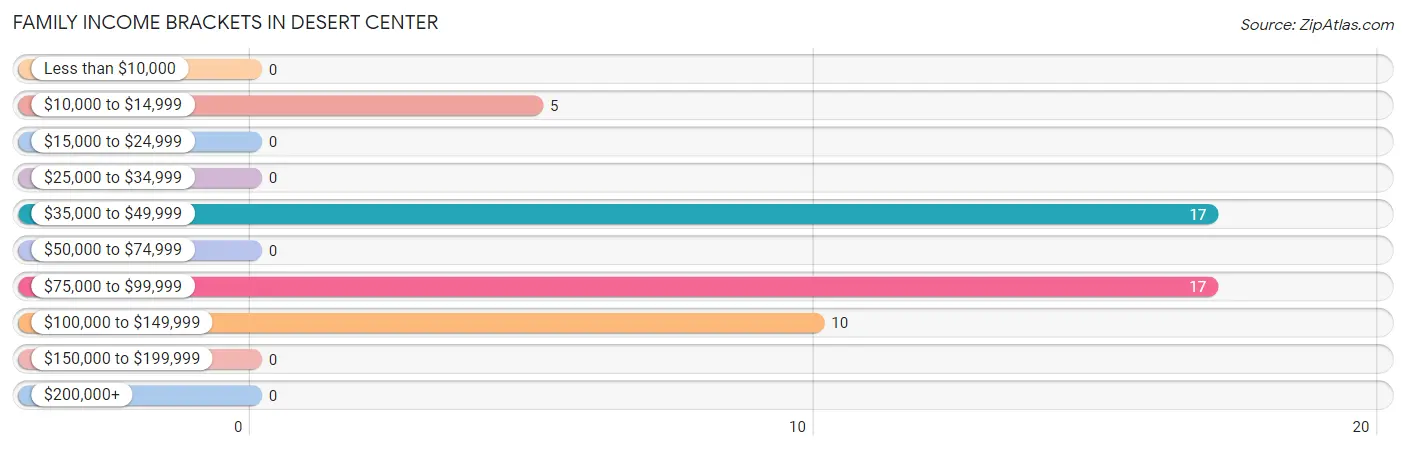
Family Income Brackets in Desert Center
According to the Desert Center family income data, there are 17 families falling into the $35,000 to $49,999 income range, which is the most common income bracket and makes up 34.7% of all families.
| Income Bracket | # Families | % Families |
| Less than $10,000 | 0 | 0.0% |
| $10,000 to $14,999 | 5 | 10.2% |
| $15,000 to $24,999 | 0 | 0.0% |
| $25,000 to $34,999 | 0 | 0.0% |
| $35,000 to $49,999 | 17 | 34.7% |
| $50,000 to $74,999 | 0 | 0.0% |
| $75,000 to $99,999 | 17 | 34.7% |
| $100,000 to $149,999 | 10 | 20.4% |
| $150,000 to $199,999 | 0 | 0.0% |
| $200,000+ | 0 | 0.0% |
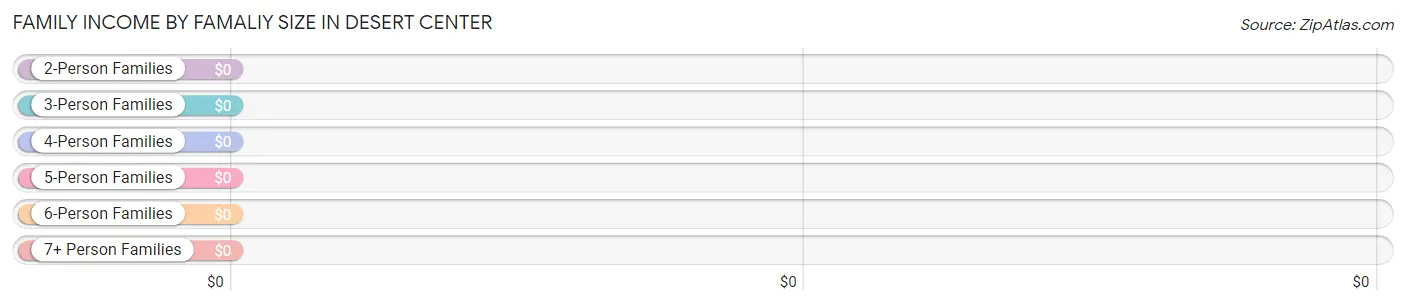
Family Income by Famaliy Size in Desert Center
| Income Bracket | # Families | Median Income |
| 2-Person Families | 40 (81.6%) | $0 |
| 3-Person Families | 0 (0.0%) | $0 |
| 4-Person Families | 9 (18.4%) | $0 |
| 5-Person Families | 0 (0.0%) | $0 |
| 6-Person Families | 0 (0.0%) | $0 |
| 7+ Person Families | 0 (0.0%) | $0 |
| Total | 49 (100.0%) | $76,563 |
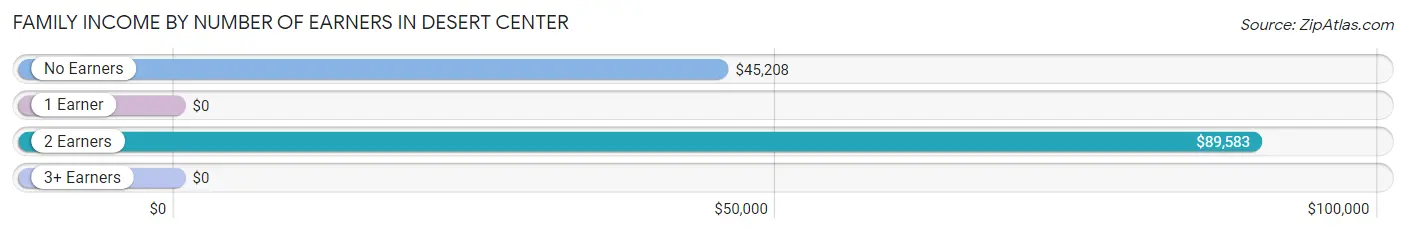
Family Income by Number of Earners in Desert Center
| Number of Earners | # Families | Median Income |
| No Earners | 23 (46.9%) | $45,208 |
| 1 Earner | 9 (18.4%) | $0 |
| 2 Earners | 14 (28.6%) | $89,583 |
| 3+ Earners | 3 (6.1%) | $0 |
| Total | 49 (100.0%) | $76,563 |
Household Income in Desert Center
Household Income Brackets in Desert Center
With 28 households falling in the category, the $75,000 to $99,999 income range is the most frequent in Desert Center, accounting for 41.2% of all households.
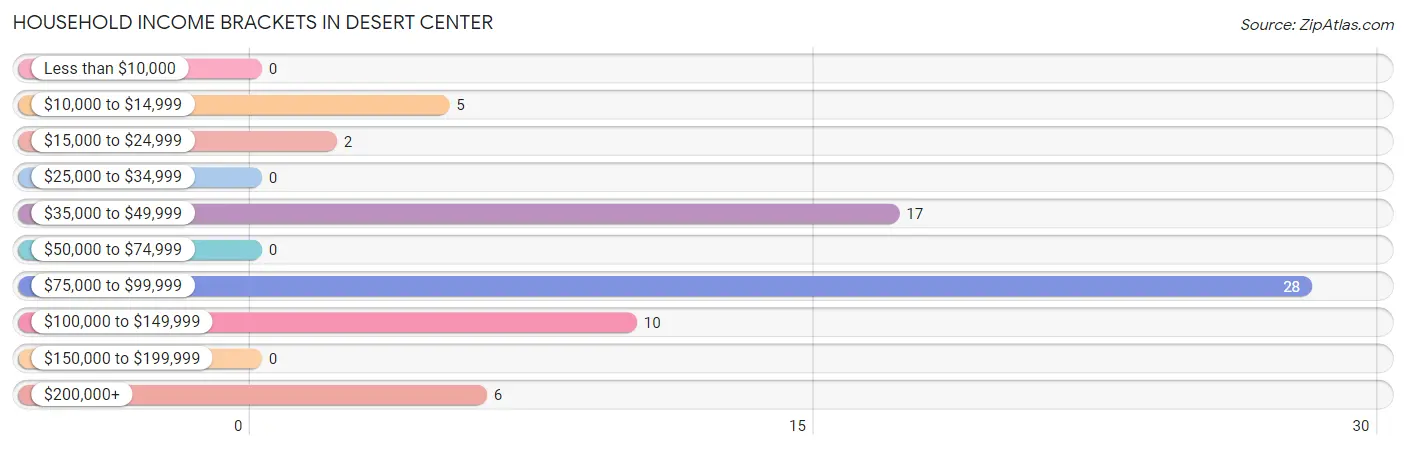
| Income Bracket | # Households | % Households |
| Less than $10,000 | 0 | 0.0% |
| $10,000 to $14,999 | 5 | 7.4% |
| $15,000 to $24,999 | 2 | 2.9% |
| $25,000 to $34,999 | 0 | 0.0% |
| $35,000 to $49,999 | 17 | 25.0% |
| $50,000 to $74,999 | 0 | 0.0% |
| $75,000 to $99,999 | 28 | 41.2% |
| $100,000 to $149,999 | 10 | 14.7% |
| $150,000 to $199,999 | 0 | 0.0% |
| $200,000+ | 6 | 8.8% |
Household Income by Householder Age in Desert Center
The median household income in Desert Center is $77,500, with the highest median household income of $77,125 found in the 65+ years age bracket for the primary householder. A total of 33 households (48.5%) fall into this category.
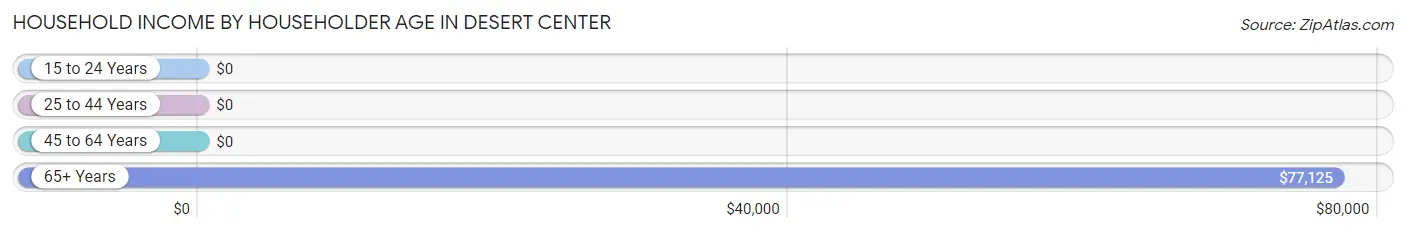
| Income Bracket | # Households | Median Income |
| 15 to 24 Years | 0 (0.0%) | $0 |
| 25 to 44 Years | 3 (4.4%) | $0 |
| 45 to 64 Years | 32 (47.1%) | $0 |
| 65+ Years | 33 (48.5%) | $77,125 |
| Total | 68 (100.0%) | $77,500 |
Poverty in Desert Center
Income Below Poverty by Sex and Age in Desert Center
With 28.0% poverty level for males and 20.5% for females among the residents of Desert Center, 25 to 34 year old males and 18 to 24 year old females are the most vulnerable to poverty, with 9 males (81.8%) and 2 females (100.0%) in their respective age groups living below the poverty level.
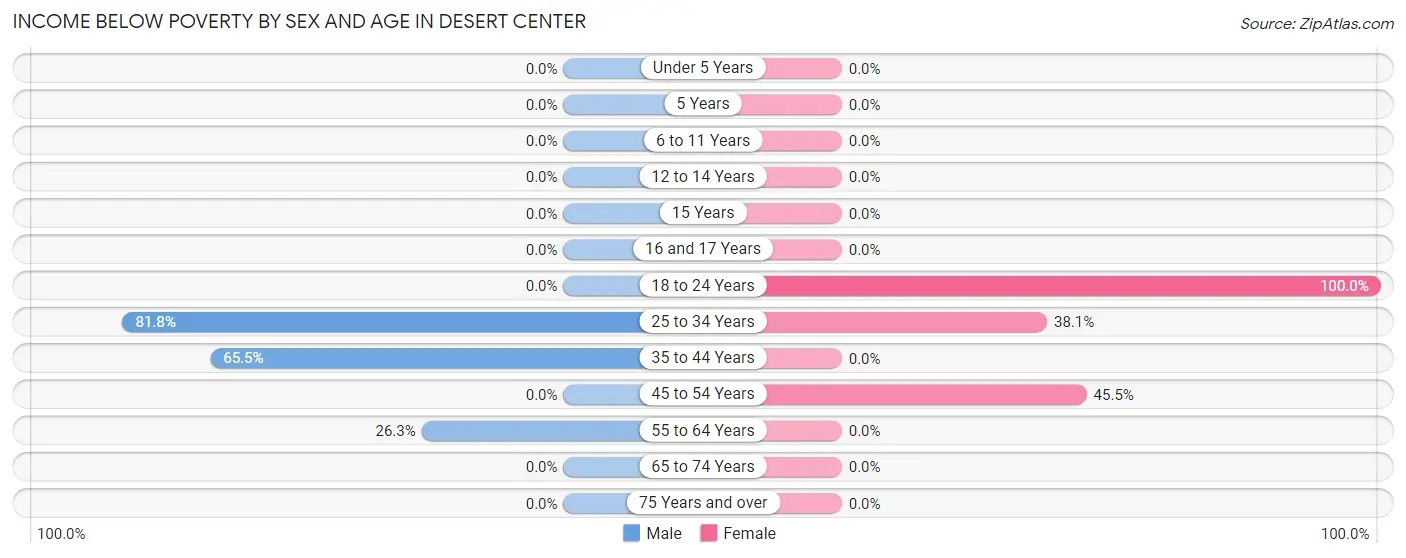
| Age Bracket | Male | Female |
| Under 5 Years | 0 (0.0%) | 0 (0.0%) |
| 5 Years | 0 (0.0%) | 0 (0.0%) |
| 6 to 11 Years | 0 (0.0%) | 0 (0.0%) |
| 12 to 14 Years | 0 (0.0%) | 0 (0.0%) |
| 15 Years | 0 (0.0%) | 0 (0.0%) |
| 16 and 17 Years | 0 (0.0%) | 0 (0.0%) |
| 18 to 24 Years | 0 (0.0%) | 2 (100.0%) |
| 25 to 34 Years | 9 (81.8%) | 8 (38.1%) |
| 35 to 44 Years | 19 (65.5%) | 0 (0.0%) |
| 45 to 54 Years | 0 (0.0%) | 5 (45.5%) |
| 55 to 64 Years | 5 (26.3%) | 0 (0.0%) |
| 65 to 74 Years | 0 (0.0%) | 0 (0.0%) |
| 75 Years and over | 0 (0.0%) | 0 (0.0%) |
| Total | 33 (28.0%) | 15 (20.5%) |
Income Above Poverty by Sex and Age in Desert Center
According to the poverty statistics in Desert Center, males aged under 5 years and females aged 6 to 11 years are the age groups that are most secure financially, with 100.0% of males and 100.0% of females in these age groups living above the poverty line.
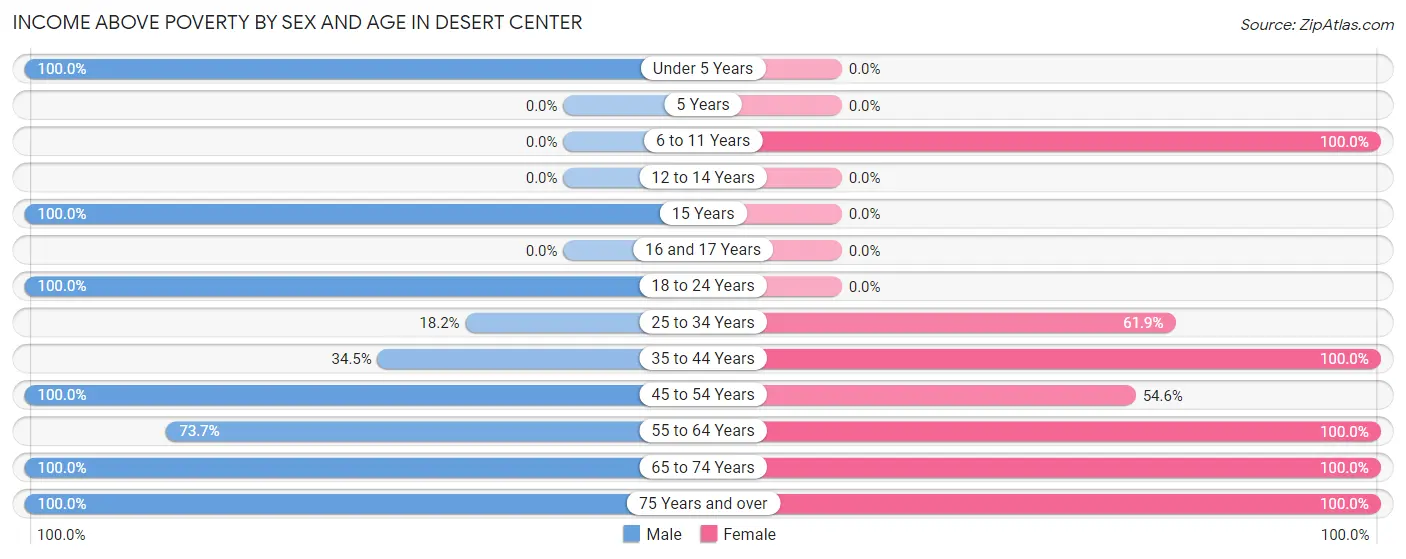
| Age Bracket | Male | Female |
| Under 5 Years | 9 (100.0%) | 0 (0.0%) |
| 5 Years | 0 (0.0%) | 0 (0.0%) |
| 6 to 11 Years | 0 (0.0%) | 5 (100.0%) |
| 12 to 14 Years | 0 (0.0%) | 0 (0.0%) |
| 15 Years | 2 (100.0%) | 0 (0.0%) |
| 16 and 17 Years | 0 (0.0%) | 0 (0.0%) |
| 18 to 24 Years | 3 (100.0%) | 0 (0.0%) |
| 25 to 34 Years | 2 (18.2%) | 13 (61.9%) |
| 35 to 44 Years | 10 (34.5%) | 2 (100.0%) |
| 45 to 54 Years | 6 (100.0%) | 6 (54.5%) |
| 55 to 64 Years | 14 (73.7%) | 13 (100.0%) |
| 65 to 74 Years | 20 (100.0%) | 14 (100.0%) |
| 75 Years and over | 19 (100.0%) | 5 (100.0%) |
| Total | 85 (72.0%) | 58 (79.4%) |
Income Below Poverty Among Married-Couple Families in Desert Center
The poverty statistics for married-couple families in Desert Center show that 10.6% or 5 of the total 47 families live below the poverty line. Families with no children have the highest poverty rate of 13.2%, comprising of 5 families. On the other hand, families with 1 or 2 children have the lowest poverty rate of 0.0%, which includes 0 families.
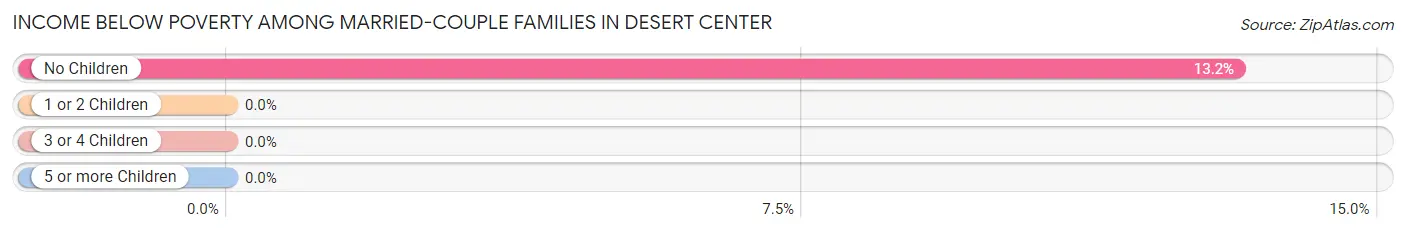
| Children | Above Poverty | Below Poverty |
| No Children | 33 (86.8%) | 5 (13.2%) |
| 1 or 2 Children | 9 (100.0%) | 0 (0.0%) |
| 3 or 4 Children | 0 (0.0%) | 0 (0.0%) |
| 5 or more Children | 0 (0.0%) | 0 (0.0%) |
| Total | 42 (89.4%) | 5 (10.6%) |
Income Below Poverty Among Single-Parent Households in Desert Center
| Children | Single Father | Single Mother |
| No Children | 0 (0.0%) | 0 (0.0%) |
| 1 or 2 Children | 0 (0.0%) | 0 (0.0%) |
| 3 or 4 Children | 0 (0.0%) | 0 (0.0%) |
| 5 or more Children | 0 (0.0%) | 0 (0.0%) |
| Total | 0 (0.0%) | 0 (0.0%) |
Income Below Poverty Among Married-Couple vs Single-Parent Households in Desert Center
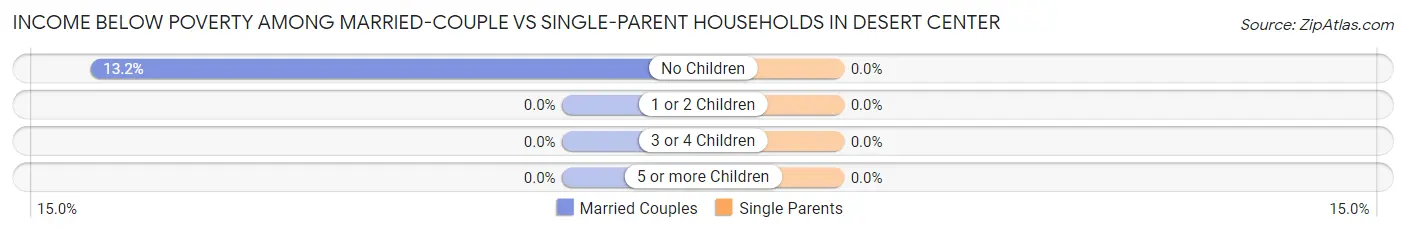
| Children | Married-Couple Families | Single-Parent Households |
| No Children | 5 (13.2%) | 0 (0.0%) |
| 1 or 2 Children | 0 (0.0%) | 0 (0.0%) |
| 3 or 4 Children | 0 (0.0%) | 0 (0.0%) |
| 5 or more Children | 0 (0.0%) | 0 (0.0%) |
| Total | 5 (10.6%) | 0 (0.0%) |
Race in Desert Center
The most populous races in Desert Center are White / Caucasian (131 | 68.6%), Hispanic or Latino (56 | 29.3%), and Some other Race (36 | 18.9%).
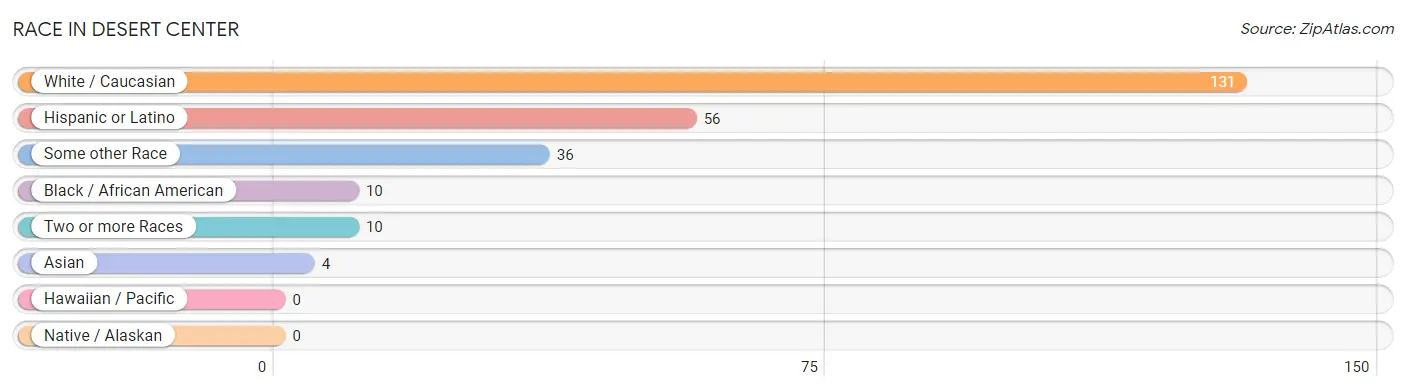
| Race | # Population | % Population |
| Asian | 4 | 2.1% |
| Black / African American | 10 | 5.2% |
| Hawaiian / Pacific | 0 | 0.0% |
| Hispanic or Latino | 56 | 29.3% |
| Native / Alaskan | 0 | 0.0% |
| White / Caucasian | 131 | 68.6% |
| Two or more Races | 10 | 5.2% |
| Some other Race | 36 | 18.9% |
| Total | 191 | 100.0% |
Ancestry in Desert Center
The most populous ancestries reported in Desert Center are Mexican (47 | 24.6%), Irish (30 | 15.7%), German (28 | 14.7%), English (19 | 10.0%), and Finnish (8 | 4.2%), together accounting for 69.1% of all Desert Center residents.
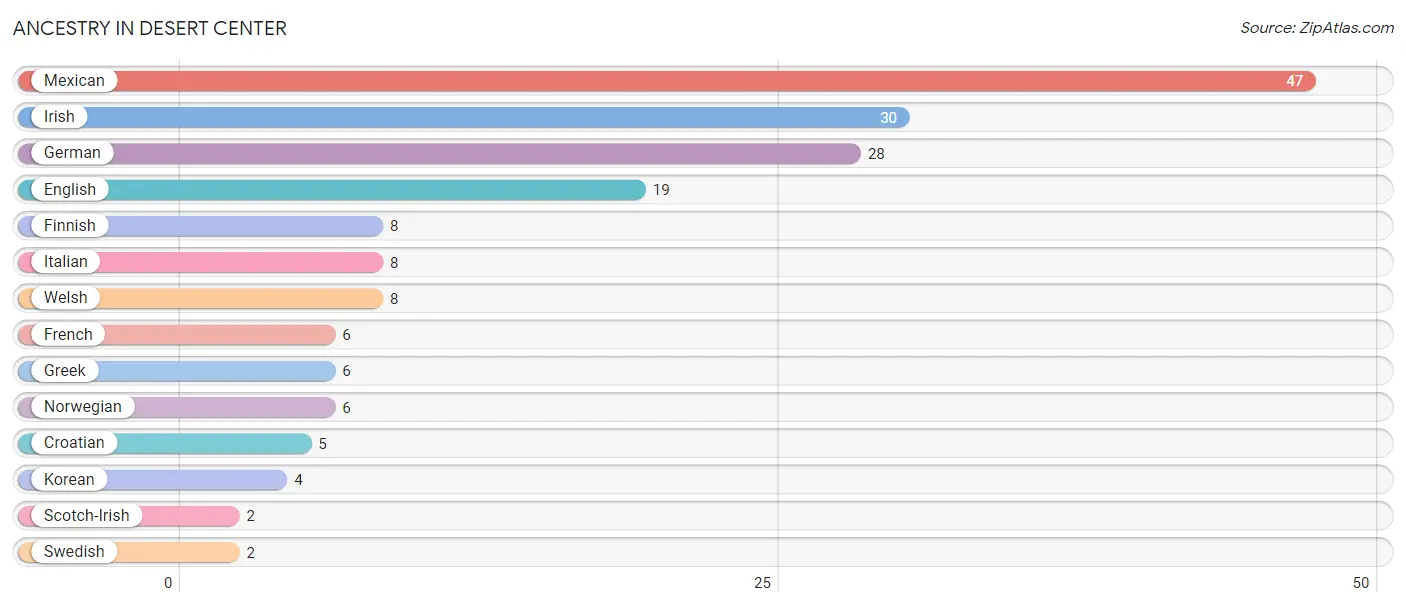
| Ancestry | # Population | % Population |
| Croatian | 5 | 2.6% |
| English | 19 | 10.0% |
| Finnish | 8 | 4.2% |
| French | 6 | 3.1% |
| German | 28 | 14.7% |
| Greek | 6 | 3.1% |
| Irish | 30 | 15.7% |
| Italian | 8 | 4.2% |
| Korean | 4 | 2.1% |
| Mexican | 47 | 24.6% |
| Norwegian | 6 | 3.1% |
| Scotch-Irish | 2 | 1.1% |
| Swedish | 2 | 1.1% |
| Welsh | 8 | 4.2% | View All 14 Rows |
Immigrants in Desert Center
The most numerous immigrant groups reported in Desert Center came from Central America (12 | 6.3%), Latin America (12 | 6.3%), Mexico (12 | 6.3%), Asia (2 | 1.1%), and Philippines (2 | 1.1%), together accounting for 20.9% of all Desert Center residents.
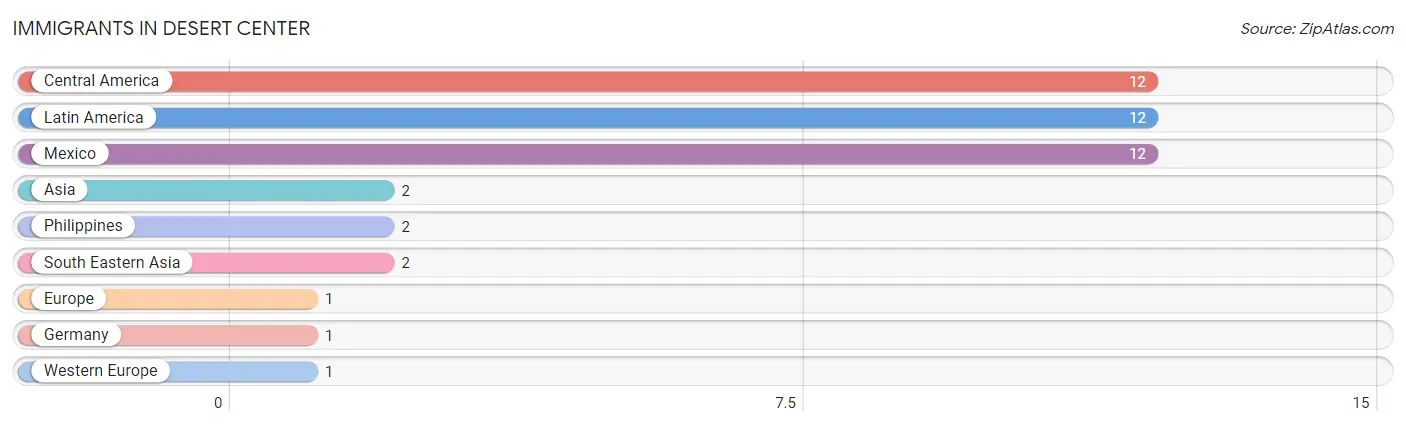
| Immigration Origin | # Population | % Population |
| Asia | 2 | 1.1% |
| Central America | 12 | 6.3% |
| Europe | 1 | 0.5% |
| Germany | 1 | 0.5% |
| Latin America | 12 | 6.3% |
| Mexico | 12 | 6.3% |
| Philippines | 2 | 1.1% |
| South Eastern Asia | 2 | 1.1% |
| Western Europe | 1 | 0.5% | View All 9 Rows |
Sex and Age in Desert Center
Sex and Age in Desert Center
The most populous age groups in Desert Center are 35 to 39 Years (17 | 14.4%) for men and 25 to 29 Years (13 | 17.8%) for women.
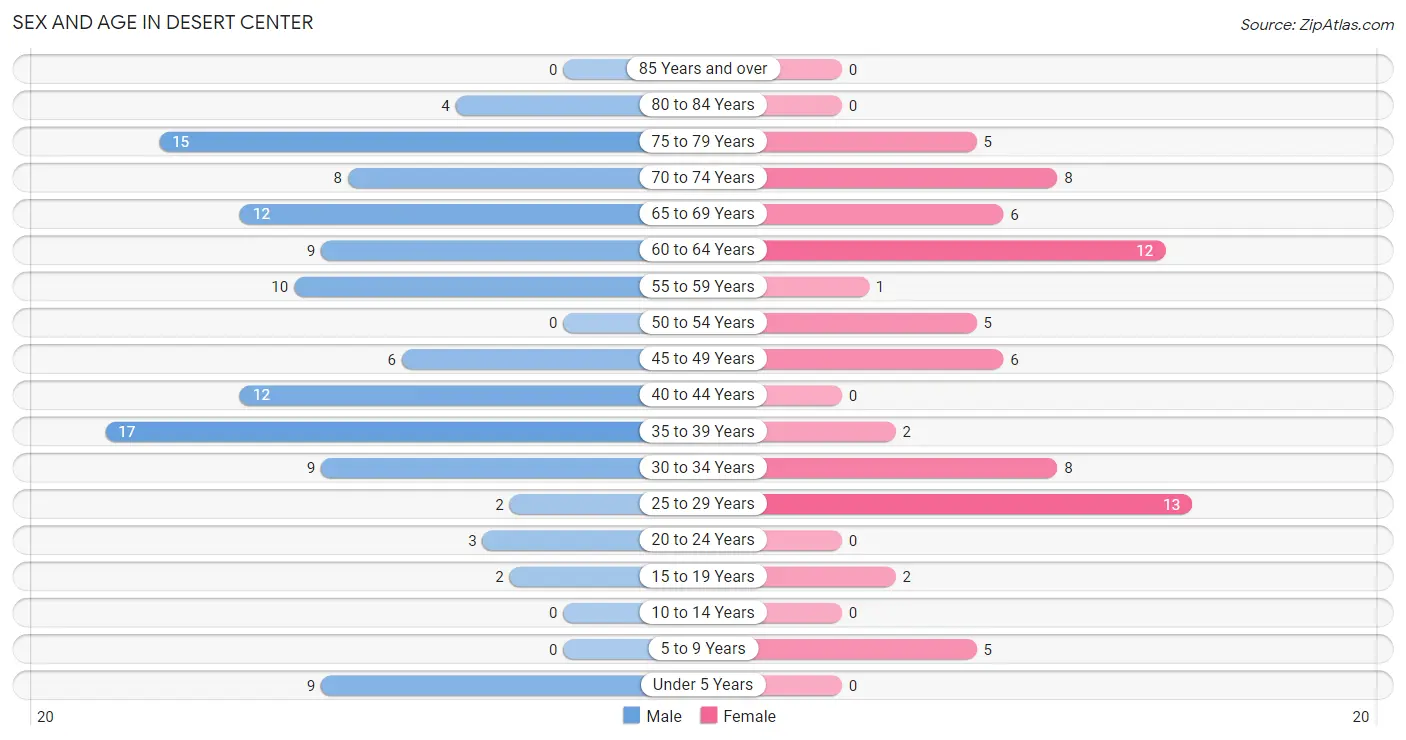
| Age Bracket | Male | Female |
| Under 5 Years | 9 (7.6%) | 0 (0.0%) |
| 5 to 9 Years | 0 (0.0%) | 5 (6.9%) |
| 10 to 14 Years | 0 (0.0%) | 0 (0.0%) |
| 15 to 19 Years | 2 (1.7%) | 2 (2.7%) |
| 20 to 24 Years | 3 (2.5%) | 0 (0.0%) |
| 25 to 29 Years | 2 (1.7%) | 13 (17.8%) |
| 30 to 34 Years | 9 (7.6%) | 8 (11.0%) |
| 35 to 39 Years | 17 (14.4%) | 2 (2.7%) |
| 40 to 44 Years | 12 (10.2%) | 0 (0.0%) |
| 45 to 49 Years | 6 (5.1%) | 6 (8.2%) |
| 50 to 54 Years | 0 (0.0%) | 5 (6.9%) |
| 55 to 59 Years | 10 (8.5%) | 1 (1.4%) |
| 60 to 64 Years | 9 (7.6%) | 12 (16.4%) |
| 65 to 69 Years | 12 (10.2%) | 6 (8.2%) |
| 70 to 74 Years | 8 (6.8%) | 8 (11.0%) |
| 75 to 79 Years | 15 (12.7%) | 5 (6.9%) |
| 80 to 84 Years | 4 (3.4%) | 0 (0.0%) |
| 85 Years and over | 0 (0.0%) | 0 (0.0%) |
| Total | 118 (100.0%) | 73 (100.0%) |
Families and Households in Desert Center
Median Family Size in Desert Center
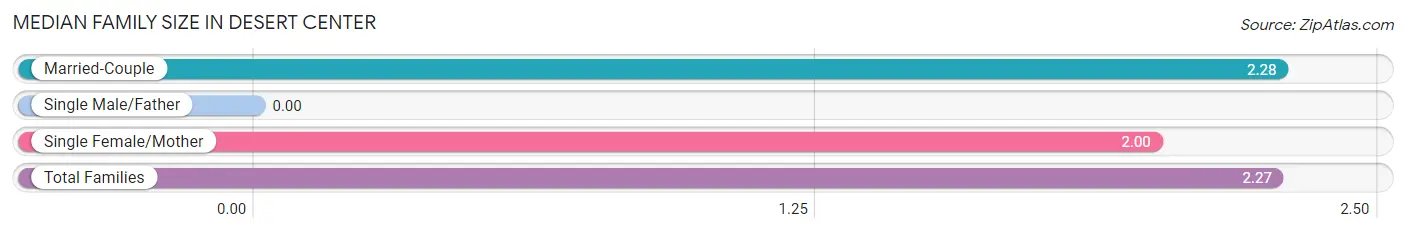
| Family Type | # Families | Family Size |
| Married-Couple | 47 (95.9%) | 2.28 |
| Single Male/Father | 0 (0.0%) | - |
| Single Female/Mother | 2 (4.1%) | 2.00 |
| Total Families | 49 (100.0%) | 2.27 |
Median Household Size in Desert Center
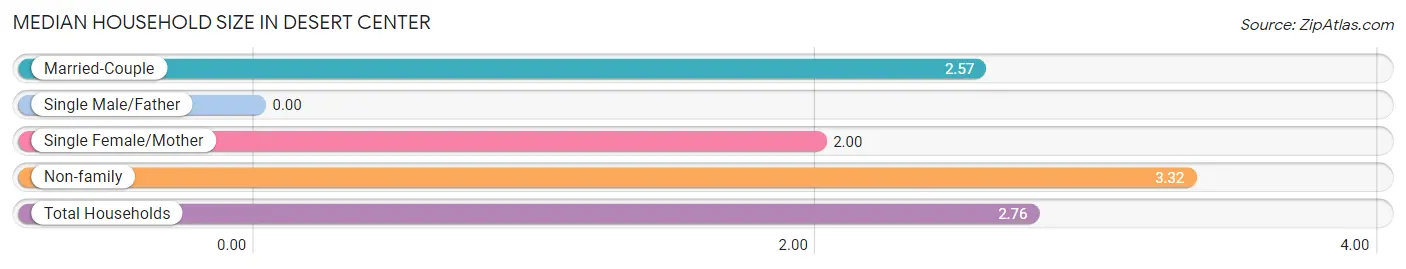
| Household Type | # Households | Household Size |
| Married-Couple | 47 (69.1%) | 2.57 |
| Single Male/Father | 0 (0.0%) | - |
| Single Female/Mother | 2 (2.9%) | 2.00 |
| Non-family | 19 (27.9%) | 3.32 |
| Total Households | 68 (100.0%) | 2.76 |
Household Size by Marriage Status in Desert Center
Out of a total of 68 households in Desert Center, 49 (72.1%) are family households, while 19 (27.9%) are nonfamily households. The most numerous type of family households are 2-person households, comprising 34, and the most common type of nonfamily households are 1-person households, comprising 13.
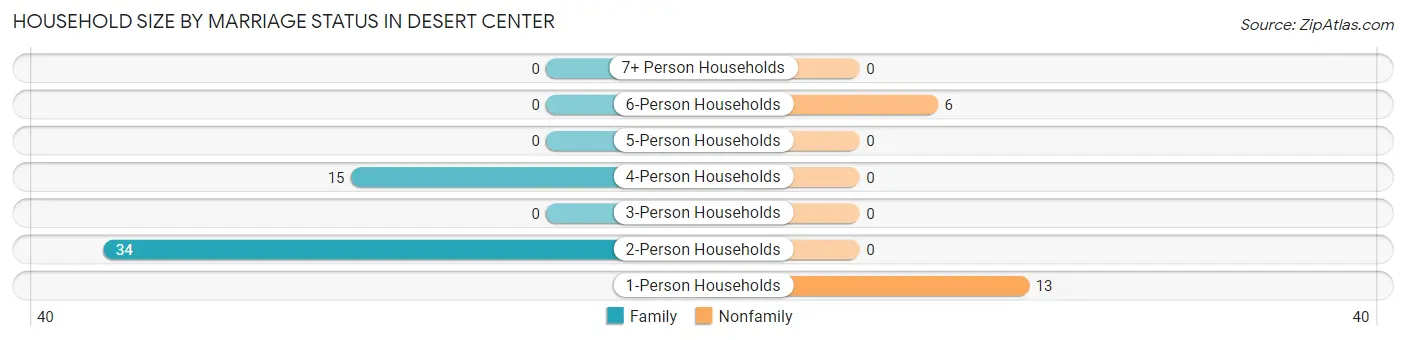
| Household Size | Family Households | Nonfamily Households |
| 1-Person Households | - | 13 (19.1%) |
| 2-Person Households | 34 (50.0%) | 0 (0.0%) |
| 3-Person Households | 0 (0.0%) | 0 (0.0%) |
| 4-Person Households | 15 (22.1%) | 0 (0.0%) |
| 5-Person Households | 0 (0.0%) | 0 (0.0%) |
| 6-Person Households | 0 (0.0%) | 6 (8.8%) |
| 7+ Person Households | 0 (0.0%) | 0 (0.0%) |
| Total | 49 (72.1%) | 19 (27.9%) |
Female Fertility in Desert Center
Fertility by Age in Desert Center
| Age Bracket | Women with Births | Births / 1,000 Women |
| 15 to 19 years | 0 (0.0%) | 0.0 |
| 20 to 34 years | 0 (0.0%) | 0.0 |
| 35 to 50 years | 0 (0.0%) | 0.0 |
| Total | 0 (0.0%) | 0.0 |
Fertility by Age by Marriage Status in Desert Center
| Age Bracket | Married | Unmarried |
| 15 to 19 years | 0 (0.0%) | 0 (0.0%) |
| 20 to 34 years | 0 (0.0%) | 0 (0.0%) |
| 35 to 50 years | 0 (0.0%) | 0 (0.0%) |
| Total | 0 (0.0%) | 0 (0.0%) |
Fertility by Education in Desert Center
| Educational Attainment | Women with Births | Births / 1,000 Women |
| Less than High School | 0 (0.0%) | 0.0 |
| High School Diploma | 0 (0.0%) | 0.0 |
| College or Associate's Degree | 0 (0.0%) | 0.0 |
| Bachelor's Degree | 0 (0.0%) | 0.0 |
| Graduate Degree | 0 (0.0%) | 0.0 |
| Total | 0 (0.0%) | 0.0 |
Fertility by Education by Marriage Status in Desert Center
| Educational Attainment | Married | Unmarried |
| Less than High School | 0 (0.0%) | 0 (0.0%) |
| High School Diploma | 0 (0.0%) | 0 (0.0%) |
| College or Associate's Degree | 0 (0.0%) | 0 (0.0%) |
| Bachelor's Degree | 0 (0.0%) | 0 (0.0%) |
| Graduate Degree | 0 (0.0%) | 0 (0.0%) |
| Total | 0 (0.0%) | 0 (0.0%) |
Employment Characteristics in Desert Center
Employment by Class of Employer in Desert Center
Among the 70 employed individuals in Desert Center, private company employees (55 | 78.6%), self-employed (incorporated) (12 | 17.1%), and not-for-profit organizations (3 | 4.3%) make up the most common classes of employment.
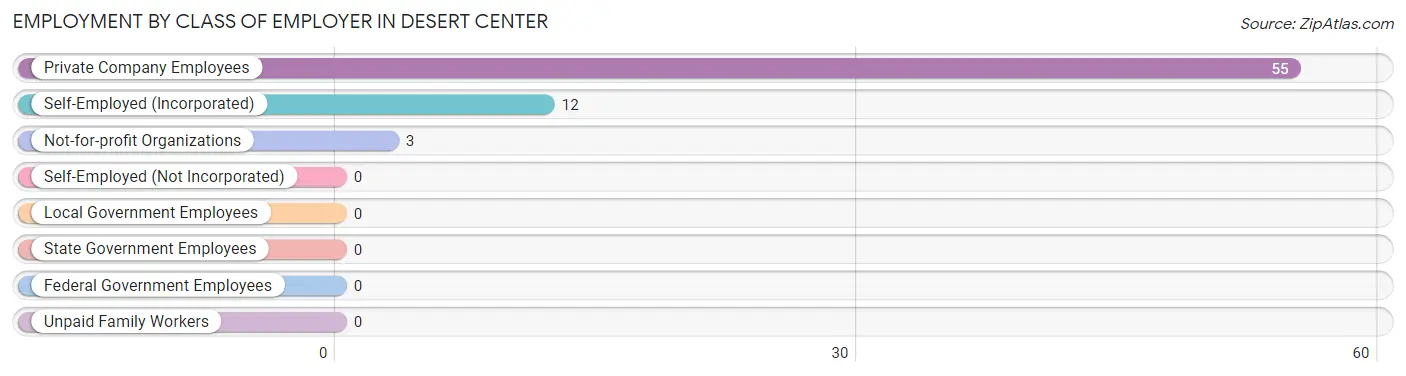
| Employer Class | # Employees | % Employees |
| Private Company Employees | 55 | 78.6% |
| Self-Employed (Incorporated) | 12 | 17.1% |
| Self-Employed (Not Incorporated) | 0 | 0.0% |
| Not-for-profit Organizations | 3 | 4.3% |
| Local Government Employees | 0 | 0.0% |
| State Government Employees | 0 | 0.0% |
| Federal Government Employees | 0 | 0.0% |
| Unpaid Family Workers | 0 | 0.0% |
| Total | 70 | 100.0% |
Employment Status by Age in Desert Center
According to the labor force statistics for Desert Center, out of the total population over 16 years of age (175), 45.1% or 79 individuals are in the labor force, with 11.4% or 9 of them unemployed. The age group with the highest labor force participation rate is 20 to 24 years, with 100.0% or 3 individuals in the labor force. Within the labor force, the 35 to 44 years age range has the highest percentage of unemployed individuals, with 42.9% or 9 of them being unemployed.
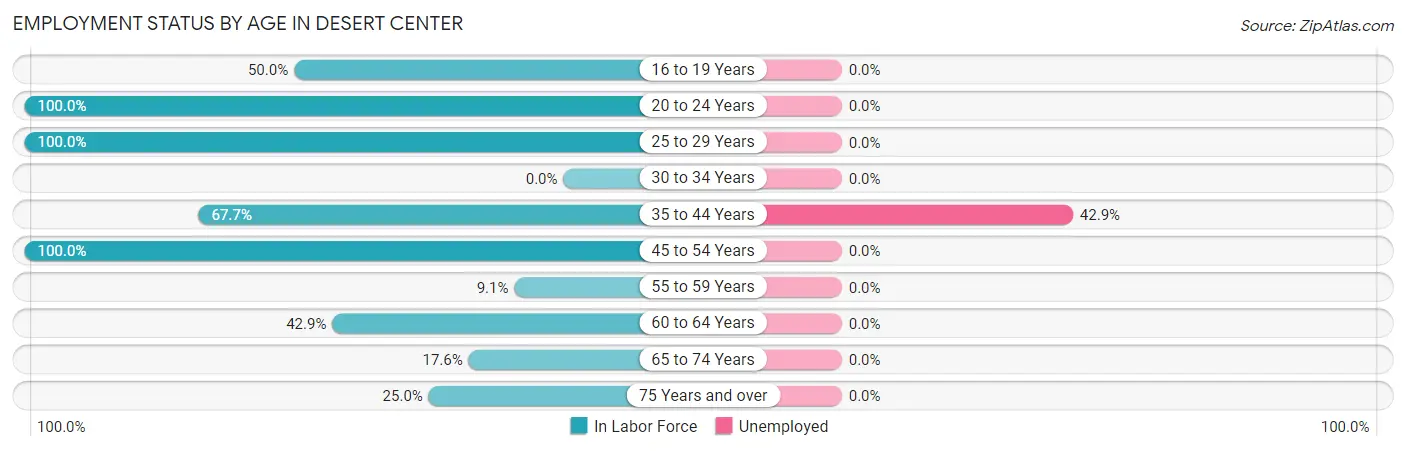
| Age Bracket | In Labor Force | Unemployed |
| 16 to 19 Years | 1 (50.0%) | 0 (0.0%) |
| 20 to 24 Years | 3 (100.0%) | 0 (0.0%) |
| 25 to 29 Years | 15 (100.0%) | 0 (0.0%) |
| 30 to 34 Years | 0 (0.0%) | 0 (0.0%) |
| 35 to 44 Years | 21 (67.7%) | 9 (42.9%) |
| 45 to 54 Years | 17 (100.0%) | 0 (0.0%) |
| 55 to 59 Years | 1 (9.1%) | 0 (0.0%) |
| 60 to 64 Years | 9 (42.9%) | 0 (0.0%) |
| 65 to 74 Years | 6 (17.6%) | 0 (0.0%) |
| 75 Years and over | 6 (25.0%) | 0 (0.0%) |
| Total | 79 (45.1%) | 9 (11.4%) |
Employment Status by Educational Attainment in Desert Center
According to labor force statistics for Desert Center, 56.3% of individuals (63) out of the total population between 25 and 64 years of age (112) are in the labor force, with 14.3% or 9 of them being unemployed. The group with the highest labor force participation rate are those with the educational attainment of less than high school, with 100.0% or 3 individuals in the labor force. Within the labor force, individuals with high school diploma education have the highest percentage of unemployment, with 27.3% or 9 of them being unemployed.
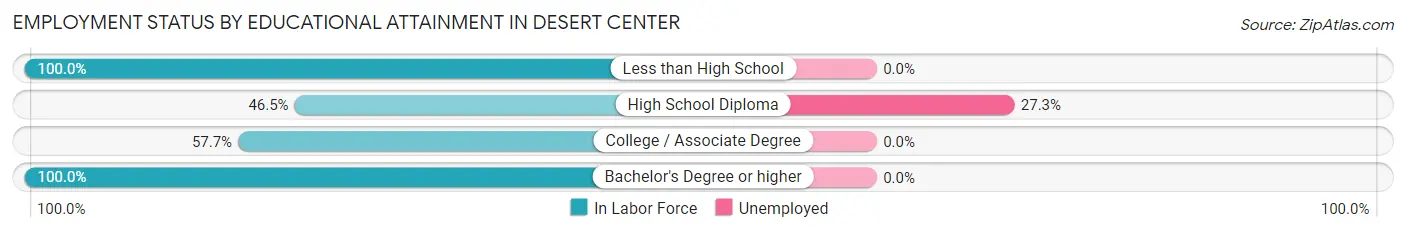
| Educational Attainment | In Labor Force | Unemployed |
| Less than High School | 3 (100.0%) | 0 (0.0%) |
| High School Diploma | 33 (46.5%) | 19 (27.3%) |
| College / Associate Degree | 15 (57.7%) | 0 (0.0%) |
| Bachelor's Degree or higher | 12 (100.0%) | 0 (0.0%) |
| Total | 63 (56.3%) | 16 (14.3%) |
Employment Occupations by Sex in Desert Center
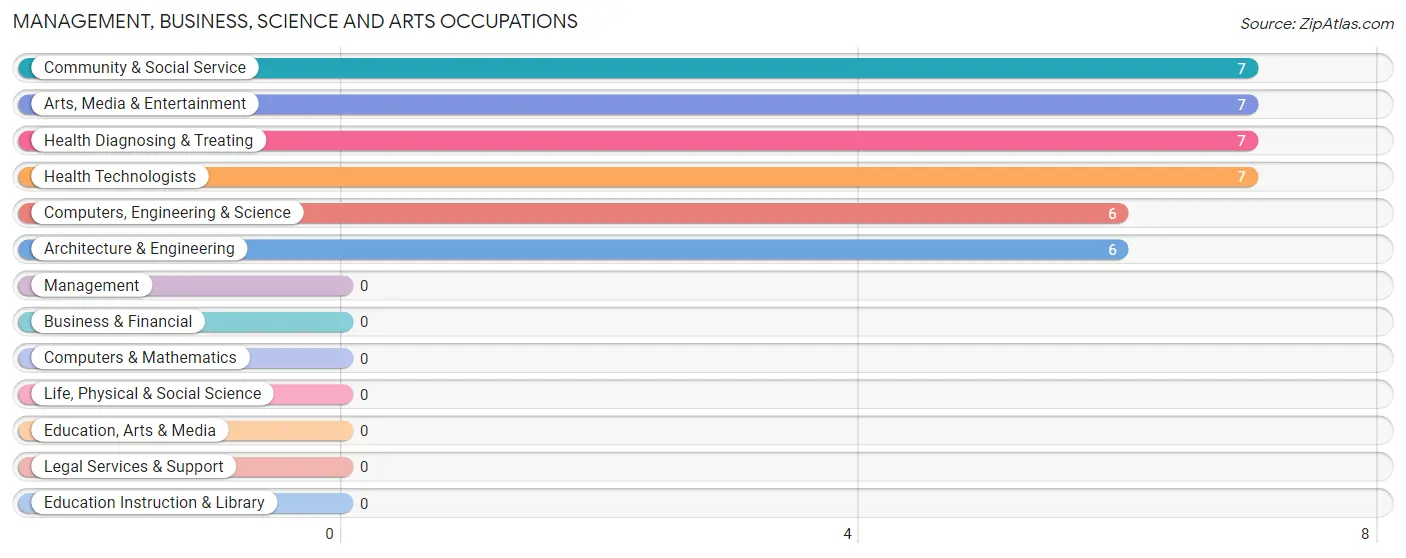
Management, Business, Science and Arts Occupations
The most common Management, Business, Science and Arts occupations in Desert Center are Community & Social Service (7 | 10.0%), Arts, Media & Entertainment (7 | 10.0%), Health Diagnosing & Treating (7 | 10.0%), Health Technologists (7 | 10.0%), and Computers, Engineering & Science (6 | 8.6%).
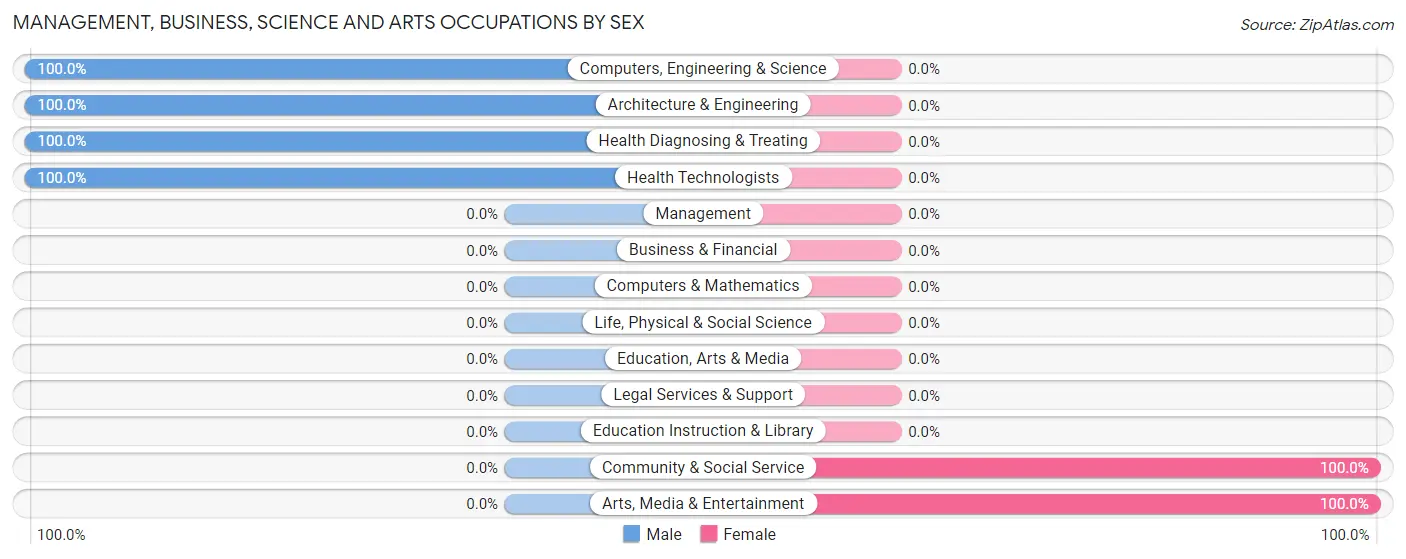
Management, Business, Science and Arts Occupations by Sex
Within the Management, Business, Science and Arts occupations in Desert Center, the most male-oriented occupations are Computers, Engineering & Science (100.0%), Architecture & Engineering (100.0%), and Health Diagnosing & Treating (100.0%), while the most female-oriented occupations are Community & Social Service (100.0%), and Arts, Media & Entertainment (100.0%).
| Occupation | Male | Female |
| Management | 0 (0.0%) | 0 (0.0%) |
| Business & Financial | 0 (0.0%) | 0 (0.0%) |
| Computers, Engineering & Science | 6 (100.0%) | 0 (0.0%) |
| Computers & Mathematics | 0 (0.0%) | 0 (0.0%) |
| Architecture & Engineering | 6 (100.0%) | 0 (0.0%) |
| Life, Physical & Social Science | 0 (0.0%) | 0 (0.0%) |
| Community & Social Service | 0 (0.0%) | 7 (100.0%) |
| Education, Arts & Media | 0 (0.0%) | 0 (0.0%) |
| Legal Services & Support | 0 (0.0%) | 0 (0.0%) |
| Education Instruction & Library | 0 (0.0%) | 0 (0.0%) |
| Arts, Media & Entertainment | 0 (0.0%) | 7 (100.0%) |
| Health Diagnosing & Treating | 7 (100.0%) | 0 (0.0%) |
| Health Technologists | 7 (100.0%) | 0 (0.0%) |
| Total (Category) | 13 (65.0%) | 7 (35.0%) |
| Total (Overall) | 34 (48.6%) | 36 (51.4%) |
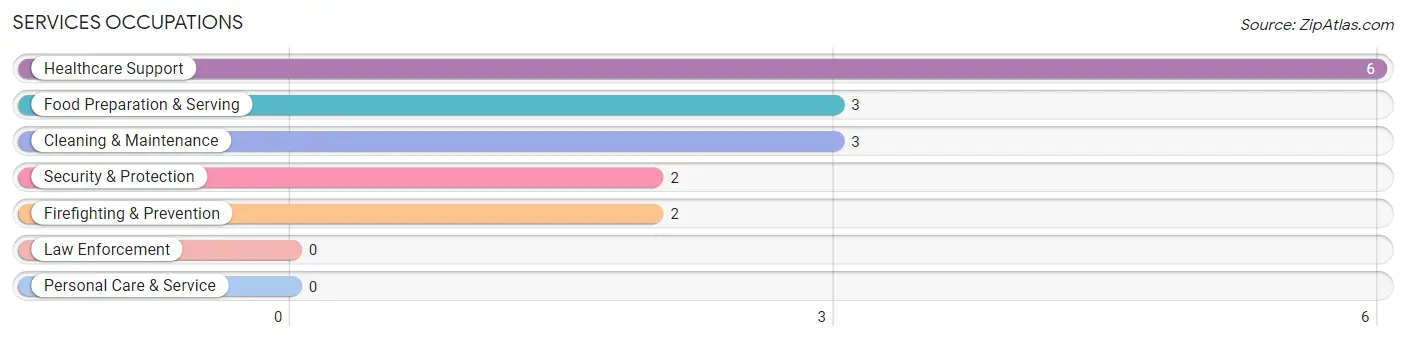
Services Occupations
The most common Services occupations in Desert Center are Healthcare Support (6 | 8.6%), Food Preparation & Serving (3 | 4.3%), Cleaning & Maintenance (3 | 4.3%), Security & Protection (2 | 2.9%), and Firefighting & Prevention (2 | 2.9%).
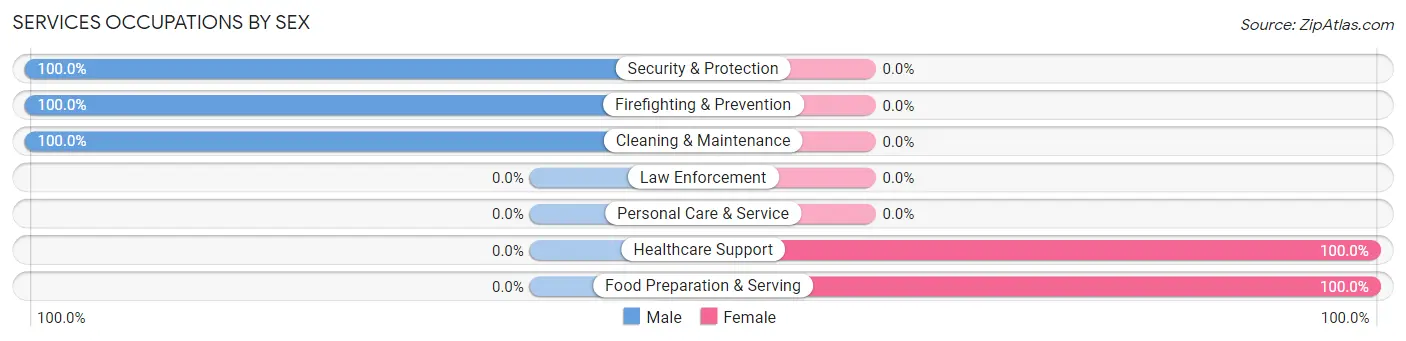
Services Occupations by Sex
Within the Services occupations in Desert Center, the most male-oriented occupations are Security & Protection (100.0%), Firefighting & Prevention (100.0%), and Cleaning & Maintenance (100.0%), while the most female-oriented occupations are Healthcare Support (100.0%), and Food Preparation & Serving (100.0%).
| Occupation | Male | Female |
| Healthcare Support | 0 (0.0%) | 6 (100.0%) |
| Security & Protection | 2 (100.0%) | 0 (0.0%) |
| Firefighting & Prevention | 2 (100.0%) | 0 (0.0%) |
| Law Enforcement | 0 (0.0%) | 0 (0.0%) |
| Food Preparation & Serving | 0 (0.0%) | 3 (100.0%) |
| Cleaning & Maintenance | 3 (100.0%) | 0 (0.0%) |
| Personal Care & Service | 0 (0.0%) | 0 (0.0%) |
| Total (Category) | 5 (35.7%) | 9 (64.3%) |
| Total (Overall) | 34 (48.6%) | 36 (51.4%) |
Sales and Office Occupations
The most common Sales and Office occupations in Desert Center are Office & Administration (10 | 14.3%), and Sales & Related (7 | 10.0%).
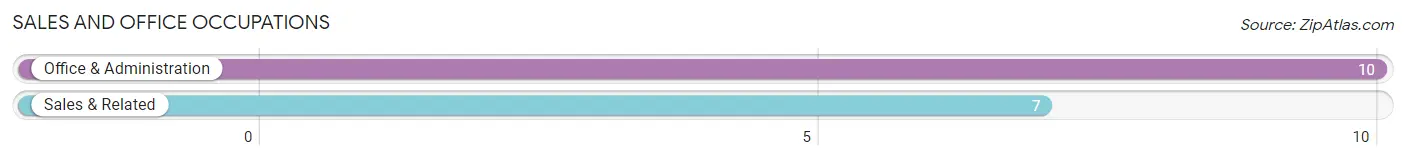
Sales and Office Occupations by Sex
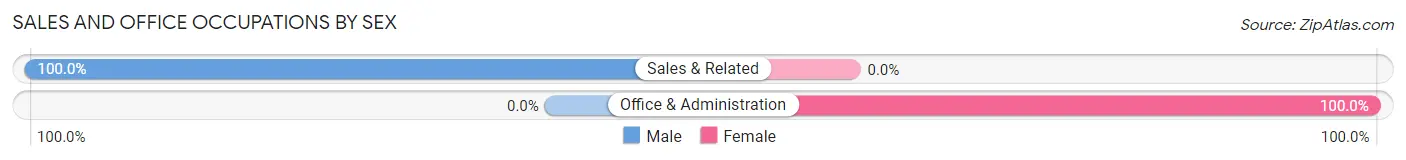
| Occupation | Male | Female |
| Sales & Related | 7 (100.0%) | 0 (0.0%) |
| Office & Administration | 0 (0.0%) | 10 (100.0%) |
| Total (Category) | 7 (41.2%) | 10 (58.8%) |
| Total (Overall) | 34 (48.6%) | 36 (51.4%) |
Natural Resources, Construction and Maintenance Occupations
The most common Natural Resources, Construction and Maintenance occupations in Desert Center are Construction & Extraction (6 | 8.6%), and Farming, Fishing & Forestry (3 | 4.3%).
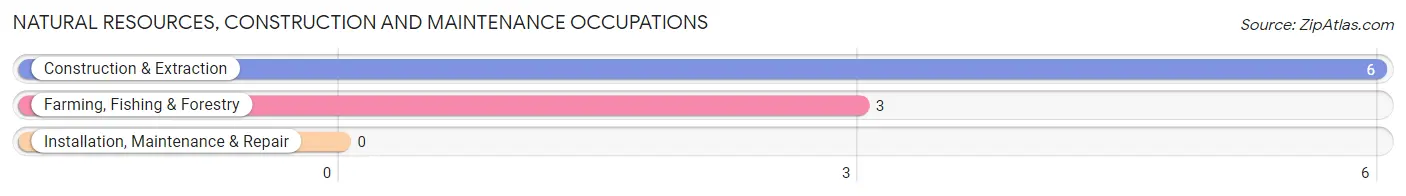
Natural Resources, Construction and Maintenance Occupations by Sex
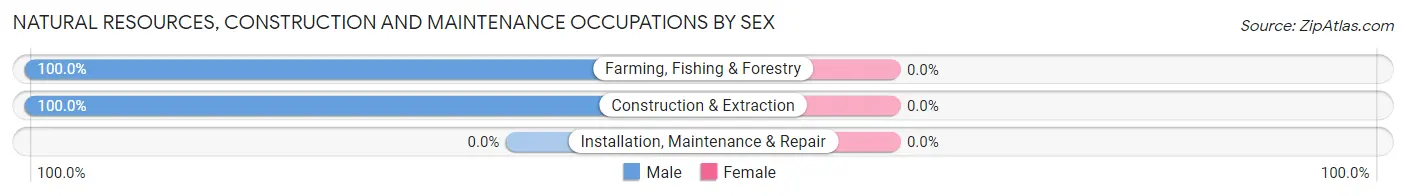
| Occupation | Male | Female |
| Farming, Fishing & Forestry | 3 (100.0%) | 0 (0.0%) |
| Construction & Extraction | 6 (100.0%) | 0 (0.0%) |
| Installation, Maintenance & Repair | 0 (0.0%) | 0 (0.0%) |
| Total (Category) | 9 (100.0%) | 0 (0.0%) |
| Total (Overall) | 34 (48.6%) | 36 (51.4%) |
Production, Transportation and Moving Occupations
The most common Production, Transportation and Moving occupations in Desert Center are Production (5 | 7.1%), and Material Moving (5 | 7.1%).
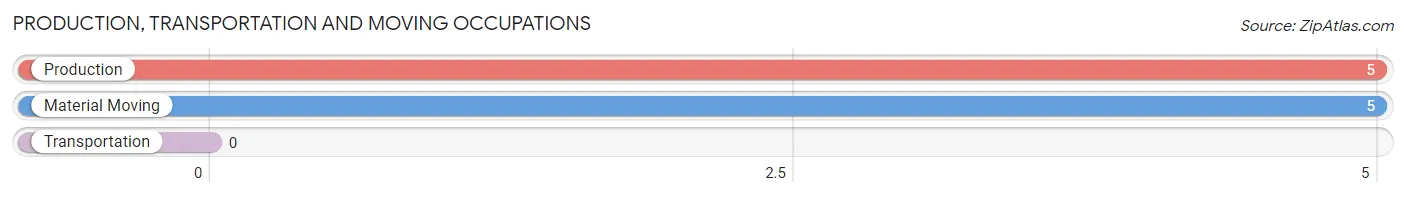
Production, Transportation and Moving Occupations by Sex
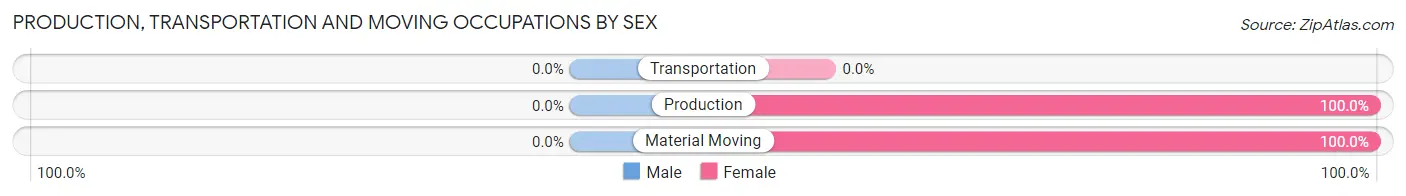
| Occupation | Male | Female |
| Production | 0 (0.0%) | 5 (100.0%) |
| Transportation | 0 (0.0%) | 0 (0.0%) |
| Material Moving | 0 (0.0%) | 5 (100.0%) |
| Total (Category) | 0 (0.0%) | 10 (100.0%) |
| Total (Overall) | 34 (48.6%) | 36 (51.4%) |
Employment Industries by Sex in Desert Center
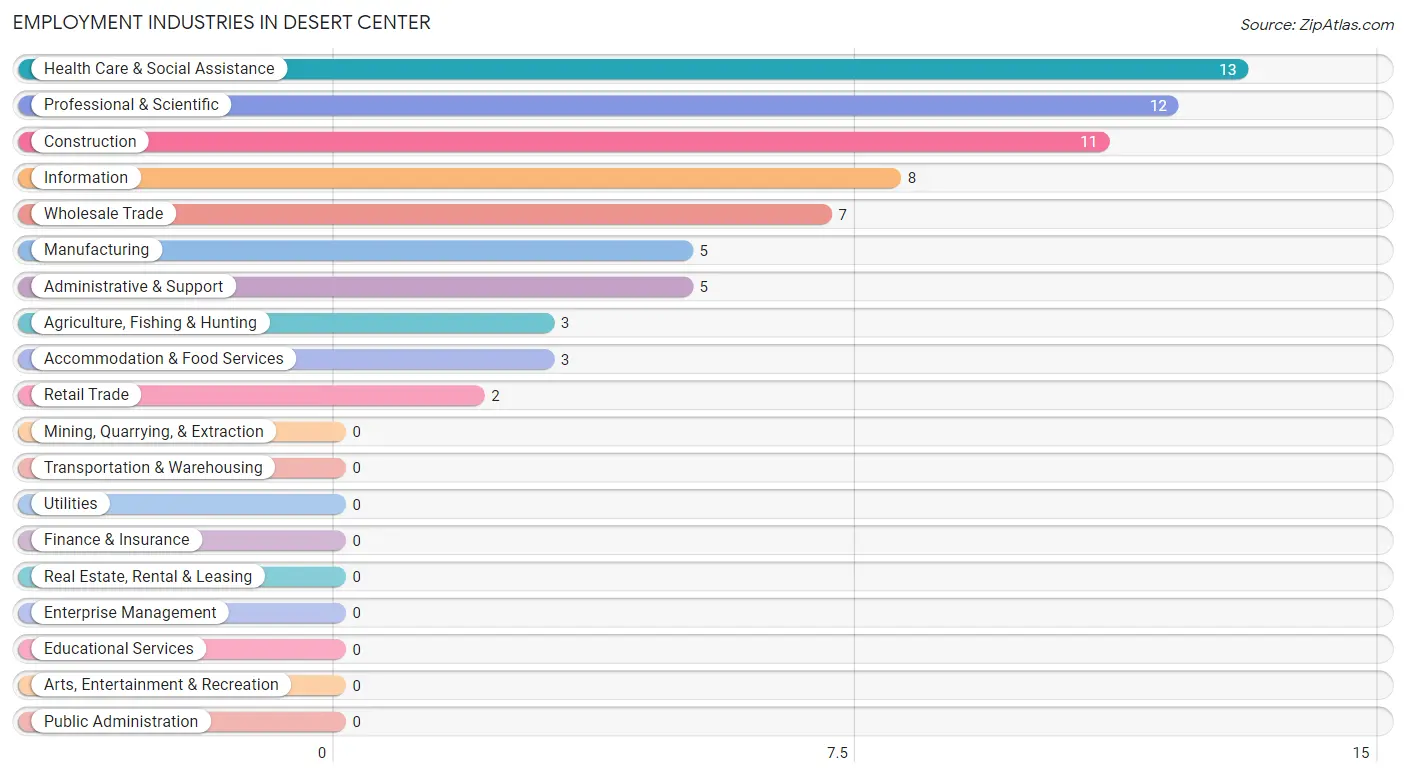
Employment Industries in Desert Center
The major employment industries in Desert Center include Health Care & Social Assistance (13 | 18.6%), Professional & Scientific (12 | 17.1%), Construction (11 | 15.7%), Information (8 | 11.4%), and Wholesale Trade (7 | 10.0%).
Employment Industries by Sex in Desert Center
The Desert Center industries that see more men than women are Agriculture, Fishing & Hunting (100.0%), Wholesale Trade (100.0%), and Administrative & Support (100.0%), whereas the industries that tend to have a higher number of women are Manufacturing (100.0%), Retail Trade (100.0%), and Information (100.0%).
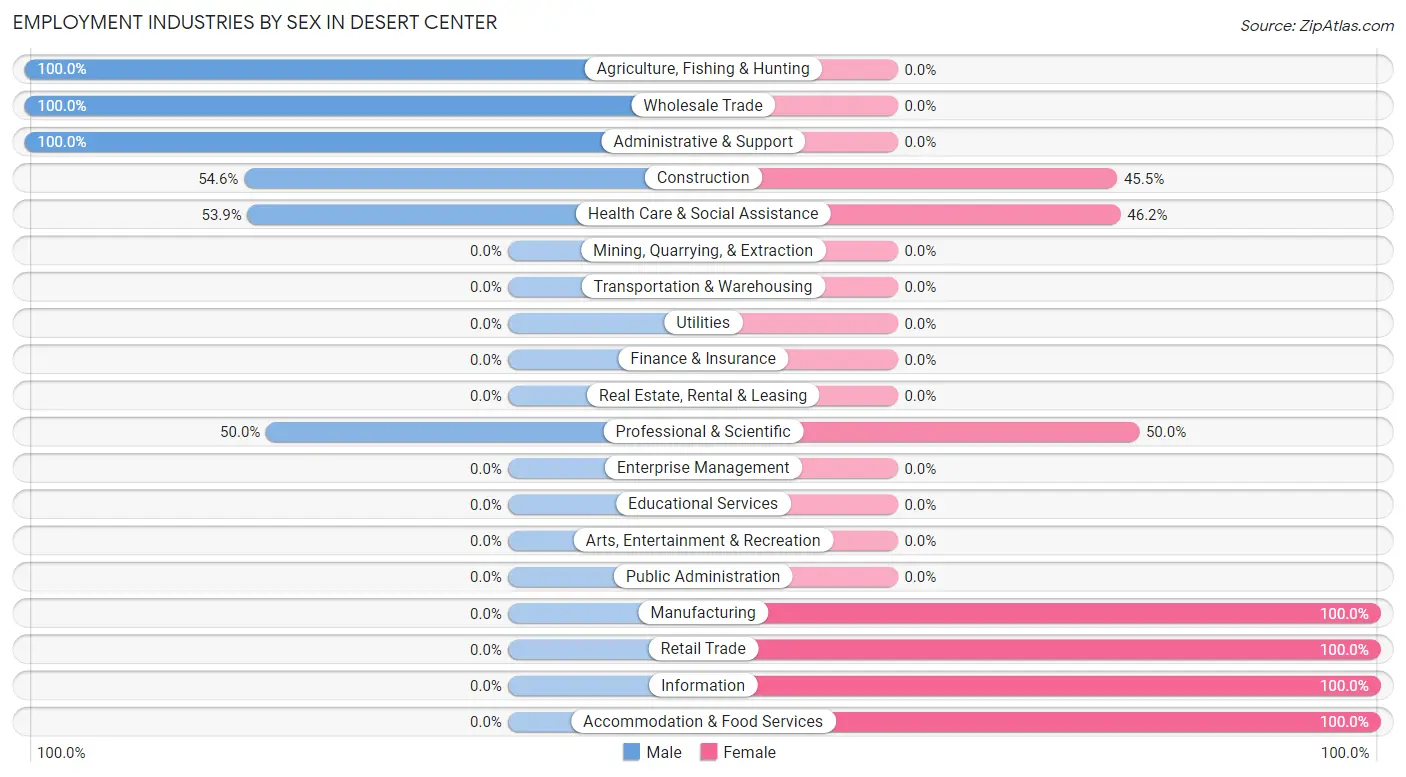
| Industry | Male | Female |
| Agriculture, Fishing & Hunting | 3 (100.0%) | 0 (0.0%) |
| Mining, Quarrying, & Extraction | 0 (0.0%) | 0 (0.0%) |
| Construction | 6 (54.5%) | 5 (45.5%) |
| Manufacturing | 0 (0.0%) | 5 (100.0%) |
| Wholesale Trade | 7 (100.0%) | 0 (0.0%) |
| Retail Trade | 0 (0.0%) | 2 (100.0%) |
| Transportation & Warehousing | 0 (0.0%) | 0 (0.0%) |
| Utilities | 0 (0.0%) | 0 (0.0%) |
| Information | 0 (0.0%) | 8 (100.0%) |
| Finance & Insurance | 0 (0.0%) | 0 (0.0%) |
| Real Estate, Rental & Leasing | 0 (0.0%) | 0 (0.0%) |
| Professional & Scientific | 6 (50.0%) | 6 (50.0%) |
| Enterprise Management | 0 (0.0%) | 0 (0.0%) |
| Administrative & Support | 5 (100.0%) | 0 (0.0%) |
| Educational Services | 0 (0.0%) | 0 (0.0%) |
| Health Care & Social Assistance | 7 (53.8%) | 6 (46.2%) |
| Arts, Entertainment & Recreation | 0 (0.0%) | 0 (0.0%) |
| Accommodation & Food Services | 0 (0.0%) | 3 (100.0%) |
| Public Administration | 0 (0.0%) | 0 (0.0%) |
| Total | 34 (48.6%) | 36 (51.4%) |
Education in Desert Center
School Enrollment in Desert Center
The most common levels of schooling among the 13 students in Desert Center are college / undergraduate (6 | 46.2%), elementary school (5 | 38.5%), and high school (2 | 15.4%).
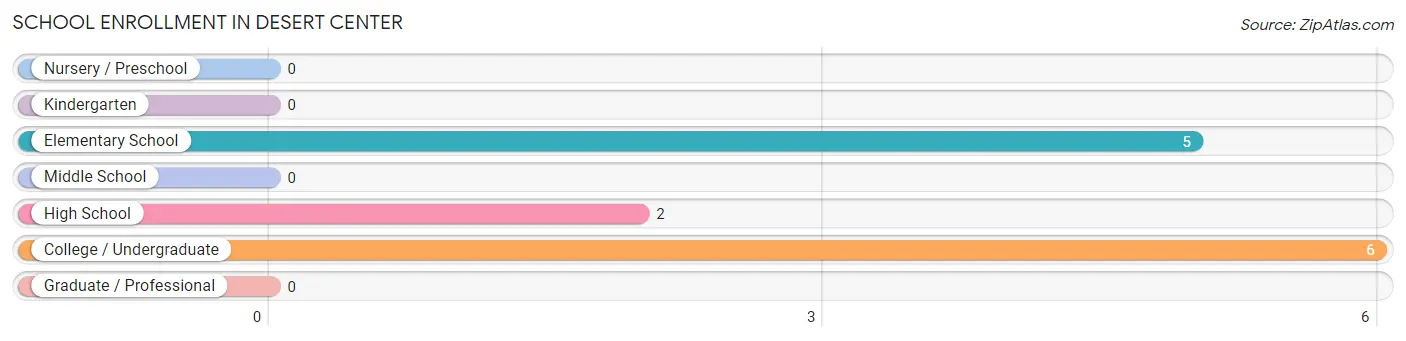
| School Level | # Students | % Students |
| Nursery / Preschool | 0 | 0.0% |
| Kindergarten | 0 | 0.0% |
| Elementary School | 5 | 38.5% |
| Middle School | 0 | 0.0% |
| High School | 2 | 15.4% |
| College / Undergraduate | 6 | 46.2% |
| Graduate / Professional | 0 | 0.0% |
| Total | 13 | 100.0% |
School Enrollment by Age by Funding Source in Desert Center
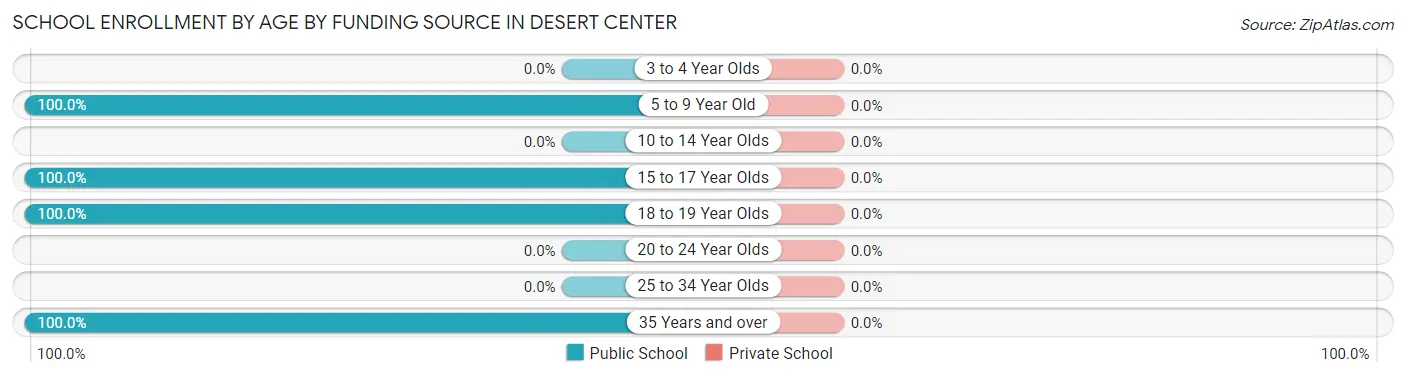
| Age Bracket | Public School | Private School |
| 3 to 4 Year Olds | 0 (0.0%) | 0 (0.0%) |
| 5 to 9 Year Old | 5 (100.0%) | 0 (0.0%) |
| 10 to 14 Year Olds | 0 (0.0%) | 0 (0.0%) |
| 15 to 17 Year Olds | 2 (100.0%) | 0 (0.0%) |
| 18 to 19 Year Olds | 1 (100.0%) | 0 (0.0%) |
| 20 to 24 Year Olds | 0 (0.0%) | 0 (0.0%) |
| 25 to 34 Year Olds | 0 (0.0%) | 0 (0.0%) |
| 35 Years and over | 5 (100.0%) | 0 (0.0%) |
| Total | 13 (100.0%) | 0 (0.0%) |
Educational Attainment by Field of Study in Desert Center
Liberal arts & history (13 | 26.0%), education (12 | 24.0%), physical & health sciences (8 | 16.0%), engineering (6 | 12.0%), and science & technology (6 | 12.0%) are the most common fields of study among 50 individuals in Desert Center who have obtained a bachelor's degree or higher.
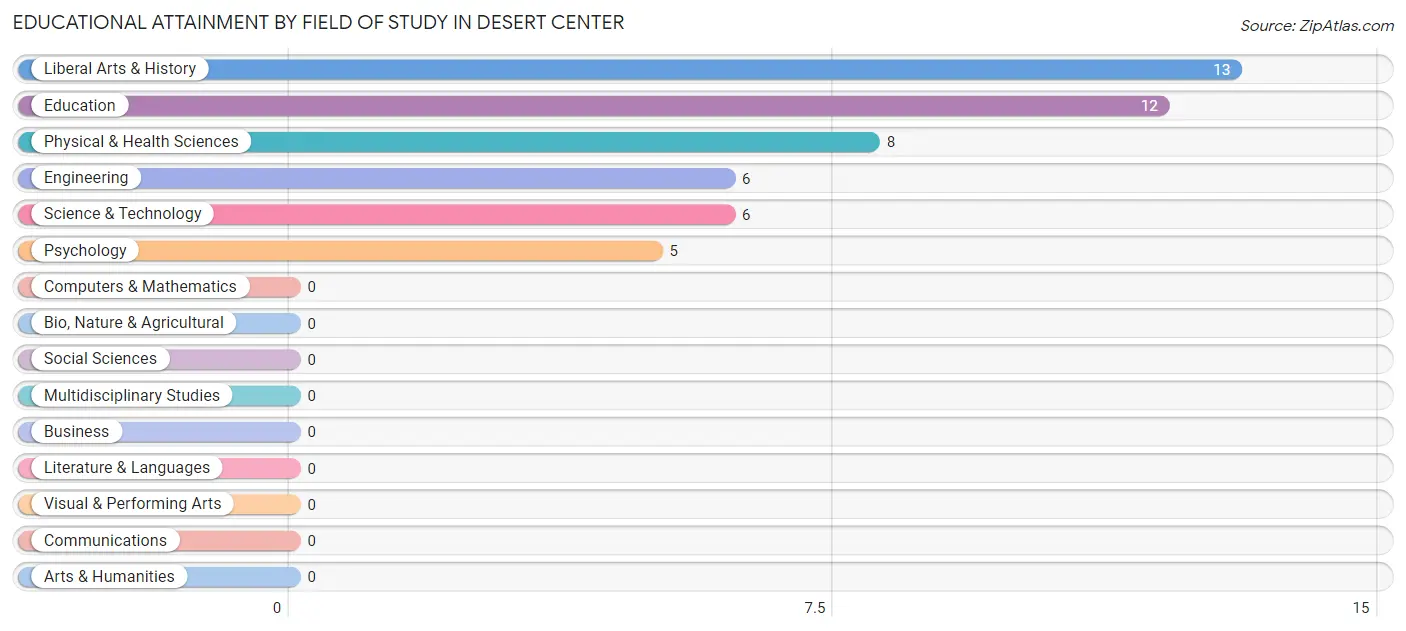
| Field of Study | # Graduates | % Graduates |
| Computers & Mathematics | 0 | 0.0% |
| Bio, Nature & Agricultural | 0 | 0.0% |
| Physical & Health Sciences | 8 | 16.0% |
| Psychology | 5 | 10.0% |
| Social Sciences | 0 | 0.0% |
| Engineering | 6 | 12.0% |
| Multidisciplinary Studies | 0 | 0.0% |
| Science & Technology | 6 | 12.0% |
| Business | 0 | 0.0% |
| Education | 12 | 24.0% |
| Literature & Languages | 0 | 0.0% |
| Liberal Arts & History | 13 | 26.0% |
| Visual & Performing Arts | 0 | 0.0% |
| Communications | 0 | 0.0% |
| Arts & Humanities | 0 | 0.0% |
| Total | 50 | 100.0% |
Transportation & Commute in Desert Center
Vehicle Availability by Sex in Desert Center
The most prevalent vehicle ownership categories in Desert Center are males with 3 vehicles (26, accounting for 76.5%) and females with 3 vehicles (8, making up 76.5%).
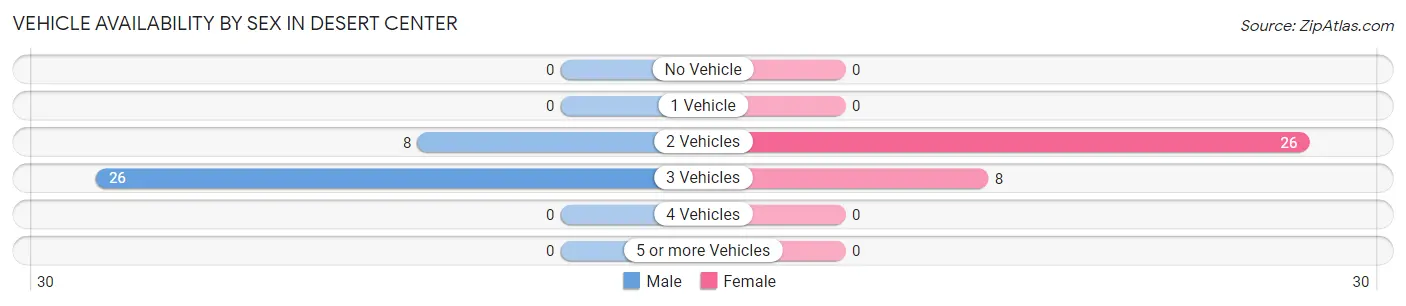
| Vehicles Available | Male | Female |
| No Vehicle | 0 (0.0%) | 0 (0.0%) |
| 1 Vehicle | 0 (0.0%) | 0 (0.0%) |
| 2 Vehicles | 8 (23.5%) | 26 (76.5%) |
| 3 Vehicles | 26 (76.5%) | 8 (23.5%) |
| 4 Vehicles | 0 (0.0%) | 0 (0.0%) |
| 5 or more Vehicles | 0 (0.0%) | 0 (0.0%) |
| Total | 34 (100.0%) | 34 (100.0%) |
Commute Time in Desert Center
The most frequently occuring commute durations in Desert Center are 15 to 19 minutes (20 commuters, 33.3%), 5 to 9 minutes (19 commuters, 31.7%), and 10 to 14 minutes (14 commuters, 23.3%).
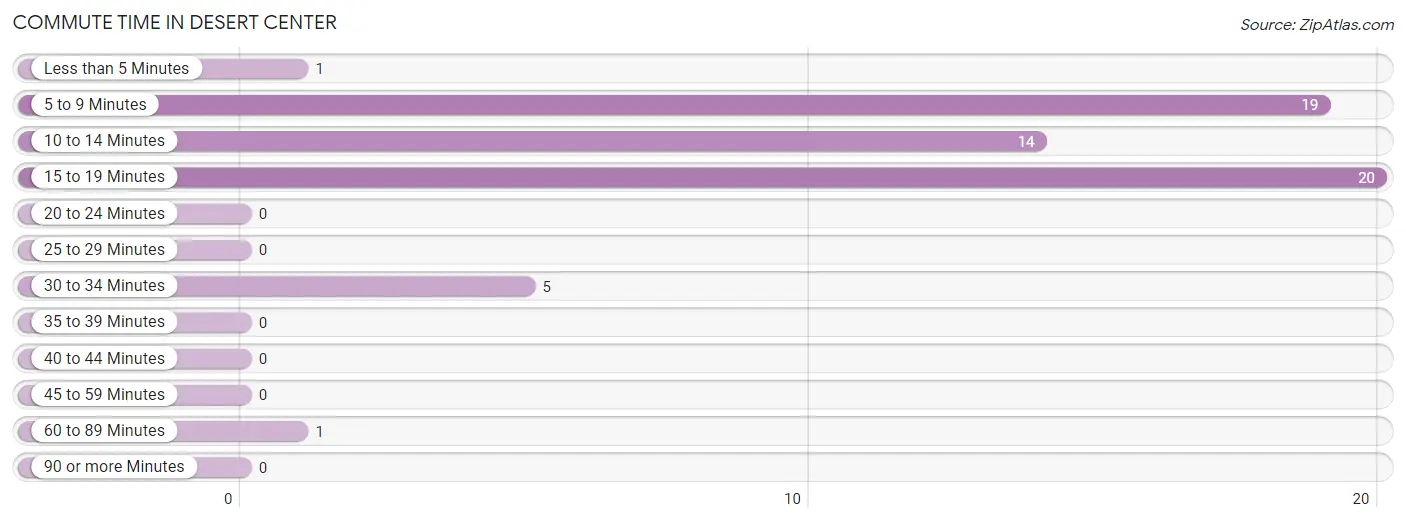
| Commute Time | # Commuters | % Commuters |
| Less than 5 Minutes | 1 | 1.7% |
| 5 to 9 Minutes | 19 | 31.7% |
| 10 to 14 Minutes | 14 | 23.3% |
| 15 to 19 Minutes | 20 | 33.3% |
| 20 to 24 Minutes | 0 | 0.0% |
| 25 to 29 Minutes | 0 | 0.0% |
| 30 to 34 Minutes | 5 | 8.3% |
| 35 to 39 Minutes | 0 | 0.0% |
| 40 to 44 Minutes | 0 | 0.0% |
| 45 to 59 Minutes | 0 | 0.0% |
| 60 to 89 Minutes | 1 | 1.7% |
| 90 or more Minutes | 0 | 0.0% |
Commute Time by Sex in Desert Center
The most common commute times in Desert Center are 15 to 19 minutes (20 commuters, 62.5%) for males and 5 to 9 minutes (19 commuters, 67.9%) for females.
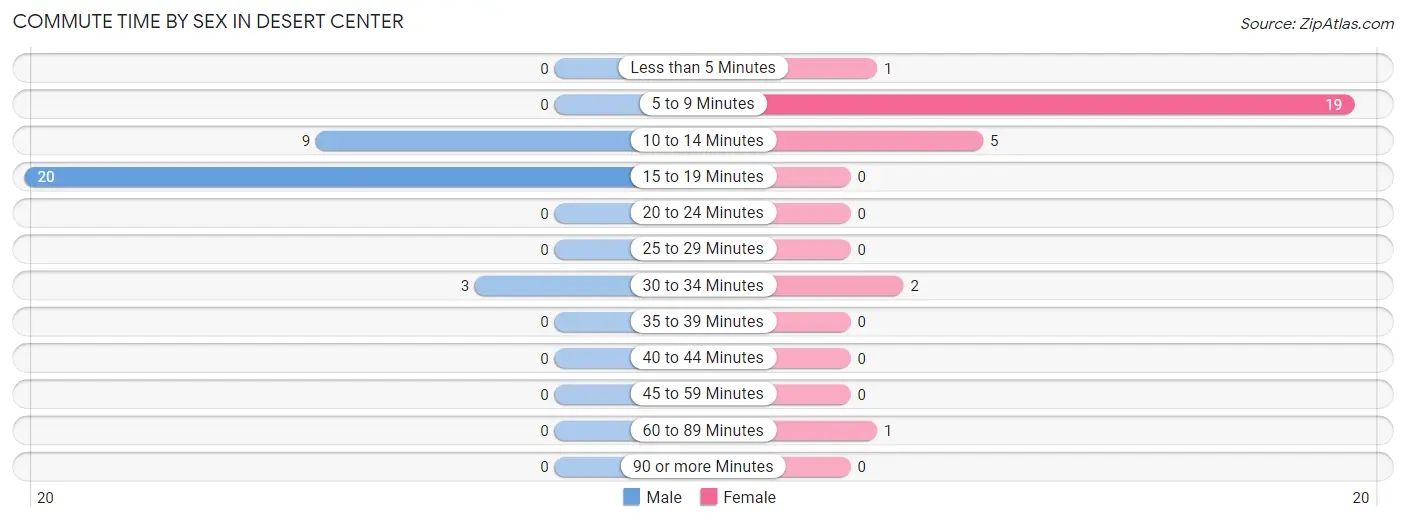
| Commute Time | Male | Female |
| Less than 5 Minutes | 0 (0.0%) | 1 (3.6%) |
| 5 to 9 Minutes | 0 (0.0%) | 19 (67.9%) |
| 10 to 14 Minutes | 9 (28.1%) | 5 (17.9%) |
| 15 to 19 Minutes | 20 (62.5%) | 0 (0.0%) |
| 20 to 24 Minutes | 0 (0.0%) | 0 (0.0%) |
| 25 to 29 Minutes | 0 (0.0%) | 0 (0.0%) |
| 30 to 34 Minutes | 3 (9.4%) | 2 (7.1%) |
| 35 to 39 Minutes | 0 (0.0%) | 0 (0.0%) |
| 40 to 44 Minutes | 0 (0.0%) | 0 (0.0%) |
| 45 to 59 Minutes | 0 (0.0%) | 0 (0.0%) |
| 60 to 89 Minutes | 0 (0.0%) | 1 (3.6%) |
| 90 or more Minutes | 0 (0.0%) | 0 (0.0%) |
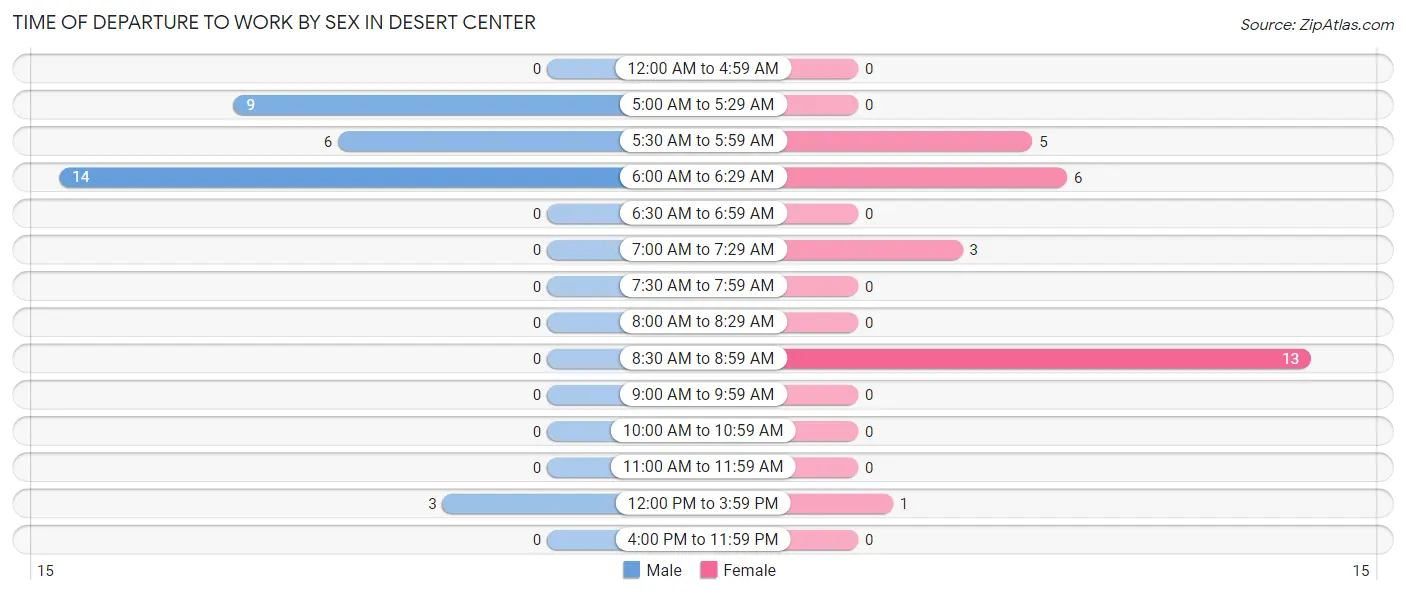
Time of Departure to Work by Sex in Desert Center
The most frequent times of departure to work in Desert Center are 6:00 AM to 6:29 AM (14, 43.8%) for males and 8:30 AM to 8:59 AM (13, 46.4%) for females.
| Time of Departure | Male | Female |
| 12:00 AM to 4:59 AM | 0 (0.0%) | 0 (0.0%) |
| 5:00 AM to 5:29 AM | 9 (28.1%) | 0 (0.0%) |
| 5:30 AM to 5:59 AM | 6 (18.8%) | 5 (17.9%) |
| 6:00 AM to 6:29 AM | 14 (43.8%) | 6 (21.4%) |
| 6:30 AM to 6:59 AM | 0 (0.0%) | 0 (0.0%) |
| 7:00 AM to 7:29 AM | 0 (0.0%) | 3 (10.7%) |
| 7:30 AM to 7:59 AM | 0 (0.0%) | 0 (0.0%) |
| 8:00 AM to 8:29 AM | 0 (0.0%) | 0 (0.0%) |
| 8:30 AM to 8:59 AM | 0 (0.0%) | 13 (46.4%) |
| 9:00 AM to 9:59 AM | 0 (0.0%) | 0 (0.0%) |
| 10:00 AM to 10:59 AM | 0 (0.0%) | 0 (0.0%) |
| 11:00 AM to 11:59 AM | 0 (0.0%) | 0 (0.0%) |
| 12:00 PM to 3:59 PM | 3 (9.4%) | 1 (3.6%) |
| 4:00 PM to 11:59 PM | 0 (0.0%) | 0 (0.0%) |
| Total | 32 (100.0%) | 28 (100.0%) |
Housing Occupancy in Desert Center
Occupancy by Ownership in Desert Center
Of the total 68 dwellings in Desert Center, owner-occupied units account for 43 (63.2%), while renter-occupied units make up 25 (36.8%).
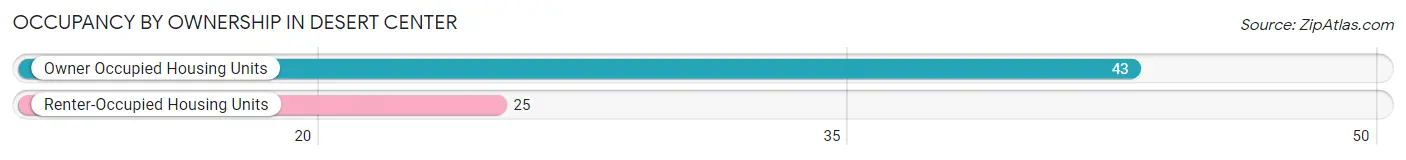
| Occupancy | # Housing Units | % Housing Units |
| Owner Occupied Housing Units | 43 | 63.2% |
| Renter-Occupied Housing Units | 25 | 36.8% |
| Total Occupied Housing Units | 68 | 100.0% |
Occupancy by Household Size in Desert Center
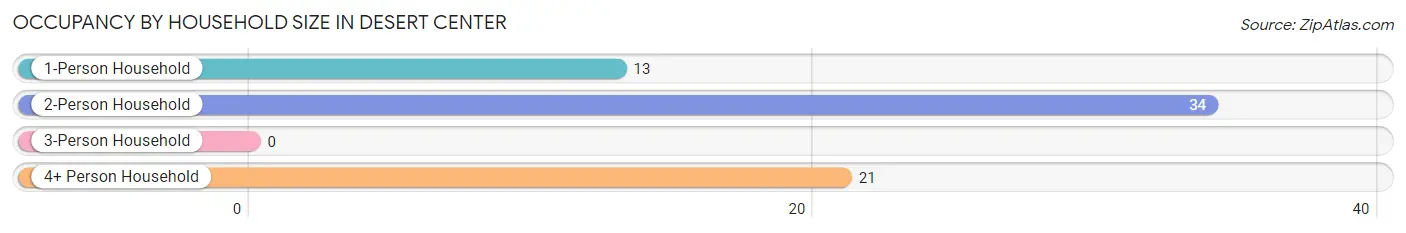
| Household Size | # Housing Units | % Housing Units |
| 1-Person Household | 13 | 19.1% |
| 2-Person Household | 34 | 50.0% |
| 3-Person Household | 0 | 0.0% |
| 4+ Person Household | 21 | 30.9% |
| Total Housing Units | 68 | 100.0% |
Occupancy by Ownership by Household Size in Desert Center
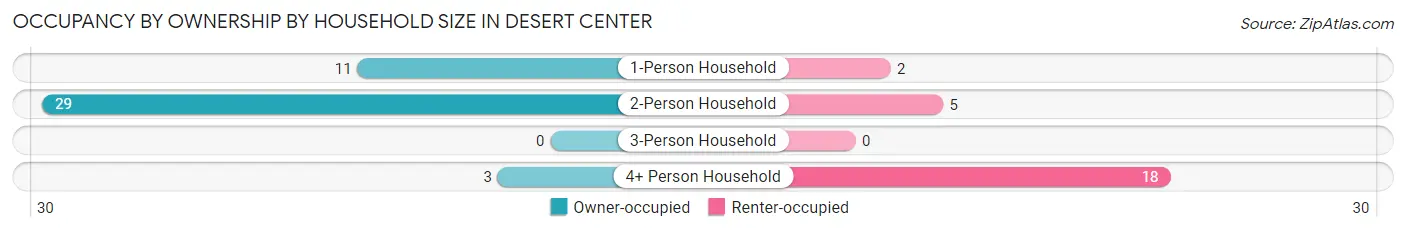
| Household Size | Owner-occupied | Renter-occupied |
| 1-Person Household | 11 (84.6%) | 2 (15.4%) |
| 2-Person Household | 29 (85.3%) | 5 (14.7%) |
| 3-Person Household | 0 (0.0%) | 0 (0.0%) |
| 4+ Person Household | 3 (14.3%) | 18 (85.7%) |
| Total Housing Units | 43 (63.2%) | 25 (36.8%) |
Occupancy by Educational Attainment in Desert Center
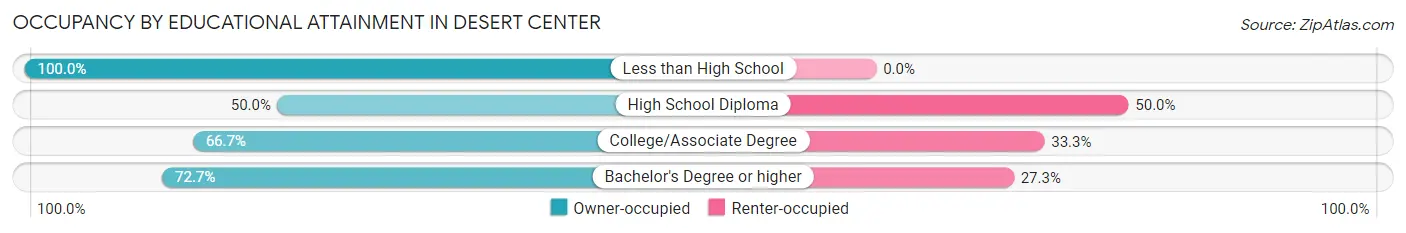
| Household Size | Owner-occupied | Renter-occupied |
| Less than High School | 3 (100.0%) | 0 (0.0%) |
| High School Diploma | 14 (50.0%) | 14 (50.0%) |
| College/Associate Degree | 10 (66.7%) | 5 (33.3%) |
| Bachelor's Degree or higher | 16 (72.7%) | 6 (27.3%) |
Occupancy by Age of Householder in Desert Center
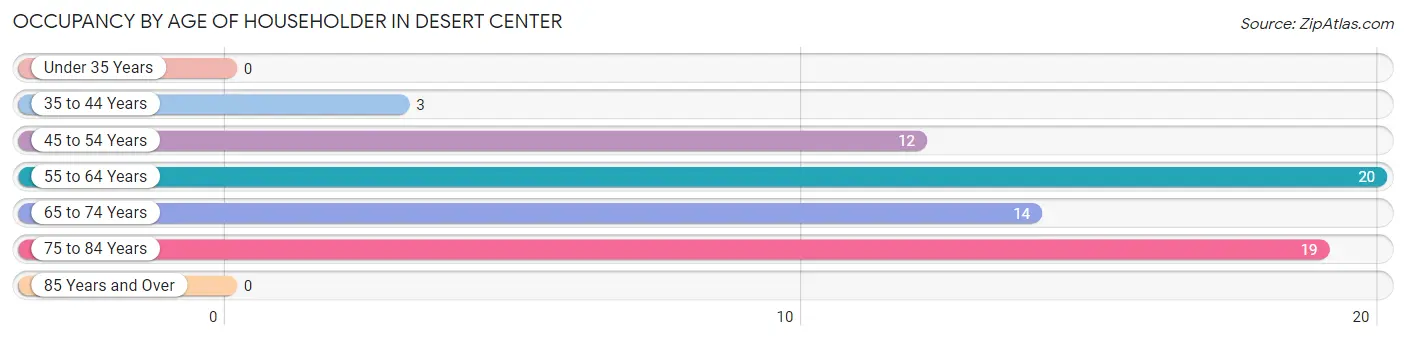
| Age Bracket | # Households | % Households |
| Under 35 Years | 0 | 0.0% |
| 35 to 44 Years | 3 | 4.4% |
| 45 to 54 Years | 12 | 17.6% |
| 55 to 64 Years | 20 | 29.4% |
| 65 to 74 Years | 14 | 20.6% |
| 75 to 84 Years | 19 | 27.9% |
| 85 Years and Over | 0 | 0.0% |
| Total | 68 | 100.0% |
Housing Finances in Desert Center
Median Income by Occupancy in Desert Center
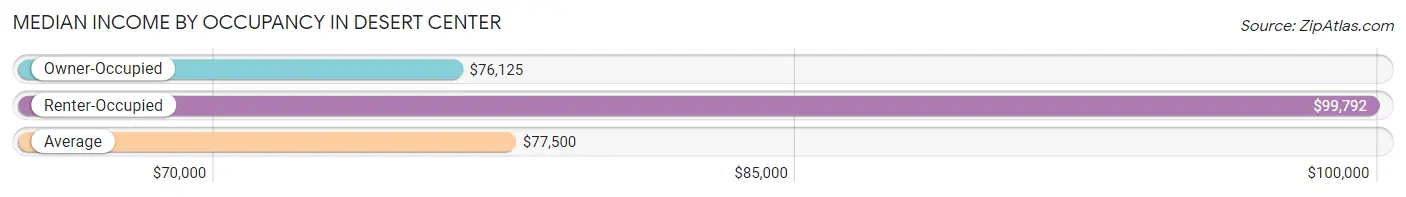
| Occupancy Type | # Households | Median Income |
| Owner-Occupied | 43 (63.2%) | $76,125 |
| Renter-Occupied | 25 (36.8%) | $99,792 |
| Average | 68 (100.0%) | $77,500 |
Occupancy by Householder Income Bracket in Desert Center
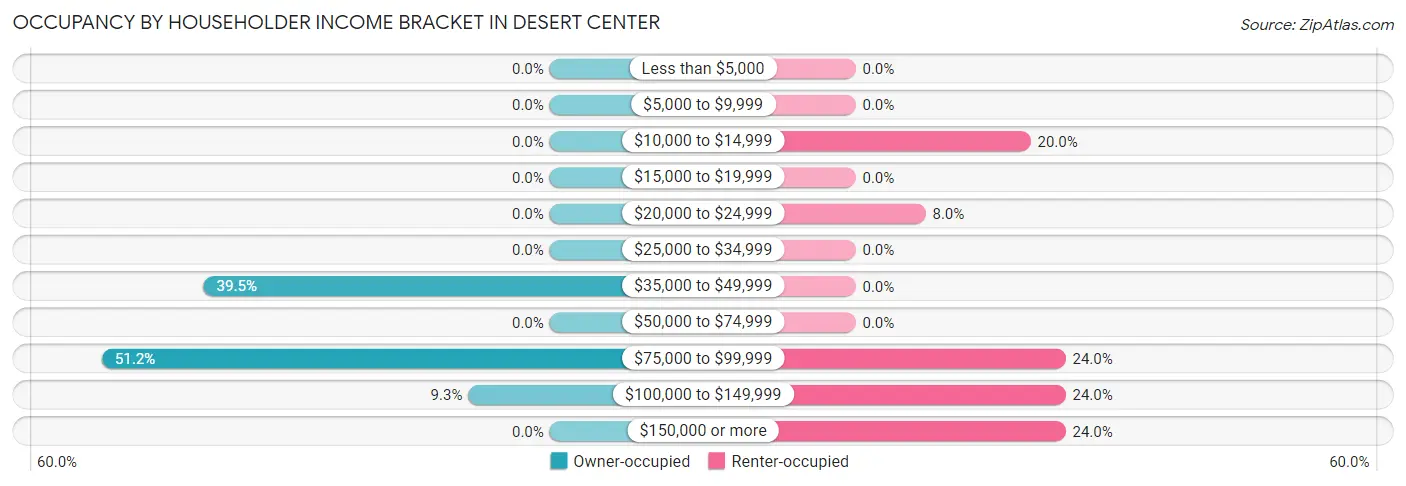
| Income Bracket | Owner-occupied | Renter-occupied |
| Less than $5,000 | 0 (0.0%) | 0 (0.0%) |
| $5,000 to $9,999 | 0 (0.0%) | 0 (0.0%) |
| $10,000 to $14,999 | 0 (0.0%) | 5 (20.0%) |
| $15,000 to $19,999 | 0 (0.0%) | 0 (0.0%) |
| $20,000 to $24,999 | 0 (0.0%) | 2 (8.0%) |
| $25,000 to $34,999 | 0 (0.0%) | 0 (0.0%) |
| $35,000 to $49,999 | 17 (39.5%) | 0 (0.0%) |
| $50,000 to $74,999 | 0 (0.0%) | 0 (0.0%) |
| $75,000 to $99,999 | 22 (51.2%) | 6 (24.0%) |
| $100,000 to $149,999 | 4 (9.3%) | 6 (24.0%) |
| $150,000 or more | 0 (0.0%) | 6 (24.0%) |
| Total | 43 (100.0%) | 25 (100.0%) |
Monthly Housing Cost Tiers in Desert Center
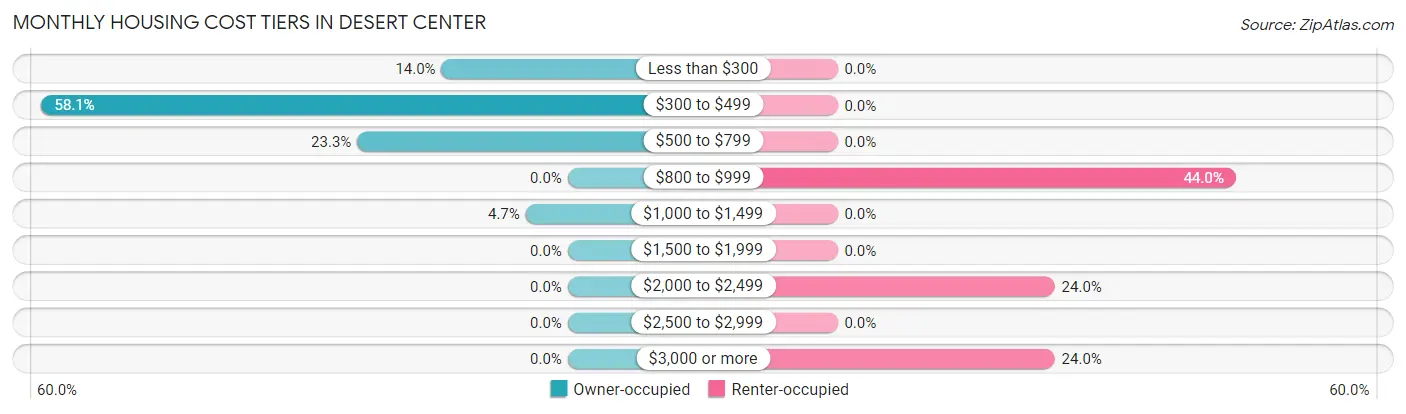
| Monthly Cost | Owner-occupied | Renter-occupied |
| Less than $300 | 6 (14.0%) | 0 (0.0%) |
| $300 to $499 | 25 (58.1%) | 0 (0.0%) |
| $500 to $799 | 10 (23.3%) | 0 (0.0%) |
| $800 to $999 | 0 (0.0%) | 11 (44.0%) |
| $1,000 to $1,499 | 2 (4.6%) | 0 (0.0%) |
| $1,500 to $1,999 | 0 (0.0%) | 0 (0.0%) |
| $2,000 to $2,499 | 0 (0.0%) | 6 (24.0%) |
| $2,500 to $2,999 | 0 (0.0%) | 0 (0.0%) |
| $3,000 or more | 0 (0.0%) | 6 (24.0%) |
| Total | 43 (100.0%) | 25 (100.0%) |
Physical Housing Characteristics in Desert Center
Housing Structures in Desert Center
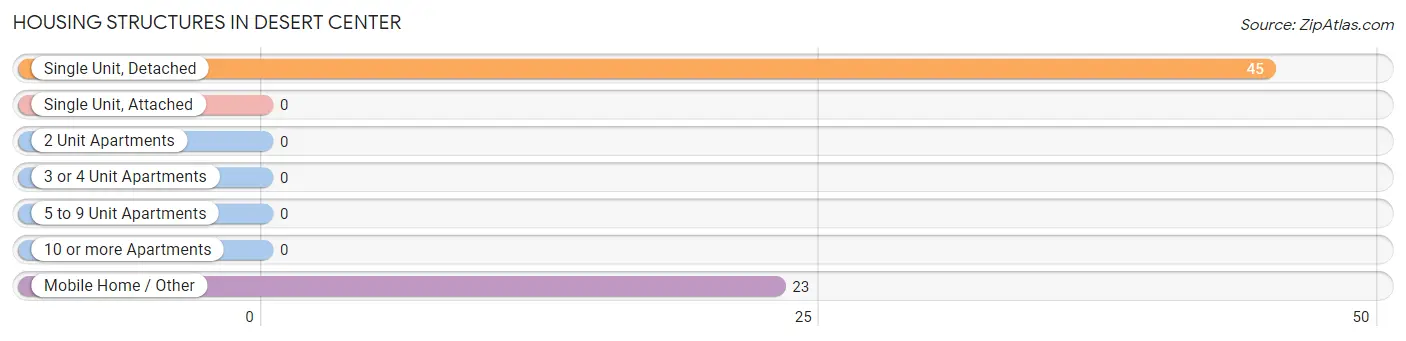
| Structure Type | # Housing Units | % Housing Units |
| Single Unit, Detached | 45 | 66.2% |
| Single Unit, Attached | 0 | 0.0% |
| 2 Unit Apartments | 0 | 0.0% |
| 3 or 4 Unit Apartments | 0 | 0.0% |
| 5 to 9 Unit Apartments | 0 | 0.0% |
| 10 or more Apartments | 0 | 0.0% |
| Mobile Home / Other | 23 | 33.8% |
| Total | 68 | 100.0% |
Housing Structures by Occupancy in Desert Center
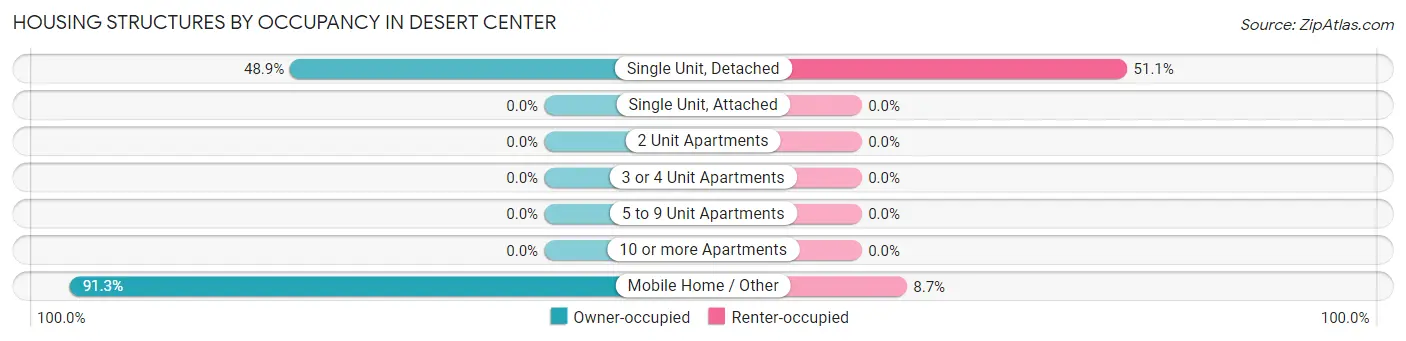
| Structure Type | Owner-occupied | Renter-occupied |
| Single Unit, Detached | 22 (48.9%) | 23 (51.1%) |
| Single Unit, Attached | 0 (0.0%) | 0 (0.0%) |
| 2 Unit Apartments | 0 (0.0%) | 0 (0.0%) |
| 3 or 4 Unit Apartments | 0 (0.0%) | 0 (0.0%) |
| 5 to 9 Unit Apartments | 0 (0.0%) | 0 (0.0%) |
| 10 or more Apartments | 0 (0.0%) | 0 (0.0%) |
| Mobile Home / Other | 21 (91.3%) | 2 (8.7%) |
| Total | 43 (63.2%) | 25 (36.8%) |
Housing Structures by Number of Rooms in Desert Center
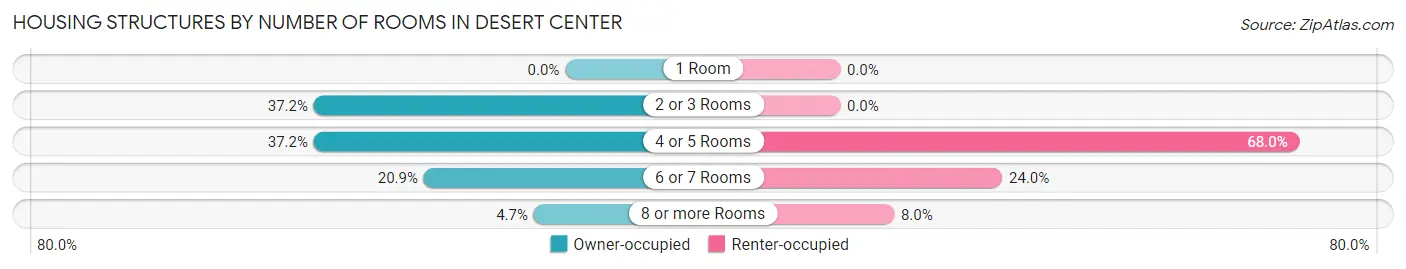
| Number of Rooms | Owner-occupied | Renter-occupied |
| 1 Room | 0 (0.0%) | 0 (0.0%) |
| 2 or 3 Rooms | 16 (37.2%) | 0 (0.0%) |
| 4 or 5 Rooms | 16 (37.2%) | 17 (68.0%) |
| 6 or 7 Rooms | 9 (20.9%) | 6 (24.0%) |
| 8 or more Rooms | 2 (4.6%) | 2 (8.0%) |
| Total | 43 (100.0%) | 25 (100.0%) |
Housing Structure by Heating Type in Desert Center
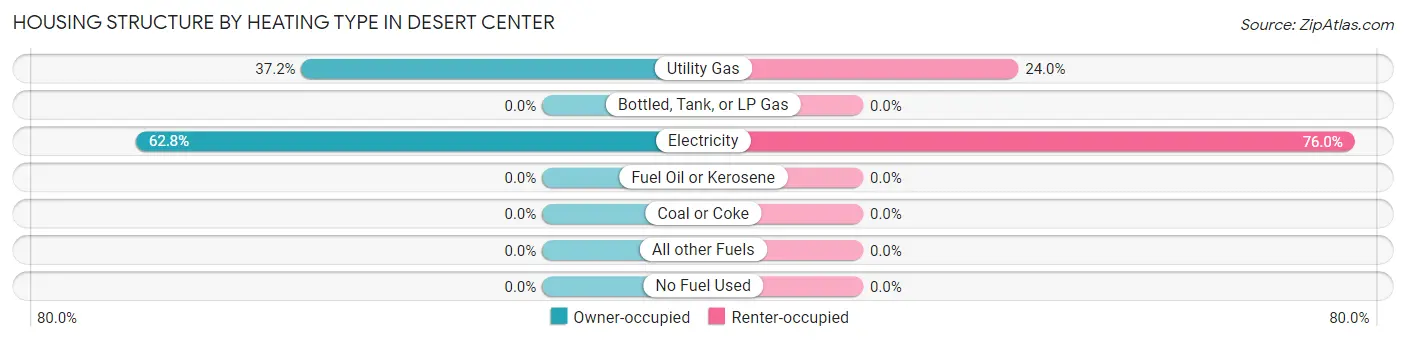
| Heating Type | Owner-occupied | Renter-occupied |
| Utility Gas | 16 (37.2%) | 6 (24.0%) |
| Bottled, Tank, or LP Gas | 0 (0.0%) | 0 (0.0%) |
| Electricity | 27 (62.8%) | 19 (76.0%) |
| Fuel Oil or Kerosene | 0 (0.0%) | 0 (0.0%) |
| Coal or Coke | 0 (0.0%) | 0 (0.0%) |
| All other Fuels | 0 (0.0%) | 0 (0.0%) |
| No Fuel Used | 0 (0.0%) | 0 (0.0%) |
| Total | 43 (100.0%) | 25 (100.0%) |
Household Vehicle Usage in Desert Center
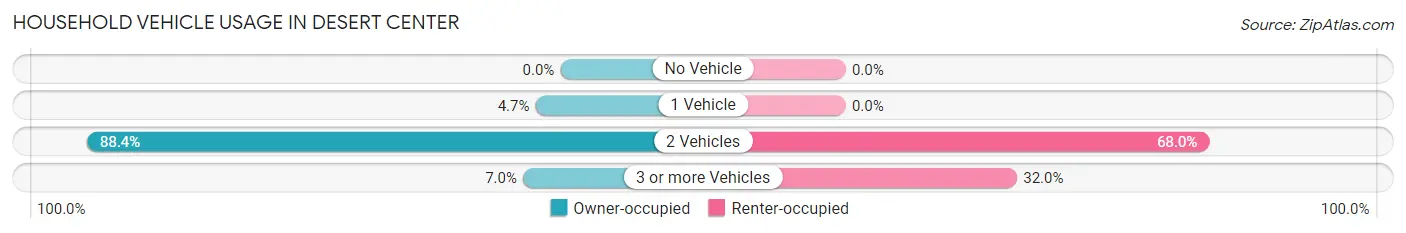
| Vehicles per Household | Owner-occupied | Renter-occupied |
| No Vehicle | 0 (0.0%) | 0 (0.0%) |
| 1 Vehicle | 2 (4.6%) | 0 (0.0%) |
| 2 Vehicles | 38 (88.4%) | 17 (68.0%) |
| 3 or more Vehicles | 3 (7.0%) | 8 (32.0%) |
| Total | 43 (100.0%) | 25 (100.0%) |
Real Estate & Mortgages in Desert Center
Real Estate and Mortgage Overview in Desert Center
| Characteristic | Without Mortgage | With Mortgage |
| Housing Units | 36 | 7 |
| Median Property Value | $159,400 | $0 |
| Median Household Income | $75,250 | $0 |
| Monthly Housing Costs | $448 | $0 |
| Real Estate Taxes | - | - |
Property Value by Mortgage Status in Desert Center
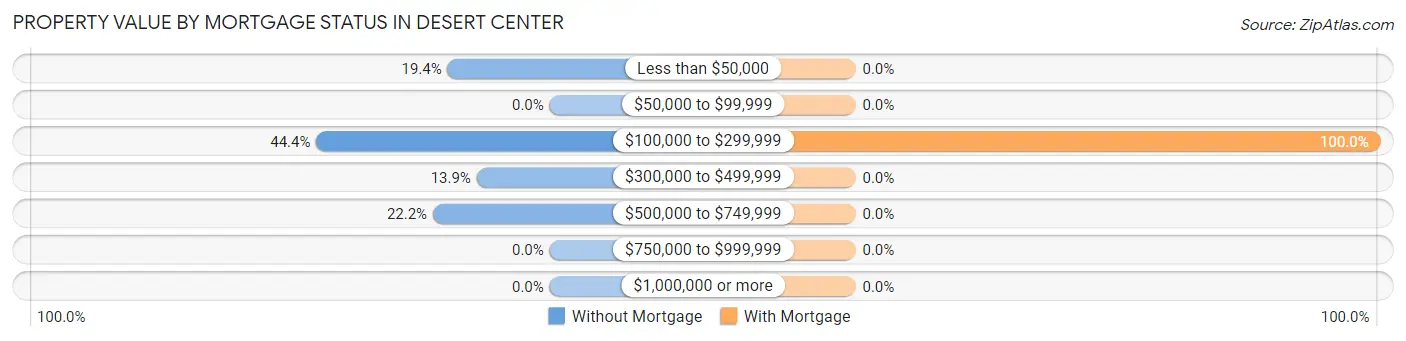
| Property Value | Without Mortgage | With Mortgage |
| Less than $50,000 | 7 (19.4%) | 0 (0.0%) |
| $50,000 to $99,999 | 0 (0.0%) | 0 (0.0%) |
| $100,000 to $299,999 | 16 (44.4%) | 7 (100.0%) |
| $300,000 to $499,999 | 5 (13.9%) | 0 (0.0%) |
| $500,000 to $749,999 | 8 (22.2%) | 0 (0.0%) |
| $750,000 to $999,999 | 0 (0.0%) | 0 (0.0%) |
| $1,000,000 or more | 0 (0.0%) | 0 (0.0%) |
| Total | 36 (100.0%) | 7 (100.0%) |
Household Income by Mortgage Status in Desert Center
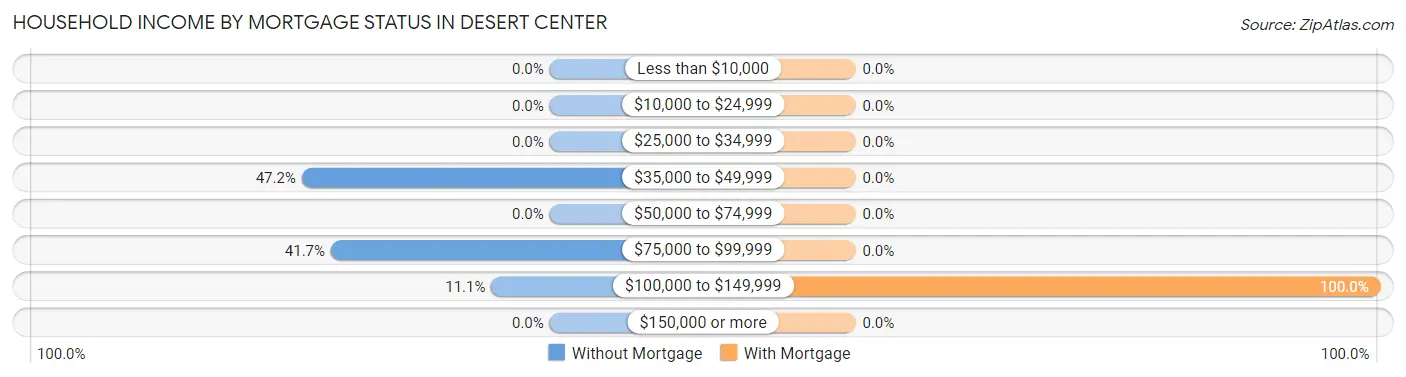
| Household Income | Without Mortgage | With Mortgage |
| Less than $10,000 | 0 (0.0%) | 0 (0.0%) |
| $10,000 to $24,999 | 0 (0.0%) | 0 (0.0%) |
| $25,000 to $34,999 | 0 (0.0%) | 0 (0.0%) |
| $35,000 to $49,999 | 17 (47.2%) | 0 (0.0%) |
| $50,000 to $74,999 | 0 (0.0%) | 0 (0.0%) |
| $75,000 to $99,999 | 15 (41.7%) | 0 (0.0%) |
| $100,000 to $149,999 | 4 (11.1%) | 7 (100.0%) |
| $150,000 or more | 0 (0.0%) | 0 (0.0%) |
| Total | 36 (100.0%) | 7 (100.0%) |
Property Value to Household Income Ratio in Desert Center
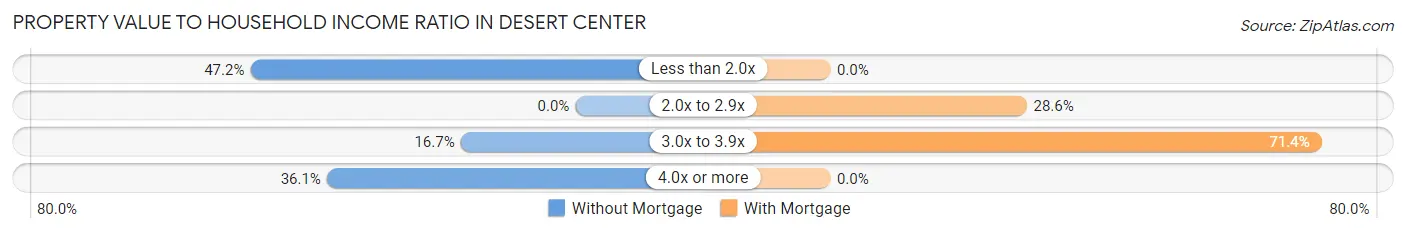
| Value-to-Income Ratio | Without Mortgage | With Mortgage |
| Less than 2.0x | 17 (47.2%) | 0 (0.0%) |
| 2.0x to 2.9x | 0 (0.0%) | 2 (28.6%) |
| 3.0x to 3.9x | 6 (16.7%) | 5 (71.4%) |
| 4.0x or more | 13 (36.1%) | 0 (0.0%) |
| Total | 36 (100.0%) | 7 (100.0%) |
Real Estate Taxes by Mortgage Status in Desert Center
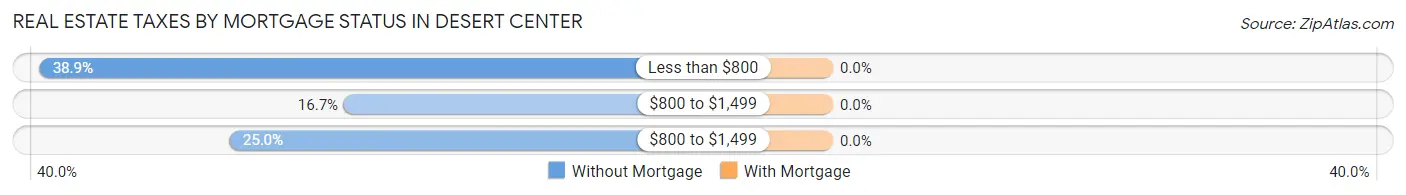
| Property Taxes | Without Mortgage | With Mortgage |
| Less than $800 | 14 (38.9%) | 0 (0.0%) |
| $800 to $1,499 | 6 (16.7%) | 0 (0.0%) |
| $800 to $1,499 | 9 (25.0%) | 0 (0.0%) |
| Total | 36 (100.0%) | 7 (100.0%) |
Health & Disability in Desert Center
Health Insurance Coverage by Age in Desert Center
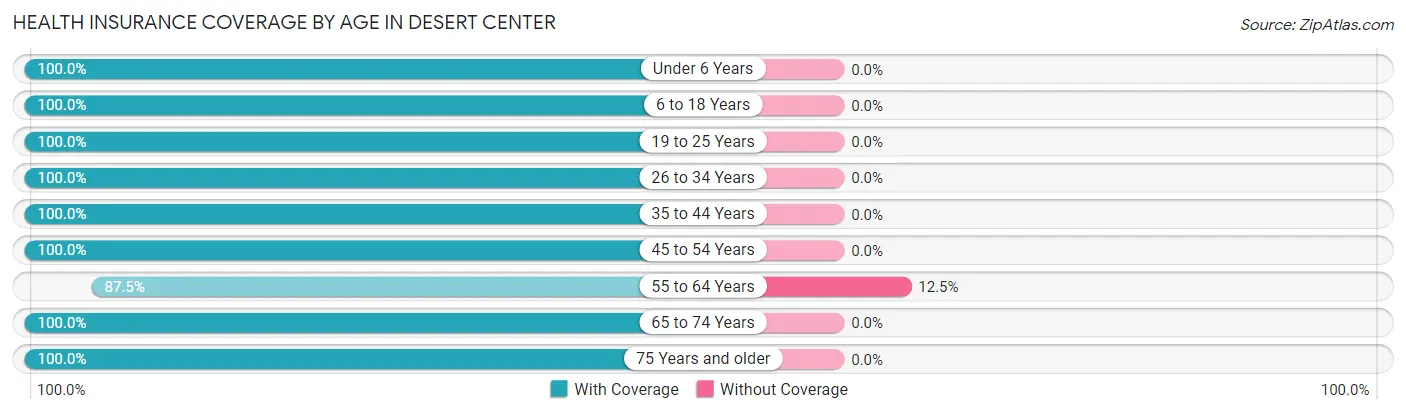
| Age Bracket | With Coverage | Without Coverage |
| Under 6 Years | 9 (100.0%) | 0 (0.0%) |
| 6 to 18 Years | 8 (100.0%) | 0 (0.0%) |
| 19 to 25 Years | 4 (100.0%) | 0 (0.0%) |
| 26 to 34 Years | 32 (100.0%) | 0 (0.0%) |
| 35 to 44 Years | 31 (100.0%) | 0 (0.0%) |
| 45 to 54 Years | 17 (100.0%) | 0 (0.0%) |
| 55 to 64 Years | 28 (87.5%) | 4 (12.5%) |
| 65 to 74 Years | 34 (100.0%) | 0 (0.0%) |
| 75 Years and older | 24 (100.0%) | 0 (0.0%) |
| Total | 187 (97.9%) | 4 (2.1%) |
Health Insurance Coverage by Citizenship Status in Desert Center
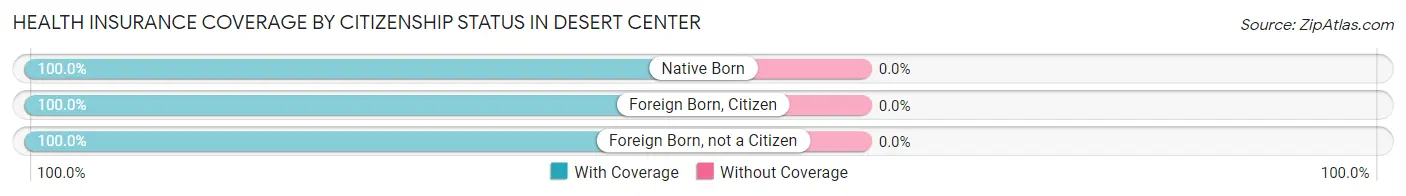
| Citizenship Status | With Coverage | Without Coverage |
| Native Born | 9 (100.0%) | 0 (0.0%) |
| Foreign Born, Citizen | 8 (100.0%) | 0 (0.0%) |
| Foreign Born, not a Citizen | 4 (100.0%) | 0 (0.0%) |
Health Insurance Coverage by Household Income in Desert Center
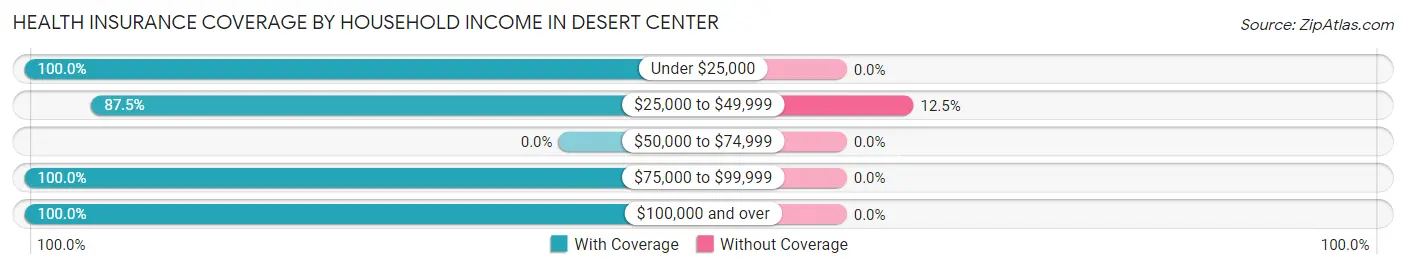
| Household Income | With Coverage | Without Coverage |
| Under $25,000 | 12 (100.0%) | 0 (0.0%) |
| $25,000 to $49,999 | 28 (87.5%) | 4 (12.5%) |
| $50,000 to $74,999 | 0 (0.0%) | 0 (0.0%) |
| $75,000 to $99,999 | 85 (100.0%) | 0 (0.0%) |
| $100,000 and over | 59 (100.0%) | 0 (0.0%) |
Public vs Private Health Insurance Coverage by Age in Desert Center
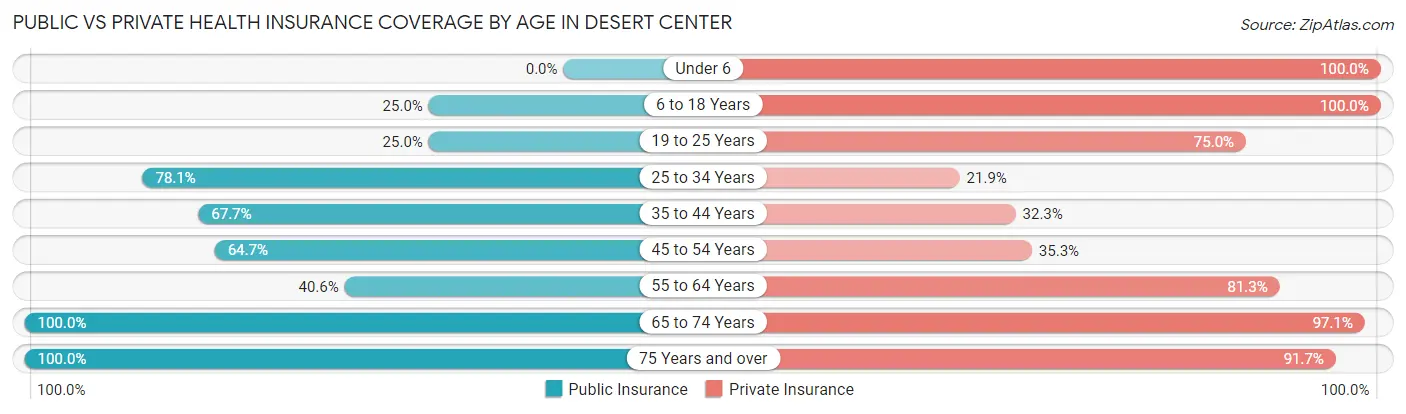
| Age Bracket | Public Insurance | Private Insurance |
| Under 6 | 0 (0.0%) | 9 (100.0%) |
| 6 to 18 Years | 2 (25.0%) | 8 (100.0%) |
| 19 to 25 Years | 1 (25.0%) | 3 (75.0%) |
| 25 to 34 Years | 25 (78.1%) | 7 (21.9%) |
| 35 to 44 Years | 21 (67.7%) | 10 (32.3%) |
| 45 to 54 Years | 11 (64.7%) | 6 (35.3%) |
| 55 to 64 Years | 13 (40.6%) | 26 (81.2%) |
| 65 to 74 Years | 34 (100.0%) | 33 (97.1%) |
| 75 Years and over | 24 (100.0%) | 22 (91.7%) |
| Total | 131 (68.6%) | 124 (64.9%) |
Disability Status by Sex by Age in Desert Center
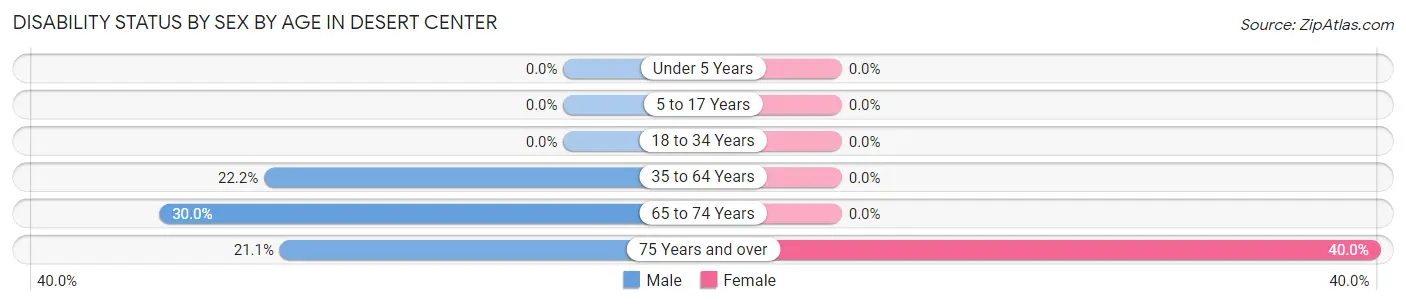
| Age Bracket | Male | Female |
| Under 5 Years | 0 (0.0%) | 0 (0.0%) |
| 5 to 17 Years | 0 (0.0%) | 0 (0.0%) |
| 18 to 34 Years | 0 (0.0%) | 0 (0.0%) |
| 35 to 64 Years | 12 (22.2%) | 0 (0.0%) |
| 65 to 74 Years | 6 (30.0%) | 0 (0.0%) |
| 75 Years and over | 4 (21.0%) | 2 (40.0%) |
Disability Class by Sex by Age in Desert Center
Disability Class: Hearing Difficulty
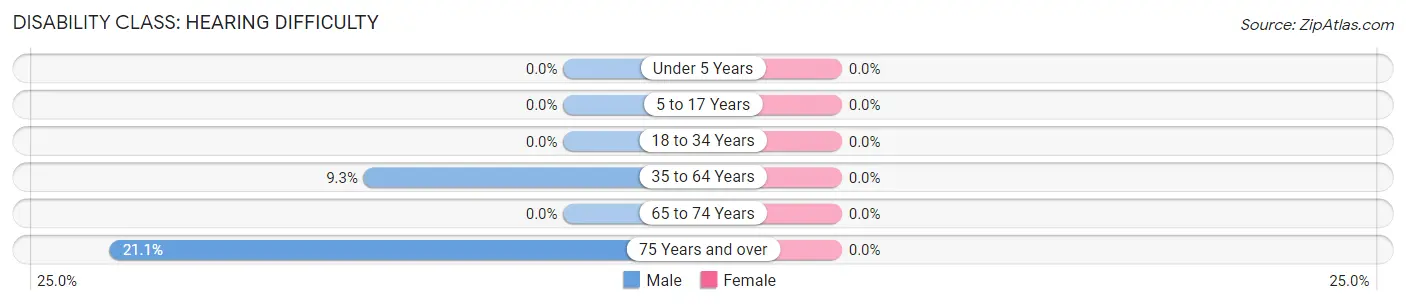
| Age Bracket | Male | Female |
| Under 5 Years | 0 (0.0%) | 0 (0.0%) |
| 5 to 17 Years | 0 (0.0%) | 0 (0.0%) |
| 18 to 34 Years | 0 (0.0%) | 0 (0.0%) |
| 35 to 64 Years | 5 (9.3%) | 0 (0.0%) |
| 65 to 74 Years | 0 (0.0%) | 0 (0.0%) |
| 75 Years and over | 4 (21.0%) | 0 (0.0%) |
Disability Class: Vision Difficulty
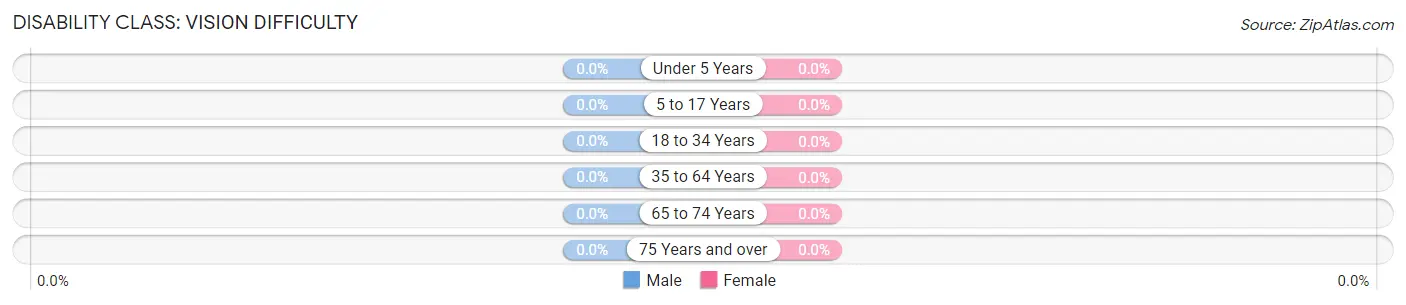
| Age Bracket | Male | Female |
| Under 5 Years | 0 (0.0%) | 0 (0.0%) |
| 5 to 17 Years | 0 (0.0%) | 0 (0.0%) |
| 18 to 34 Years | 0 (0.0%) | 0 (0.0%) |
| 35 to 64 Years | 0 (0.0%) | 0 (0.0%) |
| 65 to 74 Years | 0 (0.0%) | 0 (0.0%) |
| 75 Years and over | 0 (0.0%) | 0 (0.0%) |
Disability Class: Cognitive Difficulty
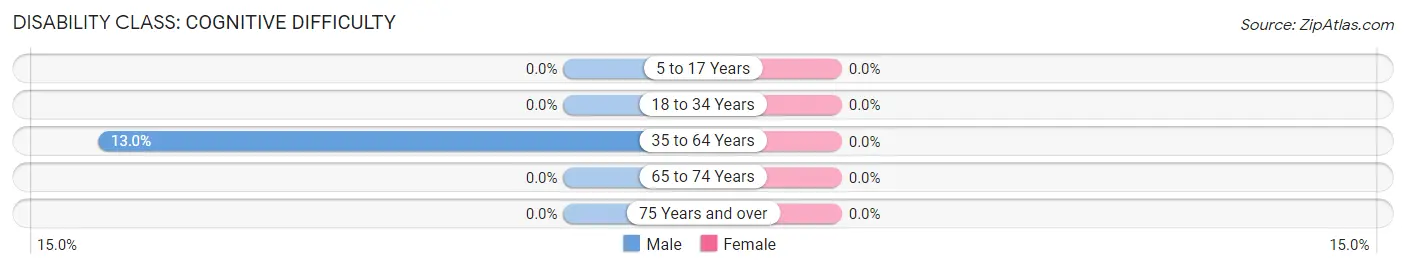
| Age Bracket | Male | Female |
| 5 to 17 Years | 0 (0.0%) | 0 (0.0%) |
| 18 to 34 Years | 0 (0.0%) | 0 (0.0%) |
| 35 to 64 Years | 7 (13.0%) | 0 (0.0%) |
| 65 to 74 Years | 0 (0.0%) | 0 (0.0%) |
| 75 Years and over | 0 (0.0%) | 0 (0.0%) |
Disability Class: Ambulatory Difficulty
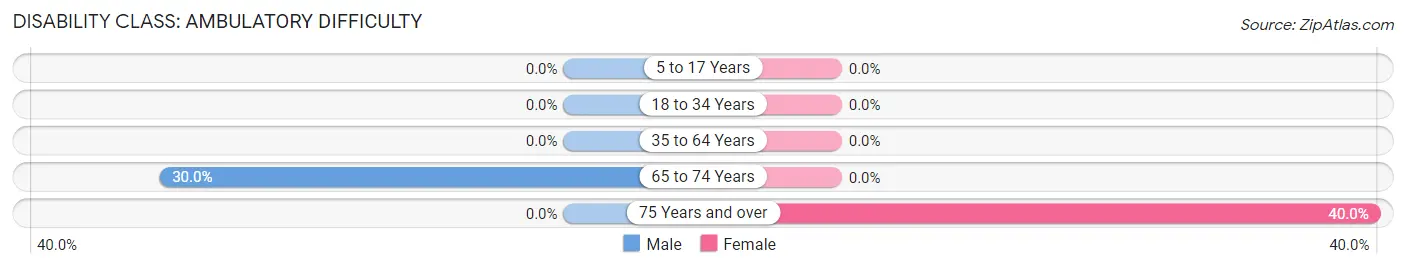
| Age Bracket | Male | Female |
| 5 to 17 Years | 0 (0.0%) | 0 (0.0%) |
| 18 to 34 Years | 0 (0.0%) | 0 (0.0%) |
| 35 to 64 Years | 0 (0.0%) | 0 (0.0%) |
| 65 to 74 Years | 6 (30.0%) | 0 (0.0%) |
| 75 Years and over | 0 (0.0%) | 2 (40.0%) |
Disability Class: Self-Care Difficulty
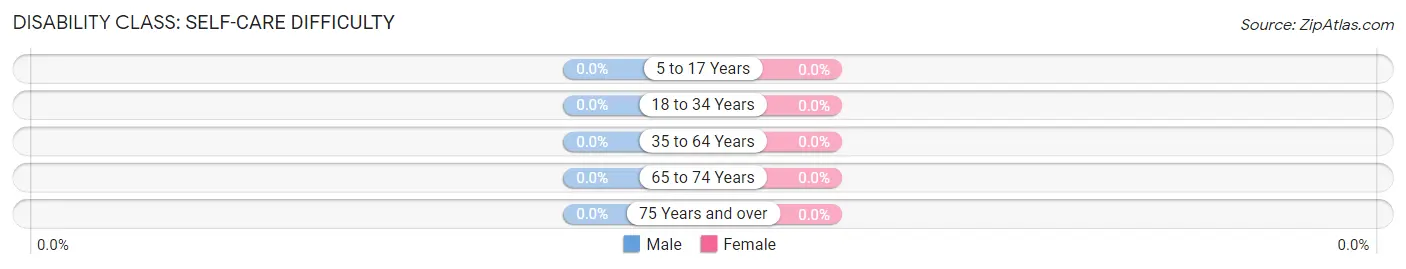
| Age Bracket | Male | Female |
| 5 to 17 Years | 0 (0.0%) | 0 (0.0%) |
| 18 to 34 Years | 0 (0.0%) | 0 (0.0%) |
| 35 to 64 Years | 0 (0.0%) | 0 (0.0%) |
| 65 to 74 Years | 0 (0.0%) | 0 (0.0%) |
| 75 Years and over | 0 (0.0%) | 0 (0.0%) |
Technology Access in Desert Center
Computing Device Access in Desert Center
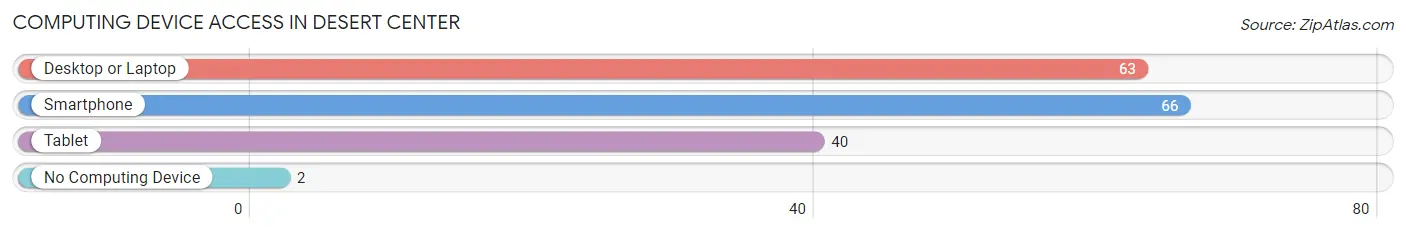
| Device Type | # Households | % Households |
| Desktop or Laptop | 63 | 92.6% |
| Smartphone | 66 | 97.1% |
| Tablet | 40 | 58.8% |
| No Computing Device | 2 | 2.9% |
| Total | 68 | 100.0% |
Internet Access in Desert Center
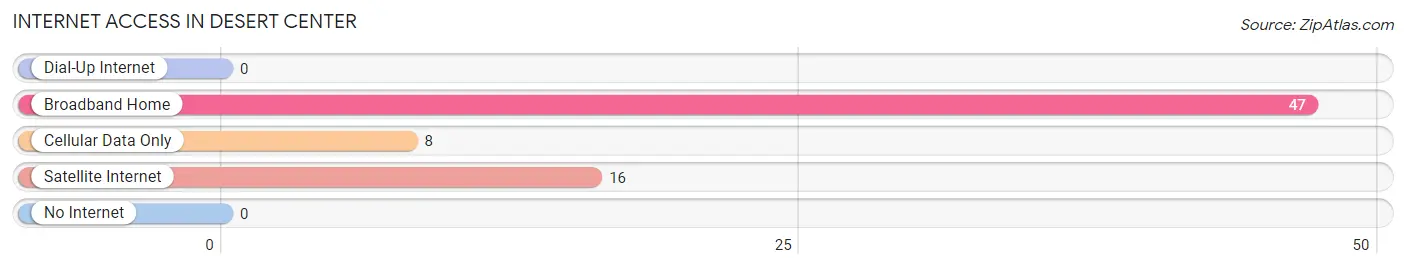
| Internet Type | # Households | % Households |
| Dial-Up Internet | 0 | 0.0% |
| Broadband Home | 47 | 69.1% |
| Cellular Data Only | 8 | 11.8% |
| Satellite Internet | 16 | 23.5% |
| No Internet | 0 | 0.0% |
| Total | 68 | 100.0% |
Desert Center Summary
Desert Center is an unincorporated community located in Riverside County, California, United States. It is situated in the Colorado Desert, in the Chuckwalla Valley, between the Chocolate and Little Chuckwalla Mountains. The community is located along Interstate 10, between the cities of Indio and Blythe.
History
Desert Center was founded in the early 1920s by a group of homesteaders who were looking for a place to settle in the desert. The town was originally called “Desert Center Station” and was a stop on the Southern Pacific Railroad. The town was later renamed to “Desert Center” in the 1930s.
The town was a popular stop for travelers on their way to Los Angeles and other cities in Southern California. It was also a popular spot for travelers to rest and refuel their vehicles.
In the 1940s, Desert Center was home to a U.S. Army Air Force base. The base was used to train pilots for World War II. After the war, the base was closed and the town returned to its original purpose as a stop for travelers.
Geography
Desert Center is located in the Colorado Desert, in the Chuckwalla Valley, between the Chocolate and Little Chuckwalla Mountains. The town is situated along Interstate 10, between the cities of Indio and Blythe.
The town is located at an elevation of 1,845 feet (562 m). The climate is hot and dry, with temperatures ranging from the mid-90s in the summer to the mid-60s in the winter.
Economy
The economy of Desert Center is largely based on tourism. The town is a popular stop for travelers on their way to Los Angeles and other cities in Southern California. It is also a popular spot for travelers to rest and refuel their vehicles.
The town is also home to a number of businesses, including a gas station, a restaurant, a motel, and a few other small businesses.
Demographics
As of the 2010 census, the population of Desert Center was 545. The racial makeup of the town was 75.2% White, 0.9% African American, 0.9% Native American, 0.4% Asian, 0.2% Pacific Islander, 19.3% from other races, and 3.1% from two or more races. Hispanic or Latino of any race were 33.3% of the population.
The median household income in Desert Center was $30,000, and the median family income was $35,000. The per capita income for the town was $14,000. About 18.2% of the population was below the poverty line.
Common Questions
What is Per Capita Income in Desert Center?
Per Capita income in Desert Center is $31,393.
What is the Median Family Income in Desert Center?
Median Family Income in Desert Center is $76,563.
What is the Median Household income in Desert Center?
Median Household Income in Desert Center is $77,500.
What is Inequality or Gini Index in Desert Center?
Inequality or Gini Index in Desert Center is 0.35.
What is the Total Population of Desert Center?
Total Population of Desert Center is 191.
What is the Total Male Population of Desert Center?
Total Male Population of Desert Center is 118.
What is the Total Female Population of Desert Center?
Total Female Population of Desert Center is 73.
What is the Ratio of Males per 100 Females in Desert Center?
There are 161.64 Males per 100 Females in Desert Center.
What is the Ratio of Females per 100 Males in Desert Center?
There are 61.86 Females per 100 Males in Desert Center.
What is the Median Population Age in Desert Center?
Median Population Age in Desert Center is 49.9 Years.
What is the Average Family Size in Desert Center
Average Family Size in Desert Center is 2.3 People.
What is the Average Household Size in Desert Center
Average Household Size in Desert Center is 2.8 People.
How Large is the Labor Force in Desert Center?
There are 79 People in the Labor Forcein in Desert Center.
What is the Percentage of People in the Labor Force in Desert Center?
45.1% of People are in the Labor Force in Desert Center.
What is the Unemployment Rate in Desert Center?
Unemployment Rate in Desert Center is 11.4%.