Newark, CA Map & Demographics
Newark Map
Newark Overview
$62,417
PER CAPITA INCOME
$167,177
AVG FAMILY INCOME
$159,465
AVG HOUSEHOLD INCOME
26.3%
WAGE / INCOME GAP [ % ]
73.7¢/ $1
WAGE / INCOME GAP [ $ ]
0.40
INEQUALITY / GINI INDEX
47,470
TOTAL POPULATION
24,610
MALE POPULATION
22,860
FEMALE POPULATION
107.66
MALES / 100 FEMALES
92.89
FEMALES / 100 MALES
36.9
MEDIAN AGE
3.4
AVG FAMILY SIZE
3.2
AVG HOUSEHOLD SIZE
28,089
LABOR FORCE [ PEOPLE ]
71.6%
PERCENT IN LABOR FORCE
4.5%
UNEMPLOYMENT RATE
Newark Zip Codes
Newark Area Codes
Income in Newark
Income Overview in Newark
Per Capita Income in Newark is $62,417, while median incomes of families and households are $167,177 and $159,465 respectively.
| Characteristic | Number | Measure |
| Per Capita Income | 47,470 | $62,417 |
| Median Family Income | 11,972 | $167,177 |
| Mean Family Income | 11,972 | $200,955 |
| Median Household Income | 14,805 | $159,465 |
| Mean Household Income | 14,805 | $191,873 |
| Income Deficit | 11,972 | $0 |
| Wage / Income Gap (%) | 47,470 | 26.32% |
| Wage / Income Gap ($) | 47,470 | 73.68¢ per $1 |
| Gini / Inequality Index | 47,470 | 0.40 |
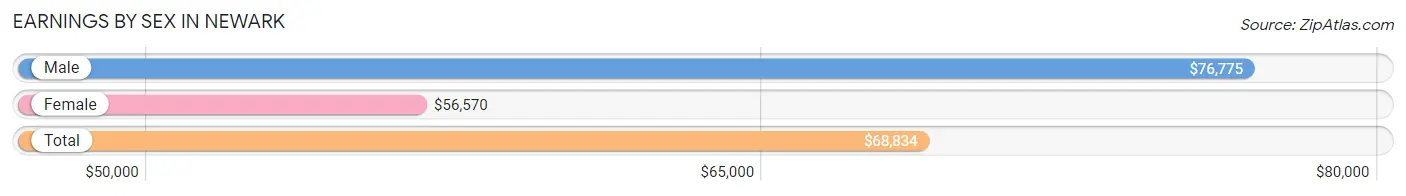
Earnings by Sex in Newark
Average Earnings in Newark are $68,834, $76,775 for men and $56,570 for women, a difference of 26.3%.
| Sex | Number | Average Earnings |
| Male | 15,844 (55.9%) | $76,775 |
| Female | 12,472 (44.1%) | $56,570 |
| Total | 28,316 (100.0%) | $68,834 |
Earnings by Sex by Income Bracket in Newark
The most common earnings brackets in Newark are $100,000+ for men (6,010 | 37.9%) and $100,000+ for women (3,528 | 28.3%).
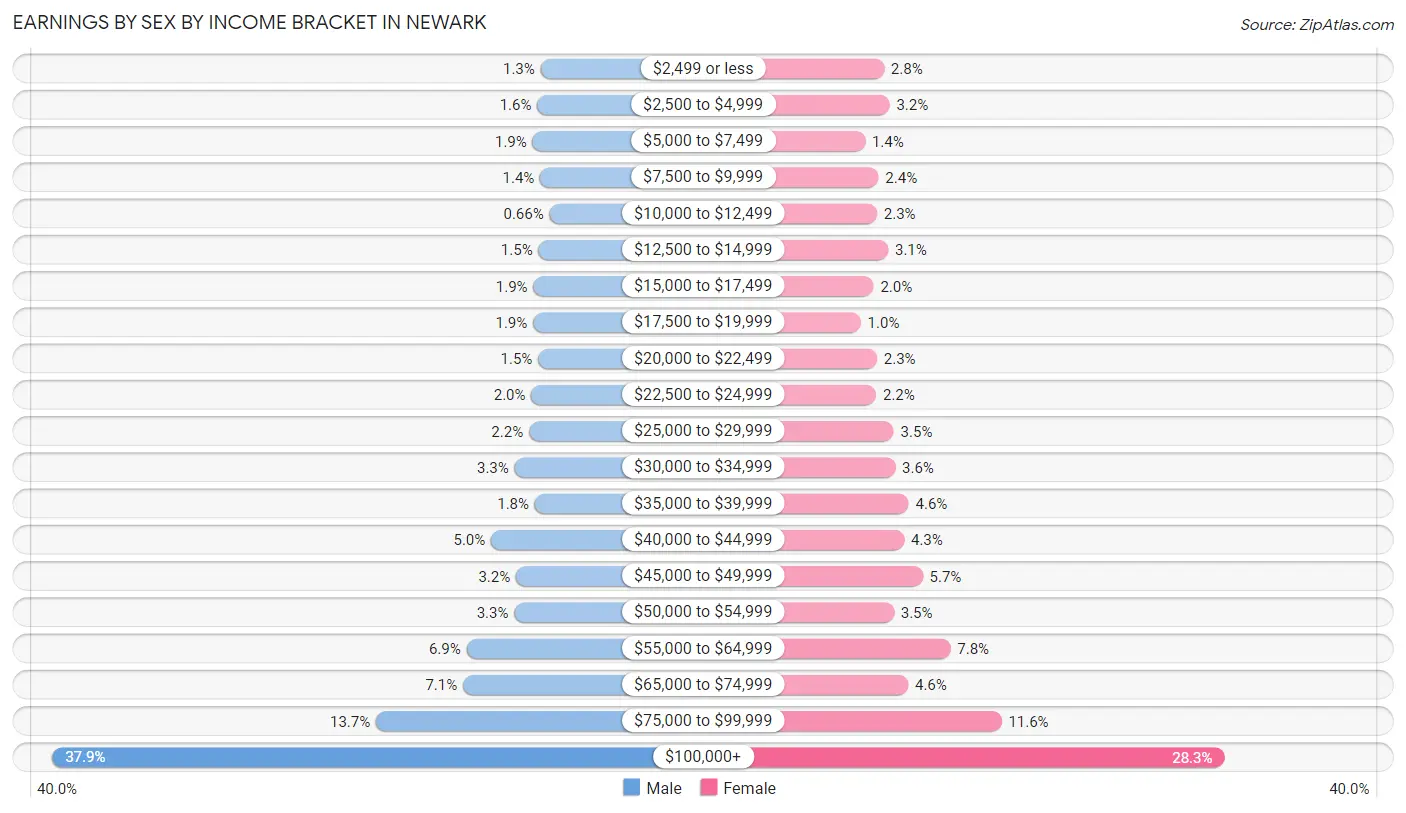
| Income | Male | Female |
| $2,499 or less | 210 (1.3%) | 347 (2.8%) |
| $2,500 to $4,999 | 250 (1.6%) | 399 (3.2%) |
| $5,000 to $7,499 | 306 (1.9%) | 170 (1.4%) |
| $7,500 to $9,999 | 216 (1.4%) | 296 (2.4%) |
| $10,000 to $12,499 | 105 (0.7%) | 280 (2.2%) |
| $12,500 to $14,999 | 236 (1.5%) | 385 (3.1%) |
| $15,000 to $17,499 | 297 (1.9%) | 249 (2.0%) |
| $17,500 to $19,999 | 299 (1.9%) | 130 (1.0%) |
| $20,000 to $22,499 | 239 (1.5%) | 281 (2.2%) |
| $22,500 to $24,999 | 320 (2.0%) | 273 (2.2%) |
| $25,000 to $29,999 | 349 (2.2%) | 438 (3.5%) |
| $30,000 to $34,999 | 519 (3.3%) | 451 (3.6%) |
| $35,000 to $39,999 | 279 (1.8%) | 578 (4.6%) |
| $40,000 to $44,999 | 798 (5.0%) | 535 (4.3%) |
| $45,000 to $49,999 | 503 (3.2%) | 708 (5.7%) |
| $50,000 to $54,999 | 523 (3.3%) | 439 (3.5%) |
| $55,000 to $64,999 | 1,090 (6.9%) | 968 (7.8%) |
| $65,000 to $74,999 | 1,131 (7.1%) | 572 (4.6%) |
| $75,000 to $99,999 | 2,164 (13.7%) | 1,445 (11.6%) |
| $100,000+ | 6,010 (37.9%) | 3,528 (28.3%) |
| Total | 15,844 (100.0%) | 12,472 (100.0%) |
Earnings by Sex by Educational Attainment in Newark
Average earnings in Newark are $85,815 for men and $61,914 for women, a difference of 27.9%. Men with an educational attainment of graduate degree enjoy the highest average annual earnings of $164,536, while those with less than high school education earn the least with $45,103. Women with an educational attainment of graduate degree earn the most with the average annual earnings of $119,237, while those with less than high school education have the smallest earnings of $29,361.
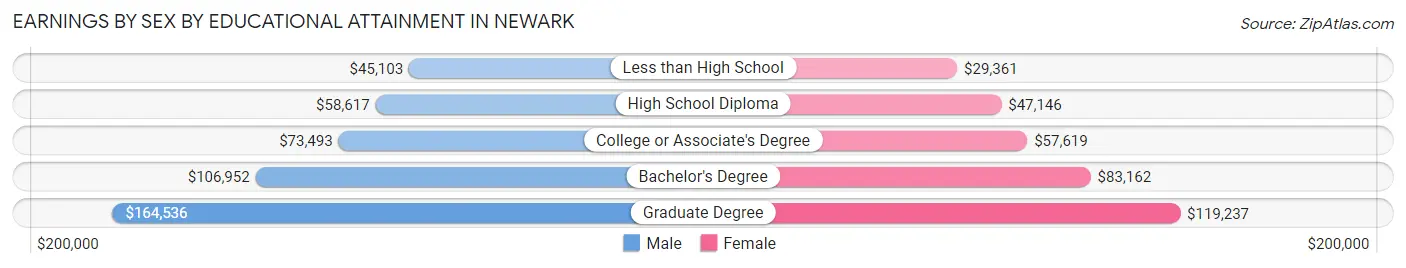
| Educational Attainment | Male Income | Female Income |
| Less than High School | $45,103 | $29,361 |
| High School Diploma | $58,617 | $47,146 |
| College or Associate's Degree | $73,493 | $57,619 |
| Bachelor's Degree | $106,952 | $83,162 |
| Graduate Degree | $164,536 | $119,237 |
| Total | $85,815 | $61,914 |
Family Income in Newark
Family Income Brackets in Newark
According to the Newark family income data, there are 4,873 families falling into the $200,000+ income range, which is the most common income bracket and makes up 40.7% of all families.
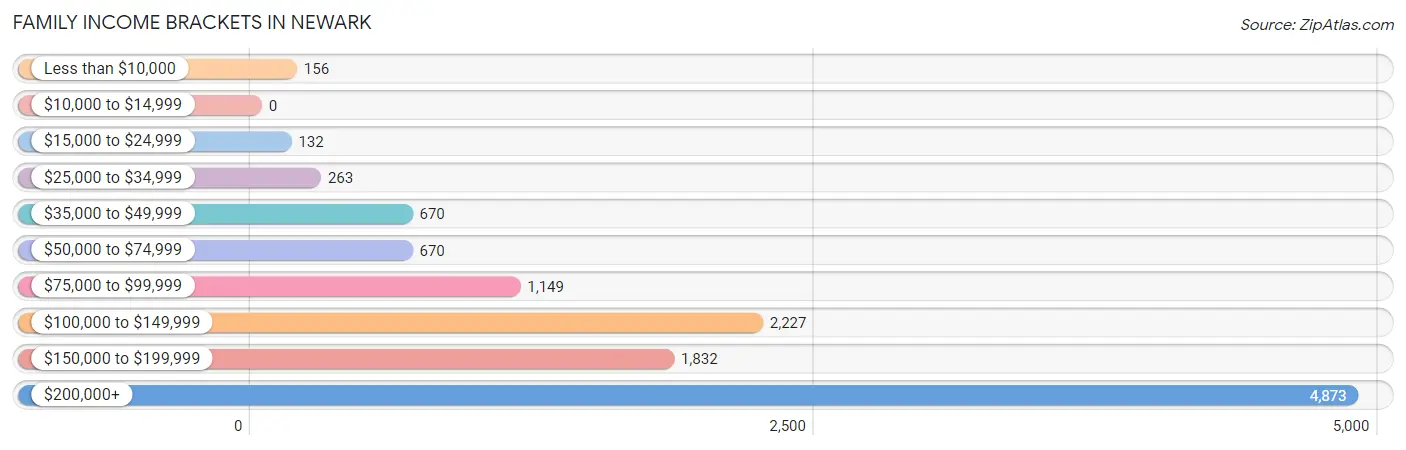
| Income Bracket | # Families | % Families |
| Less than $10,000 | 156 | 1.3% |
| $10,000 to $14,999 | 0 | 0.0% |
| $15,000 to $24,999 | 132 | 1.1% |
| $25,000 to $34,999 | 263 | 2.2% |
| $35,000 to $49,999 | 670 | 5.6% |
| $50,000 to $74,999 | 670 | 5.6% |
| $75,000 to $99,999 | 1,149 | 9.6% |
| $100,000 to $149,999 | 2,227 | 18.6% |
| $150,000 to $199,999 | 1,832 | 15.3% |
| $200,000+ | 4,873 | 40.7% |
Family Income by Famaliy Size in Newark
7+ person families (284 | 2.4%) account for the highest median family income in Newark with $231,063 per family, while 2-person families (4,648 | 38.8%) have the highest median income of $71,674 per family member.
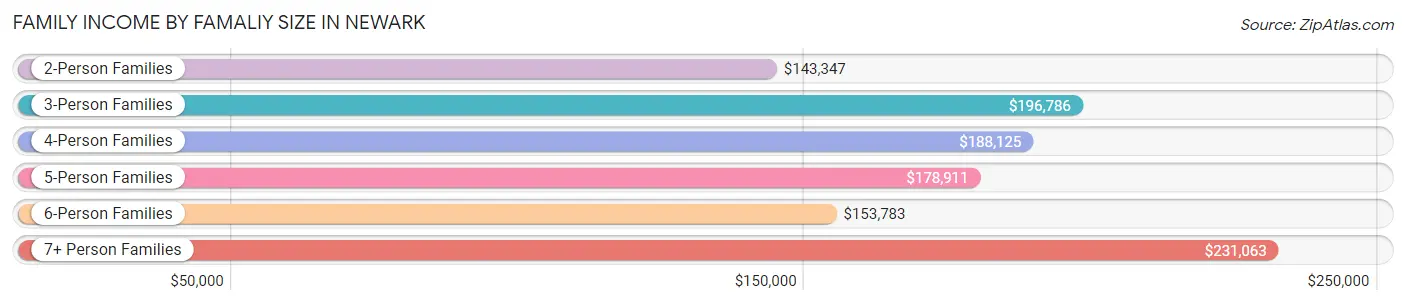
| Income Bracket | # Families | Median Income |
| 2-Person Families | 4,648 (38.8%) | $143,347 |
| 3-Person Families | 2,620 (21.9%) | $196,786 |
| 4-Person Families | 2,711 (22.6%) | $188,125 |
| 5-Person Families | 1,336 (11.2%) | $178,911 |
| 6-Person Families | 373 (3.1%) | $153,783 |
| 7+ Person Families | 284 (2.4%) | $231,063 |
| Total | 11,972 (100.0%) | $167,177 |
Family Income by Number of Earners in Newark
The median family income in Newark is $167,177, with families comprising 3+ earners (2,115) having the highest median family income of $199,583, while families with no earners (1,067) have the lowest median family income of $58,705, accounting for 17.7% and 8.9% of families, respectively.
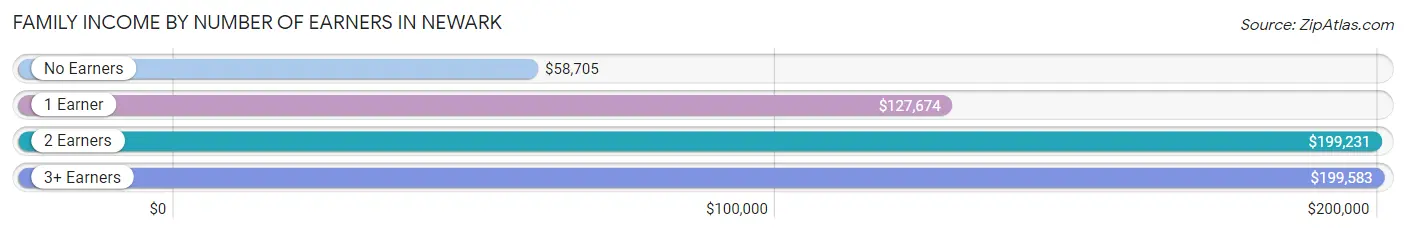
| Number of Earners | # Families | Median Income |
| No Earners | 1,067 (8.9%) | $58,705 |
| 1 Earner | 2,532 (21.1%) | $127,674 |
| 2 Earners | 6,258 (52.3%) | $199,231 |
| 3+ Earners | 2,115 (17.7%) | $199,583 |
| Total | 11,972 (100.0%) | $167,177 |
Household Income in Newark
Household Income Brackets in Newark
With 5,478 households falling in the category, the $200,000+ income range is the most frequent in Newark, accounting for 37.0% of all households. In contrast, only 59 households (0.4%) fall into the $10,000 to $14,999 income bracket, making it the least populous group.
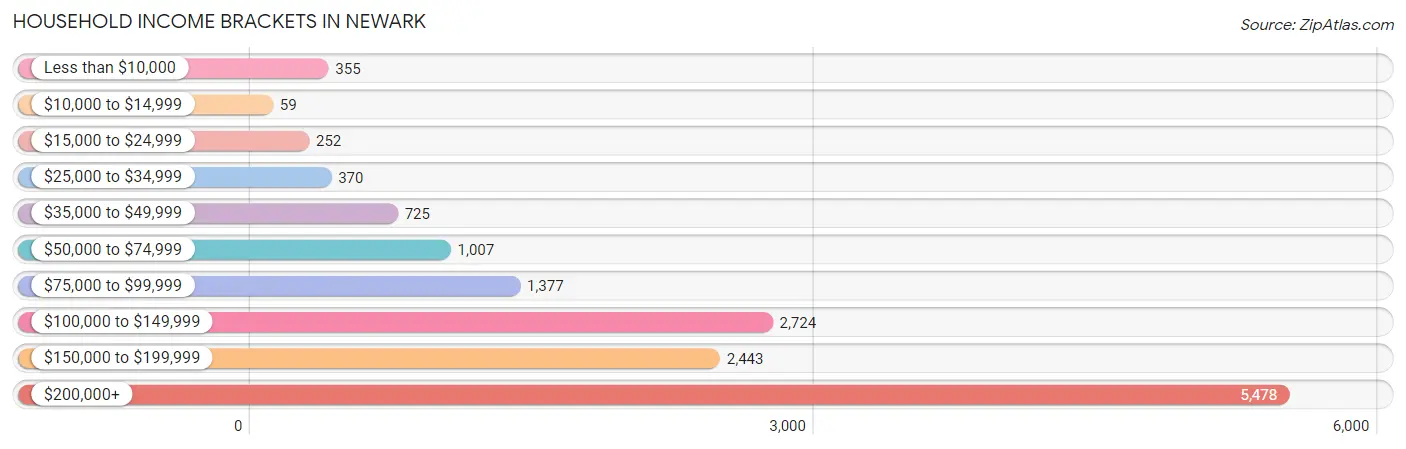
| Income Bracket | # Households | % Households |
| Less than $10,000 | 355 | 2.4% |
| $10,000 to $14,999 | 59 | 0.4% |
| $15,000 to $24,999 | 252 | 1.7% |
| $25,000 to $34,999 | 370 | 2.5% |
| $35,000 to $49,999 | 725 | 4.9% |
| $50,000 to $74,999 | 1,007 | 6.8% |
| $75,000 to $99,999 | 1,377 | 9.3% |
| $100,000 to $149,999 | 2,724 | 18.4% |
| $150,000 to $199,999 | 2,443 | 16.5% |
| $200,000+ | 5,478 | 37.0% |
Household Income by Householder Age in Newark
The median household income in Newark is $159,465, with the highest median household income of $198,696 found in the 25 to 44 years age bracket for the primary householder. A total of 5,763 households (38.9%) fall into this category. Meanwhile, the 65+ years age bracket for the primary householder has the lowest median household income of $89,609, with 2,935 households (19.8%) in this group.
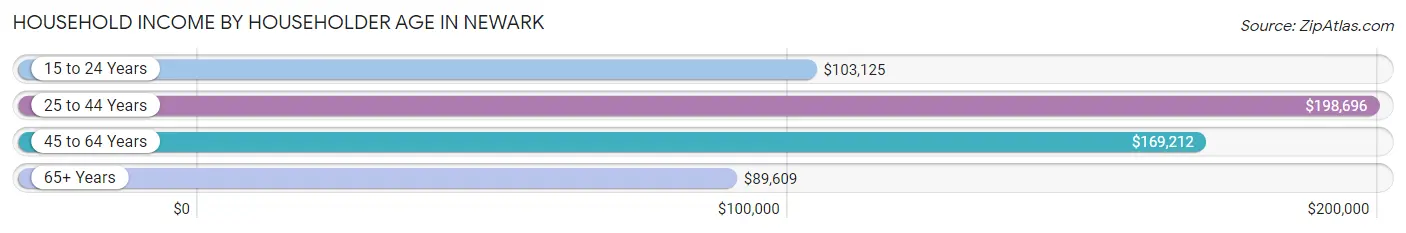
| Income Bracket | # Households | Median Income |
| 15 to 24 Years | 168 (1.1%) | $103,125 |
| 25 to 44 Years | 5,763 (38.9%) | $198,696 |
| 45 to 64 Years | 5,939 (40.1%) | $169,212 |
| 65+ Years | 2,935 (19.8%) | $89,609 |
| Total | 14,805 (100.0%) | $159,465 |
Poverty in Newark
Income Below Poverty by Sex and Age in Newark
With 3.8% poverty level for males and 4.2% for females among the residents of Newark, 5 year old males and 75 year old and over females are the most vulnerable to poverty, with 24 males (8.8%) and 172 females (13.2%) in their respective age groups living below the poverty level.
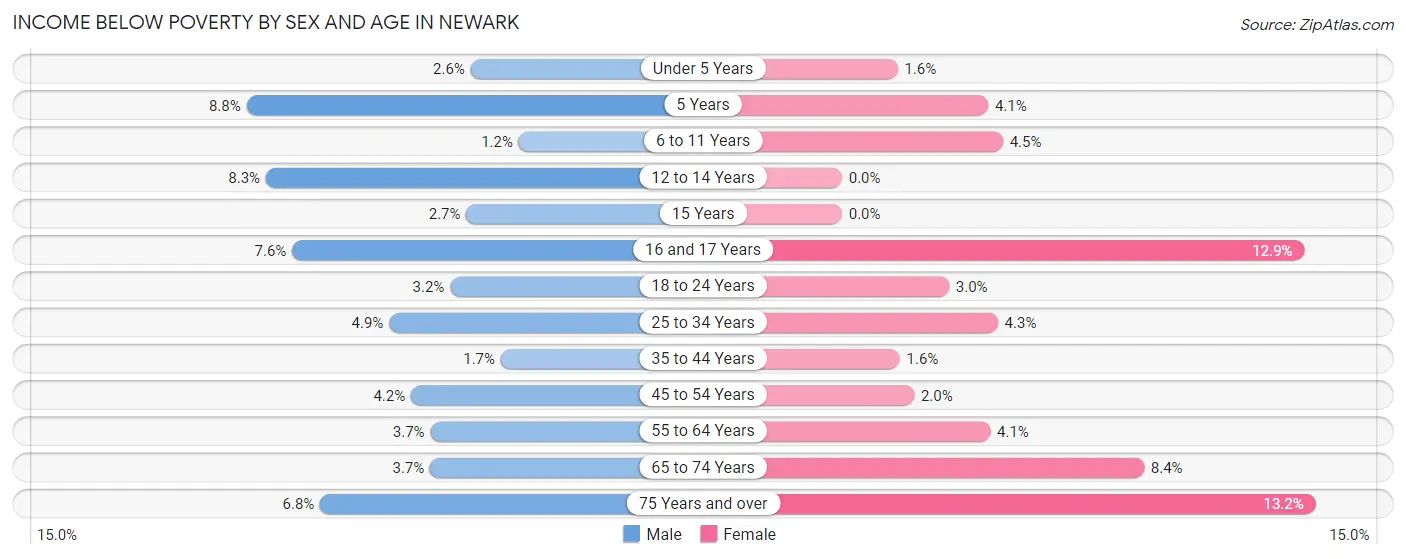
| Age Bracket | Male | Female |
| Under 5 Years | 37 (2.6%) | 25 (1.5%) |
| 5 Years | 24 (8.8%) | 9 (4.1%) |
| 6 to 11 Years | 17 (1.2%) | 66 (4.5%) |
| 12 to 14 Years | 53 (8.3%) | 0 (0.0%) |
| 15 Years | 7 (2.7%) | 0 (0.0%) |
| 16 and 17 Years | 42 (7.5%) | 72 (12.9%) |
| 18 to 24 Years | 60 (3.2%) | 49 (3.0%) |
| 25 to 34 Years | 248 (4.9%) | 166 (4.3%) |
| 35 to 44 Years | 68 (1.7%) | 55 (1.6%) |
| 45 to 54 Years | 124 (4.2%) | 62 (2.0%) |
| 55 to 64 Years | 129 (3.7%) | 119 (4.1%) |
| 65 to 74 Years | 54 (3.7%) | 166 (8.4%) |
| 75 Years and over | 82 (6.8%) | 172 (13.2%) |
| Total | 945 (3.8%) | 961 (4.2%) |
Income Above Poverty by Sex and Age in Newark
According to the poverty statistics in Newark, males aged 6 to 11 years and females aged 12 to 14 years are the age groups that are most secure financially, with 98.8% of males and 100.0% of females in these age groups living above the poverty line.
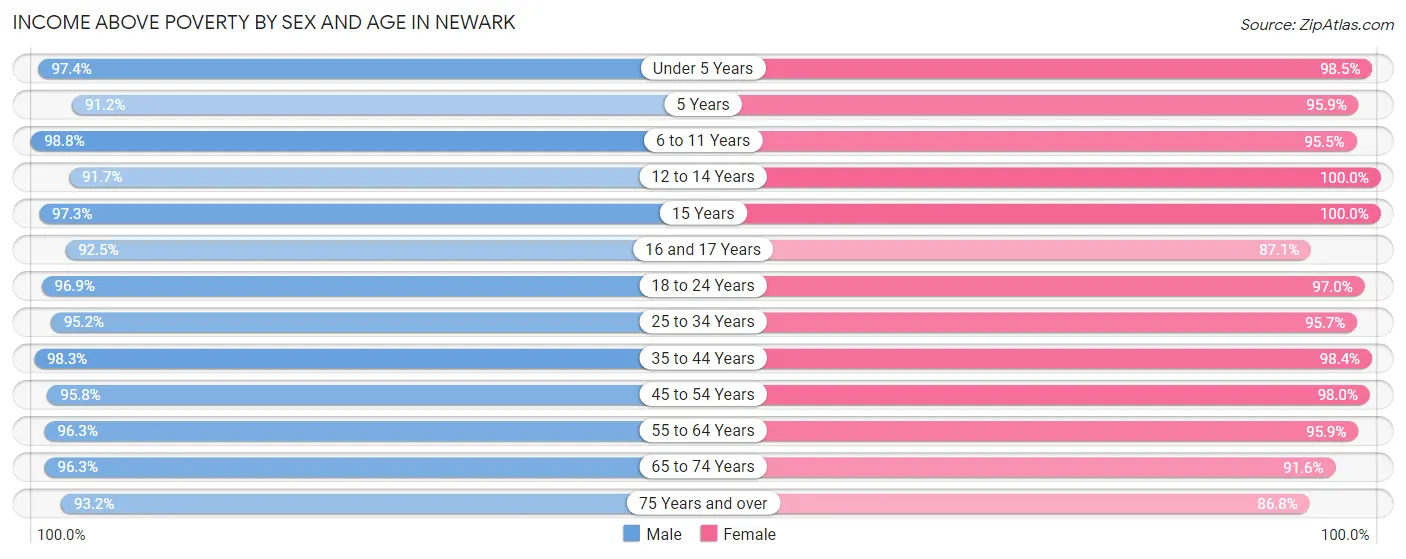
| Age Bracket | Male | Female |
| Under 5 Years | 1,397 (97.4%) | 1,591 (98.5%) |
| 5 Years | 248 (91.2%) | 212 (95.9%) |
| 6 to 11 Years | 1,353 (98.8%) | 1,408 (95.5%) |
| 12 to 14 Years | 587 (91.7%) | 617 (100.0%) |
| 15 Years | 252 (97.3%) | 230 (100.0%) |
| 16 and 17 Years | 514 (92.4%) | 487 (87.1%) |
| 18 to 24 Years | 1,845 (96.9%) | 1,595 (97.0%) |
| 25 to 34 Years | 4,866 (95.2%) | 3,657 (95.7%) |
| 35 to 44 Years | 3,833 (98.3%) | 3,354 (98.4%) |
| 45 to 54 Years | 2,802 (95.8%) | 3,020 (98.0%) |
| 55 to 64 Years | 3,358 (96.3%) | 2,760 (95.9%) |
| 65 to 74 Years | 1,402 (96.3%) | 1,809 (91.6%) |
| 75 Years and over | 1,129 (93.2%) | 1,132 (86.8%) |
| Total | 23,586 (96.2%) | 21,872 (95.8%) |
Income Below Poverty Among Married-Couple Families in Newark
The poverty statistics for married-couple families in Newark show that 1.1% or 106 of the total 9,376 families live below the poverty line. Families with no children have the highest poverty rate of 1.9%, comprising of 96 families. On the other hand, families with 3 or 4 children have the lowest poverty rate of 0.0%, which includes 0 families.
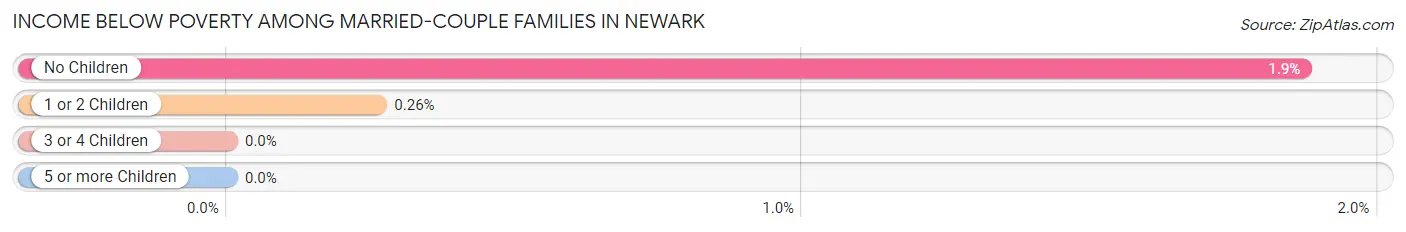
| Children | Above Poverty | Below Poverty |
| No Children | 5,039 (98.1%) | 96 (1.9%) |
| 1 or 2 Children | 3,775 (99.7%) | 10 (0.3%) |
| 3 or 4 Children | 456 (100.0%) | 0 (0.0%) |
| 5 or more Children | 0 (0.0%) | 0 (0.0%) |
| Total | 9,270 (98.9%) | 106 (1.1%) |
Income Below Poverty Among Single-Parent Households in Newark
According to the poverty data in Newark, 2.1% or 19 single-father households and 8.4% or 142 single-mother households are living below the poverty line. Among single-father households, those with 1 or 2 children have the highest poverty rate, with 7 households (2.6%) experiencing poverty. Likewise, among single-mother households, those with 3 or 4 children have the highest poverty rate, with 81 households (42.6%) falling below the poverty line.
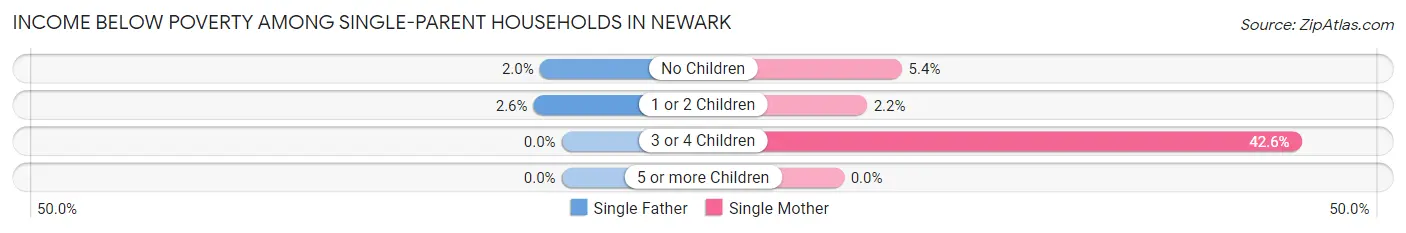
| Children | Single Father | Single Mother |
| No Children | 12 (2.0%) | 48 (5.4%) |
| 1 or 2 Children | 7 (2.6%) | 13 (2.1%) |
| 3 or 4 Children | 0 (0.0%) | 81 (42.6%) |
| 5 or more Children | 0 (0.0%) | 0 (0.0%) |
| Total | 19 (2.1%) | 142 (8.4%) |
Income Below Poverty Among Married-Couple vs Single-Parent Households in Newark
The poverty data for Newark shows that 106 of the married-couple family households (1.1%) and 161 of the single-parent households (6.2%) are living below the poverty level. Within the married-couple family households, those with no children have the highest poverty rate, with 96 households (1.9%) falling below the poverty line. Among the single-parent households, those with 3 or 4 children have the highest poverty rate, with 81 household (32.8%) living below poverty.
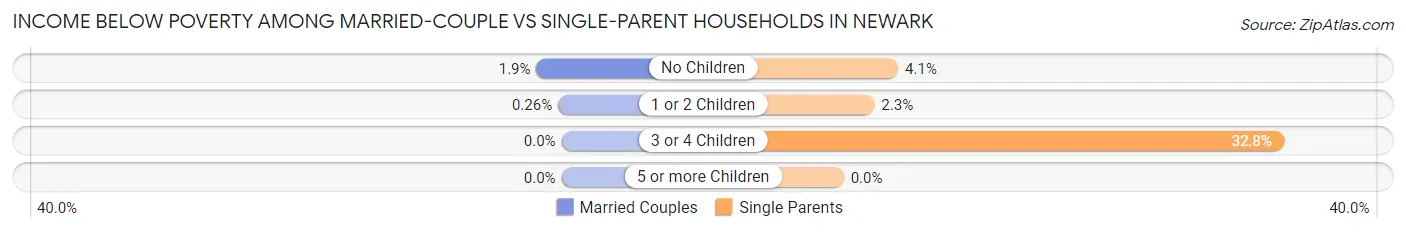
| Children | Married-Couple Families | Single-Parent Households |
| No Children | 96 (1.9%) | 60 (4.1%) |
| 1 or 2 Children | 10 (0.3%) | 20 (2.3%) |
| 3 or 4 Children | 0 (0.0%) | 81 (32.8%) |
| 5 or more Children | 0 (0.0%) | 0 (0.0%) |
| Total | 106 (1.1%) | 161 (6.2%) |
Race in Newark
The most populous races in Newark are Asian (19,832 | 41.8%), Hispanic or Latino (14,422 | 30.4%), and White / Caucasian (12,244 | 25.8%).
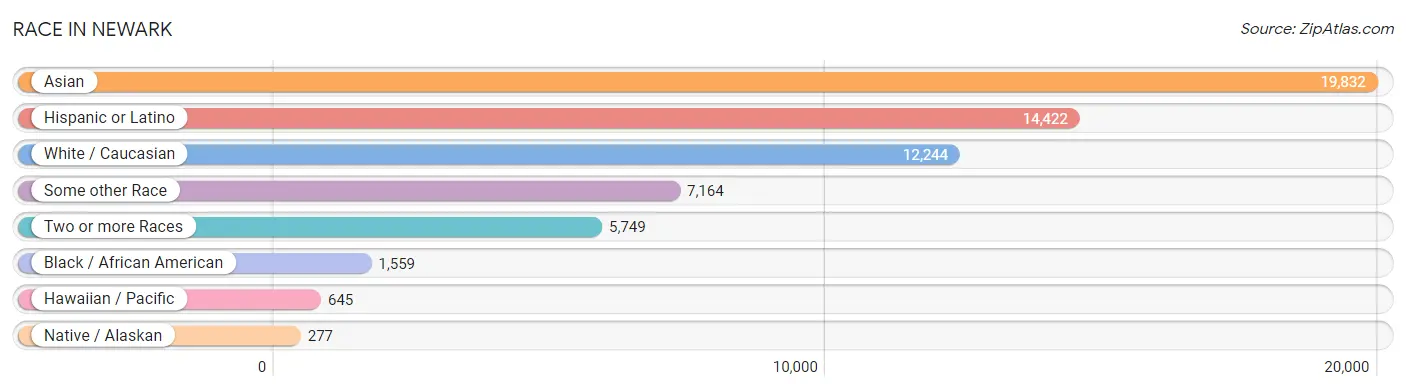
| Race | # Population | % Population |
| Asian | 19,832 | 41.8% |
| Black / African American | 1,559 | 3.3% |
| Hawaiian / Pacific | 645 | 1.4% |
| Hispanic or Latino | 14,422 | 30.4% |
| Native / Alaskan | 277 | 0.6% |
| White / Caucasian | 12,244 | 25.8% |
| Two or more Races | 5,749 | 12.1% |
| Some other Race | 7,164 | 15.1% |
| Total | 47,470 | 100.0% |
Ancestry in Newark
The most populous ancestries reported in Newark are Mexican (11,334 | 23.9%), Indian (Asian) (6,932 | 14.6%), Thai (5,724 | 12.1%), Korean (5,358 | 11.3%), and German (2,002 | 4.2%), together accounting for 66.1% of all Newark residents.
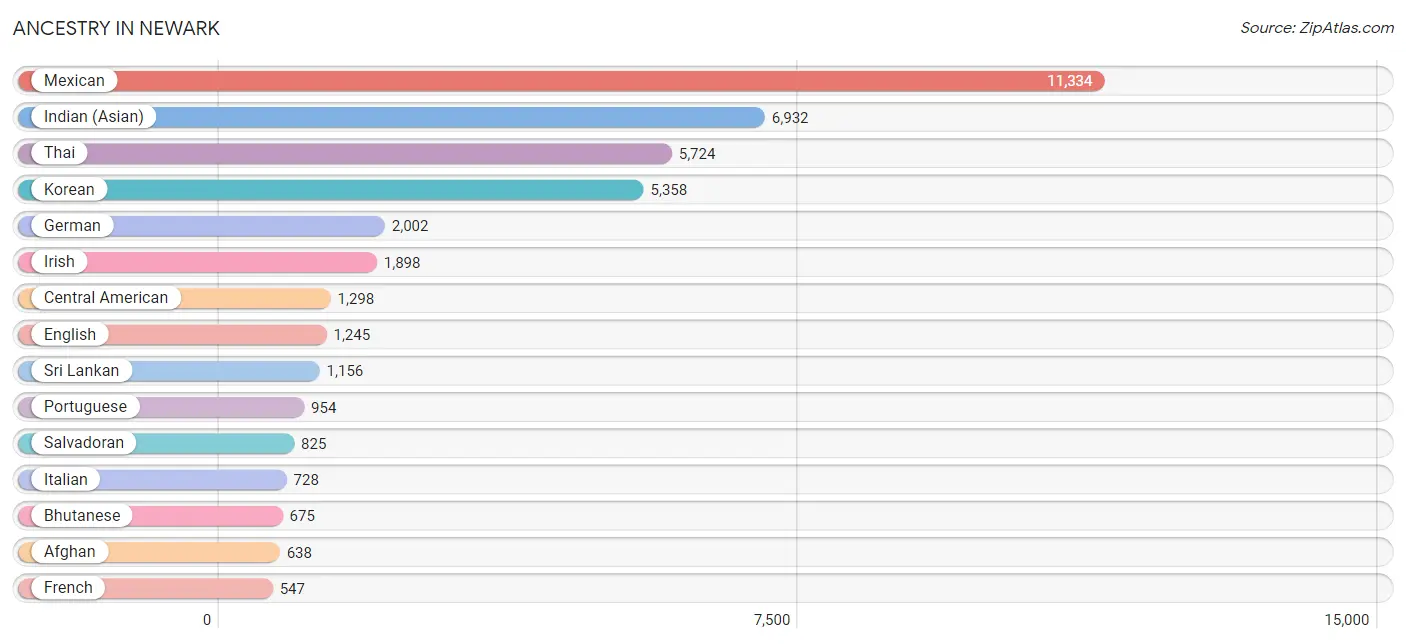
| Ancestry | # Population | % Population |
| Afghan | 638 | 1.3% |
| African | 95 | 0.2% |
| American | 526 | 1.1% |
| Arab | 207 | 0.4% |
| Argentinean | 19 | 0.0% |
| Armenian | 70 | 0.2% |
| Australian | 6 | 0.0% |
| Austrian | 20 | 0.0% |
| Bangladeshi | 10 | 0.0% |
| Basque | 16 | 0.0% |
| Bhutanese | 675 | 1.4% |
| Blackfeet | 37 | 0.1% |
| Brazilian | 76 | 0.2% |
| British | 337 | 0.7% |
| Bulgarian | 27 | 0.1% |
| Burmese | 402 | 0.9% |
| Cajun | 16 | 0.0% |
| Cambodian | 70 | 0.2% |
| Central American | 1,298 | 2.7% |
| Cherokee | 107 | 0.2% |
| Chilean | 23 | 0.1% |
| Chippewa | 11 | 0.0% |
| Colombian | 160 | 0.3% |
| Comanche | 7 | 0.0% |
| Costa Rican | 123 | 0.3% |
| Cree | 30 | 0.1% |
| Cuban | 228 | 0.5% |
| Czech | 9 | 0.0% |
| Danish | 32 | 0.1% |
| Delaware | 22 | 0.1% |
| Dutch | 257 | 0.5% |
| Egyptian | 37 | 0.1% |
| English | 1,245 | 2.6% |
| Ethiopian | 89 | 0.2% |
| European | 176 | 0.4% |
| Filipino | 320 | 0.7% |
| Finnish | 185 | 0.4% |
| French | 547 | 1.1% |
| French Canadian | 50 | 0.1% |
| German | 2,002 | 4.2% |
| Greek | 3 | 0.0% |
| Guamanian / Chamorro | 49 | 0.1% |
| Guatemalan | 192 | 0.4% |
| Hopi | 1 | 0.0% |
| Hungarian | 139 | 0.3% |
| Indian (Asian) | 6,932 | 14.6% |
| Indonesian | 81 | 0.2% |
| Iranian | 121 | 0.3% |
| Irish | 1,898 | 4.0% |
| Israeli | 17 | 0.0% |
| Italian | 728 | 1.5% |
| Japanese | 318 | 0.7% |
| Jordanian | 7 | 0.0% |
| Korean | 5,358 | 11.3% |
| Laotian | 53 | 0.1% |
| Lebanese | 25 | 0.1% |
| Lithuanian | 18 | 0.0% |
| Malaysian | 120 | 0.3% |
| Mexican | 11,334 | 23.9% |
| Mexican American Indian | 48 | 0.1% |
| Native Hawaiian | 92 | 0.2% |
| Navajo | 8 | 0.0% |
| Nepalese | 13 | 0.0% |
| New Zealander | 20 | 0.0% |
| Nicaraguan | 136 | 0.3% |
| Nigerian | 163 | 0.3% |
| Northern European | 53 | 0.1% |
| Norwegian | 295 | 0.6% |
| Pakistani | 105 | 0.2% |
| Panamanian | 22 | 0.1% |
| Peruvian | 213 | 0.4% |
| Polish | 265 | 0.6% |
| Portuguese | 954 | 2.0% |
| Pueblo | 53 | 0.1% |
| Puerto Rican | 145 | 0.3% |
| Romanian | 13 | 0.0% |
| Russian | 138 | 0.3% |
| Salvadoran | 825 | 1.7% |
| Samoan | 60 | 0.1% |
| Scandinavian | 23 | 0.1% |
| Scotch-Irish | 128 | 0.3% |
| Scottish | 215 | 0.4% |
| Sioux | 7 | 0.0% |
| Slovak | 7 | 0.0% |
| Slovene | 18 | 0.0% |
| South American | 536 | 1.1% |
| South American Indian | 12 | 0.0% |
| Spaniard | 422 | 0.9% |
| Spanish | 255 | 0.5% |
| Spanish American Indian | 16 | 0.0% |
| Sri Lankan | 1,156 | 2.4% |
| Subsaharan African | 396 | 0.8% |
| Swedish | 283 | 0.6% |
| Swiss | 45 | 0.1% |
| Syrian | 61 | 0.1% |
| Thai | 5,724 | 12.1% |
| Tongan | 18 | 0.0% |
| Turkish | 12 | 0.0% |
| Ukrainian | 112 | 0.2% |
| Uruguayan | 121 | 0.3% |
| Vietnamese | 14 | 0.0% |
| Welsh | 34 | 0.1% |
| Yaqui | 6 | 0.0% |
| Yugoslavian | 31 | 0.1% | View All 104 Rows |
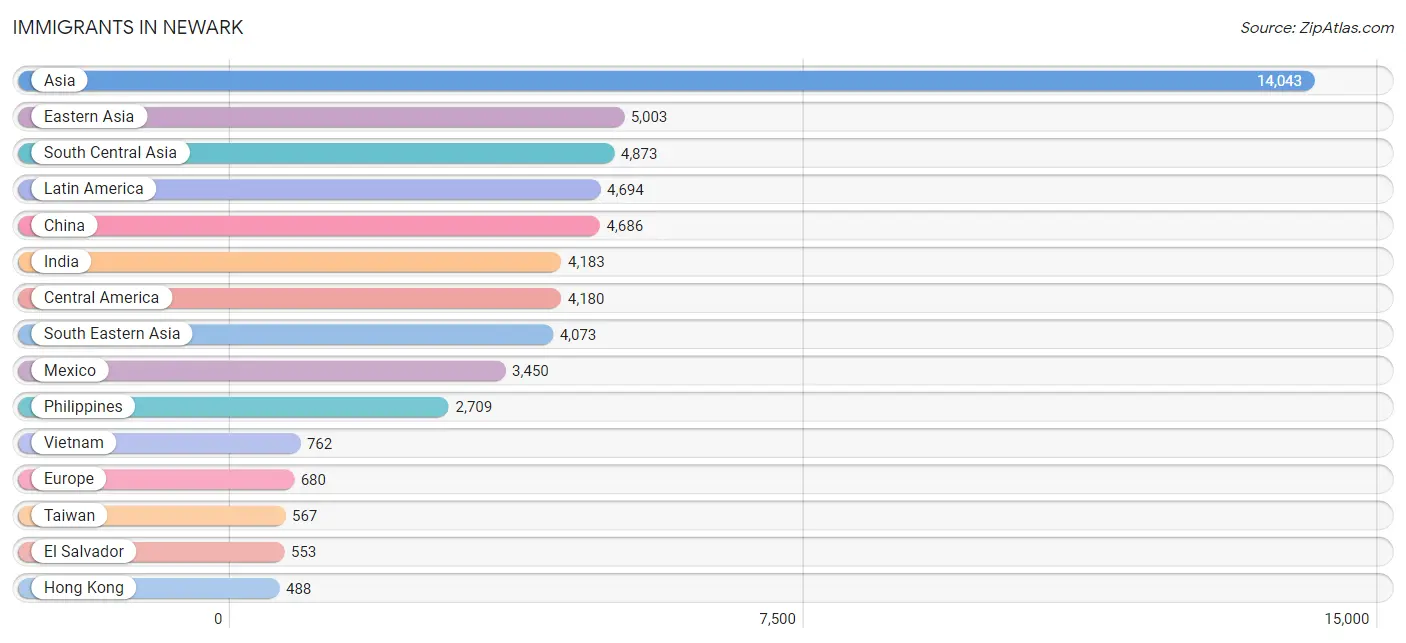
Immigrants in Newark
The most numerous immigrant groups reported in Newark came from Asia (14,043 | 29.6%), Eastern Asia (5,003 | 10.5%), South Central Asia (4,873 | 10.3%), Latin America (4,694 | 9.9%), and China (4,686 | 9.9%), together accounting for 70.2% of all Newark residents.
| Immigration Origin | # Population | % Population |
| Afghanistan | 271 | 0.6% |
| Africa | 130 | 0.3% |
| Argentina | 70 | 0.2% |
| Asia | 14,043 | 29.6% |
| Australia | 82 | 0.2% |
| Azores | 35 | 0.1% |
| Bangladesh | 14 | 0.0% |
| Belgium | 10 | 0.0% |
| Bosnia and Herzegovina | 10 | 0.0% |
| Brazil | 77 | 0.2% |
| Bulgaria | 27 | 0.1% |
| Cambodia | 113 | 0.2% |
| Canada | 63 | 0.1% |
| Caribbean | 94 | 0.2% |
| Central America | 4,180 | 8.8% |
| China | 4,686 | 9.9% |
| Colombia | 92 | 0.2% |
| Costa Rica | 65 | 0.1% |
| Cuba | 94 | 0.2% |
| Czechoslovakia | 16 | 0.0% |
| Eastern Africa | 70 | 0.2% |
| Eastern Asia | 5,003 | 10.5% |
| Eastern Europe | 167 | 0.4% |
| Egypt | 22 | 0.1% |
| El Salvador | 553 | 1.2% |
| England | 36 | 0.1% |
| Ethiopia | 70 | 0.2% |
| Europe | 680 | 1.4% |
| Fiji | 359 | 0.8% |
| France | 158 | 0.3% |
| Germany | 88 | 0.2% |
| Guatemala | 55 | 0.1% |
| Hong Kong | 488 | 1.0% |
| India | 4,183 | 8.8% |
| Indonesia | 171 | 0.4% |
| Iran | 65 | 0.1% |
| Ireland | 11 | 0.0% |
| Italy | 50 | 0.1% |
| Japan | 79 | 0.2% |
| Jordan | 15 | 0.0% |
| Korea | 238 | 0.5% |
| Kuwait | 7 | 0.0% |
| Laos | 53 | 0.1% |
| Latin America | 4,694 | 9.9% |
| Lebanon | 19 | 0.0% |
| Malaysia | 22 | 0.1% |
| Mexico | 3,450 | 7.3% |
| Moldova | 13 | 0.0% |
| Nepal | 36 | 0.1% |
| Nicaragua | 44 | 0.1% |
| Northern Africa | 36 | 0.1% |
| Northern Europe | 94 | 0.2% |
| Oceania | 450 | 0.9% |
| Pakistan | 250 | 0.5% |
| Panama | 13 | 0.0% |
| Peru | 135 | 0.3% |
| Philippines | 2,709 | 5.7% |
| Portugal | 84 | 0.2% |
| Russia | 28 | 0.1% |
| Saudi Arabia | 29 | 0.1% |
| Scotland | 10 | 0.0% |
| Singapore | 78 | 0.2% |
| South America | 420 | 0.9% |
| South Central Asia | 4,873 | 10.3% |
| South Eastern Asia | 4,073 | 8.6% |
| Southern Europe | 163 | 0.3% |
| Spain | 16 | 0.0% |
| Sri Lanka | 54 | 0.1% |
| Syria | 24 | 0.1% |
| Taiwan | 567 | 1.2% |
| Thailand | 104 | 0.2% |
| Ukraine | 65 | 0.1% |
| Uruguay | 46 | 0.1% |
| Vietnam | 762 | 1.6% |
| Western Africa | 24 | 0.1% |
| Western Asia | 94 | 0.2% |
| Western Europe | 256 | 0.5% | View All 77 Rows |
Sex and Age in Newark
Sex and Age in Newark
The most populous age groups in Newark are 30 to 34 Years (2,793 | 11.4%) for men and 30 to 34 Years (2,041 | 8.9%) for women.
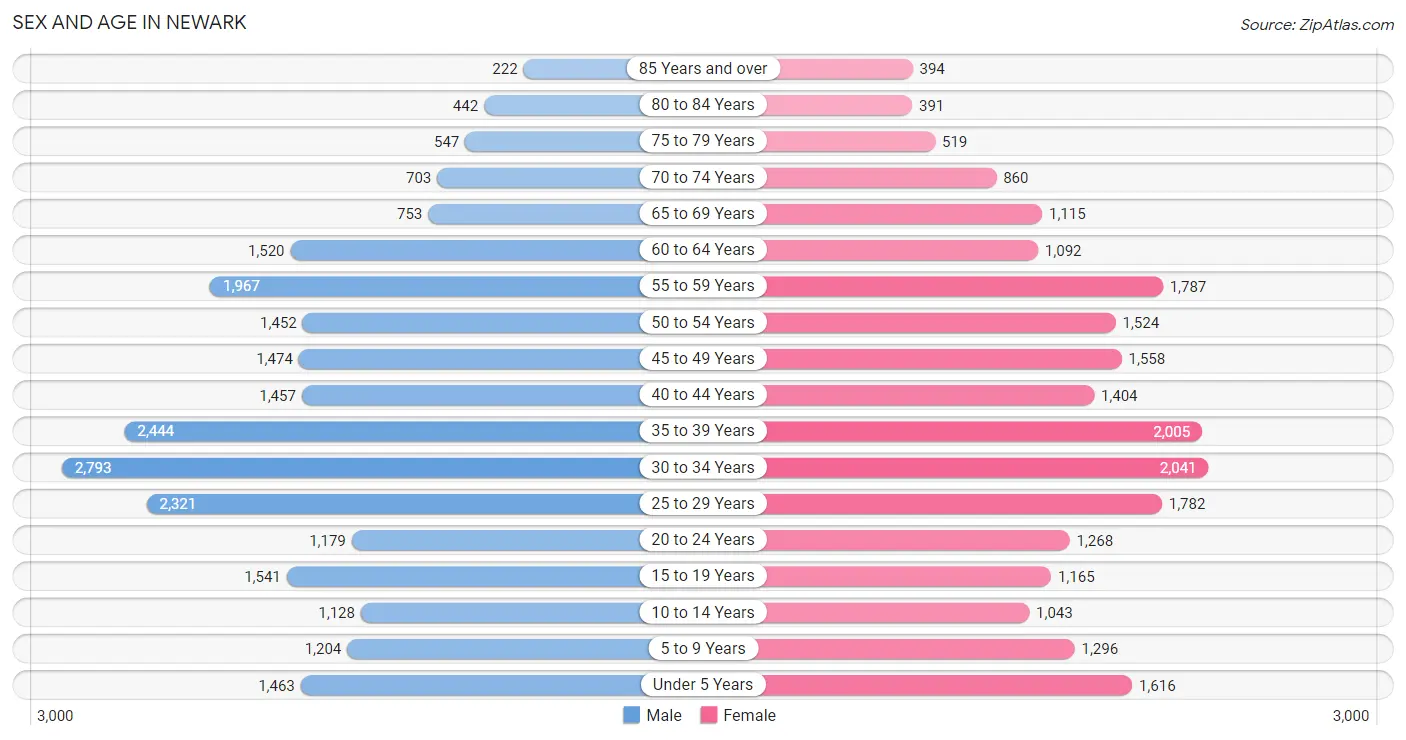
| Age Bracket | Male | Female |
| Under 5 Years | 1,463 (5.9%) | 1,616 (7.1%) |
| 5 to 9 Years | 1,204 (4.9%) | 1,296 (5.7%) |
| 10 to 14 Years | 1,128 (4.6%) | 1,043 (4.6%) |
| 15 to 19 Years | 1,541 (6.3%) | 1,165 (5.1%) |
| 20 to 24 Years | 1,179 (4.8%) | 1,268 (5.6%) |
| 25 to 29 Years | 2,321 (9.4%) | 1,782 (7.8%) |
| 30 to 34 Years | 2,793 (11.4%) | 2,041 (8.9%) |
| 35 to 39 Years | 2,444 (9.9%) | 2,005 (8.8%) |
| 40 to 44 Years | 1,457 (5.9%) | 1,404 (6.1%) |
| 45 to 49 Years | 1,474 (6.0%) | 1,558 (6.8%) |
| 50 to 54 Years | 1,452 (5.9%) | 1,524 (6.7%) |
| 55 to 59 Years | 1,967 (8.0%) | 1,787 (7.8%) |
| 60 to 64 Years | 1,520 (6.2%) | 1,092 (4.8%) |
| 65 to 69 Years | 753 (3.1%) | 1,115 (4.9%) |
| 70 to 74 Years | 703 (2.9%) | 860 (3.8%) |
| 75 to 79 Years | 547 (2.2%) | 519 (2.3%) |
| 80 to 84 Years | 442 (1.8%) | 391 (1.7%) |
| 85 Years and over | 222 (0.9%) | 394 (1.7%) |
| Total | 24,610 (100.0%) | 22,860 (100.0%) |
Families and Households in Newark
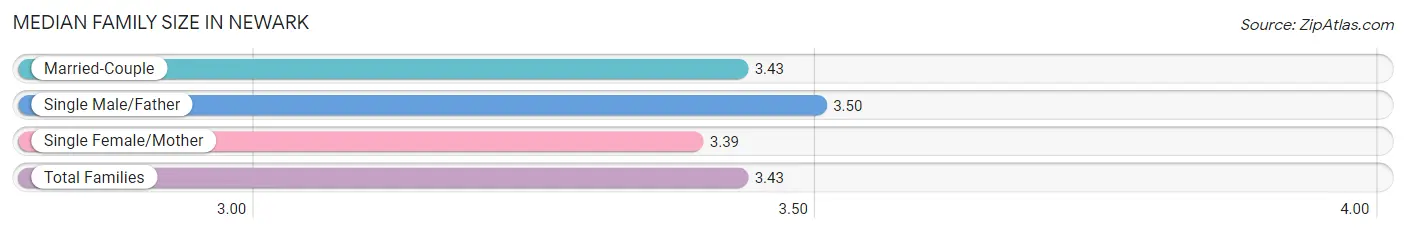
Median Family Size in Newark
The median family size in Newark is 3.43 persons per family, with single male/father families (912 | 7.6%) accounting for the largest median family size of 3.5 persons per family. On the other hand, single female/mother families (1,684 | 14.1%) represent the smallest median family size with 3.39 persons per family.
| Family Type | # Families | Family Size |
| Married-Couple | 9,376 (78.3%) | 3.43 |
| Single Male/Father | 912 (7.6%) | 3.50 |
| Single Female/Mother | 1,684 (14.1%) | 3.39 |
| Total Families | 11,972 (100.0%) | 3.43 |
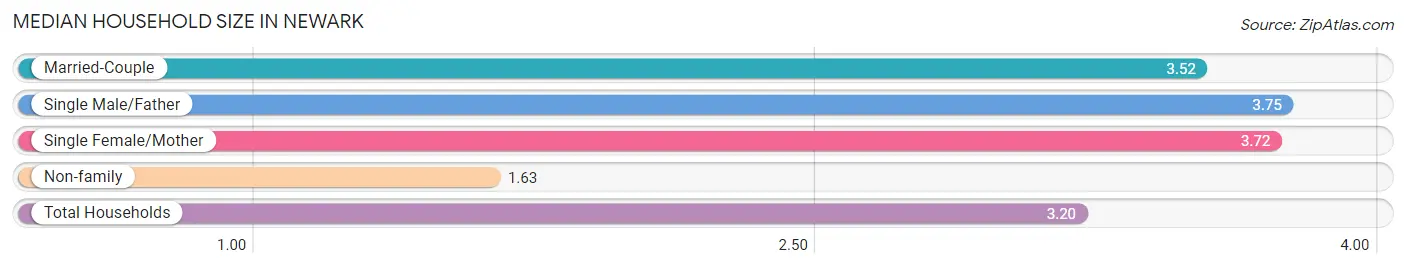
Median Household Size in Newark
The median household size in Newark is 3.20 persons per household, with single male/father households (912 | 6.2%) accounting for the largest median household size of 3.75 persons per household. non-family households (2,833 | 19.1%) represent the smallest median household size with 1.63 persons per household.
| Household Type | # Households | Household Size |
| Married-Couple | 9,376 (63.3%) | 3.52 |
| Single Male/Father | 912 (6.2%) | 3.75 |
| Single Female/Mother | 1,684 (11.4%) | 3.72 |
| Non-family | 2,833 (19.1%) | 1.63 |
| Total Households | 14,805 (100.0%) | 3.20 |
Household Size by Marriage Status in Newark
Out of a total of 14,805 households in Newark, 11,972 (80.9%) are family households, while 2,833 (19.1%) are nonfamily households. The most numerous type of family households are 2-person households, comprising 4,340, and the most common type of nonfamily households are 1-person households, comprising 1,913.
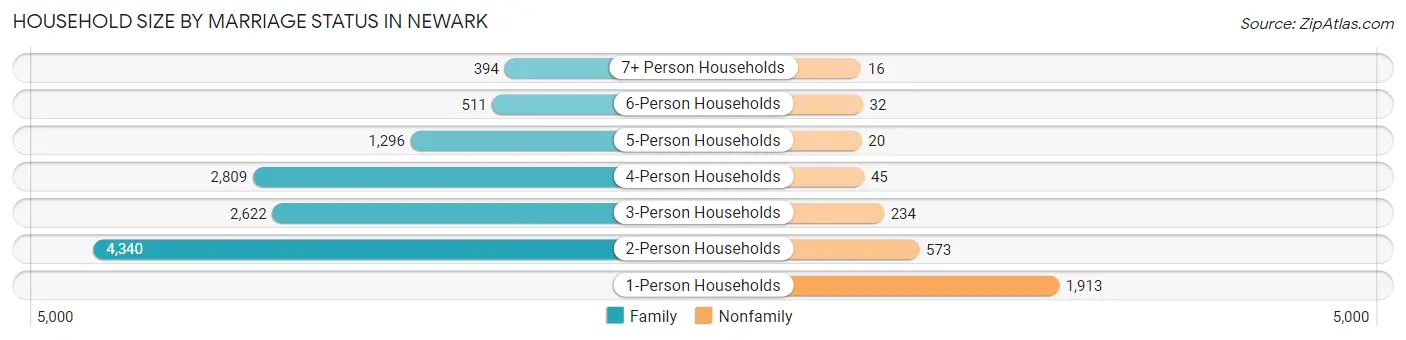
| Household Size | Family Households | Nonfamily Households |
| 1-Person Households | - | 1,913 (12.9%) |
| 2-Person Households | 4,340 (29.3%) | 573 (3.9%) |
| 3-Person Households | 2,622 (17.7%) | 234 (1.6%) |
| 4-Person Households | 2,809 (19.0%) | 45 (0.3%) |
| 5-Person Households | 1,296 (8.7%) | 20 (0.1%) |
| 6-Person Households | 511 (3.5%) | 32 (0.2%) |
| 7+ Person Households | 394 (2.7%) | 16 (0.1%) |
| Total | 11,972 (80.9%) | 2,833 (19.1%) |
Female Fertility in Newark
Fertility by Age in Newark
Average fertility rate in Newark is 74.0 births per 1,000 women. Women in the age bracket of 20 to 34 years have the highest fertility rate with 131.0 births per 1,000 women. Women in the age bracket of 20 to 34 years acount for 78.1% of all women with births.
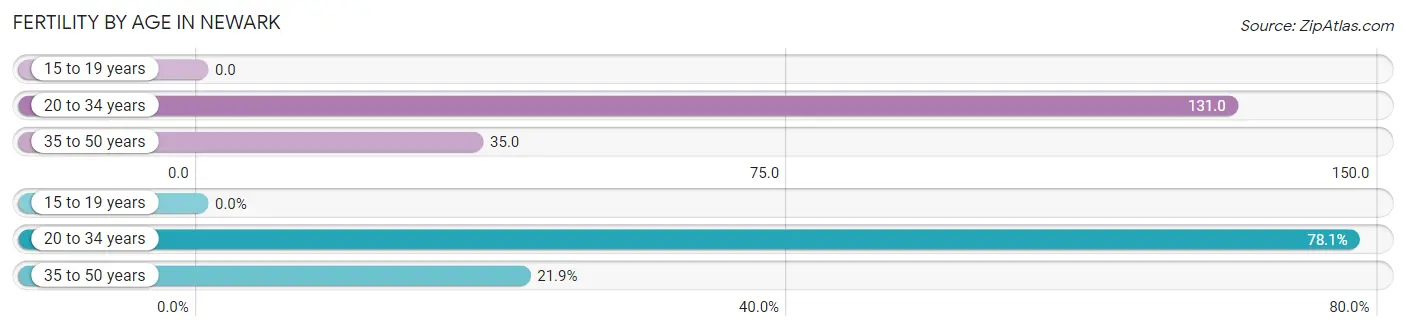
| Age Bracket | Women with Births | Births / 1,000 Women |
| 15 to 19 years | 0 (0.0%) | 0.0 |
| 20 to 34 years | 668 (78.1%) | 131.0 |
| 35 to 50 years | 187 (21.9%) | 35.0 |
| Total | 855 (100.0%) | 74.0 |
Fertility by Age by Marriage Status in Newark
83.3% of women with births (855) in Newark are married. The highest percentage of unmarried women with births falls into 35 to 50 years age bracket with 31.6% of them unmarried at the time of birth, while the lowest percentage of unmarried women with births belong to 20 to 34 years age bracket with 12.6% of them unmarried.
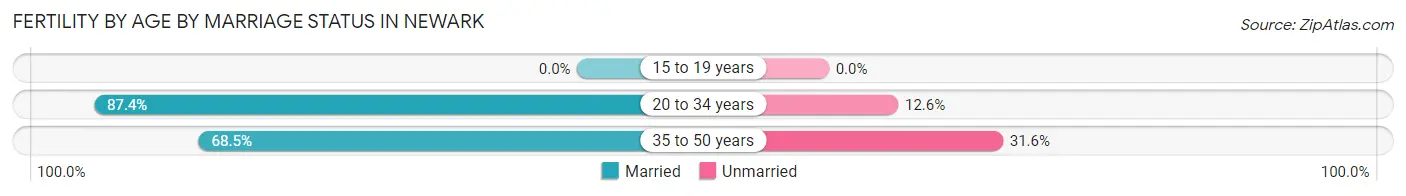
| Age Bracket | Married | Unmarried |
| 15 to 19 years | 0 (0.0%) | 0 (0.0%) |
| 20 to 34 years | 584 (87.4%) | 84 (12.6%) |
| 35 to 50 years | 128 (68.4%) | 59 (31.6%) |
| Total | 712 (83.3%) | 143 (16.7%) |
Fertility by Education in Newark
Average fertility rate in Newark is 74.0 births per 1,000 women. Women with the education attainment of graduate degree have the highest fertility rate of 149.0 births per 1,000 women, while women with the education attainment of high school diploma have the lowest fertility at 26.0 births per 1,000 women. Women with the education attainment of graduate degree represent 47.5% of all women with births.
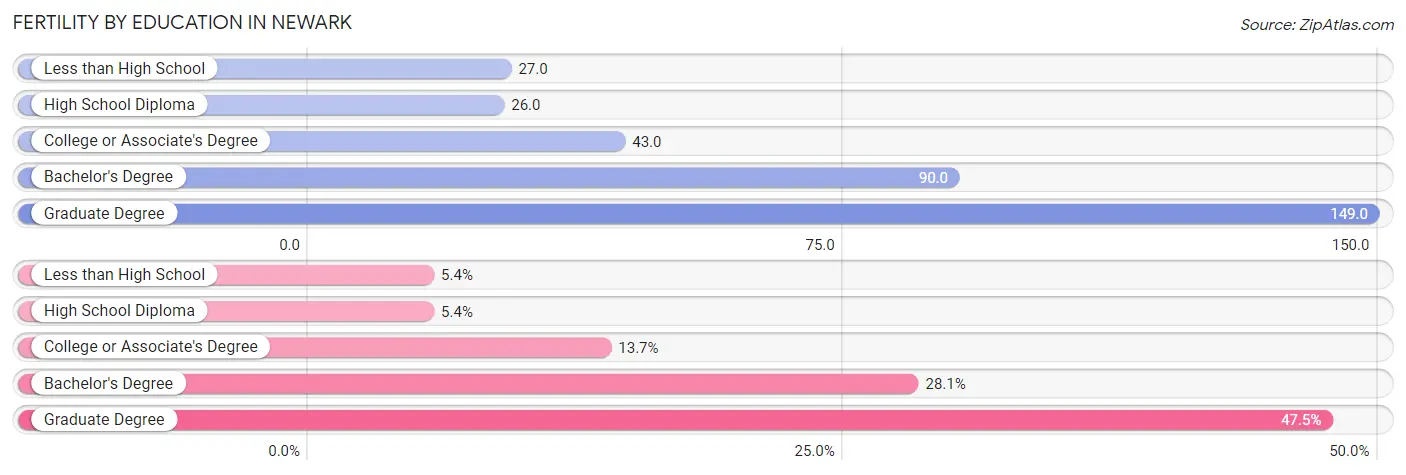
| Educational Attainment | Women with Births | Births / 1,000 Women |
| Less than High School | 46 (5.4%) | 27.0 |
| High School Diploma | 46 (5.4%) | 26.0 |
| College or Associate's Degree | 117 (13.7%) | 43.0 |
| Bachelor's Degree | 240 (28.1%) | 90.0 |
| Graduate Degree | 406 (47.5%) | 149.0 |
| Total | 855 (100.0%) | 74.0 |
Fertility by Education by Marriage Status in Newark
16.7% of women with births in Newark are unmarried. Women with the educational attainment of graduate degree are most likely to be married with 100.0% of them married at childbirth, while women with the educational attainment of less than high school are least likely to be married with 100.0% of them unmarried at childbirth.
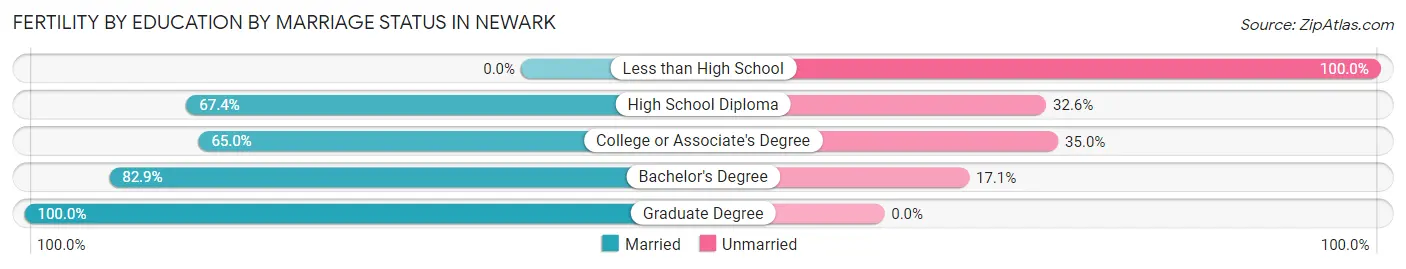
| Educational Attainment | Married | Unmarried |
| Less than High School | 0 (0.0%) | 46 (100.0%) |
| High School Diploma | 31 (67.4%) | 15 (32.6%) |
| College or Associate's Degree | 76 (65.0%) | 41 (35.0%) |
| Bachelor's Degree | 199 (82.9%) | 41 (17.1%) |
| Graduate Degree | 406 (100.0%) | 0 (0.0%) |
| Total | 712 (83.3%) | 143 (16.7%) |
Employment Characteristics in Newark
Employment by Class of Employer in Newark
Among the 24,300 employed individuals in Newark, private company employees (18,216 | 75.0%), not-for-profit organizations (1,591 | 6.6%), and local government employees (1,556 | 6.4%) make up the most common classes of employment.
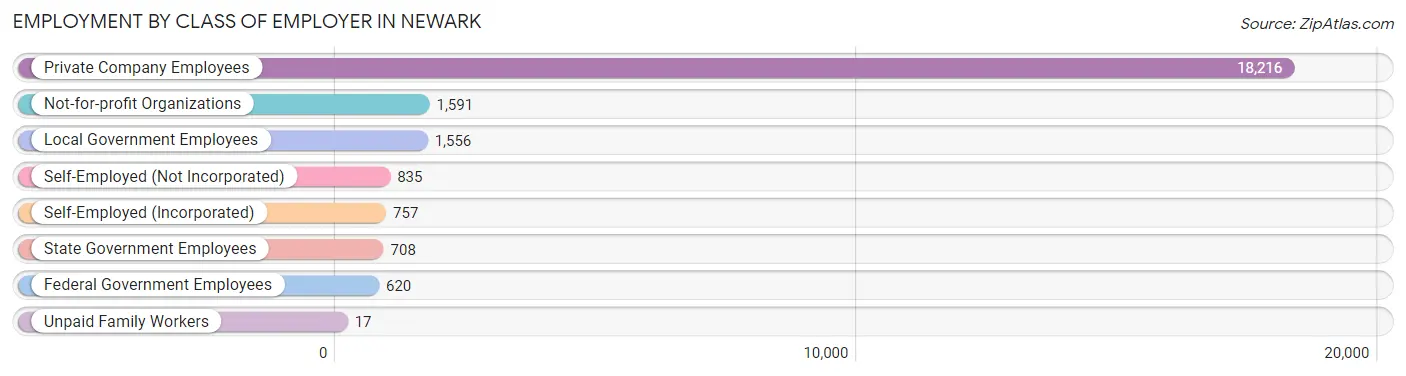
| Employer Class | # Employees | % Employees |
| Private Company Employees | 18,216 | 75.0% |
| Self-Employed (Incorporated) | 757 | 3.1% |
| Self-Employed (Not Incorporated) | 835 | 3.4% |
| Not-for-profit Organizations | 1,591 | 6.6% |
| Local Government Employees | 1,556 | 6.4% |
| State Government Employees | 708 | 2.9% |
| Federal Government Employees | 620 | 2.5% |
| Unpaid Family Workers | 17 | 0.1% |
| Total | 24,300 | 100.0% |
Employment Status by Age in Newark
According to the labor force statistics for Newark, out of the total population over 16 years of age (39,231), 71.6% or 28,089 individuals are in the labor force, with 4.5% or 1,264 of them unemployed. The age group with the highest labor force participation rate is 35 to 44 years, with 91.3% or 6,674 individuals in the labor force. Within the labor force, the 60 to 64 years age range has the highest percentage of unemployed individuals, with 6.5% or 118 of them being unemployed.
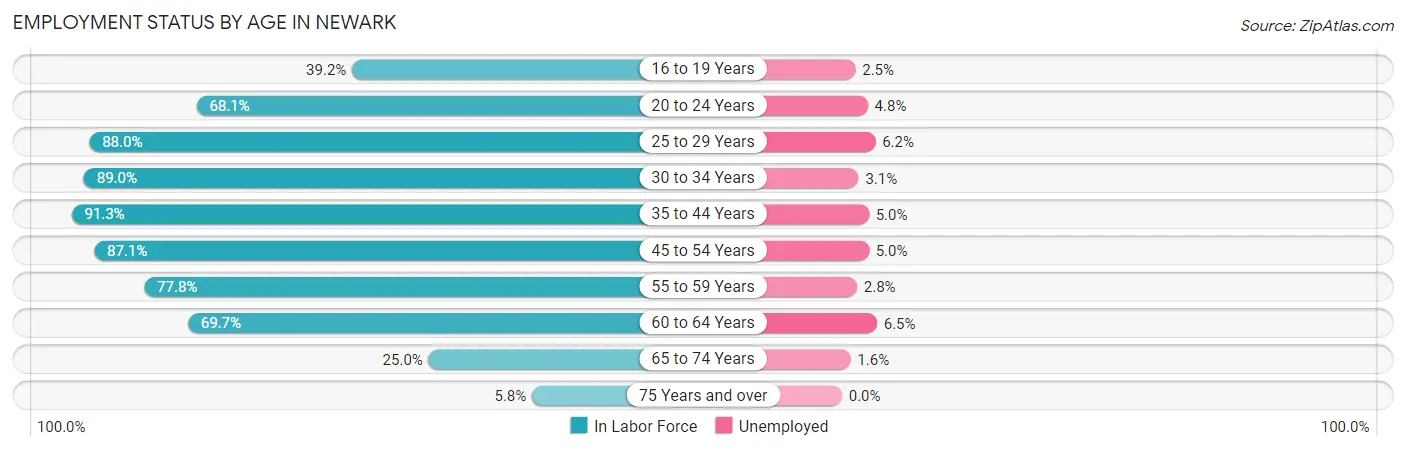
| Age Bracket | In Labor Force | Unemployed |
| 16 to 19 Years | 869 (39.2%) | 22 (2.5%) |
| 20 to 24 Years | 1,666 (68.1%) | 80 (4.8%) |
| 25 to 29 Years | 3,611 (88.0%) | 224 (6.2%) |
| 30 to 34 Years | 4,302 (89.0%) | 133 (3.1%) |
| 35 to 44 Years | 6,674 (91.3%) | 334 (5.0%) |
| 45 to 54 Years | 5,233 (87.1%) | 262 (5.0%) |
| 55 to 59 Years | 2,921 (77.8%) | 82 (2.8%) |
| 60 to 64 Years | 1,821 (69.7%) | 118 (6.5%) |
| 65 to 74 Years | 858 (25.0%) | 14 (1.6%) |
| 75 Years and over | 146 (5.8%) | 0 (0.0%) |
| Total | 28,089 (71.6%) | 1,264 (4.5%) |
Employment Status by Educational Attainment in Newark
According to labor force statistics for Newark, 85.8% of individuals (24,557) out of the total population between 25 and 64 years of age (28,621) are in the labor force, with 4.7% or 1,154 of them being unemployed. The group with the highest labor force participation rate are those with the educational attainment of bachelor's degree or higher, with 90.1% or 12,054 individuals in the labor force. Within the labor force, individuals with less than high school education have the highest percentage of unemployment, with 10.6% or 206 of them being unemployed.
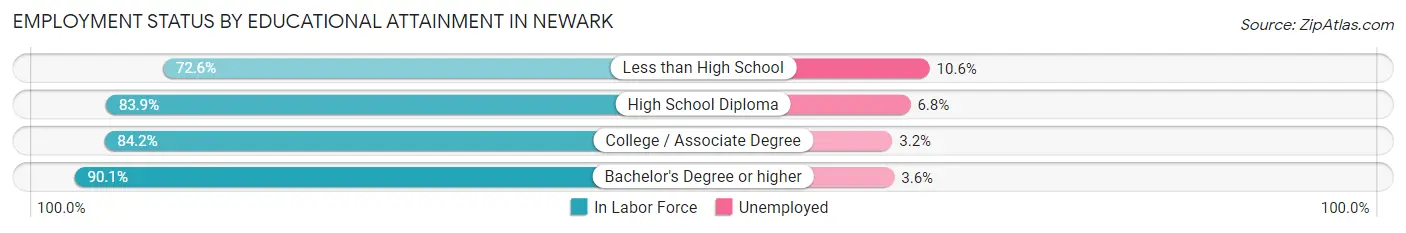
| Educational Attainment | In Labor Force | Unemployed |
| Less than High School | 1,947 (72.6%) | 284 (10.6%) |
| High School Diploma | 4,698 (83.9%) | 381 (6.8%) |
| College / Associate Degree | 5,862 (84.2%) | 223 (3.2%) |
| Bachelor's Degree or higher | 12,054 (90.1%) | 482 (3.6%) |
| Total | 24,557 (85.8%) | 1,345 (4.7%) |
Employment Occupations by Sex in Newark
Management, Business, Science and Arts Occupations
The most common Management, Business, Science and Arts occupations in Newark are Computers, Engineering & Science (5,085 | 19.0%), Management (3,347 | 12.5%), Computers & Mathematics (3,069 | 11.5%), Business & Financial (2,004 | 7.5%), and Community & Social Service (1,747 | 6.5%).
Management, Business, Science and Arts Occupations by Sex
Within the Management, Business, Science and Arts occupations in Newark, the most male-oriented occupations are Architecture & Engineering (81.2%), Computers, Engineering & Science (71.8%), and Computers & Mathematics (71.5%), while the most female-oriented occupations are Education Instruction & Library (76.2%), Education, Arts & Media (72.0%), and Legal Services & Support (70.2%).
| Occupation | Male | Female |
| Management | 1,796 (53.7%) | 1,551 (46.3%) |
| Business & Financial | 862 (43.0%) | 1,142 (57.0%) |
| Computers, Engineering & Science | 3,651 (71.8%) | 1,434 (28.2%) |
| Computers & Mathematics | 2,194 (71.5%) | 875 (28.5%) |
| Architecture & Engineering | 1,304 (81.2%) | 302 (18.8%) |
| Life, Physical & Social Science | 153 (37.3%) | 257 (62.7%) |
| Community & Social Service | 528 (30.2%) | 1,219 (69.8%) |
| Education, Arts & Media | 81 (28.0%) | 208 (72.0%) |
| Legal Services & Support | 65 (29.8%) | 153 (70.2%) |
| Education Instruction & Library | 204 (23.8%) | 652 (76.2%) |
| Arts, Media & Entertainment | 178 (46.4%) | 206 (53.6%) |
| Health Diagnosing & Treating | 460 (33.3%) | 921 (66.7%) |
| Health Technologists | 341 (36.4%) | 595 (63.6%) |
| Total (Category) | 7,297 (53.8%) | 6,267 (46.2%) |
| Total (Overall) | 15,230 (56.9%) | 11,559 (43.1%) |
Services Occupations
The most common Services occupations in Newark are Healthcare Support (1,078 | 4.0%), Food Preparation & Serving (870 | 3.3%), Cleaning & Maintenance (757 | 2.8%), Personal Care & Service (580 | 2.2%), and Security & Protection (398 | 1.5%).
Services Occupations by Sex
Within the Services occupations in Newark, the most male-oriented occupations are Law Enforcement (100.0%), Security & Protection (87.9%), and Firefighting & Prevention (79.5%), while the most female-oriented occupations are Personal Care & Service (86.4%), Healthcare Support (73.3%), and Food Preparation & Serving (51.4%).
| Occupation | Male | Female |
| Healthcare Support | 288 (26.7%) | 790 (73.3%) |
| Security & Protection | 350 (87.9%) | 48 (12.1%) |
| Firefighting & Prevention | 186 (79.5%) | 48 (20.5%) |
| Law Enforcement | 164 (100.0%) | 0 (0.0%) |
| Food Preparation & Serving | 423 (48.6%) | 447 (51.4%) |
| Cleaning & Maintenance | 565 (74.6%) | 192 (25.4%) |
| Personal Care & Service | 79 (13.6%) | 501 (86.4%) |
| Total (Category) | 1,705 (46.3%) | 1,978 (53.7%) |
| Total (Overall) | 15,230 (56.9%) | 11,559 (43.1%) |
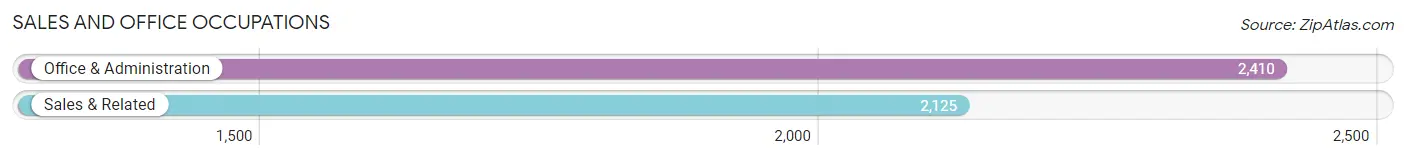
Sales and Office Occupations
The most common Sales and Office occupations in Newark are Office & Administration (2,410 | 9.0%), and Sales & Related (2,125 | 7.9%).
Sales and Office Occupations by Sex
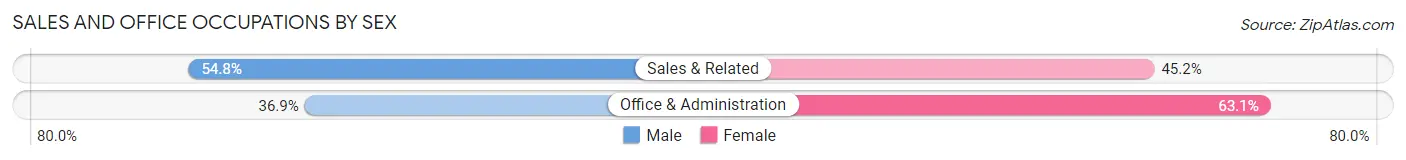
| Occupation | Male | Female |
| Sales & Related | 1,164 (54.8%) | 961 (45.2%) |
| Office & Administration | 890 (36.9%) | 1,520 (63.1%) |
| Total (Category) | 2,054 (45.3%) | 2,481 (54.7%) |
| Total (Overall) | 15,230 (56.9%) | 11,559 (43.1%) |
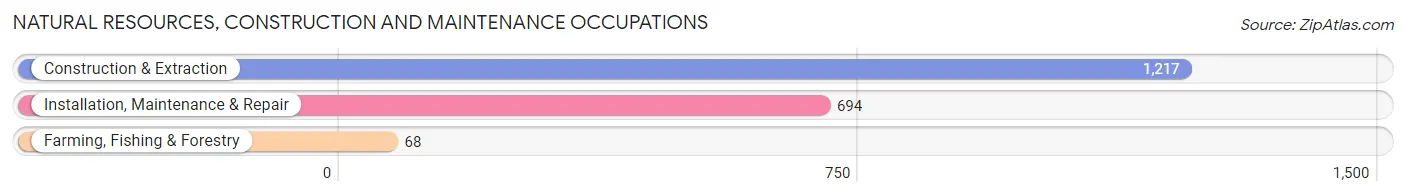
Natural Resources, Construction and Maintenance Occupations
The most common Natural Resources, Construction and Maintenance occupations in Newark are Construction & Extraction (1,217 | 4.5%), Installation, Maintenance & Repair (694 | 2.6%), and Farming, Fishing & Forestry (68 | 0.3%).
Natural Resources, Construction and Maintenance Occupations by Sex
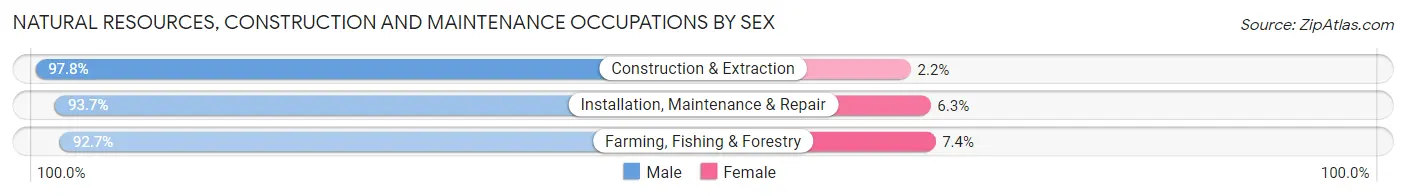
| Occupation | Male | Female |
| Farming, Fishing & Forestry | 63 (92.6%) | 5 (7.3%) |
| Construction & Extraction | 1,190 (97.8%) | 27 (2.2%) |
| Installation, Maintenance & Repair | 650 (93.7%) | 44 (6.3%) |
| Total (Category) | 1,903 (96.2%) | 76 (3.8%) |
| Total (Overall) | 15,230 (56.9%) | 11,559 (43.1%) |
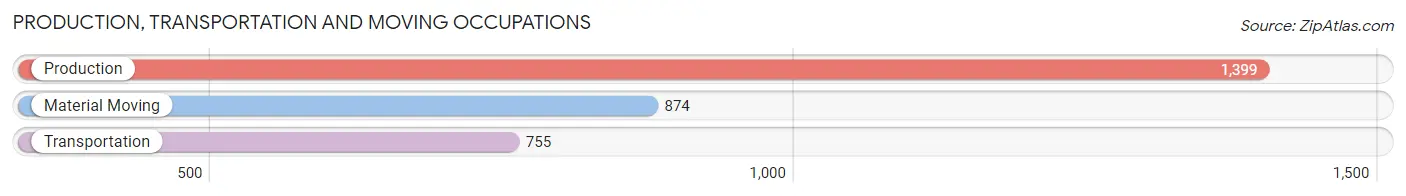
Production, Transportation and Moving Occupations
The most common Production, Transportation and Moving occupations in Newark are Production (1,399 | 5.2%), Material Moving (874 | 3.3%), and Transportation (755 | 2.8%).
Production, Transportation and Moving Occupations by Sex
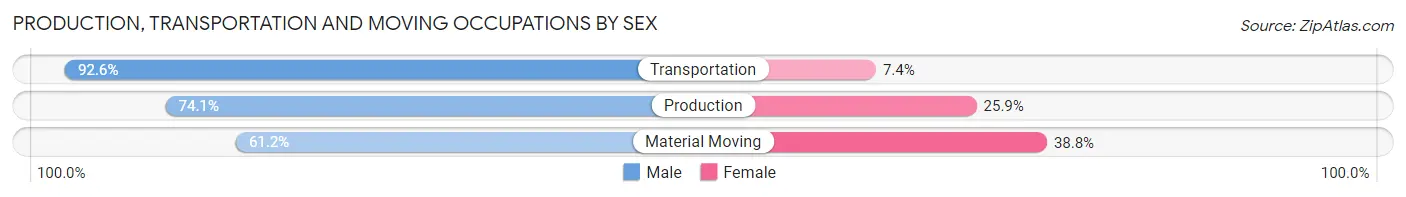
| Occupation | Male | Female |
| Production | 1,037 (74.1%) | 362 (25.9%) |
| Transportation | 699 (92.6%) | 56 (7.4%) |
| Material Moving | 535 (61.2%) | 339 (38.8%) |
| Total (Category) | 2,271 (75.0%) | 757 (25.0%) |
| Total (Overall) | 15,230 (56.9%) | 11,559 (43.1%) |
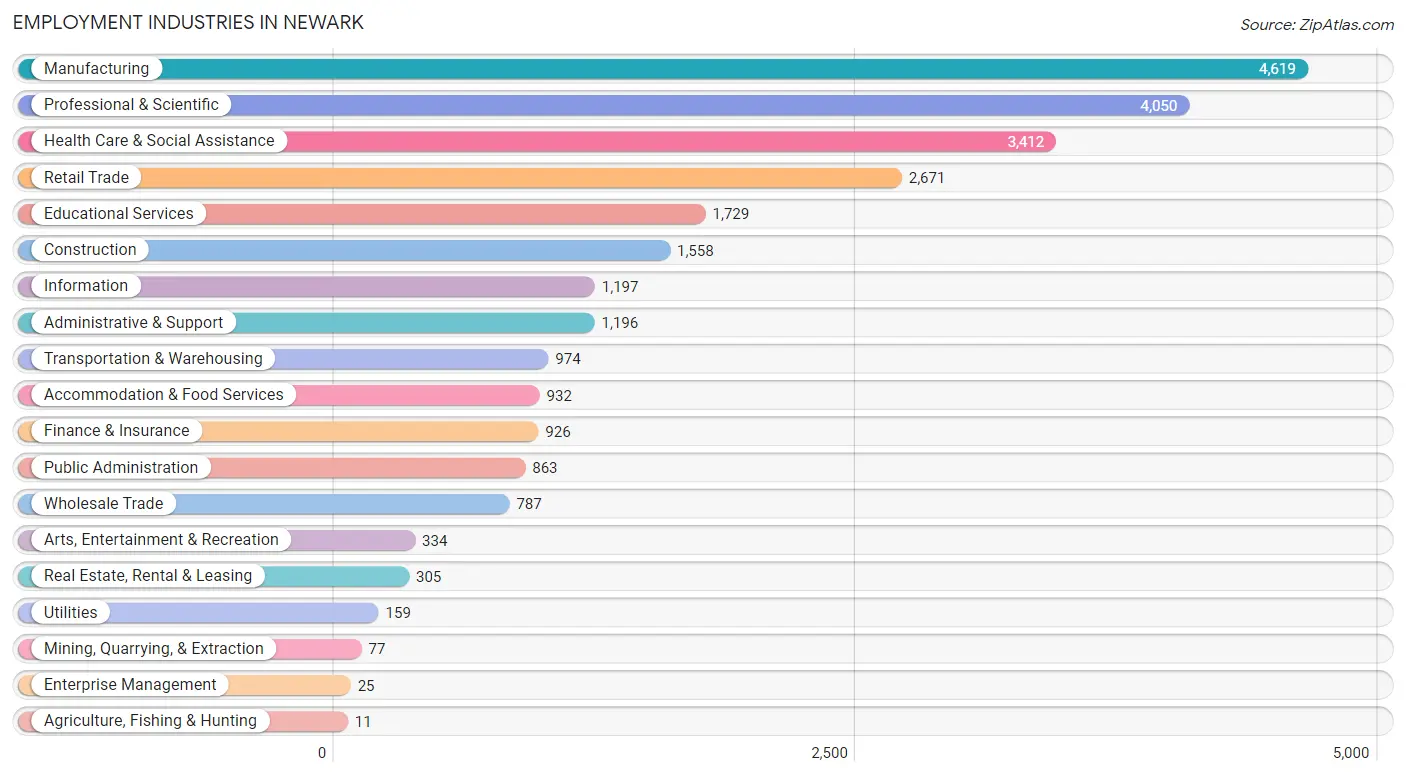
Employment Industries by Sex in Newark
Employment Industries in Newark
The major employment industries in Newark include Manufacturing (4,619 | 17.2%), Professional & Scientific (4,050 | 15.1%), Health Care & Social Assistance (3,412 | 12.7%), Retail Trade (2,671 | 10.0%), and Educational Services (1,729 | 6.5%).
Employment Industries by Sex in Newark
The Newark industries that see more men than women are Mining, Quarrying, & Extraction (100.0%), Construction (90.0%), and Utilities (85.5%), whereas the industries that tend to have a higher number of women are Enterprise Management (100.0%), Health Care & Social Assistance (70.4%), and Real Estate, Rental & Leasing (63.6%).
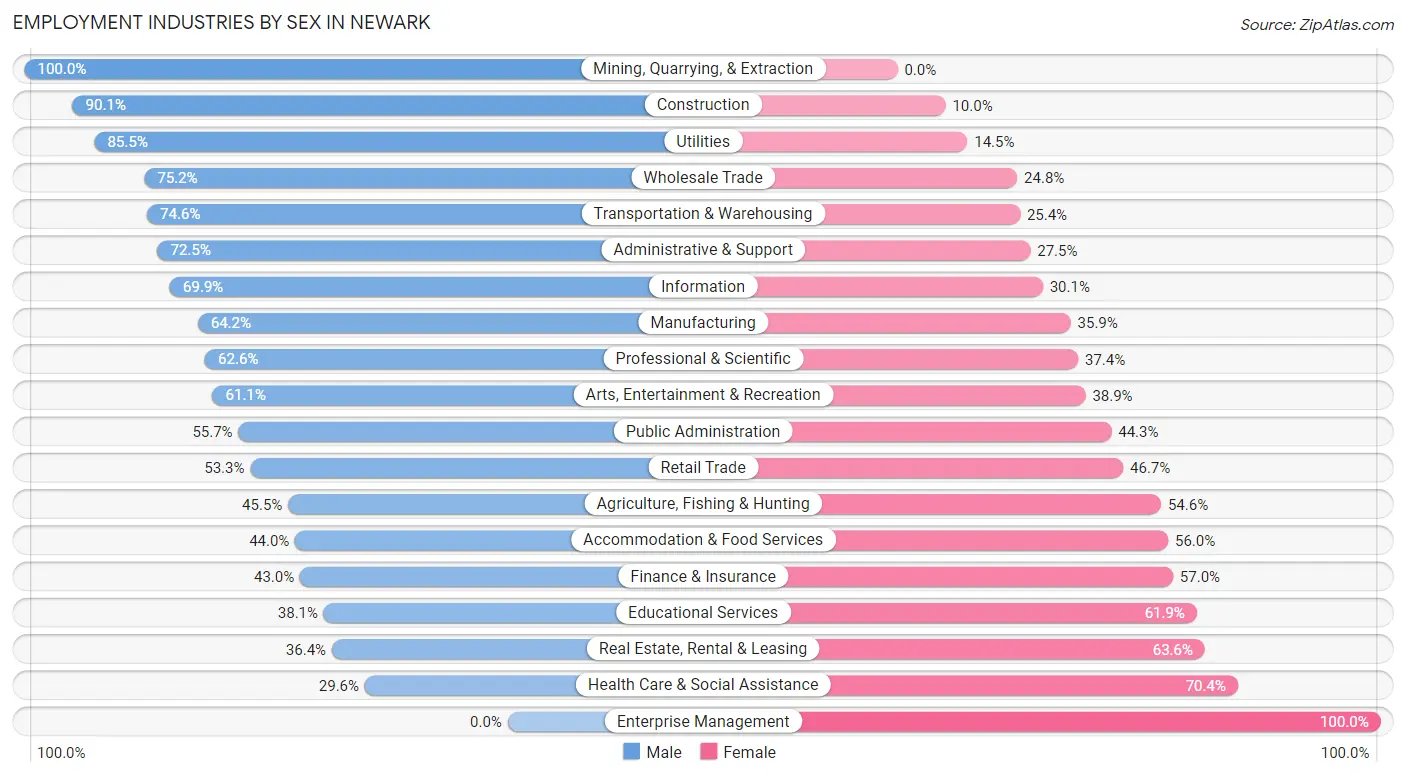
| Industry | Male | Female |
| Agriculture, Fishing & Hunting | 5 (45.5%) | 6 (54.5%) |
| Mining, Quarrying, & Extraction | 77 (100.0%) | 0 (0.0%) |
| Construction | 1,403 (90.0%) | 155 (10.0%) |
| Manufacturing | 2,963 (64.1%) | 1,656 (35.8%) |
| Wholesale Trade | 592 (75.2%) | 195 (24.8%) |
| Retail Trade | 1,423 (53.3%) | 1,248 (46.7%) |
| Transportation & Warehousing | 727 (74.6%) | 247 (25.4%) |
| Utilities | 136 (85.5%) | 23 (14.5%) |
| Information | 837 (69.9%) | 360 (30.1%) |
| Finance & Insurance | 398 (43.0%) | 528 (57.0%) |
| Real Estate, Rental & Leasing | 111 (36.4%) | 194 (63.6%) |
| Professional & Scientific | 2,536 (62.6%) | 1,514 (37.4%) |
| Enterprise Management | 0 (0.0%) | 25 (100.0%) |
| Administrative & Support | 867 (72.5%) | 329 (27.5%) |
| Educational Services | 658 (38.1%) | 1,071 (61.9%) |
| Health Care & Social Assistance | 1,009 (29.6%) | 2,403 (70.4%) |
| Arts, Entertainment & Recreation | 204 (61.1%) | 130 (38.9%) |
| Accommodation & Food Services | 410 (44.0%) | 522 (56.0%) |
| Public Administration | 481 (55.7%) | 382 (44.3%) |
| Total | 15,230 (56.9%) | 11,559 (43.1%) |
Education in Newark
School Enrollment in Newark
The most common levels of schooling among the 9,981 students in Newark are college / undergraduate (2,381 | 23.9%), high school (2,143 | 21.5%), and elementary school (1,869 | 18.7%).
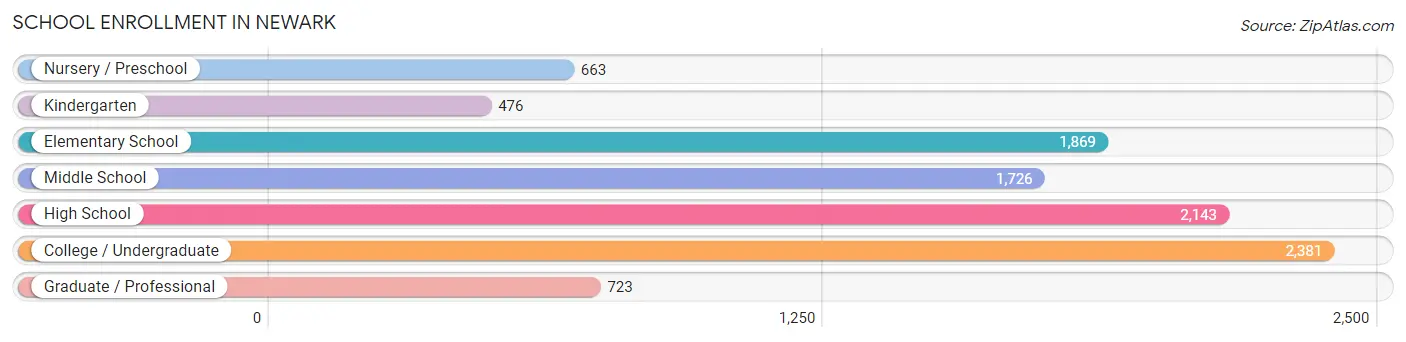
| School Level | # Students | % Students |
| Nursery / Preschool | 663 | 6.6% |
| Kindergarten | 476 | 4.8% |
| Elementary School | 1,869 | 18.7% |
| Middle School | 1,726 | 17.3% |
| High School | 2,143 | 21.5% |
| College / Undergraduate | 2,381 | 23.9% |
| Graduate / Professional | 723 | 7.2% |
| Total | 9,981 | 100.0% |
School Enrollment by Age by Funding Source in Newark
Out of a total of 9,981 students who are enrolled in schools in Newark, 2,026 (20.3%) attend a private institution, while the remaining 7,955 (79.7%) are enrolled in public schools. The age group of 3 to 4 year olds has the highest likelihood of being enrolled in private schools, with 248 (52.5% in the age bracket) enrolled. Conversely, the age group of 18 to 19 year olds has the lowest likelihood of being enrolled in a private school, with 788 (97.5% in the age bracket) attending a public institution.
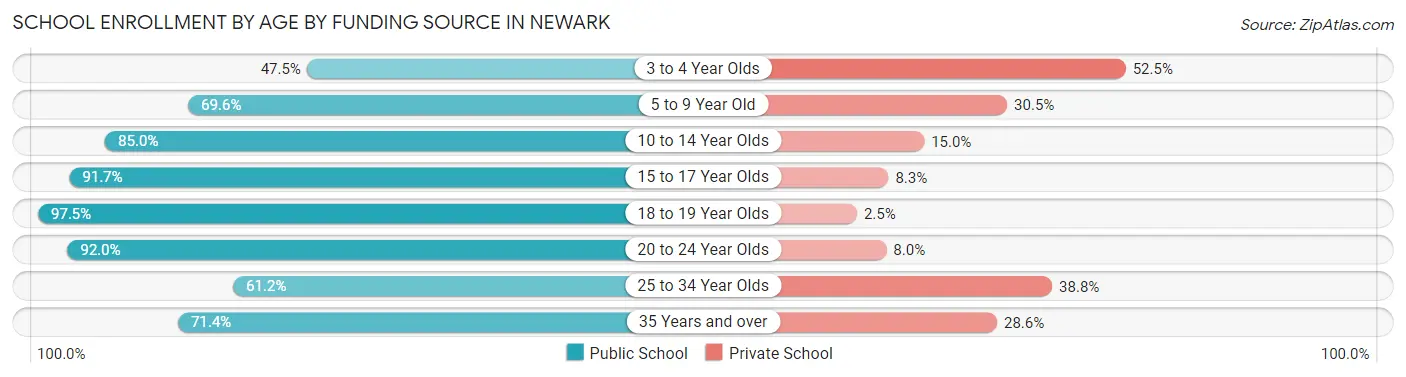
| Age Bracket | Public School | Private School |
| 3 to 4 Year Olds | 224 (47.5%) | 248 (52.5%) |
| 5 to 9 Year Old | 1,638 (69.6%) | 717 (30.4%) |
| 10 to 14 Year Olds | 1,830 (85.0%) | 323 (15.0%) |
| 15 to 17 Year Olds | 1,417 (91.7%) | 129 (8.3%) |
| 18 to 19 Year Olds | 788 (97.5%) | 20 (2.5%) |
| 20 to 24 Year Olds | 1,122 (92.0%) | 97 (8.0%) |
| 25 to 34 Year Olds | 501 (61.2%) | 318 (38.8%) |
| 35 Years and over | 435 (71.4%) | 174 (28.6%) |
| Total | 7,955 (79.7%) | 2,026 (20.3%) |
Educational Attainment by Field of Study in Newark
Engineering (3,391 | 20.8%), business (2,285 | 14.0%), computers & mathematics (2,214 | 13.6%), science & technology (1,721 | 10.6%), and social sciences (1,108 | 6.8%) are the most common fields of study among 16,279 individuals in Newark who have obtained a bachelor's degree or higher.
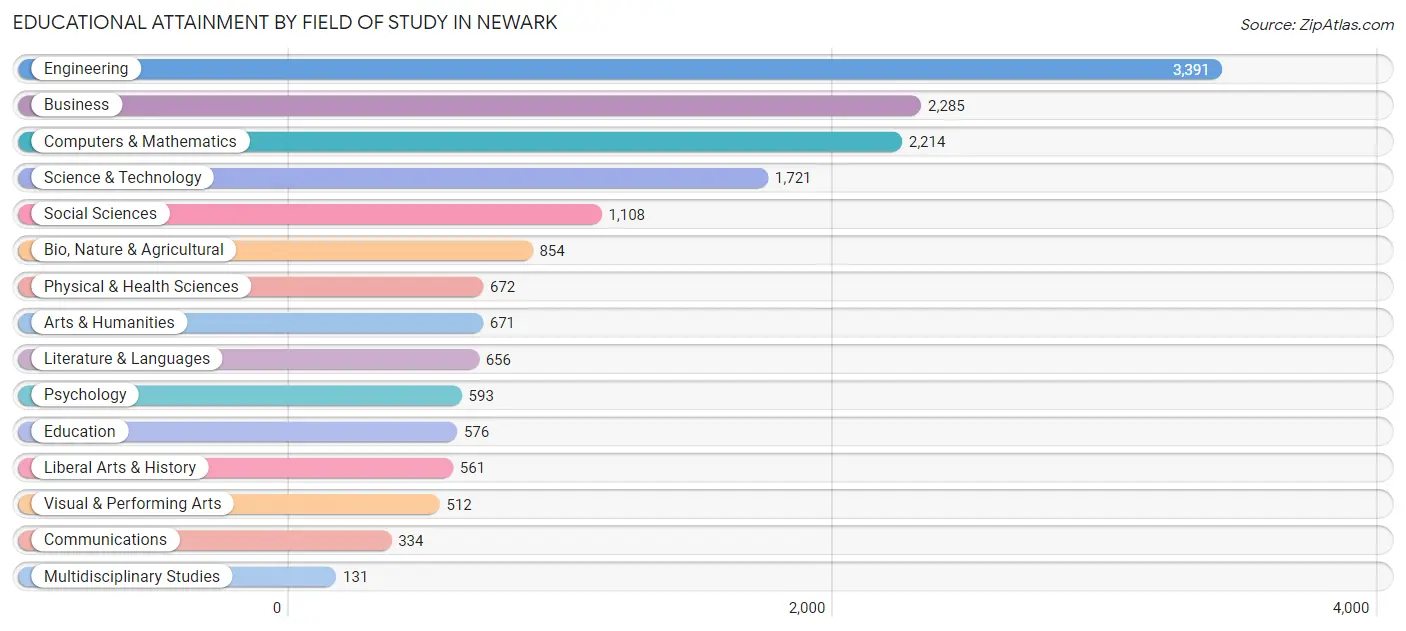
| Field of Study | # Graduates | % Graduates |
| Computers & Mathematics | 2,214 | 13.6% |
| Bio, Nature & Agricultural | 854 | 5.2% |
| Physical & Health Sciences | 672 | 4.1% |
| Psychology | 593 | 3.6% |
| Social Sciences | 1,108 | 6.8% |
| Engineering | 3,391 | 20.8% |
| Multidisciplinary Studies | 131 | 0.8% |
| Science & Technology | 1,721 | 10.6% |
| Business | 2,285 | 14.0% |
| Education | 576 | 3.5% |
| Literature & Languages | 656 | 4.0% |
| Liberal Arts & History | 561 | 3.5% |
| Visual & Performing Arts | 512 | 3.2% |
| Communications | 334 | 2.1% |
| Arts & Humanities | 671 | 4.1% |
| Total | 16,279 | 100.0% |
Transportation & Commute in Newark
Vehicle Availability by Sex in Newark
The most prevalent vehicle ownership categories in Newark are males with 2 vehicles (5,148, accounting for 37.9%) and females with 2 vehicles (4,535, making up 48.1%).
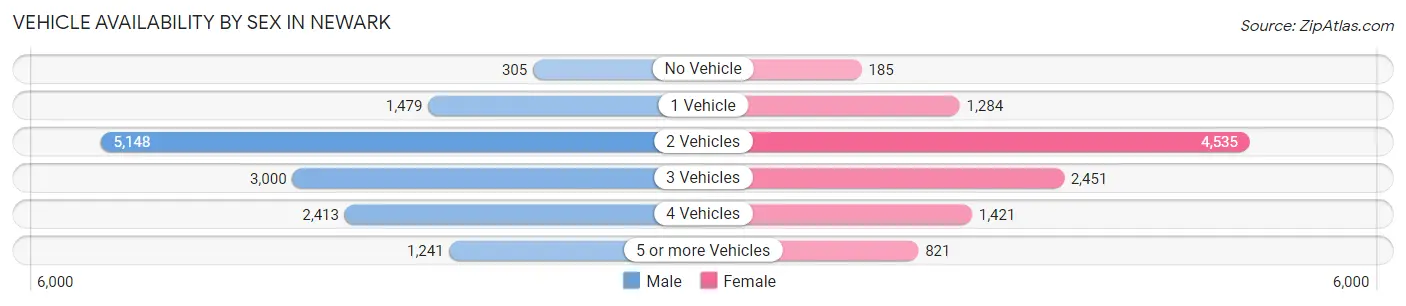
| Vehicles Available | Male | Female |
| No Vehicle | 305 (2.2%) | 185 (1.7%) |
| 1 Vehicle | 1,479 (10.9%) | 1,284 (12.0%) |
| 2 Vehicles | 5,148 (37.9%) | 4,535 (42.4%) |
| 3 Vehicles | 3,000 (22.1%) | 2,451 (22.9%) |
| 4 Vehicles | 2,413 (17.8%) | 1,421 (13.3%) |
| 5 or more Vehicles | 1,241 (9.1%) | 821 (7.7%) |
| Total | 13,586 (100.0%) | 10,697 (100.0%) |
Commute Time in Newark
The most frequently occuring commute durations in Newark are 30 to 34 minutes (3,129 commuters, 16.2%), 20 to 24 minutes (2,679 commuters, 13.9%), and 45 to 59 minutes (2,425 commuters, 12.6%).
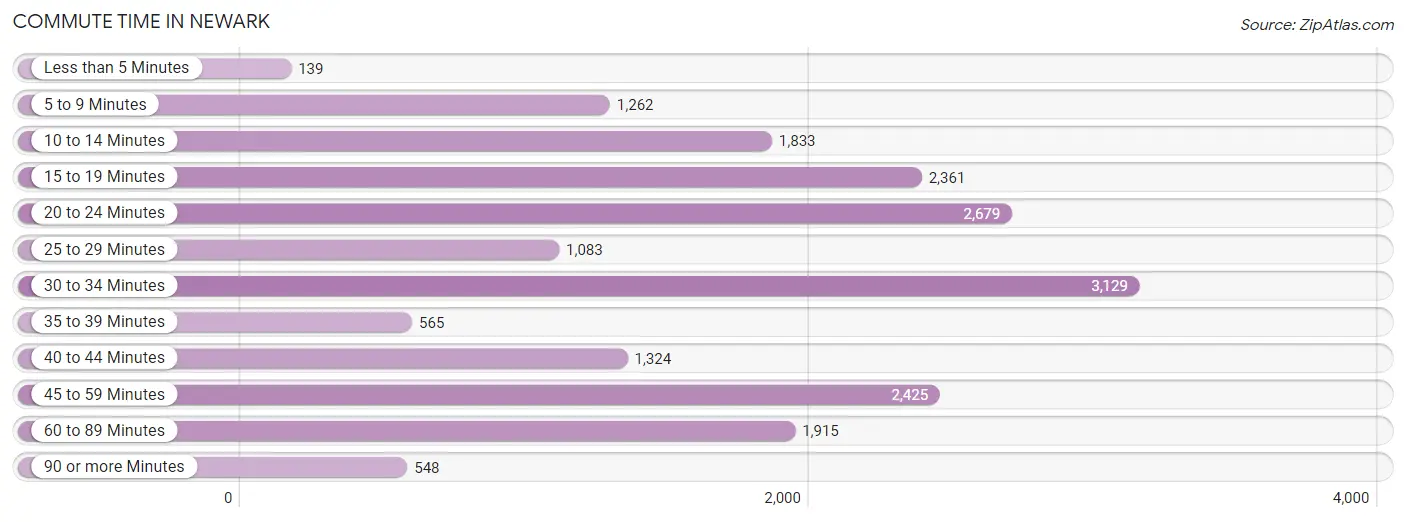
| Commute Time | # Commuters | % Commuters |
| Less than 5 Minutes | 139 | 0.7% |
| 5 to 9 Minutes | 1,262 | 6.6% |
| 10 to 14 Minutes | 1,833 | 9.5% |
| 15 to 19 Minutes | 2,361 | 12.3% |
| 20 to 24 Minutes | 2,679 | 13.9% |
| 25 to 29 Minutes | 1,083 | 5.6% |
| 30 to 34 Minutes | 3,129 | 16.2% |
| 35 to 39 Minutes | 565 | 2.9% |
| 40 to 44 Minutes | 1,324 | 6.9% |
| 45 to 59 Minutes | 2,425 | 12.6% |
| 60 to 89 Minutes | 1,915 | 9.9% |
| 90 or more Minutes | 548 | 2.8% |
Commute Time by Sex in Newark
The most common commute times in Newark are 30 to 34 minutes (1,896 commuters, 17.5%) for males and 30 to 34 minutes (1,233 commuters, 14.7%) for females.
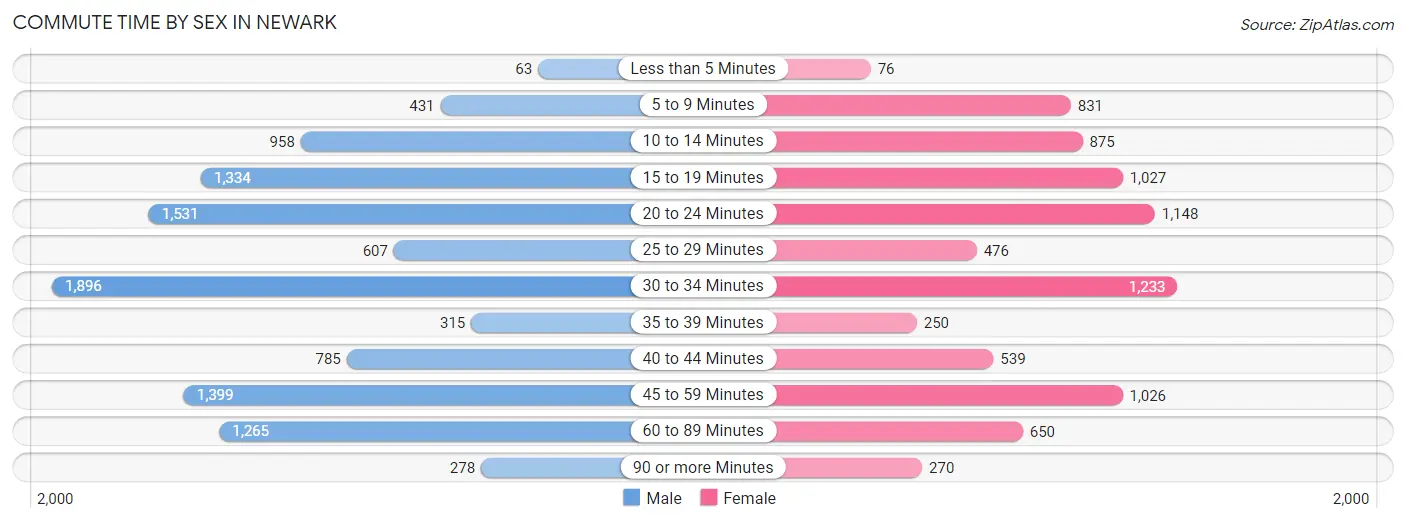
| Commute Time | Male | Female |
| Less than 5 Minutes | 63 (0.6%) | 76 (0.9%) |
| 5 to 9 Minutes | 431 (4.0%) | 831 (9.9%) |
| 10 to 14 Minutes | 958 (8.8%) | 875 (10.4%) |
| 15 to 19 Minutes | 1,334 (12.3%) | 1,027 (12.2%) |
| 20 to 24 Minutes | 1,531 (14.1%) | 1,148 (13.7%) |
| 25 to 29 Minutes | 607 (5.6%) | 476 (5.7%) |
| 30 to 34 Minutes | 1,896 (17.5%) | 1,233 (14.7%) |
| 35 to 39 Minutes | 315 (2.9%) | 250 (3.0%) |
| 40 to 44 Minutes | 785 (7.2%) | 539 (6.4%) |
| 45 to 59 Minutes | 1,399 (12.9%) | 1,026 (12.2%) |
| 60 to 89 Minutes | 1,265 (11.7%) | 650 (7.7%) |
| 90 or more Minutes | 278 (2.6%) | 270 (3.2%) |
Time of Departure to Work by Sex in Newark
The most frequent times of departure to work in Newark are 8:00 AM to 8:29 AM (1,441, 13.3%) for males and 8:00 AM to 8:29 AM (1,433, 17.1%) for females.
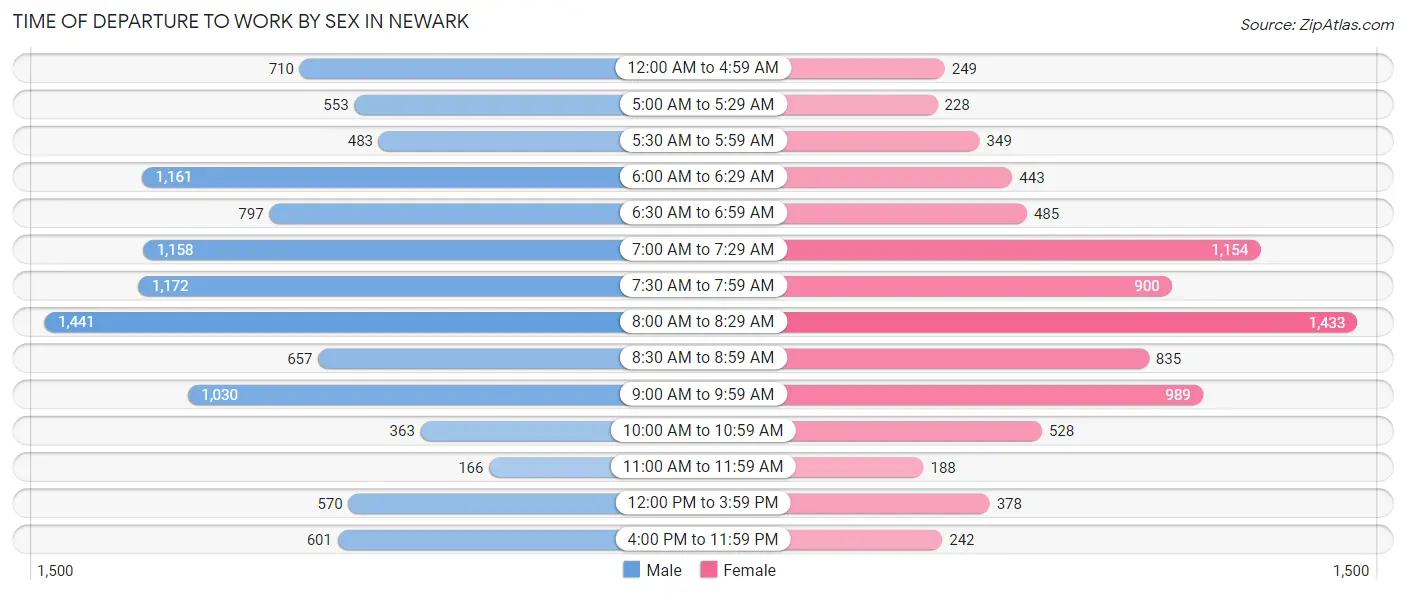
| Time of Departure | Male | Female |
| 12:00 AM to 4:59 AM | 710 (6.5%) | 249 (3.0%) |
| 5:00 AM to 5:29 AM | 553 (5.1%) | 228 (2.7%) |
| 5:30 AM to 5:59 AM | 483 (4.4%) | 349 (4.2%) |
| 6:00 AM to 6:29 AM | 1,161 (10.7%) | 443 (5.3%) |
| 6:30 AM to 6:59 AM | 797 (7.3%) | 485 (5.8%) |
| 7:00 AM to 7:29 AM | 1,158 (10.7%) | 1,154 (13.7%) |
| 7:30 AM to 7:59 AM | 1,172 (10.8%) | 900 (10.7%) |
| 8:00 AM to 8:29 AM | 1,441 (13.3%) | 1,433 (17.1%) |
| 8:30 AM to 8:59 AM | 657 (6.0%) | 835 (9.9%) |
| 9:00 AM to 9:59 AM | 1,030 (9.5%) | 989 (11.8%) |
| 10:00 AM to 10:59 AM | 363 (3.3%) | 528 (6.3%) |
| 11:00 AM to 11:59 AM | 166 (1.5%) | 188 (2.2%) |
| 12:00 PM to 3:59 PM | 570 (5.2%) | 378 (4.5%) |
| 4:00 PM to 11:59 PM | 601 (5.5%) | 242 (2.9%) |
| Total | 10,862 (100.0%) | 8,401 (100.0%) |
Housing Occupancy in Newark
Occupancy by Ownership in Newark
Of the total 14,805 dwellings in Newark, owner-occupied units account for 10,290 (69.5%), while renter-occupied units make up 4,515 (30.5%).
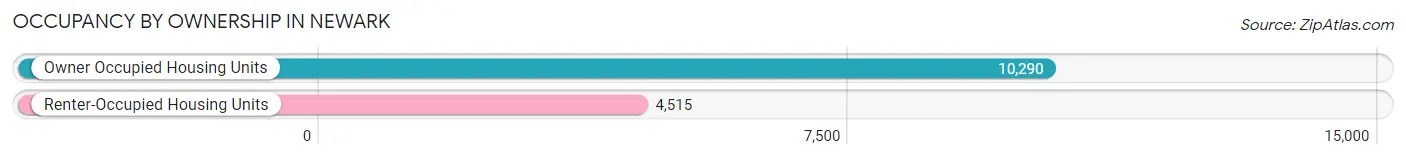
| Occupancy | # Housing Units | % Housing Units |
| Owner Occupied Housing Units | 10,290 | 69.5% |
| Renter-Occupied Housing Units | 4,515 | 30.5% |
| Total Occupied Housing Units | 14,805 | 100.0% |
Occupancy by Household Size in Newark
| Household Size | # Housing Units | % Housing Units |
| 1-Person Household | 1,913 | 12.9% |
| 2-Person Household | 4,913 | 33.2% |
| 3-Person Household | 2,856 | 19.3% |
| 4+ Person Household | 5,123 | 34.6% |
| Total Housing Units | 14,805 | 100.0% |
Occupancy by Ownership by Household Size in Newark
| Household Size | Owner-occupied | Renter-occupied |
| 1-Person Household | 1,334 (69.7%) | 579 (30.3%) |
| 2-Person Household | 3,635 (74.0%) | 1,278 (26.0%) |
| 3-Person Household | 2,110 (73.9%) | 746 (26.1%) |
| 4+ Person Household | 3,211 (62.7%) | 1,912 (37.3%) |
| Total Housing Units | 10,290 (69.5%) | 4,515 (30.5%) |
Occupancy by Educational Attainment in Newark
| Household Size | Owner-occupied | Renter-occupied |
| Less than High School | 429 (38.0%) | 700 (62.0%) |
| High School Diploma | 1,306 (52.1%) | 1,200 (47.9%) |
| College/Associate Degree | 2,799 (70.9%) | 1,148 (29.1%) |
| Bachelor's Degree or higher | 5,756 (79.7%) | 1,467 (20.3%) |
Occupancy by Age of Householder in Newark
| Age Bracket | # Households | % Households |
| Under 35 Years | 2,808 | 19.0% |
| 35 to 44 Years | 3,123 | 21.1% |
| 45 to 54 Years | 2,735 | 18.5% |
| 55 to 64 Years | 3,204 | 21.6% |
| 65 to 74 Years | 1,649 | 11.1% |
| 75 to 84 Years | 963 | 6.5% |
| 85 Years and Over | 323 | 2.2% |
| Total | 14,805 | 100.0% |
Housing Finances in Newark
Median Income by Occupancy in Newark
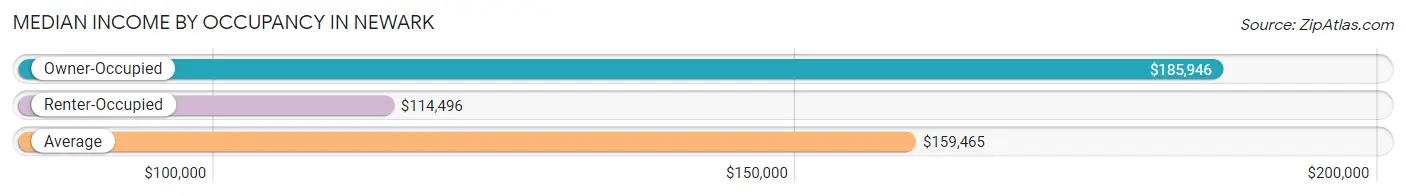
| Occupancy Type | # Households | Median Income |
| Owner-Occupied | 10,290 (69.5%) | $185,946 |
| Renter-Occupied | 4,515 (30.5%) | $114,496 |
| Average | 14,805 (100.0%) | $159,465 |
Occupancy by Householder Income Bracket in Newark
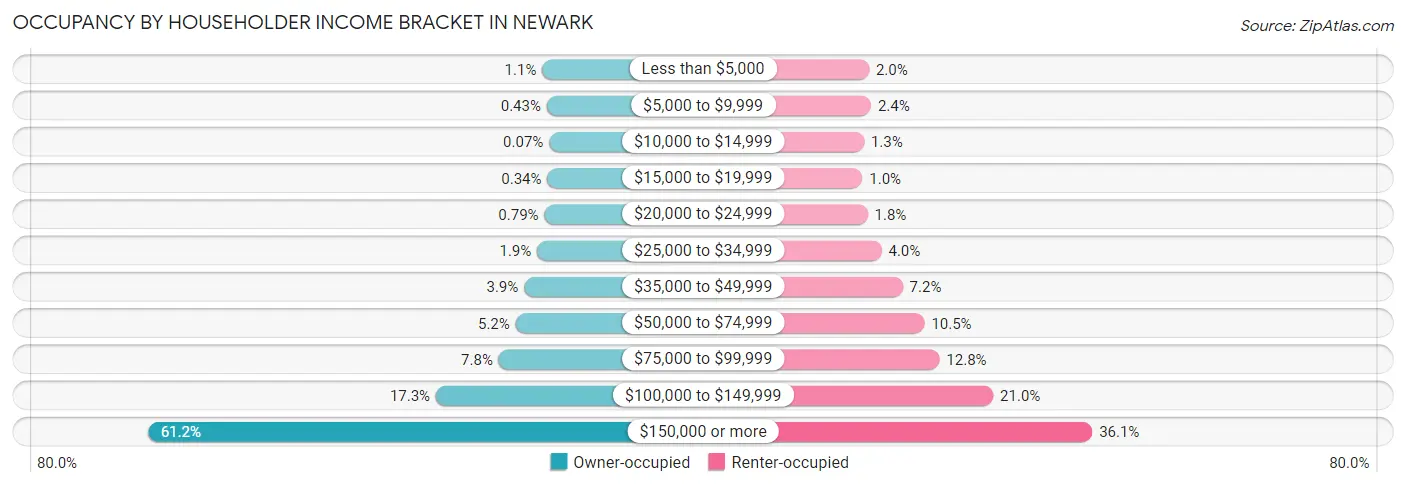
| Income Bracket | Owner-occupied | Renter-occupied |
| Less than $5,000 | 115 (1.1%) | 92 (2.0%) |
| $5,000 to $9,999 | 44 (0.4%) | 106 (2.4%) |
| $10,000 to $14,999 | 7 (0.1%) | 58 (1.3%) |
| $15,000 to $19,999 | 35 (0.3%) | 47 (1.0%) |
| $20,000 to $24,999 | 81 (0.8%) | 83 (1.8%) |
| $25,000 to $34,999 | 195 (1.9%) | 179 (4.0%) |
| $35,000 to $49,999 | 399 (3.9%) | 324 (7.2%) |
| $50,000 to $74,999 | 533 (5.2%) | 474 (10.5%) |
| $75,000 to $99,999 | 797 (7.7%) | 577 (12.8%) |
| $100,000 to $149,999 | 1,782 (17.3%) | 947 (21.0%) |
| $150,000 or more | 6,302 (61.2%) | 1,628 (36.1%) |
| Total | 10,290 (100.0%) | 4,515 (100.0%) |
Monthly Housing Cost Tiers in Newark
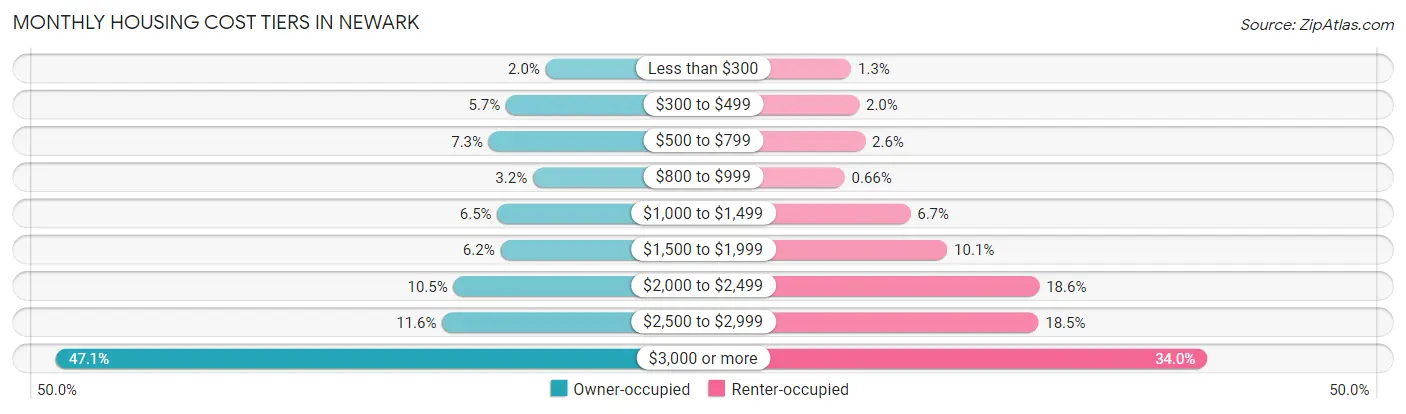
| Monthly Cost | Owner-occupied | Renter-occupied |
| Less than $300 | 209 (2.0%) | 57 (1.3%) |
| $300 to $499 | 583 (5.7%) | 90 (2.0%) |
| $500 to $799 | 747 (7.3%) | 115 (2.5%) |
| $800 to $999 | 329 (3.2%) | 30 (0.7%) |
| $1,000 to $1,499 | 666 (6.5%) | 303 (6.7%) |
| $1,500 to $1,999 | 637 (6.2%) | 456 (10.1%) |
| $2,000 to $2,499 | 1,081 (10.5%) | 839 (18.6%) |
| $2,500 to $2,999 | 1,189 (11.6%) | 835 (18.5%) |
| $3,000 or more | 4,849 (47.1%) | 1,537 (34.0%) |
| Total | 10,290 (100.0%) | 4,515 (100.0%) |
Physical Housing Characteristics in Newark
Housing Structures in Newark
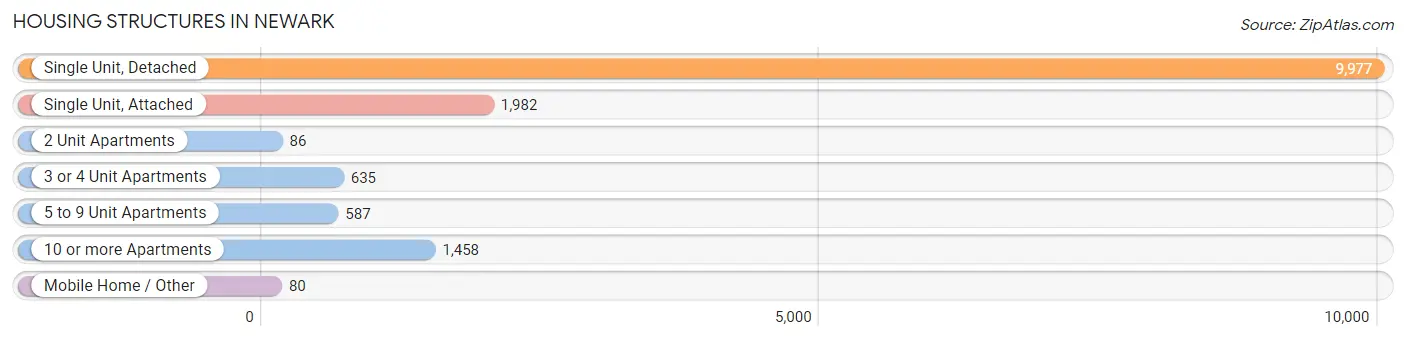
| Structure Type | # Housing Units | % Housing Units |
| Single Unit, Detached | 9,977 | 67.4% |
| Single Unit, Attached | 1,982 | 13.4% |
| 2 Unit Apartments | 86 | 0.6% |
| 3 or 4 Unit Apartments | 635 | 4.3% |
| 5 to 9 Unit Apartments | 587 | 4.0% |
| 10 or more Apartments | 1,458 | 9.9% |
| Mobile Home / Other | 80 | 0.5% |
| Total | 14,805 | 100.0% |
Housing Structures by Occupancy in Newark
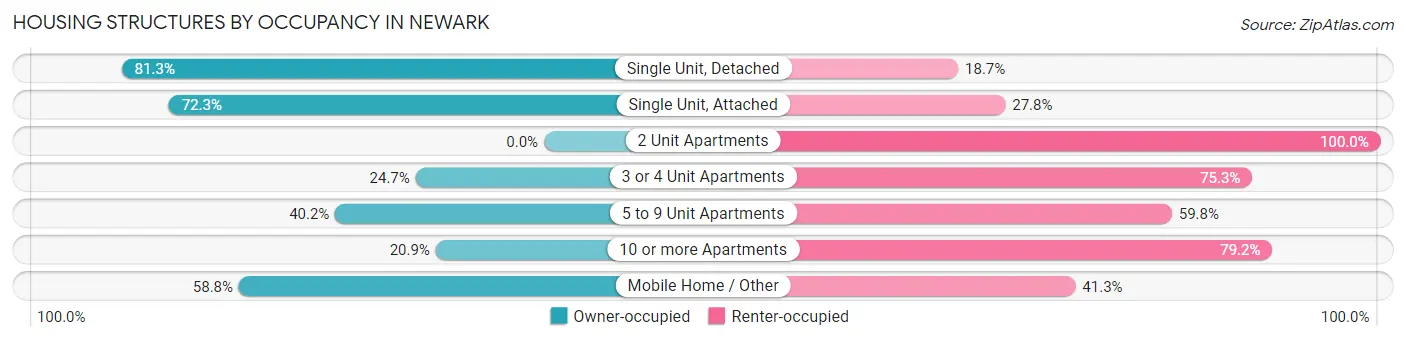
| Structure Type | Owner-occupied | Renter-occupied |
| Single Unit, Detached | 8,114 (81.3%) | 1,863 (18.7%) |
| Single Unit, Attached | 1,432 (72.3%) | 550 (27.8%) |
| 2 Unit Apartments | 0 (0.0%) | 86 (100.0%) |
| 3 or 4 Unit Apartments | 157 (24.7%) | 478 (75.3%) |
| 5 to 9 Unit Apartments | 236 (40.2%) | 351 (59.8%) |
| 10 or more Apartments | 304 (20.8%) | 1,154 (79.1%) |
| Mobile Home / Other | 47 (58.8%) | 33 (41.2%) |
| Total | 10,290 (69.5%) | 4,515 (30.5%) |
Housing Structures by Number of Rooms in Newark
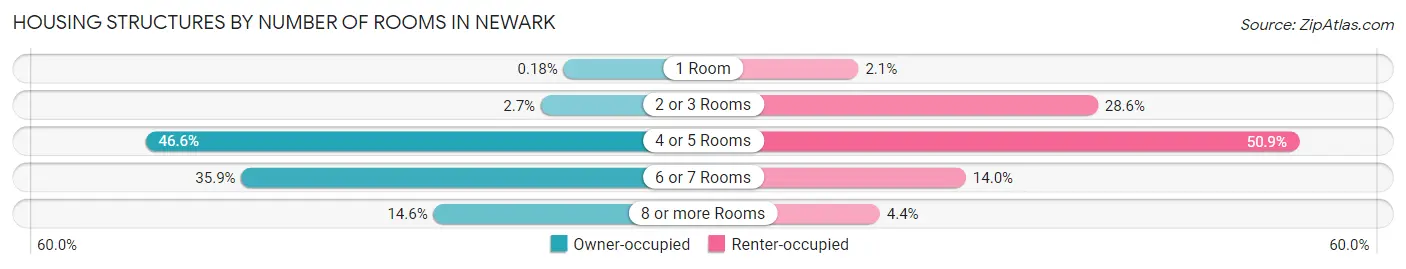
| Number of Rooms | Owner-occupied | Renter-occupied |
| 1 Room | 19 (0.2%) | 93 (2.1%) |
| 2 or 3 Rooms | 278 (2.7%) | 1,292 (28.6%) |
| 4 or 5 Rooms | 4,791 (46.6%) | 2,299 (50.9%) |
| 6 or 7 Rooms | 3,698 (35.9%) | 631 (14.0%) |
| 8 or more Rooms | 1,504 (14.6%) | 200 (4.4%) |
| Total | 10,290 (100.0%) | 4,515 (100.0%) |
Housing Structure by Heating Type in Newark
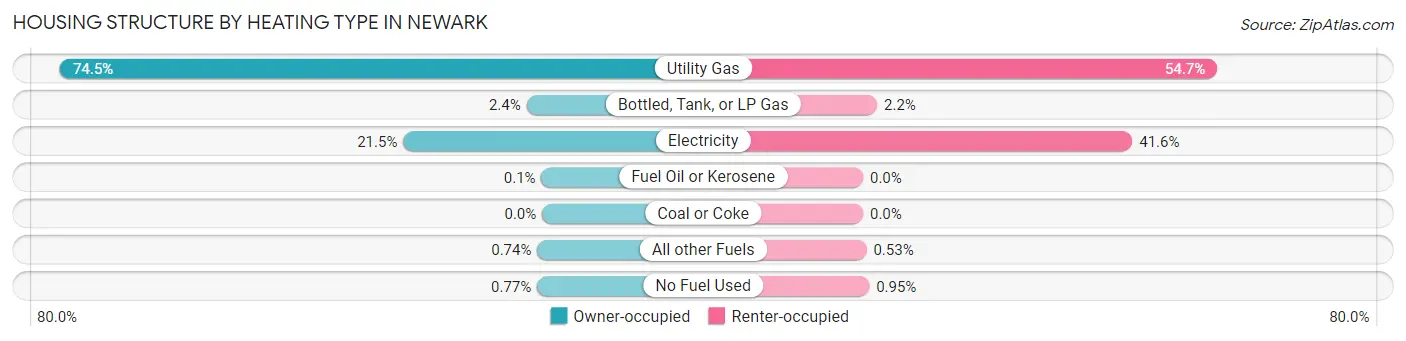
| Heating Type | Owner-occupied | Renter-occupied |
| Utility Gas | 7,669 (74.5%) | 2,471 (54.7%) |
| Bottled, Tank, or LP Gas | 247 (2.4%) | 98 (2.2%) |
| Electricity | 2,209 (21.5%) | 1,879 (41.6%) |
| Fuel Oil or Kerosene | 10 (0.1%) | 0 (0.0%) |
| Coal or Coke | 0 (0.0%) | 0 (0.0%) |
| All other Fuels | 76 (0.7%) | 24 (0.5%) |
| No Fuel Used | 79 (0.8%) | 43 (0.9%) |
| Total | 10,290 (100.0%) | 4,515 (100.0%) |
Household Vehicle Usage in Newark
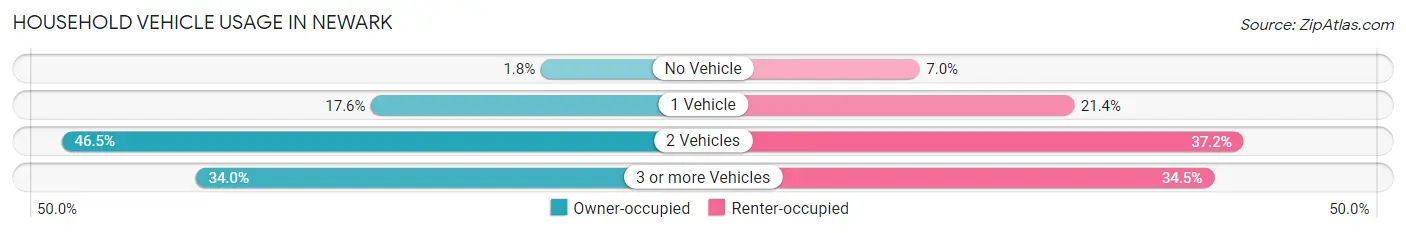
| Vehicles per Household | Owner-occupied | Renter-occupied |
| No Vehicle | 184 (1.8%) | 314 (7.0%) |
| 1 Vehicle | 1,814 (17.6%) | 965 (21.4%) |
| 2 Vehicles | 4,789 (46.5%) | 1,680 (37.2%) |
| 3 or more Vehicles | 3,503 (34.0%) | 1,556 (34.5%) |
| Total | 10,290 (100.0%) | 4,515 (100.0%) |
Real Estate & Mortgages in Newark
Real Estate and Mortgage Overview in Newark
| Characteristic | Without Mortgage | With Mortgage |
| Housing Units | 2,333 | 7,957 |
| Median Property Value | $956,700 | $1,055,500 |
| Median Household Income | $111,707 | $5,559 |
| Monthly Housing Costs | $688 | $4,840 |
| Real Estate Taxes | $3,837 | $76 |
Property Value by Mortgage Status in Newark
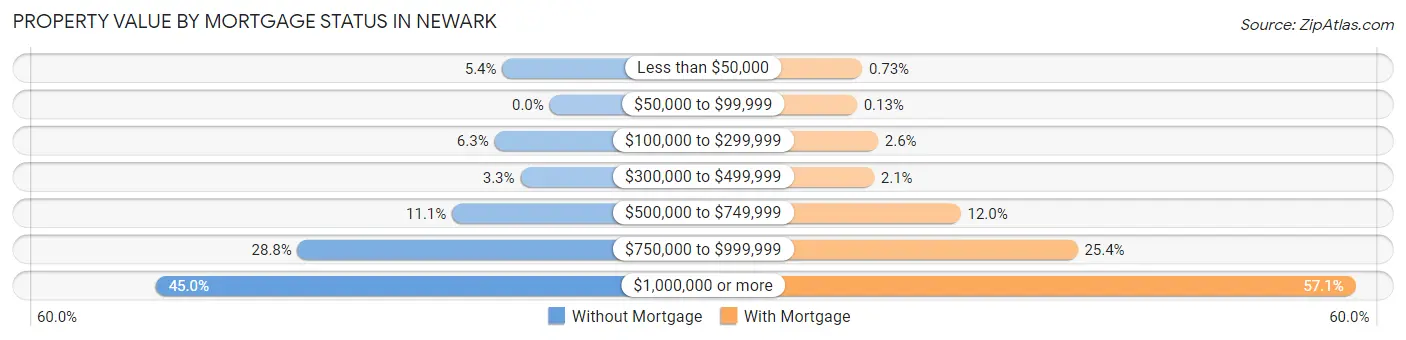
| Property Value | Without Mortgage | With Mortgage |
| Less than $50,000 | 126 (5.4%) | 58 (0.7%) |
| $50,000 to $99,999 | 0 (0.0%) | 10 (0.1%) |
| $100,000 to $299,999 | 147 (6.3%) | 203 (2.5%) |
| $300,000 to $499,999 | 78 (3.3%) | 166 (2.1%) |
| $500,000 to $749,999 | 260 (11.1%) | 955 (12.0%) |
| $750,000 to $999,999 | 672 (28.8%) | 2,018 (25.4%) |
| $1,000,000 or more | 1,050 (45.0%) | 4,547 (57.1%) |
| Total | 2,333 (100.0%) | 7,957 (100.0%) |
Household Income by Mortgage Status in Newark
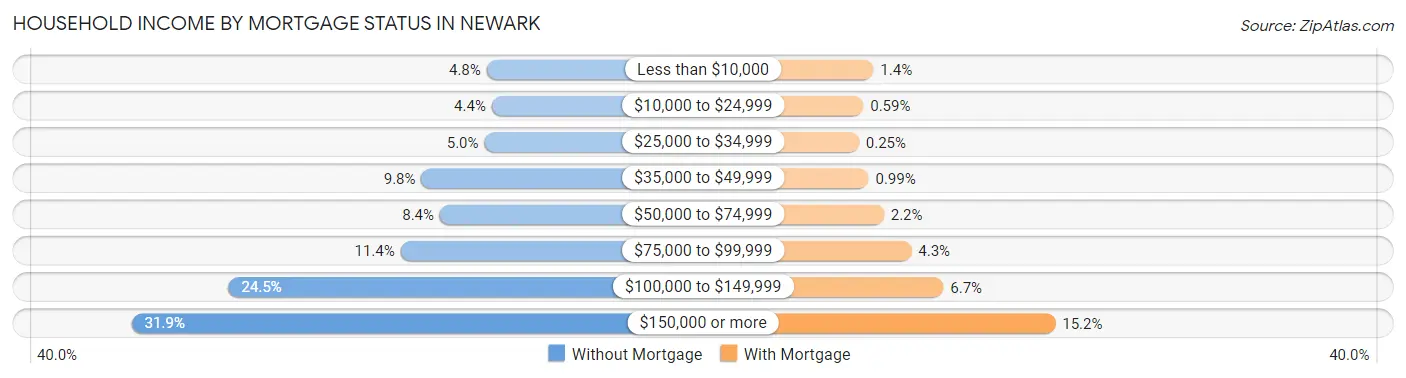
| Household Income | Without Mortgage | With Mortgage |
| Less than $10,000 | 112 (4.8%) | 108 (1.4%) |
| $10,000 to $24,999 | 103 (4.4%) | 47 (0.6%) |
| $25,000 to $34,999 | 116 (5.0%) | 20 (0.3%) |
| $35,000 to $49,999 | 228 (9.8%) | 79 (1.0%) |
| $50,000 to $74,999 | 195 (8.4%) | 171 (2.1%) |
| $75,000 to $99,999 | 265 (11.4%) | 338 (4.3%) |
| $100,000 to $149,999 | 571 (24.5%) | 532 (6.7%) |
| $150,000 or more | 743 (31.9%) | 1,211 (15.2%) |
| Total | 2,333 (100.0%) | 7,957 (100.0%) |
Property Value to Household Income Ratio in Newark
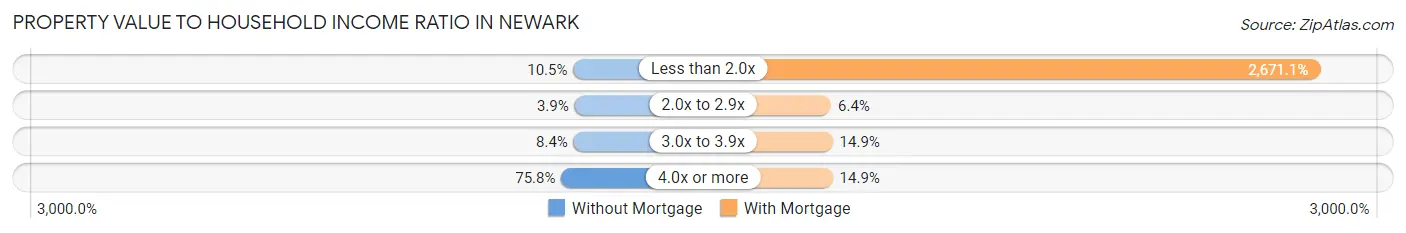
| Value-to-Income Ratio | Without Mortgage | With Mortgage |
| Less than 2.0x | 246 (10.5%) | 212,541 (2,671.1%) |
| 2.0x to 2.9x | 91 (3.9%) | 509 (6.4%) |
| 3.0x to 3.9x | 196 (8.4%) | 1,186 (14.9%) |
| 4.0x or more | 1,768 (75.8%) | 1,189 (14.9%) |
| Total | 2,333 (100.0%) | 7,957 (100.0%) |
Real Estate Taxes by Mortgage Status in Newark
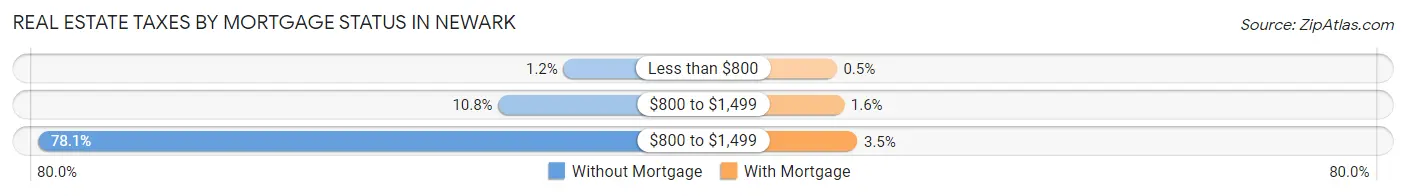
| Property Taxes | Without Mortgage | With Mortgage |
| Less than $800 | 29 (1.2%) | 40 (0.5%) |
| $800 to $1,499 | 251 (10.8%) | 126 (1.6%) |
| $800 to $1,499 | 1,821 (78.0%) | 279 (3.5%) |
| Total | 2,333 (100.0%) | 7,957 (100.0%) |
Health & Disability in Newark
Health Insurance Coverage by Age in Newark
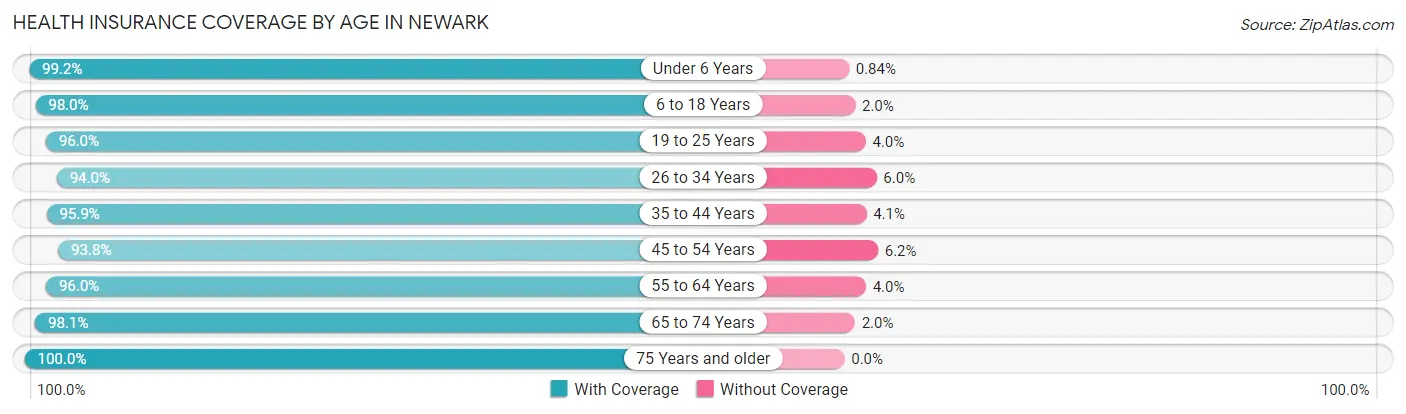
| Age Bracket | With Coverage | Without Coverage |
| Under 6 Years | 3,542 (99.2%) | 30 (0.8%) |
| 6 to 18 Years | 6,308 (98.0%) | 129 (2.0%) |
| 19 to 25 Years | 3,367 (96.0%) | 139 (4.0%) |
| 26 to 34 Years | 7,783 (94.0%) | 496 (6.0%) |
| 35 to 44 Years | 7,012 (95.9%) | 298 (4.1%) |
| 45 to 54 Years | 5,633 (93.8%) | 375 (6.2%) |
| 55 to 64 Years | 6,112 (96.0%) | 254 (4.0%) |
| 65 to 74 Years | 3,364 (98.1%) | 67 (1.9%) |
| 75 Years and older | 2,515 (100.0%) | 0 (0.0%) |
| Total | 45,636 (96.2%) | 1,788 (3.8%) |
Health Insurance Coverage by Citizenship Status in Newark
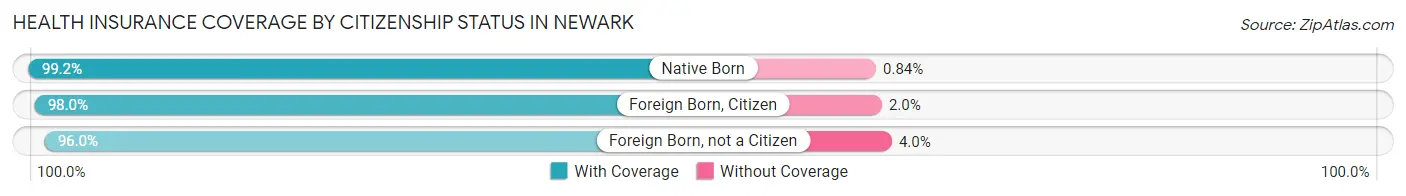
| Citizenship Status | With Coverage | Without Coverage |
| Native Born | 3,542 (99.2%) | 30 (0.8%) |
| Foreign Born, Citizen | 6,308 (98.0%) | 129 (2.0%) |
| Foreign Born, not a Citizen | 3,367 (96.0%) | 139 (4.0%) |
Health Insurance Coverage by Household Income in Newark
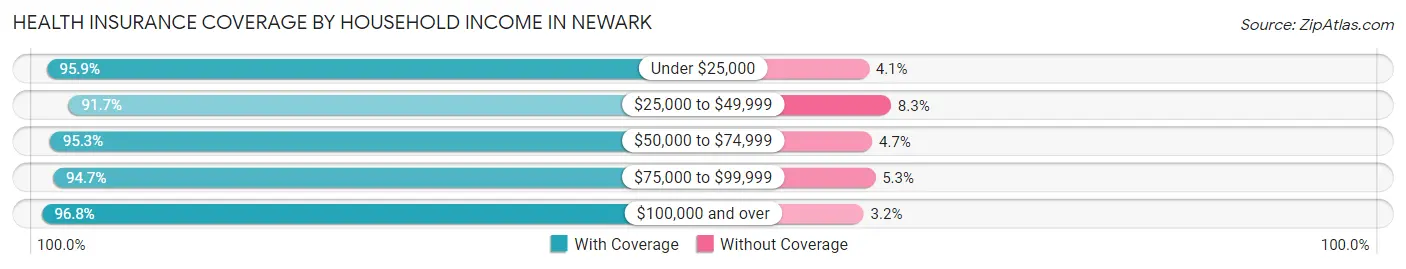
| Household Income | With Coverage | Without Coverage |
| Under $25,000 | 907 (95.9%) | 39 (4.1%) |
| $25,000 to $49,999 | 2,498 (91.7%) | 225 (8.3%) |
| $50,000 to $74,999 | 2,796 (95.3%) | 139 (4.7%) |
| $75,000 to $99,999 | 4,263 (94.7%) | 240 (5.3%) |
| $100,000 and over | 35,011 (96.8%) | 1,141 (3.2%) |
Public vs Private Health Insurance Coverage by Age in Newark
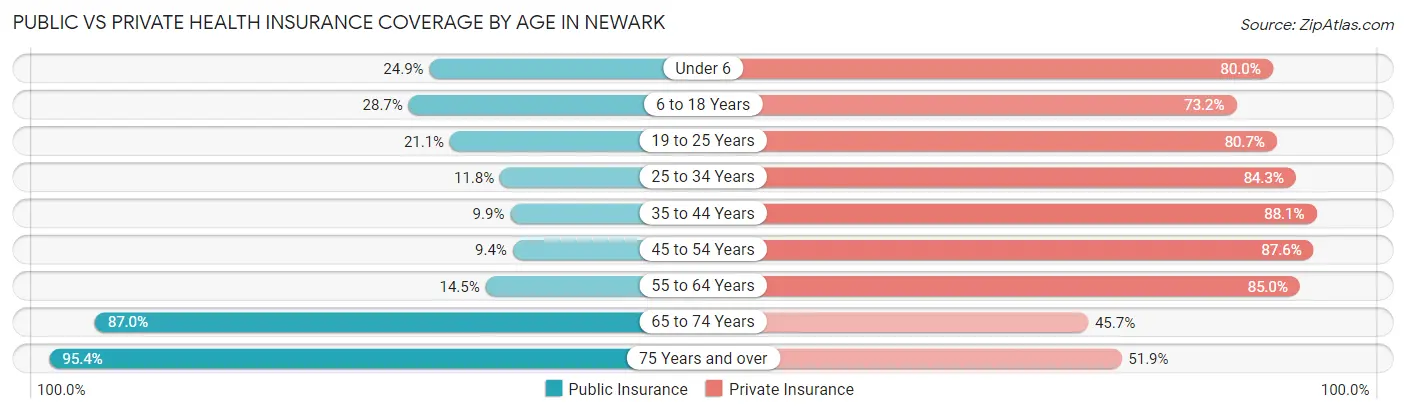
| Age Bracket | Public Insurance | Private Insurance |
| Under 6 | 888 (24.9%) | 2,856 (80.0%) |
| 6 to 18 Years | 1,849 (28.7%) | 4,713 (73.2%) |
| 19 to 25 Years | 738 (21.0%) | 2,830 (80.7%) |
| 25 to 34 Years | 973 (11.7%) | 6,975 (84.3%) |
| 35 to 44 Years | 721 (9.9%) | 6,438 (88.1%) |
| 45 to 54 Years | 565 (9.4%) | 5,261 (87.6%) |
| 55 to 64 Years | 920 (14.4%) | 5,412 (85.0%) |
| 65 to 74 Years | 2,984 (87.0%) | 1,568 (45.7%) |
| 75 Years and over | 2,399 (95.4%) | 1,305 (51.9%) |
| Total | 12,037 (25.4%) | 37,358 (78.8%) |
Disability Status by Sex by Age in Newark
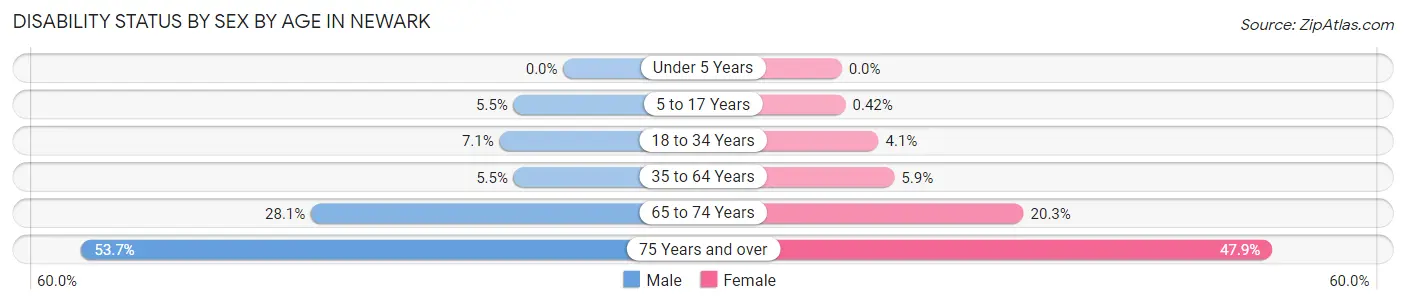
| Age Bracket | Male | Female |
| Under 5 Years | 0 (0.0%) | 0 (0.0%) |
| 5 to 17 Years | 174 (5.5%) | 13 (0.4%) |
| 18 to 34 Years | 499 (7.1%) | 222 (4.1%) |
| 35 to 64 Years | 569 (5.5%) | 549 (5.9%) |
| 65 to 74 Years | 409 (28.1%) | 400 (20.3%) |
| 75 Years and over | 650 (53.7%) | 625 (47.9%) |
Disability Class by Sex by Age in Newark
Disability Class: Hearing Difficulty
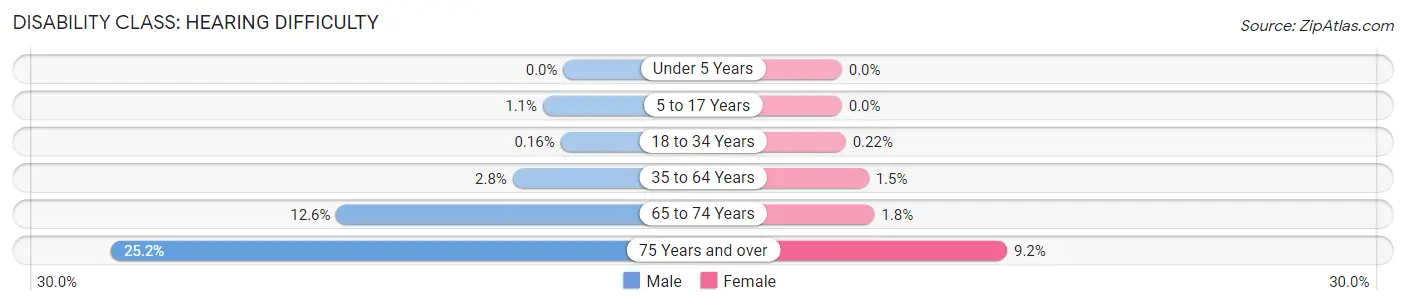
| Age Bracket | Male | Female |
| Under 5 Years | 0 (0.0%) | 0 (0.0%) |
| 5 to 17 Years | 36 (1.1%) | 0 (0.0%) |
| 18 to 34 Years | 11 (0.2%) | 12 (0.2%) |
| 35 to 64 Years | 291 (2.8%) | 141 (1.5%) |
| 65 to 74 Years | 184 (12.6%) | 36 (1.8%) |
| 75 Years and over | 305 (25.2%) | 120 (9.2%) |
Disability Class: Vision Difficulty
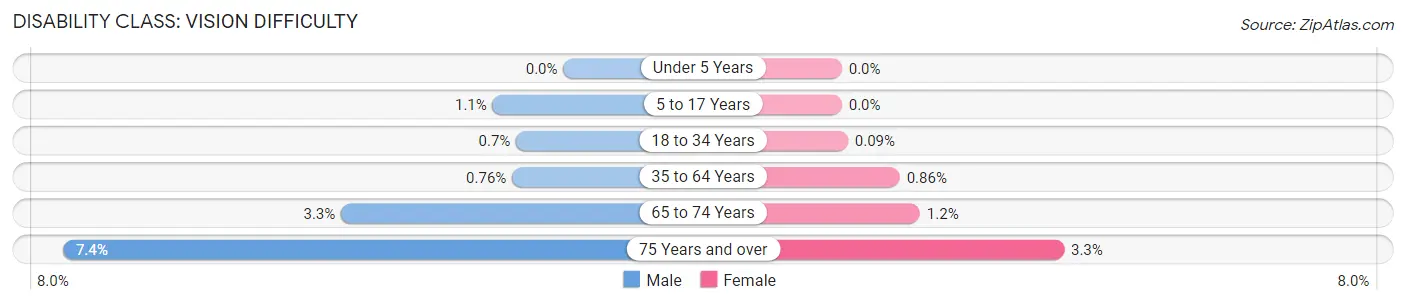
| Age Bracket | Male | Female |
| Under 5 Years | 0 (0.0%) | 0 (0.0%) |
| 5 to 17 Years | 33 (1.1%) | 0 (0.0%) |
| 18 to 34 Years | 49 (0.7%) | 5 (0.1%) |
| 35 to 64 Years | 78 (0.8%) | 81 (0.9%) |
| 65 to 74 Years | 48 (3.3%) | 23 (1.2%) |
| 75 Years and over | 90 (7.4%) | 43 (3.3%) |
Disability Class: Cognitive Difficulty
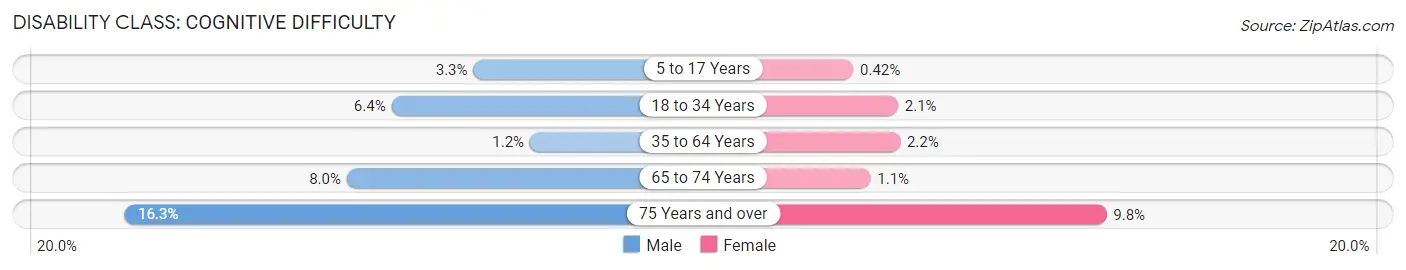
| Age Bracket | Male | Female |
| 5 to 17 Years | 105 (3.3%) | 13 (0.4%) |
| 18 to 34 Years | 448 (6.4%) | 113 (2.1%) |
| 35 to 64 Years | 128 (1.2%) | 202 (2.2%) |
| 65 to 74 Years | 117 (8.0%) | 21 (1.1%) |
| 75 Years and over | 197 (16.3%) | 128 (9.8%) |
Disability Class: Ambulatory Difficulty
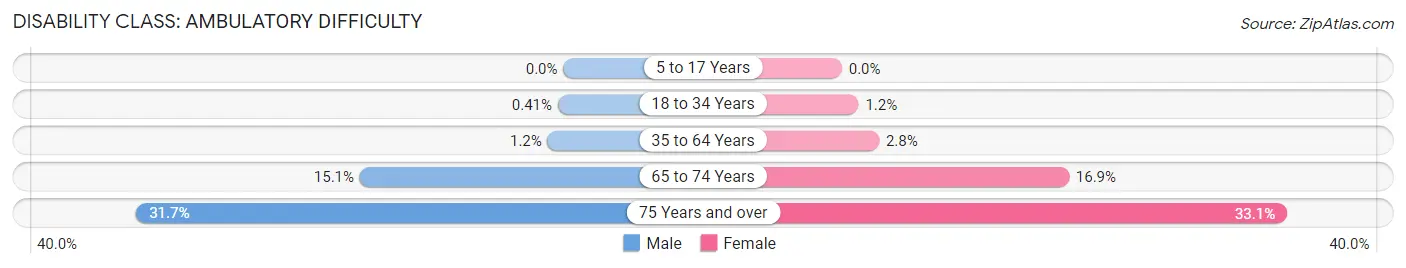
| Age Bracket | Male | Female |
| 5 to 17 Years | 0 (0.0%) | 0 (0.0%) |
| 18 to 34 Years | 29 (0.4%) | 67 (1.2%) |
| 35 to 64 Years | 121 (1.2%) | 259 (2.8%) |
| 65 to 74 Years | 220 (15.1%) | 333 (16.9%) |
| 75 Years and over | 384 (31.7%) | 431 (33.1%) |
Disability Class: Self-Care Difficulty
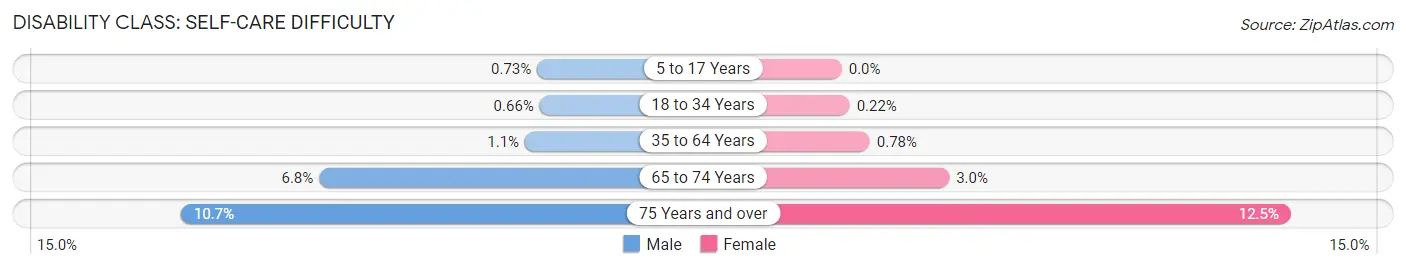
| Age Bracket | Male | Female |
| 5 to 17 Years | 23 (0.7%) | 0 (0.0%) |
| 18 to 34 Years | 46 (0.7%) | 12 (0.2%) |
| 35 to 64 Years | 110 (1.1%) | 73 (0.8%) |
| 65 to 74 Years | 99 (6.8%) | 59 (3.0%) |
| 75 Years and over | 129 (10.6%) | 163 (12.5%) |
Technology Access in Newark
Computing Device Access in Newark
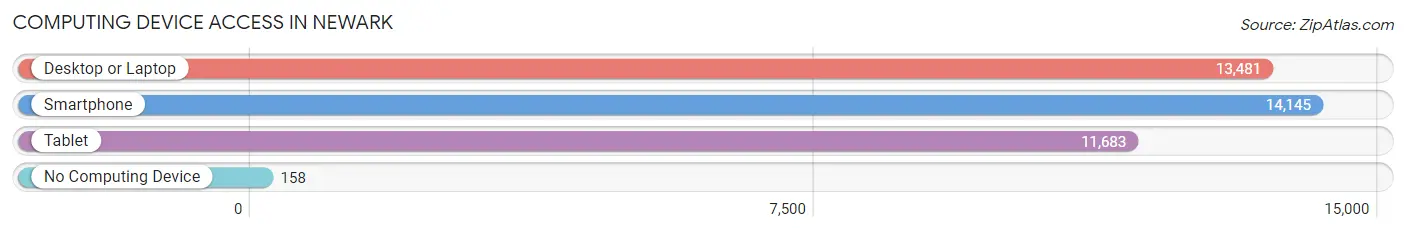
| Device Type | # Households | % Households |
| Desktop or Laptop | 13,481 | 91.1% |
| Smartphone | 14,145 | 95.5% |
| Tablet | 11,683 | 78.9% |
| No Computing Device | 158 | 1.1% |
| Total | 14,805 | 100.0% |
Internet Access in Newark
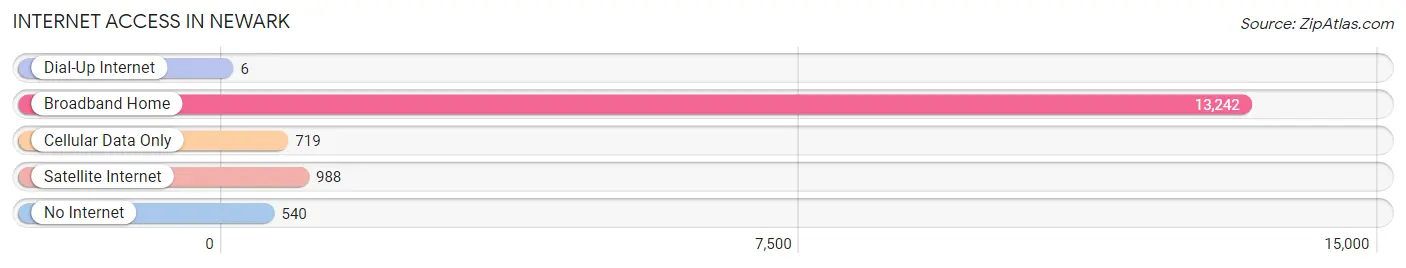
| Internet Type | # Households | % Households |
| Dial-Up Internet | 6 | 0.0% |
| Broadband Home | 13,242 | 89.4% |
| Cellular Data Only | 719 | 4.9% |
| Satellite Internet | 988 | 6.7% |
| No Internet | 540 | 3.6% |
| Total | 14,805 | 100.0% |
Newark Summary
Newark is a city located in Alameda County, California, United States. It is located in the San Francisco Bay Area, and is part of the East Bay region. As of the 2010 United States Census, the population of Newark was 42,573, making it the 15th largest city in Alameda County.
Geography
Newark is located at 37°27' North, 122°02' West (37.45, -122.03). It is situated at the eastern end of the San Francisco Bay, near the eastern terminus of the San Mateo Bridge. The city is bordered by Fremont on the north and east, Union City on the south, and the San Francisco Bay on the west.
The city covers an area of 13.2 square miles, of which 12.9 square miles is land and 0.3 square miles is water. The city is located in a flat valley surrounded by hills and mountains. The highest point in Newark is the summit of Mission Peak, which rises to an elevation of 2,517 feet.
Climate
Newark has a Mediterranean climate, with warm, dry summers and mild, wet winters. The average annual temperature is 61°F, and the average annual precipitation is 19.3 inches.
Demographics
As of the 2010 United States Census, there were 42,573 people, 15,945 households, and 10,945 families residing in the city. The population density was 3,288.3 people per square mile. There were 16,711 housing units at an average density of 1,289.7 per square mile. The racial makeup of the city was 44.3% White, 11.2% African American, 0.7% Native American, 33.2% Asian, 0.3% Pacific Islander, 6.2% from other races, and 4.1% from two or more races. Hispanic or Latino of any race were 15.2% of the population.
Economy
Newark is home to a number of major employers, including the Newark Unified School District, the City of Newark, the Newark Unified School District, the Newark Memorial High School, and the Newark Memorial Hospital. The city is also home to a number of technology companies, including Oracle, Cisco Systems, and Symantec.
The median household income in Newark was $76,837 in 2018, and the median family income was $90,945. The per capita income in Newark was $37,945 in 2018.
Conclusion
Newark is a city located in Alameda County, California, United States. It is located in the San Francisco Bay Area, and is part of the East Bay region. As of the 2010 United States Census, the population of Newark was 42,573, making it the 15th largest city in Alameda County. The city has a Mediterranean climate, with warm, dry summers and mild, wet winters. The racial makeup of the city was 44.3% White, 11.2% African American, 0.7% Native American, 33.2% Asian, 0.3% Pacific Islander, 6.2% from other races, and 4.1% from two or more races. The median household income in Newark was $76,837 in 2018, and the median family income was $90,945. The city is home to a number of major employers, including the Newark Unified School District, the City of Newark, the Newark Unified School District, the Newark Memorial High School, and the Newark Memorial Hospital. It is also home to a number of technology companies, including Oracle, Cisco Systems, and Symantec.
Common Questions
What is Per Capita Income in Newark?
Per Capita income in Newark is $62,417.
What is the Median Family Income in Newark?
Median Family Income in Newark is $167,177.
What is the Median Household income in Newark?
Median Household Income in Newark is $159,465.
What is Income or Wage Gap in Newark?
Income or Wage Gap in Newark is 26.3%.
Women in Newark earn 73.7 cents for every dollar earned by a man.
What is Inequality or Gini Index in Newark?
Inequality or Gini Index in Newark is 0.40.
What is the Total Population of Newark?
Total Population of Newark is 47,470.
What is the Total Male Population of Newark?
Total Male Population of Newark is 24,610.
What is the Total Female Population of Newark?
Total Female Population of Newark is 22,860.
What is the Ratio of Males per 100 Females in Newark?
There are 107.66 Males per 100 Females in Newark.
What is the Ratio of Females per 100 Males in Newark?
There are 92.89 Females per 100 Males in Newark.
What is the Median Population Age in Newark?
Median Population Age in Newark is 36.9 Years.
What is the Average Family Size in Newark
Average Family Size in Newark is 3.4 People.
What is the Average Household Size in Newark
Average Household Size in Newark is 3.2 People.
How Large is the Labor Force in Newark?
There are 28,089 People in the Labor Forcein in Newark.
What is the Percentage of People in the Labor Force in Newark?
71.6% of People are in the Labor Force in Newark.
What is the Unemployment Rate in Newark?
Unemployment Rate in Newark is 4.5%.