Cities with the Highest Percentage of Population Employed in Architecture & Engineering in Virginia
RELATED REPORTS & OPTIONS
Architecture & Engineering
Virginia
Compare Cities
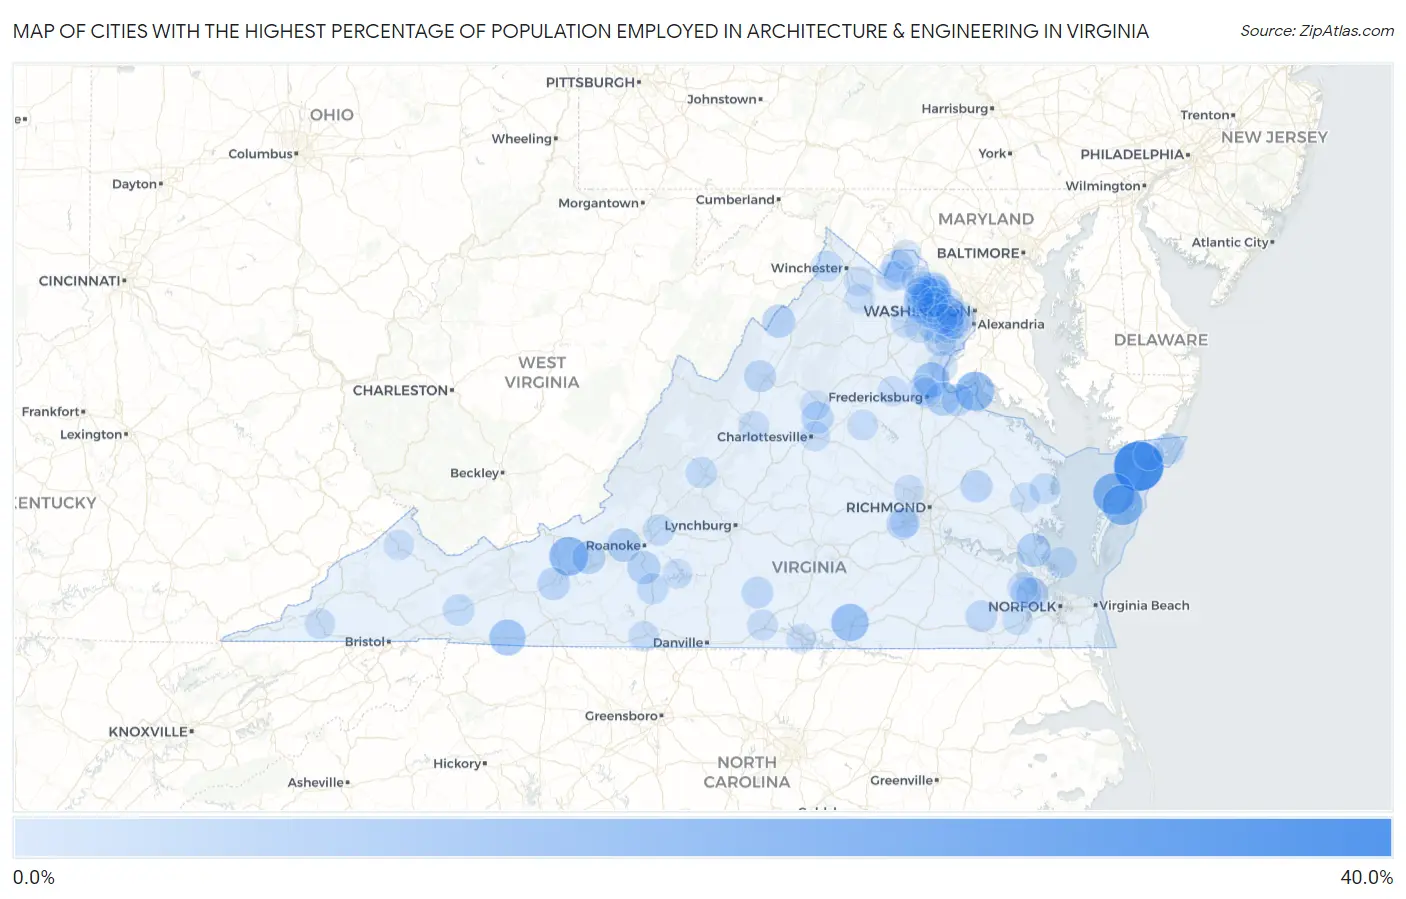
Map of Cities with the Highest Percentage of Population Employed in Architecture & Engineering in Virginia
0.0%
40.0%
Cities with the Highest Percentage of Population Employed in Architecture & Engineering in Virginia
| City | % Employed | vs State | vs National | |
| 1. | Nelsonia | 31.3% | 2.3%(+29.0)#1 | 2.1%(+29.2)#55 |
| 2. | Hilltown | 25.5% | 2.3%(+23.2)#2 | 2.1%(+23.4)#83 |
| 3. | Brucetown | 20.0% | 2.3%(+17.7)#3 | 2.1%(+17.9)#133 |
| 4. | Pungoteague | 18.8% | 2.3%(+16.4)#4 | 2.1%(+16.6)#151 |
| 5. | Quinby | 17.4% | 2.3%(+15.1)#5 | 2.1%(+15.3)#167 |
| 6. | Dahlgren Center | 15.8% | 2.3%(+13.4)#6 | 2.1%(+13.6)#210 |
| 7. | Belspring | 15.6% | 2.3%(+13.3)#7 | 2.1%(+13.5)#213 |
| 8. | Great Falls Crossing | 15.3% | 2.3%(+12.9)#8 | 2.1%(+13.1)#223 |
| 9. | Oak Grove | 14.3% | 2.3%(+12.0)#9 | 2.1%(+12.1)#248 |
| 10. | South Hill | 13.4% | 2.3%(+11.1)#10 | 2.1%(+11.3)#291 |
| 11. | Independence | 11.7% | 2.3%(+9.35)#11 | 2.1%(+9.50)#378 |
| 12. | Stafford Courthouse | 10.6% | 2.3%(+8.32)#12 | 2.1%(+8.47)#443 |
| 13. | Kincora | 8.8% | 2.3%(+6.53)#13 | 2.1%(+6.69)#602 |
| 14. | Yorktown | 8.6% | 2.3%(+6.30)#14 | 2.1%(+6.46)#625 |
| 15. | Passapatanzy | 8.4% | 2.3%(+6.05)#15 | 2.1%(+6.21)#658 |
| 16. | Glenvar | 8.2% | 2.3%(+5.91)#16 | 2.1%(+6.06)#686 |
| 17. | Boones Mill | 7.6% | 2.3%(+5.32)#17 | 2.1%(+5.48)#786 |
| 18. | Merrimac | 7.5% | 2.3%(+5.22)#18 | 2.1%(+5.37)#806 |
| 19. | Basye | 7.5% | 2.3%(+5.20)#19 | 2.1%(+5.35)#811 |
| 20. | Draper | 6.8% | 2.3%(+4.53)#20 | 2.1%(+4.69)#976 |
| 21. | King William | 6.2% | 2.3%(+3.87)#21 | 2.1%(+4.02)#1,171 |
| 22. | County Center | 6.1% | 2.3%(+3.75)#22 | 2.1%(+3.91)#1,211 |
| 23. | Belmont Estates | 6.0% | 2.3%(+3.73)#23 | 2.1%(+3.88)#1,224 |
| 24. | Piney Mountain | 6.0% | 2.3%(+3.71)#24 | 2.1%(+3.87)#1,230 |
| 25. | Woodlake | 6.0% | 2.3%(+3.71)#25 | 2.1%(+3.86)#1,233 |
| 26. | Hillsboro | 6.0% | 2.3%(+3.70)#26 | 2.1%(+3.85)#1,243 |
| 27. | Carrollton | 6.0% | 2.3%(+3.69)#27 | 2.1%(+3.84)#1,247 |
| 28. | King George | 6.0% | 2.3%(+3.68)#28 | 2.1%(+3.84)#1,248 |
| 29. | Sedley | 5.6% | 2.3%(+3.30)#29 | 2.1%(+3.45)#1,442 |
| 30. | Wolf Trap | 5.6% | 2.3%(+3.25)#30 | 2.1%(+3.40)#1,481 |
| 31. | Nathalie | 5.5% | 2.3%(+3.15)#31 | 2.1%(+3.31)#1,531 |
| 32. | Clifton | 5.4% | 2.3%(+3.13)#32 | 2.1%(+3.29)#1,539 |
| 33. | Mcmullin | 5.4% | 2.3%(+3.10)#33 | 2.1%(+3.26)#1,562 |
| 34. | Sully Square | 5.3% | 2.3%(+2.99)#34 | 2.1%(+3.15)#1,629 |
| 35. | Countryside | 5.3% | 2.3%(+2.96)#35 | 2.1%(+3.11)#1,661 |
| 36. | Blue Ridge | 5.3% | 2.3%(+2.95)#36 | 2.1%(+3.10)#1,664 |
| 37. | South Riding | 5.2% | 2.3%(+2.93)#37 | 2.1%(+3.08)#1,675 |
| 38. | Lexington | 5.2% | 2.3%(+2.89)#38 | 2.1%(+3.05)#1,691 |
| 39. | Chincoteague | 5.2% | 2.3%(+2.86)#39 | 2.1%(+3.02)#1,721 |
| 40. | Henry Fork | 5.2% | 2.3%(+2.85)#40 | 2.1%(+3.01)#1,733 |
| 41. | Poquoson | 5.0% | 2.3%(+2.68)#41 | 2.1%(+2.83)#1,850 |
| 42. | Union Mill | 4.9% | 2.3%(+2.58)#42 | 2.1%(+2.73)#1,909 |
| 43. | Cascades | 4.9% | 2.3%(+2.56)#43 | 2.1%(+2.71)#1,926 |
| 44. | Arcola | 4.9% | 2.3%(+2.55)#44 | 2.1%(+2.71)#1,930 |
| 45. | Shawneeland | 4.8% | 2.3%(+2.50)#45 | 2.1%(+2.66)#1,978 |
| 46. | Sugarland Run | 4.7% | 2.3%(+2.41)#46 | 2.1%(+2.56)#2,043 |
| 47. | Irvington | 4.6% | 2.3%(+2.31)#47 | 2.1%(+2.47)#2,127 |
| 48. | Bull Run | 4.5% | 2.3%(+2.23)#48 | 2.1%(+2.39)#2,199 |
| 49. | Benns Church | 4.5% | 2.3%(+2.22)#49 | 2.1%(+2.38)#2,211 |
| 50. | Braddock | 4.5% | 2.3%(+2.15)#50 | 2.1%(+2.31)#2,258 |
| 51. | Fishersville | 4.2% | 2.3%(+1.92)#51 | 2.1%(+2.08)#2,483 |
| 52. | Burke | 4.2% | 2.3%(+1.92)#52 | 2.1%(+2.07)#2,491 |
| 53. | Horse Pasture | 4.2% | 2.3%(+1.92)#53 | 2.1%(+2.07)#2,493 |
| 54. | Blue Ridge Shores | 4.2% | 2.3%(+1.89)#54 | 2.1%(+2.04)#2,537 |
| 55. | Southern Gateway | 4.2% | 2.3%(+1.88)#55 | 2.1%(+2.04)#2,543 |
| 56. | South Boston | 4.2% | 2.3%(+1.87)#56 | 2.1%(+2.03)#2,550 |
| 57. | Duffield | 4.2% | 2.3%(+1.86)#57 | 2.1%(+2.02)#2,570 |
| 58. | Ashburn | 4.2% | 2.3%(+1.86)#58 | 2.1%(+2.01)#2,575 |
| 59. | Smithfield | 4.1% | 2.3%(+1.84)#59 | 2.1%(+2.00)#2,593 |
| 60. | Purcellville | 4.1% | 2.3%(+1.79)#60 | 2.1%(+1.95)#2,646 |
| 61. | Greenbriar | 4.0% | 2.3%(+1.65)#61 | 2.1%(+1.81)#2,822 |
| 62. | Mantua | 3.9% | 2.3%(+1.63)#62 | 2.1%(+1.79)#2,849 |
| 63. | Haymarket | 3.9% | 2.3%(+1.61)#63 | 2.1%(+1.76)#2,881 |
| 64. | Reston | 3.8% | 2.3%(+1.53)#64 | 2.1%(+1.69)#2,971 |
| 65. | Lovettsville | 3.8% | 2.3%(+1.52)#65 | 2.1%(+1.68)#2,983 |
| 66. | Grundy | 3.8% | 2.3%(+1.51)#66 | 2.1%(+1.66)#3,004 |
| 67. | Lake Of The Woods | 3.8% | 2.3%(+1.46)#67 | 2.1%(+1.62)#3,069 |
| 68. | Leesylvania | 3.8% | 2.3%(+1.46)#68 | 2.1%(+1.61)#3,070 |
| 69. | North Springfield | 3.8% | 2.3%(+1.45)#69 | 2.1%(+1.61)#3,085 |
| 70. | Short Pump | 3.7% | 2.3%(+1.44)#70 | 2.1%(+1.59)#3,102 |
| 71. | Pantops | 3.7% | 2.3%(+1.37)#71 | 2.1%(+1.53)#3,212 |
| 72. | Suffolk | 3.7% | 2.3%(+1.37)#72 | 2.1%(+1.53)#3,215 |
| 73. | Vienna | 3.7% | 2.3%(+1.36)#73 | 2.1%(+1.51)#3,244 |
| 74. | Round Hill | 3.7% | 2.3%(+1.35)#74 | 2.1%(+1.51)#3,253 |
| 75. | Occoquan | 3.6% | 2.3%(+1.33)#75 | 2.1%(+1.49)#3,281 |
| 76. | Belmont | 3.6% | 2.3%(+1.33)#76 | 2.1%(+1.48)#3,287 |
| 77. | Atlantic | 3.6% | 2.3%(+1.32)#77 | 2.1%(+1.48)#3,297 |
| 78. | Quantico Base | 3.6% | 2.3%(+1.29)#78 | 2.1%(+1.45)#3,352 |
| 79. | Chantilly | 3.6% | 2.3%(+1.28)#79 | 2.1%(+1.44)#3,359 |
| 80. | Franklin Farm | 3.6% | 2.3%(+1.27)#80 | 2.1%(+1.43)#3,379 |
| 81. | Shenandoah Farms | 3.6% | 2.3%(+1.27)#81 | 2.1%(+1.42)#3,384 |
| 82. | Broadlands | 3.6% | 2.3%(+1.26)#82 | 2.1%(+1.41)#3,412 |
| 83. | Lake Barcroft | 3.6% | 2.3%(+1.26)#83 | 2.1%(+1.41)#3,417 |
| 84. | Leesburg | 3.5% | 2.3%(+1.24)#84 | 2.1%(+1.40)#3,445 |
| 85. | Boyce | 3.5% | 2.3%(+1.24)#85 | 2.1%(+1.39)#3,457 |
| 86. | Earlysville | 3.5% | 2.3%(+1.22)#86 | 2.1%(+1.37)#3,491 |
| 87. | Twin Lakes | 3.5% | 2.3%(+1.18)#87 | 2.1%(+1.34)#3,555 |
| 88. | North Shore | 3.5% | 2.3%(+1.18)#88 | 2.1%(+1.33)#3,558 |
| 89. | Clarksville | 3.5% | 2.3%(+1.18)#89 | 2.1%(+1.33)#3,560 |
| 90. | Ravensworth | 3.5% | 2.3%(+1.16)#90 | 2.1%(+1.32)#3,585 |
| 91. | Falmouth | 3.4% | 2.3%(+1.14)#91 | 2.1%(+1.30)#3,629 |
| 92. | Saluda | 3.4% | 2.3%(+1.13)#92 | 2.1%(+1.29)#3,646 |
| 93. | Long Branch | 3.4% | 2.3%(+1.13)#93 | 2.1%(+1.28)#3,657 |
| 94. | Mcnair | 3.4% | 2.3%(+1.11)#94 | 2.1%(+1.27)#3,687 |
| 95. | Moorefield | 3.4% | 2.3%(+1.11)#95 | 2.1%(+1.26)#3,695 |
| 96. | Merrifield | 3.4% | 2.3%(+1.09)#96 | 2.1%(+1.25)#3,714 |
| 97. | Brambleton | 3.4% | 2.3%(+1.09)#97 | 2.1%(+1.24)#3,731 |
| 98. | George Mason | 3.4% | 2.3%(+1.08)#98 | 2.1%(+1.24)#3,740 |
| 99. | Navy | 3.4% | 2.3%(+1.06)#99 | 2.1%(+1.21)#3,797 |
| 100. | Brandermill | 3.4% | 2.3%(+1.05)#100 | 2.1%(+1.20)#3,814 |
Common Questions
What are the Top 10 Cities with the Highest Percentage of Population Employed in Architecture & Engineering in Virginia?
Top 10 Cities with the Highest Percentage of Population Employed in Architecture & Engineering in Virginia are:
#1
31.3%
#2
18.8%
#3
17.4%
#4
15.8%
#5
15.6%
#6
14.3%
#7
13.4%
#8
11.7%
#9
10.6%
#10
8.6%
What city has the Highest Percentage of Population Employed in Architecture & Engineering in Virginia?
Nelsonia has the Highest Percentage of Population Employed in Architecture & Engineering in Virginia with 31.3%.
What is the Percentage of Population Employed in Architecture & Engineering in the State of Virginia?
Percentage of Population Employed in Architecture & Engineering in Virginia is 2.3%.
What is the Percentage of Population Employed in Architecture & Engineering in the United States?
Percentage of Population Employed in Architecture & Engineering in the United States is 2.1%.