Cities with the Highest Percentage of Population Employed in Architecture & Engineering in Florida
RELATED REPORTS & OPTIONS
Architecture & Engineering
Florida
Compare Cities
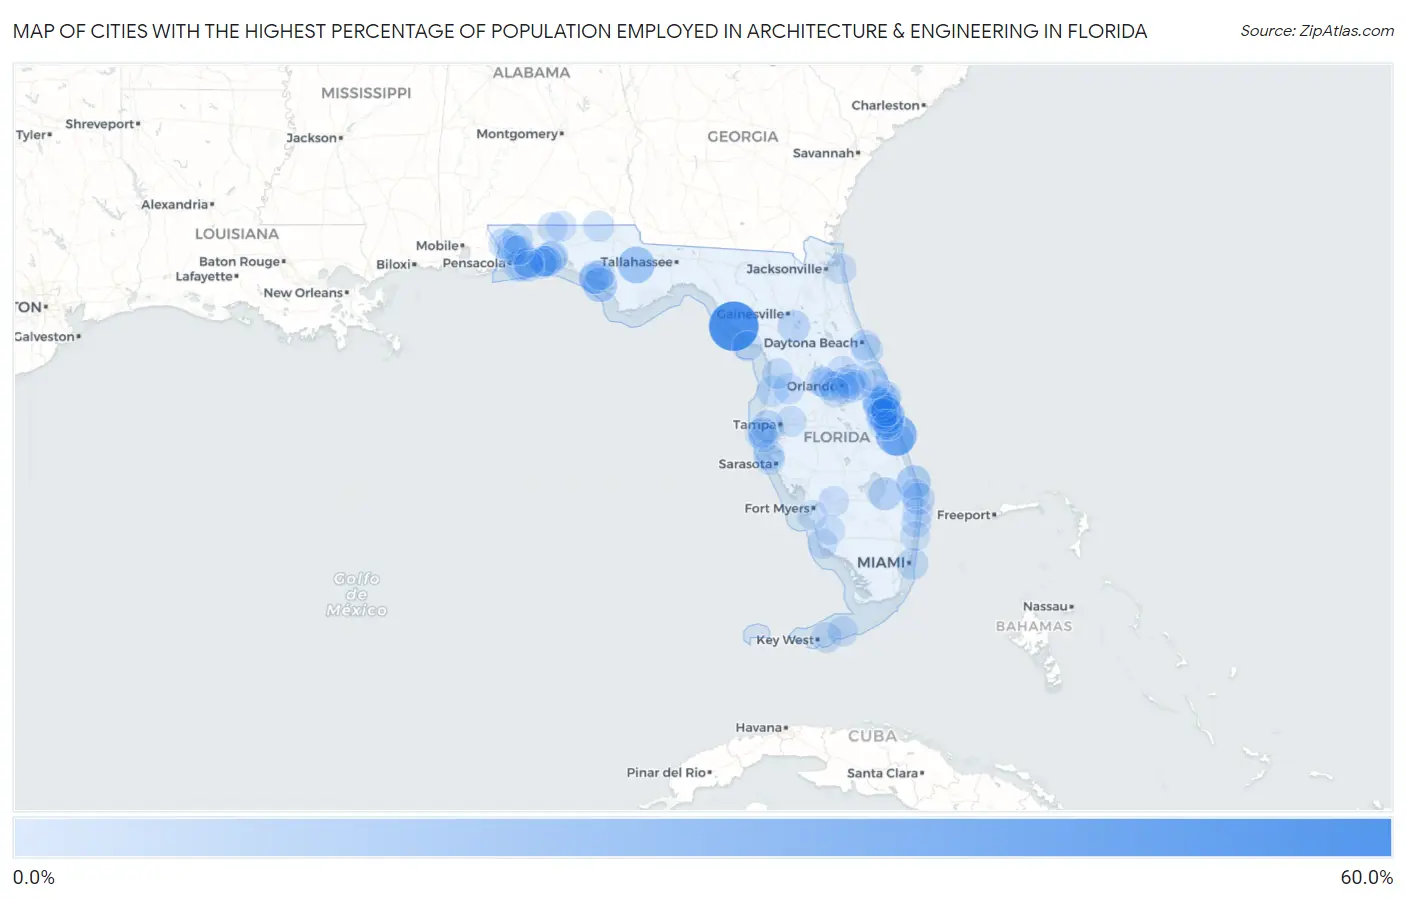
Map of Cities with the Highest Percentage of Population Employed in Architecture & Engineering in Florida
0.0%
60.0%
Cities with the Highest Percentage of Population Employed in Architecture & Engineering in Florida
| City | % Employed | vs State | vs National | |
| 1. | Horseshoe Beach | 53.3% | 1.6%(+51.7)#1 | 2.1%(+51.2)#24 |
| 2. | Orchid | 30.6% | 1.6%(+29.0)#2 | 2.1%(+28.5)#57 |
| 3. | Lake Mystic | 19.6% | 1.6%(+18.0)#3 | 2.1%(+17.5)#138 |
| 4. | Indialantic | 14.2% | 1.6%(+12.6)#4 | 2.1%(+12.0)#257 |
| 5. | Tyndall Afb | 14.1% | 1.6%(+12.5)#5 | 2.1%(+12.0)#261 |
| 6. | Jupiter Island | 13.9% | 1.6%(+12.3)#6 | 2.1%(+11.8)#268 |
| 7. | Pretty Bayou | 11.8% | 1.6%(+10.2)#7 | 2.1%(+9.63)#369 |
| 8. | Desoto Acres | 11.6% | 1.6%(+9.97)#8 | 2.1%(+9.42)#385 |
| 9. | Chaires | 11.3% | 1.6%(+9.75)#9 | 2.1%(+9.20)#396 |
| 10. | Canal Point | 11.0% | 1.6%(+9.42)#10 | 2.1%(+8.87)#420 |
| 11. | Valparaiso | 11.0% | 1.6%(+9.41)#11 | 2.1%(+8.86)#421 |
| 12. | North Merritt Island | 10.2% | 1.6%(+8.59)#12 | 2.1%(+8.04)#481 |
| 13. | Miccosukee | 9.6% | 1.6%(+7.98)#13 | 2.1%(+7.43)#530 |
| 14. | Indian River Shores | 9.5% | 1.6%(+7.89)#14 | 2.1%(+7.34)#539 |
| 15. | Mcintosh | 9.1% | 1.6%(+7.49)#15 | 2.1%(+6.94)#563 |
| 16. | Malabar | 8.5% | 1.6%(+6.86)#16 | 2.1%(+6.31)#645 |
| 17. | Palm Beach Shores | 8.3% | 1.6%(+6.72)#17 | 2.1%(+6.17)#664 |
| 18. | Feather Sound | 8.1% | 1.6%(+6.49)#18 | 2.1%(+5.94)#705 |
| 19. | Viera East | 7.7% | 1.6%(+6.07)#19 | 2.1%(+5.52)#777 |
| 20. | Satellite Beach | 7.6% | 1.6%(+5.99)#20 | 2.1%(+5.44)#794 |
| 21. | Fisher Island | 7.4% | 1.6%(+5.85)#21 | 2.1%(+5.30)#819 |
| 22. | Melbourne Beach | 7.4% | 1.6%(+5.78)#22 | 2.1%(+5.23)#830 |
| 23. | West Melbourne | 7.3% | 1.6%(+5.70)#23 | 2.1%(+5.15)#849 |
| 24. | Melbourne Village | 7.2% | 1.6%(+5.61)#24 | 2.1%(+5.06)#872 |
| 25. | Timber Pines | 7.1% | 1.6%(+5.53)#25 | 2.1%(+4.98)#904 |
| 26. | Lake Lorraine | 7.0% | 1.6%(+5.42)#26 | 2.1%(+4.87)#923 |
| 27. | Cortez | 6.9% | 1.6%(+5.32)#27 | 2.1%(+4.77)#953 |
| 28. | Merritt Island | 6.8% | 1.6%(+5.24)#28 | 2.1%(+4.69)#972 |
| 29. | Woodlawn Beach | 6.8% | 1.6%(+5.18)#29 | 2.1%(+4.63)#987 |
| 30. | Holley | 6.5% | 1.6%(+4.87)#30 | 2.1%(+4.32)#1,057 |
| 31. | Cocoa Beach | 6.5% | 1.6%(+4.85)#31 | 2.1%(+4.30)#1,065 |
| 32. | Viera West | 6.2% | 1.6%(+4.64)#32 | 2.1%(+4.09)#1,146 |
| 33. | Wallace | 6.2% | 1.6%(+4.58)#33 | 2.1%(+4.03)#1,170 |
| 34. | Rainbow Springs | 6.0% | 1.6%(+4.42)#34 | 2.1%(+3.87)#1,229 |
| 35. | Tiger Point | 6.0% | 1.6%(+4.40)#35 | 2.1%(+3.85)#1,236 |
| 36. | Marco Shores-Hammock Bay | 5.8% | 1.6%(+4.25)#36 | 2.1%(+3.70)#1,317 |
| 37. | Niceville | 5.8% | 1.6%(+4.24)#37 | 2.1%(+3.69)#1,321 |
| 38. | Spring Lake | 5.8% | 1.6%(+4.19)#38 | 2.1%(+3.64)#1,347 |
| 39. | Sugarmill Woods | 5.8% | 1.6%(+4.17)#39 | 2.1%(+3.62)#1,353 |
| 40. | Indian Lake Estates | 5.8% | 1.6%(+4.17)#40 | 2.1%(+3.62)#1,355 |
| 41. | South Patrick Shores | 5.7% | 1.6%(+4.10)#41 | 2.1%(+3.55)#1,397 |
| 42. | Esto | 5.6% | 1.6%(+4.00)#42 | 2.1%(+3.45)#1,450 |
| 43. | Ponce Inlet | 5.6% | 1.6%(+3.99)#43 | 2.1%(+3.44)#1,457 |
| 44. | Pensacola Station | 5.4% | 1.6%(+3.85)#44 | 2.1%(+3.30)#1,533 |
| 45. | Big Coppitt Key | 5.3% | 1.6%(+3.75)#45 | 2.1%(+3.20)#1,599 |
| 46. | Heathrow | 5.3% | 1.6%(+3.74)#46 | 2.1%(+3.19)#1,603 |
| 47. | Big Pine Key | 5.3% | 1.6%(+3.66)#47 | 2.1%(+3.11)#1,644 |
| 48. | Molino | 5.2% | 1.6%(+3.58)#48 | 2.1%(+3.03)#1,710 |
| 49. | Melbourne | 5.1% | 1.6%(+3.53)#49 | 2.1%(+2.98)#1,748 |
| 50. | Pace | 5.1% | 1.6%(+3.50)#50 | 2.1%(+2.95)#1,764 |
| 51. | Oakland | 5.0% | 1.6%(+3.37)#51 | 2.1%(+2.82)#1,858 |
| 52. | Shalimar | 5.0% | 1.6%(+3.36)#52 | 2.1%(+2.81)#1,864 |
| 53. | Seffner | 4.9% | 1.6%(+3.33)#53 | 2.1%(+2.78)#1,881 |
| 54. | Daytona Beach Shores | 4.9% | 1.6%(+3.26)#54 | 2.1%(+2.71)#1,932 |
| 55. | Atlantic Beach | 4.8% | 1.6%(+3.24)#55 | 2.1%(+2.69)#1,948 |
| 56. | Pea Ridge | 4.8% | 1.6%(+3.17)#56 | 2.1%(+2.62)#2,000 |
| 57. | Allentown | 4.7% | 1.6%(+3.11)#57 | 2.1%(+2.56)#2,045 |
| 58. | Mary Esther | 4.7% | 1.6%(+3.09)#58 | 2.1%(+2.54)#2,061 |
| 59. | Ocean City | 4.7% | 1.6%(+3.06)#59 | 2.1%(+2.51)#2,091 |
| 60. | Fort Denaud | 4.6% | 1.6%(+3.01)#60 | 2.1%(+2.46)#2,135 |
| 61. | Rockledge | 4.6% | 1.6%(+2.96)#61 | 2.1%(+2.41)#2,175 |
| 62. | Redington Beach | 4.5% | 1.6%(+2.94)#62 | 2.1%(+2.39)#2,200 |
| 63. | Navarre | 4.5% | 1.6%(+2.92)#63 | 2.1%(+2.37)#2,220 |
| 64. | Montverde | 4.5% | 1.6%(+2.91)#64 | 2.1%(+2.36)#2,226 |
| 65. | Pelican Marsh | 4.5% | 1.6%(+2.90)#65 | 2.1%(+2.35)#2,234 |
| 66. | Paxton | 4.5% | 1.6%(+2.89)#66 | 2.1%(+2.34)#2,240 |
| 67. | Cape Canaveral | 4.4% | 1.6%(+2.80)#67 | 2.1%(+2.25)#2,313 |
| 68. | Oviedo | 4.4% | 1.6%(+2.78)#68 | 2.1%(+2.23)#2,333 |
| 69. | Minneola | 4.3% | 1.6%(+2.70)#69 | 2.1%(+2.15)#2,403 |
| 70. | Hypoluxo | 4.3% | 1.6%(+2.68)#70 | 2.1%(+2.13)#2,422 |
| 71. | Winter Park | 4.2% | 1.6%(+2.65)#71 | 2.1%(+2.10)#2,456 |
| 72. | Navarre Beach | 4.2% | 1.6%(+2.62)#72 | 2.1%(+2.07)#2,490 |
| 73. | Titusville | 4.2% | 1.6%(+2.62)#73 | 2.1%(+2.07)#2,499 |
| 74. | Laurel Hill | 4.2% | 1.6%(+2.57)#74 | 2.1%(+2.02)#2,564 |
| 75. | Upper Grand Lagoon | 4.2% | 1.6%(+2.57)#75 | 2.1%(+2.02)#2,573 |
| 76. | Palm Bay | 4.1% | 1.6%(+2.55)#76 | 2.1%(+2.00)#2,596 |
| 77. | Lely Resort | 4.1% | 1.6%(+2.52)#77 | 2.1%(+1.97)#2,634 |
| 78. | Bithlo | 4.1% | 1.6%(+2.49)#78 | 2.1%(+1.94)#2,658 |
| 79. | Highland Beach | 4.1% | 1.6%(+2.48)#79 | 2.1%(+1.93)#2,660 |
| 80. | Grant Valkaria | 4.1% | 1.6%(+2.46)#80 | 2.1%(+1.91)#2,707 |
| 81. | Cabana Colony | 4.1% | 1.6%(+2.45)#81 | 2.1%(+1.90)#2,711 |
| 82. | Alafaya | 4.0% | 1.6%(+2.45)#82 | 2.1%(+1.90)#2,716 |
| 83. | Gotha | 4.0% | 1.6%(+2.40)#83 | 2.1%(+1.85)#2,782 |
| 84. | Cedar Key | 4.0% | 1.6%(+2.37)#84 | 2.1%(+1.82)#2,810 |
| 85. | Indian Harbour Beach | 3.9% | 1.6%(+2.32)#85 | 2.1%(+1.77)#2,864 |
| 86. | Lynn Haven | 3.9% | 1.6%(+2.28)#86 | 2.1%(+1.73)#2,924 |
| 87. | Longboat Key | 3.8% | 1.6%(+2.19)#87 | 2.1%(+1.64)#3,035 |
| 88. | Orangetree | 3.8% | 1.6%(+2.18)#88 | 2.1%(+1.63)#3,046 |
| 89. | Union Park | 3.8% | 1.6%(+2.15)#89 | 2.1%(+1.60)#3,090 |
| 90. | Cypress Lake | 3.8% | 1.6%(+2.15)#90 | 2.1%(+1.60)#3,091 |
| 91. | Conway | 3.7% | 1.6%(+2.09)#91 | 2.1%(+1.54)#3,187 |
| 92. | Mims | 3.6% | 1.6%(+2.01)#92 | 2.1%(+1.46)#3,336 |
| 93. | Doctor Phillips | 3.6% | 1.6%(+1.99)#93 | 2.1%(+1.44)#3,366 |
| 94. | Bay Pines | 3.6% | 1.6%(+1.95)#94 | 2.1%(+1.40)#3,433 |
| 95. | Old Miakka | 3.5% | 1.6%(+1.95)#95 | 2.1%(+1.40)#3,436 |
| 96. | South Pasadena | 3.5% | 1.6%(+1.94)#96 | 2.1%(+1.39)#3,463 |
| 97. | Sea Ranch Lakes | 3.5% | 1.6%(+1.92)#97 | 2.1%(+1.37)#3,498 |
| 98. | Ocklawaha | 3.5% | 1.6%(+1.87)#98 | 2.1%(+1.32)#3,580 |
| 99. | Lake Kerr | 3.4% | 1.6%(+1.83)#99 | 2.1%(+1.28)#3,665 |
| 100. | Milton | 3.4% | 1.6%(+1.83)#100 | 2.1%(+1.27)#3,676 |
Common Questions
What are the Top 10 Cities with the Highest Percentage of Population Employed in Architecture & Engineering in Florida?
Top 10 Cities with the Highest Percentage of Population Employed in Architecture & Engineering in Florida are:
#1
53.3%
#2
30.6%
#3
19.6%
#4
14.2%
#5
14.1%
#6
13.9%
#7
11.8%
#8
11.0%
#9
11.0%
#10
9.5%
What city has the Highest Percentage of Population Employed in Architecture & Engineering in Florida?
Horseshoe Beach has the Highest Percentage of Population Employed in Architecture & Engineering in Florida with 53.3%.
What is the Percentage of Population Employed in Architecture & Engineering in the State of Florida?
Percentage of Population Employed in Architecture & Engineering in Florida is 1.6%.
What is the Percentage of Population Employed in Architecture & Engineering in the United States?
Percentage of Population Employed in Architecture & Engineering in the United States is 2.1%.