Monmouth, CA Map & Demographics
Monmouth Map
Monmouth Overview
$11,478
PER CAPITA INCOME
$39,083
AVG FAMILY INCOME
$39,167
AVG HOUSEHOLD INCOME
0.25
INEQUALITY / GINI INDEX
202
TOTAL POPULATION
111
MALE POPULATION
91
FEMALE POPULATION
121.98
MALES / 100 FEMALES
81.98
FEMALES / 100 MALES
28.5
MEDIAN AGE
4.6
AVG FAMILY SIZE
4.2
AVG HOUSEHOLD SIZE
66
LABOR FORCE [ PEOPLE ]
55.0%
PERCENT IN LABOR FORCE
6.1%
UNEMPLOYMENT RATE
Income in Monmouth
Income Overview in Monmouth
Per Capita Income in Monmouth is $11,478, while median incomes of families and households are $39,083 and $39,167 respectively.
| Characteristic | Number | Measure |
| Per Capita Income | 202 | $11,478 |
| Median Family Income | 43 | $39,083 |
| Mean Family Income | 43 | $46,235 |
| Median Household Income | 48 | $39,167 |
| Mean Household Income | 48 | $46,563 |
| Income Deficit | 43 | $0 |
| Wage / Income Gap (%) | 202 | 0.00% |
| Wage / Income Gap ($) | 202 | 100.00¢ per $1 |
| Gini / Inequality Index | 202 | 0.25 |
Earnings by Sex in Monmouth
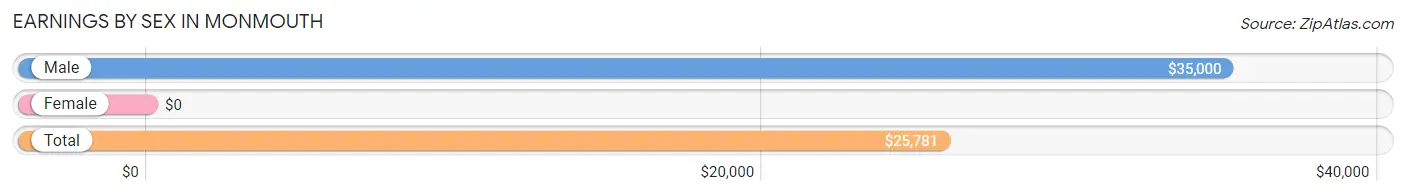
| Sex | Number | Average Earnings |
| Male | 36 (55.4%) | $35,000 |
| Female | 29 (44.6%) | $0 |
| Total | 65 (100.0%) | $25,781 |
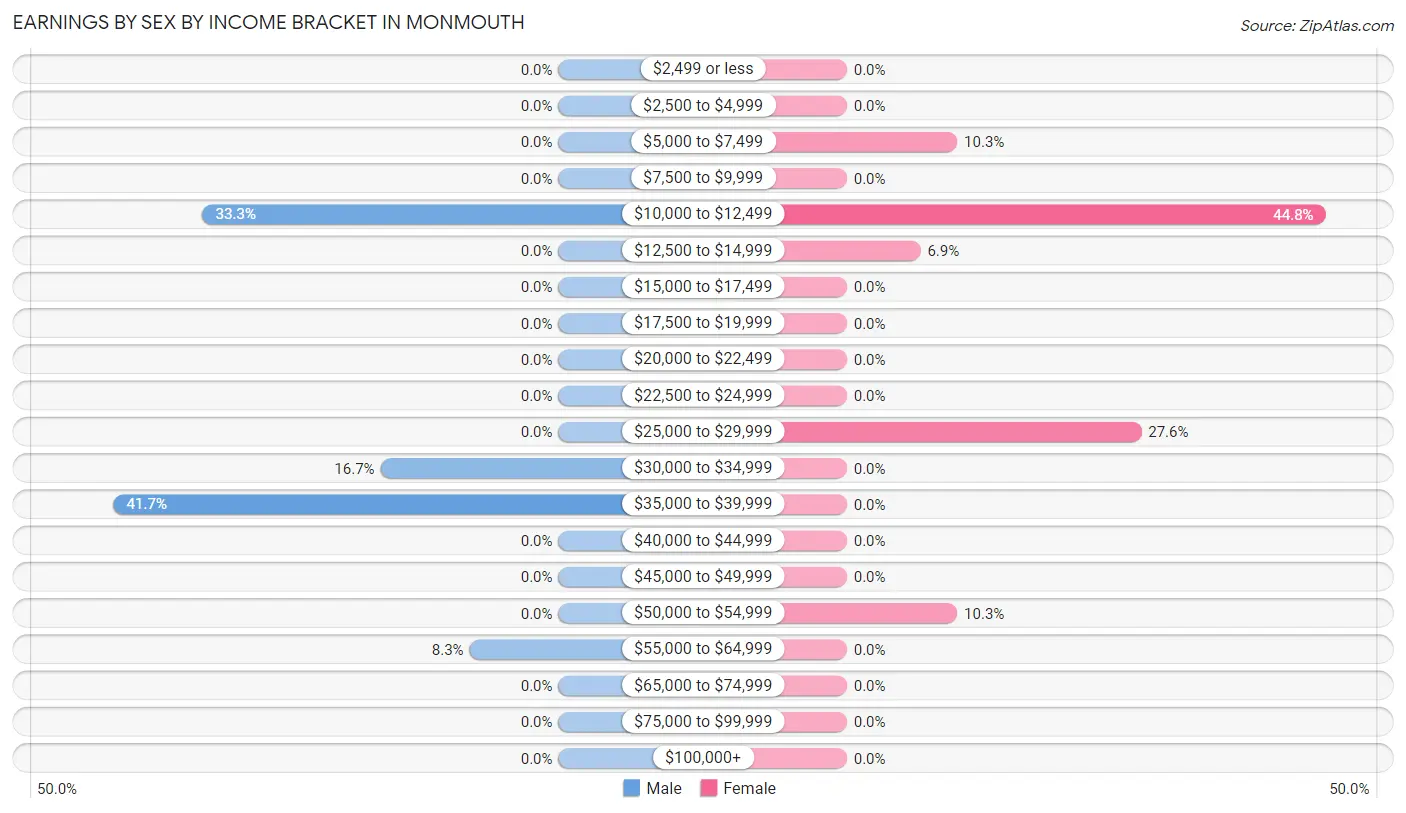
Earnings by Sex by Income Bracket in Monmouth
The most common earnings brackets in Monmouth are $35,000 to $39,999 for men (15 | 41.7%) and $10,000 to $12,499 for women (13 | 44.8%).
| Income | Male | Female |
| $2,499 or less | 0 (0.0%) | 0 (0.0%) |
| $2,500 to $4,999 | 0 (0.0%) | 0 (0.0%) |
| $5,000 to $7,499 | 0 (0.0%) | 3 (10.3%) |
| $7,500 to $9,999 | 0 (0.0%) | 0 (0.0%) |
| $10,000 to $12,499 | 12 (33.3%) | 13 (44.8%) |
| $12,500 to $14,999 | 0 (0.0%) | 2 (6.9%) |
| $15,000 to $17,499 | 0 (0.0%) | 0 (0.0%) |
| $17,500 to $19,999 | 0 (0.0%) | 0 (0.0%) |
| $20,000 to $22,499 | 0 (0.0%) | 0 (0.0%) |
| $22,500 to $24,999 | 0 (0.0%) | 0 (0.0%) |
| $25,000 to $29,999 | 0 (0.0%) | 8 (27.6%) |
| $30,000 to $34,999 | 6 (16.7%) | 0 (0.0%) |
| $35,000 to $39,999 | 15 (41.7%) | 0 (0.0%) |
| $40,000 to $44,999 | 0 (0.0%) | 0 (0.0%) |
| $45,000 to $49,999 | 0 (0.0%) | 0 (0.0%) |
| $50,000 to $54,999 | 0 (0.0%) | 3 (10.3%) |
| $55,000 to $64,999 | 3 (8.3%) | 0 (0.0%) |
| $65,000 to $74,999 | 0 (0.0%) | 0 (0.0%) |
| $75,000 to $99,999 | 0 (0.0%) | 0 (0.0%) |
| $100,000+ | 0 (0.0%) | 0 (0.0%) |
| Total | 36 (100.0%) | 29 (100.0%) |
Earnings by Sex by Educational Attainment in Monmouth
| Educational Attainment | Male Income | Female Income |
| Less than High School | - | - |
| High School Diploma | - | - |
| College or Associate's Degree | - | - |
| Bachelor's Degree | - | - |
| Graduate Degree | - | - |
| Total | $38,000 | $0 |
Family Income in Monmouth
Family Income Brackets in Monmouth
According to the Monmouth family income data, there are 18 families falling into the $35,000 to $49,999 income range, which is the most common income bracket and makes up 41.9% of all families.
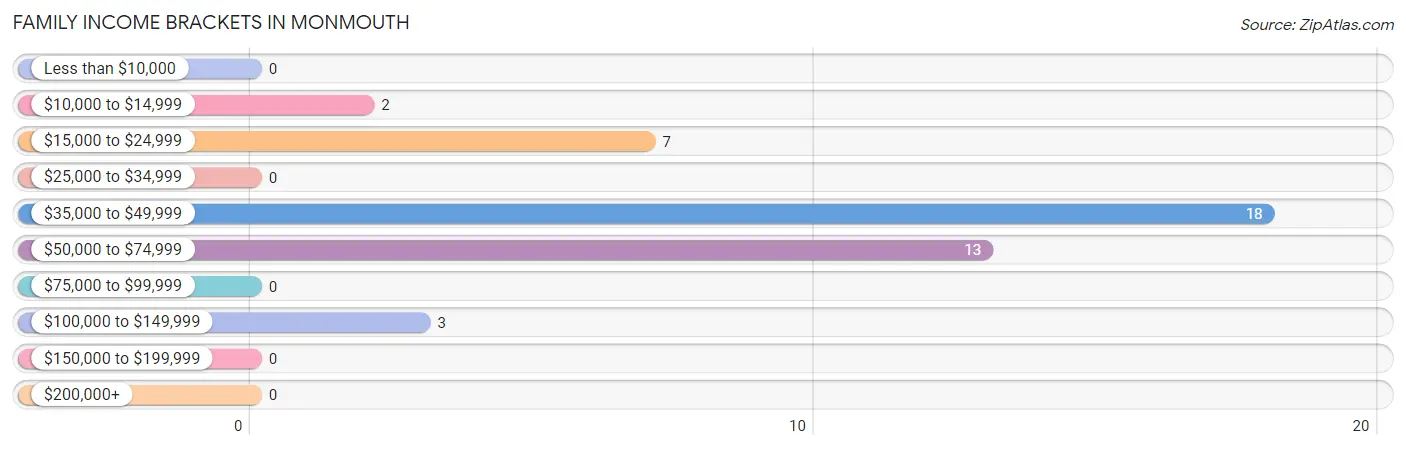
| Income Bracket | # Families | % Families |
| Less than $10,000 | 0 | 0.0% |
| $10,000 to $14,999 | 2 | 4.7% |
| $15,000 to $24,999 | 7 | 16.3% |
| $25,000 to $34,999 | 0 | 0.0% |
| $35,000 to $49,999 | 18 | 41.9% |
| $50,000 to $74,999 | 13 | 30.2% |
| $75,000 to $99,999 | 0 | 0.0% |
| $100,000 to $149,999 | 3 | 7.0% |
| $150,000 to $199,999 | 0 | 0.0% |
| $200,000+ | 0 | 0.0% |
Family Income by Famaliy Size in Monmouth
| Income Bracket | # Families | Median Income |
| 2-Person Families | 2 (4.6%) | $0 |
| 3-Person Families | 10 (23.3%) | $0 |
| 4-Person Families | 10 (23.3%) | $0 |
| 5-Person Families | 6 (14.0%) | $0 |
| 6-Person Families | 15 (34.9%) | $0 |
| 7+ Person Families | 0 (0.0%) | $0 |
| Total | 43 (100.0%) | $39,083 |
Family Income by Number of Earners in Monmouth
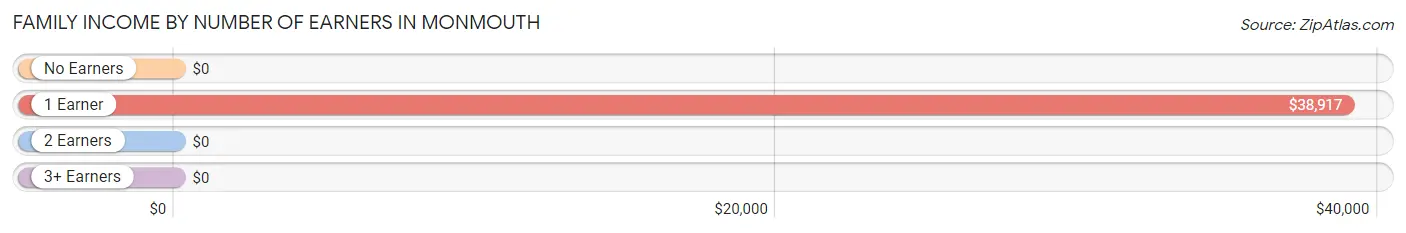
| Number of Earners | # Families | Median Income |
| No Earners | 0 (0.0%) | $0 |
| 1 Earner | 27 (62.8%) | $38,917 |
| 2 Earners | 16 (37.2%) | $0 |
| 3+ Earners | 0 (0.0%) | $0 |
| Total | 43 (100.0%) | $39,083 |
Household Income in Monmouth
Household Income Brackets in Monmouth
With 21 households falling in the category, the $35,000 to $49,999 income range is the most frequent in Monmouth, accounting for 43.8% of all households.
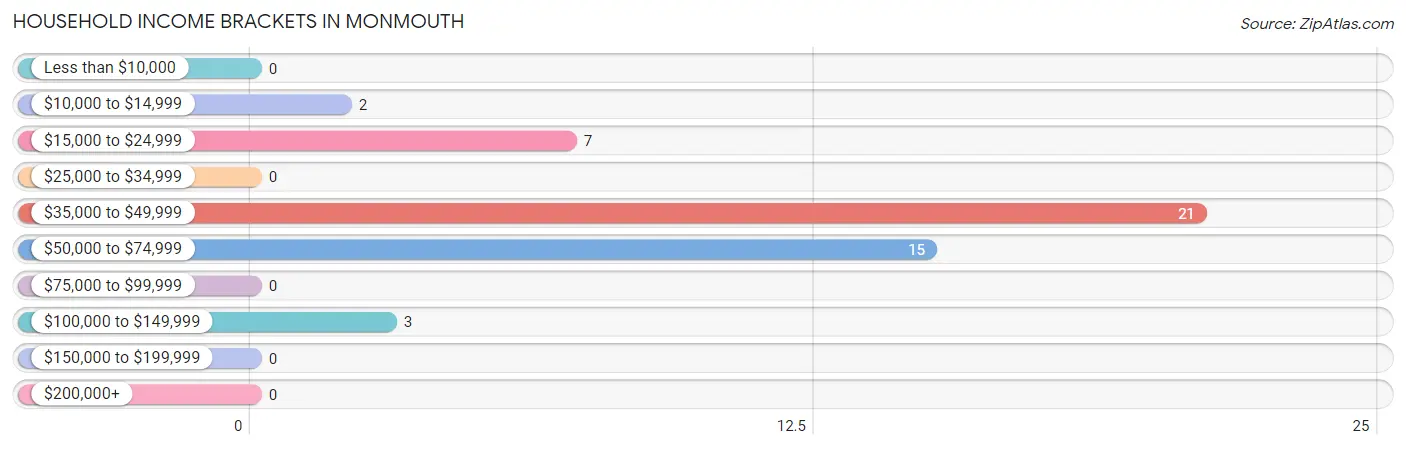
| Income Bracket | # Households | % Households |
| Less than $10,000 | 0 | 0.0% |
| $10,000 to $14,999 | 2 | 4.2% |
| $15,000 to $24,999 | 7 | 14.6% |
| $25,000 to $34,999 | 0 | 0.0% |
| $35,000 to $49,999 | 21 | 43.8% |
| $50,000 to $74,999 | 15 | 31.3% |
| $75,000 to $99,999 | 0 | 0.0% |
| $100,000 to $149,999 | 3 | 6.3% |
| $150,000 to $199,999 | 0 | 0.0% |
| $200,000+ | 0 | 0.0% |
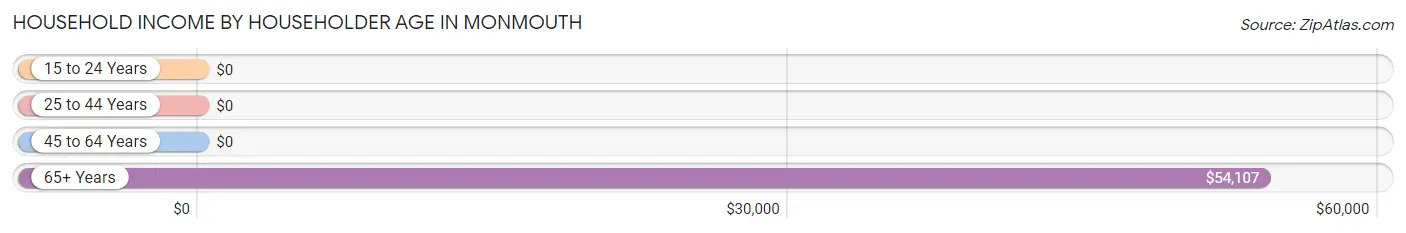
Household Income by Householder Age in Monmouth
The median household income in Monmouth is $39,167, with the highest median household income of $54,107 found in the 65+ years age bracket for the primary householder. A total of 21 households (43.8%) fall into this category. Meanwhile, the 15 to 24 years age bracket for the primary householder has the lowest median household income of $0, with 7 households (14.6%) in this group.
| Income Bracket | # Households | Median Income |
| 15 to 24 Years | 7 (14.6%) | $0 |
| 25 to 44 Years | 2 (4.2%) | $0 |
| 45 to 64 Years | 18 (37.5%) | $0 |
| 65+ Years | 21 (43.8%) | $54,107 |
| Total | 48 (100.0%) | $39,167 |
Poverty in Monmouth
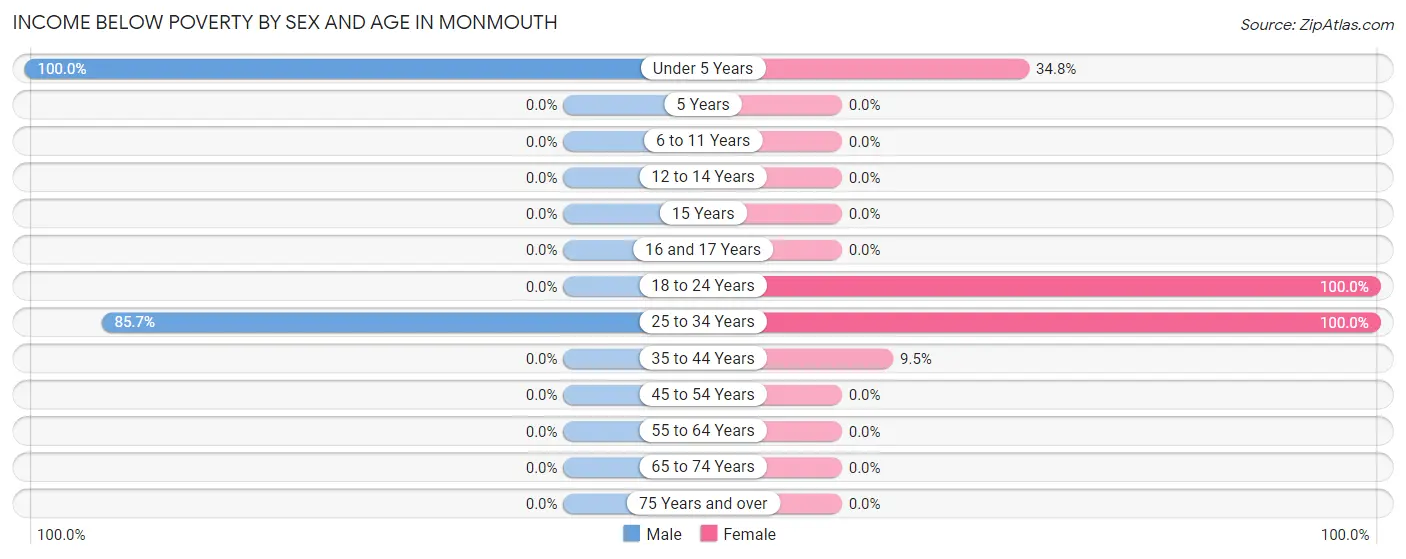
Income Below Poverty by Sex and Age in Monmouth
With 19.8% poverty level for males and 20.9% for females among the residents of Monmouth, under 5 year old males and 18 to 24 year old females are the most vulnerable to poverty, with 10 males (100.0%) and 7 females (100.0%) in their respective age groups living below the poverty level.
| Age Bracket | Male | Female |
| Under 5 Years | 10 (100.0%) | 8 (34.8%) |
| 5 Years | 0 (0.0%) | 0 (0.0%) |
| 6 to 11 Years | 0 (0.0%) | 0 (0.0%) |
| 12 to 14 Years | 0 (0.0%) | 0 (0.0%) |
| 15 Years | 0 (0.0%) | 0 (0.0%) |
| 16 and 17 Years | 0 (0.0%) | 0 (0.0%) |
| 18 to 24 Years | 0 (0.0%) | 7 (100.0%) |
| 25 to 34 Years | 12 (85.7%) | 2 (100.0%) |
| 35 to 44 Years | 0 (0.0%) | 2 (9.5%) |
| 45 to 54 Years | 0 (0.0%) | 0 (0.0%) |
| 55 to 64 Years | 0 (0.0%) | 0 (0.0%) |
| 65 to 74 Years | 0 (0.0%) | 0 (0.0%) |
| 75 Years and over | 0 (0.0%) | 0 (0.0%) |
| Total | 22 (19.8%) | 19 (20.9%) |
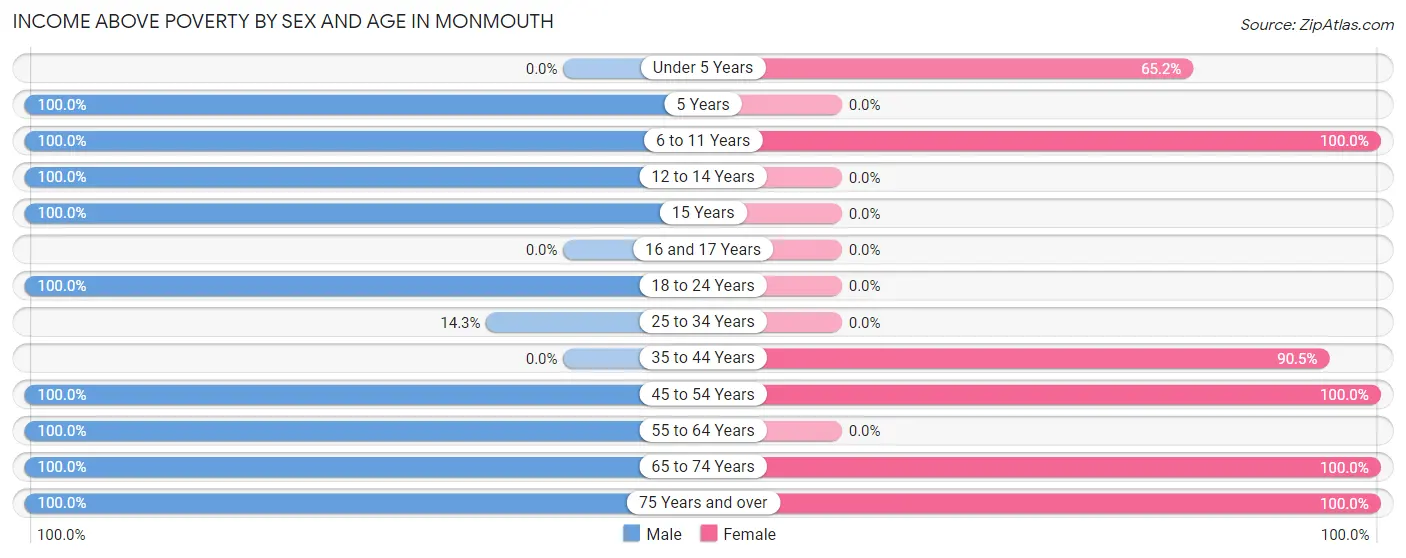
Income Above Poverty by Sex and Age in Monmouth
According to the poverty statistics in Monmouth, males aged 5 years and females aged 6 to 11 years are the age groups that are most secure financially, with 100.0% of males and 100.0% of females in these age groups living above the poverty line.
| Age Bracket | Male | Female |
| Under 5 Years | 0 (0.0%) | 15 (65.2%) |
| 5 Years | 14 (100.0%) | 0 (0.0%) |
| 6 to 11 Years | 14 (100.0%) | 5 (100.0%) |
| 12 to 14 Years | 14 (100.0%) | 0 (0.0%) |
| 15 Years | 2 (100.0%) | 0 (0.0%) |
| 16 and 17 Years | 0 (0.0%) | 0 (0.0%) |
| 18 to 24 Years | 6 (100.0%) | 0 (0.0%) |
| 25 to 34 Years | 2 (14.3%) | 0 (0.0%) |
| 35 to 44 Years | 0 (0.0%) | 19 (90.5%) |
| 45 to 54 Years | 27 (100.0%) | 11 (100.0%) |
| 55 to 64 Years | 2 (100.0%) | 0 (0.0%) |
| 65 to 74 Years | 6 (100.0%) | 9 (100.0%) |
| 75 Years and over | 2 (100.0%) | 13 (100.0%) |
| Total | 89 (80.2%) | 72 (79.1%) |
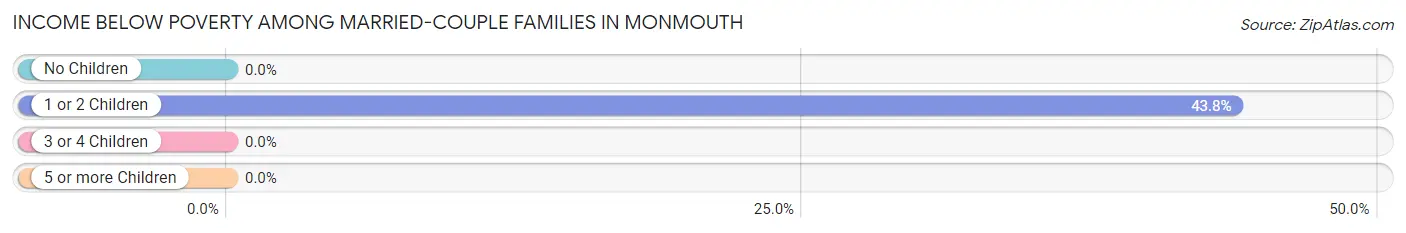
Income Below Poverty Among Married-Couple Families in Monmouth
The poverty statistics for married-couple families in Monmouth show that 22.6% or 7 of the total 31 families live below the poverty line. Families with 1 or 2 children have the highest poverty rate of 43.8%, comprising of 7 families. On the other hand, families with 3 or 4 children have the lowest poverty rate of 0.0%, which includes 0 families.
| Children | Above Poverty | Below Poverty |
| No Children | 0 (0.0%) | 0 (0.0%) |
| 1 or 2 Children | 9 (56.2%) | 7 (43.8%) |
| 3 or 4 Children | 15 (100.0%) | 0 (0.0%) |
| 5 or more Children | 0 (0.0%) | 0 (0.0%) |
| Total | 24 (77.4%) | 7 (22.6%) |
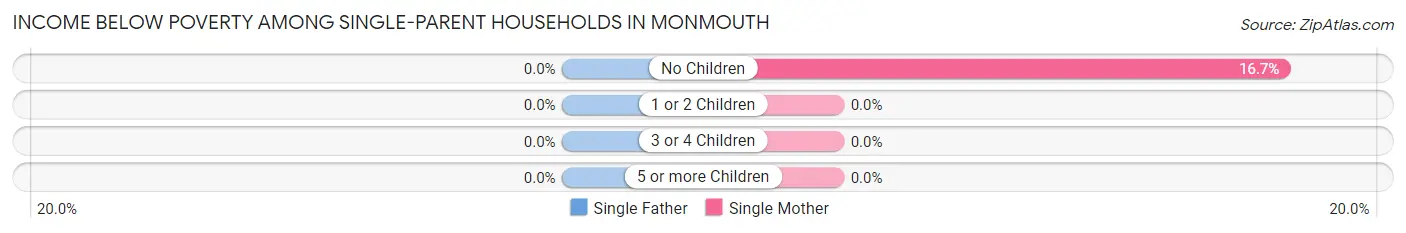
Income Below Poverty Among Single-Parent Households in Monmouth
| Children | Single Father | Single Mother |
| No Children | 0 (0.0%) | 2 (16.7%) |
| 1 or 2 Children | 0 (0.0%) | 0 (0.0%) |
| 3 or 4 Children | 0 (0.0%) | 0 (0.0%) |
| 5 or more Children | 0 (0.0%) | 0 (0.0%) |
| Total | 0 (0.0%) | 2 (16.7%) |
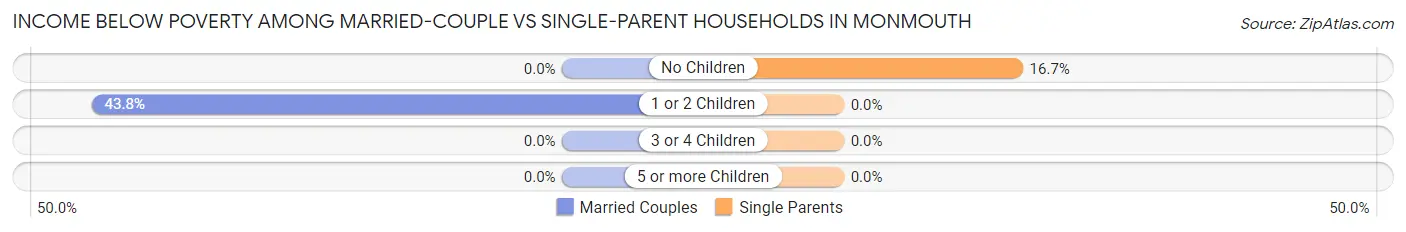
Income Below Poverty Among Married-Couple vs Single-Parent Households in Monmouth
The poverty data for Monmouth shows that 7 of the married-couple family households (22.6%) and 2 of the single-parent households (16.7%) are living below the poverty level. Within the married-couple family households, those with 1 or 2 children have the highest poverty rate, with 7 households (43.8%) falling below the poverty line. Among the single-parent households, those with no children have the highest poverty rate, with 2 household (16.7%) living below poverty.
| Children | Married-Couple Families | Single-Parent Households |
| No Children | 0 (0.0%) | 2 (16.7%) |
| 1 or 2 Children | 7 (43.8%) | 0 (0.0%) |
| 3 or 4 Children | 0 (0.0%) | 0 (0.0%) |
| 5 or more Children | 0 (0.0%) | 0 (0.0%) |
| Total | 7 (22.6%) | 2 (16.7%) |
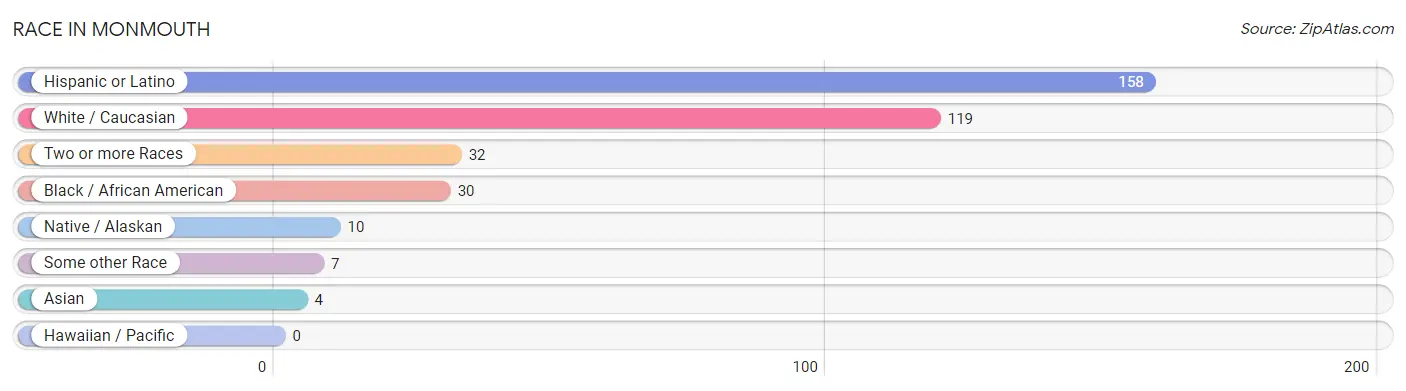
Race in Monmouth
The most populous races in Monmouth are Hispanic or Latino (158 | 78.2%), White / Caucasian (119 | 58.9%), and Two or more Races (32 | 15.8%).
| Race | # Population | % Population |
| Asian | 4 | 2.0% |
| Black / African American | 30 | 14.8% |
| Hawaiian / Pacific | 0 | 0.0% |
| Hispanic or Latino | 158 | 78.2% |
| Native / Alaskan | 10 | 5.0% |
| White / Caucasian | 119 | 58.9% |
| Two or more Races | 32 | 15.8% |
| Some other Race | 7 | 3.5% |
| Total | 202 | 100.0% |
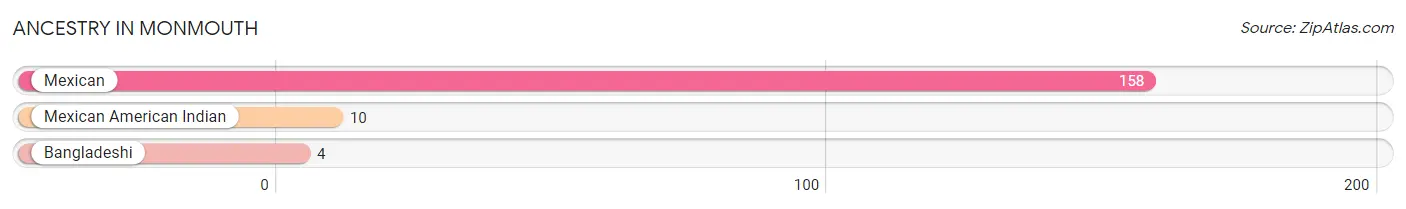
Ancestry in Monmouth
The most populous ancestries reported in Monmouth are Mexican (158 | 78.2%), Mexican American Indian (10 | 5.0%), and Bangladeshi (4 | 2.0%), together accounting for 85.2% of all Monmouth residents.
| Ancestry | # Population | % Population |
| Bangladeshi | 4 | 2.0% |
| Mexican | 158 | 78.2% |
| Mexican American Indian | 10 | 5.0% | View All 3 Rows |
Immigrants in Monmouth
The most numerous immigrant groups reported in Monmouth came from Central America (58 | 28.7%), Latin America (58 | 28.7%), Mexico (58 | 28.7%), Asia (2 | 1.0%), and Cambodia (2 | 1.0%), together accounting for 88.1% of all Monmouth residents.
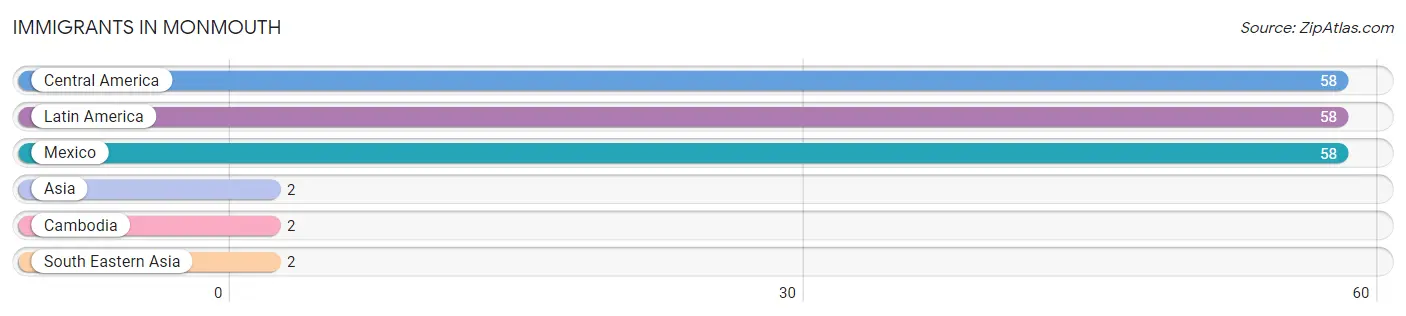
| Immigration Origin | # Population | % Population |
| Asia | 2 | 1.0% |
| Cambodia | 2 | 1.0% |
| Central America | 58 | 28.7% |
| Latin America | 58 | 28.7% |
| Mexico | 58 | 28.7% |
| South Eastern Asia | 2 | 1.0% | View All 6 Rows |
Sex and Age in Monmouth
Sex and Age in Monmouth
The most populous age groups in Monmouth are 5 to 9 Years (28 | 25.2%) for men and Under 5 Years (23 | 25.3%) for women.
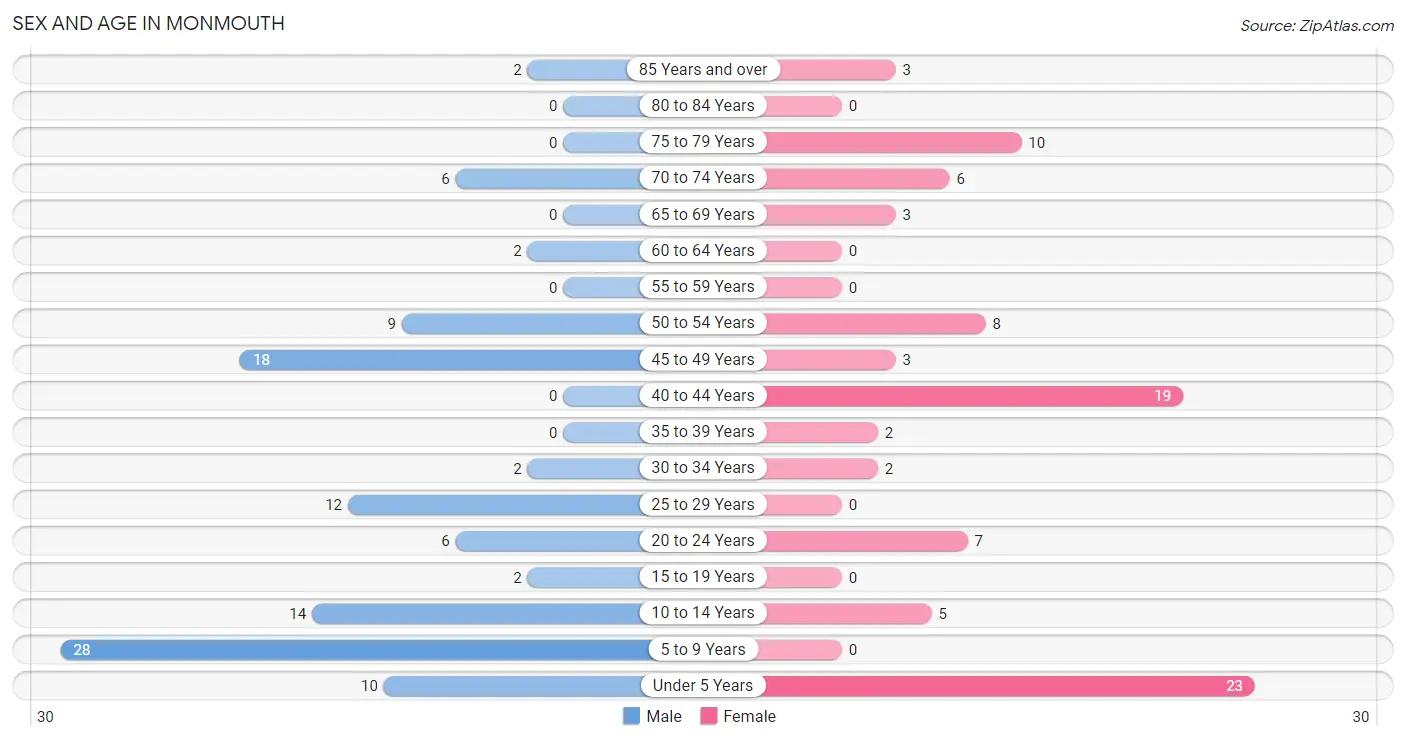
| Age Bracket | Male | Female |
| Under 5 Years | 10 (9.0%) | 23 (25.3%) |
| 5 to 9 Years | 28 (25.2%) | 0 (0.0%) |
| 10 to 14 Years | 14 (12.6%) | 5 (5.5%) |
| 15 to 19 Years | 2 (1.8%) | 0 (0.0%) |
| 20 to 24 Years | 6 (5.4%) | 7 (7.7%) |
| 25 to 29 Years | 12 (10.8%) | 0 (0.0%) |
| 30 to 34 Years | 2 (1.8%) | 2 (2.2%) |
| 35 to 39 Years | 0 (0.0%) | 2 (2.2%) |
| 40 to 44 Years | 0 (0.0%) | 19 (20.9%) |
| 45 to 49 Years | 18 (16.2%) | 3 (3.3%) |
| 50 to 54 Years | 9 (8.1%) | 8 (8.8%) |
| 55 to 59 Years | 0 (0.0%) | 0 (0.0%) |
| 60 to 64 Years | 2 (1.8%) | 0 (0.0%) |
| 65 to 69 Years | 0 (0.0%) | 3 (3.3%) |
| 70 to 74 Years | 6 (5.4%) | 6 (6.6%) |
| 75 to 79 Years | 0 (0.0%) | 10 (11.0%) |
| 80 to 84 Years | 0 (0.0%) | 0 (0.0%) |
| 85 Years and over | 2 (1.8%) | 3 (3.3%) |
| Total | 111 (100.0%) | 91 (100.0%) |
Families and Households in Monmouth
Median Family Size in Monmouth
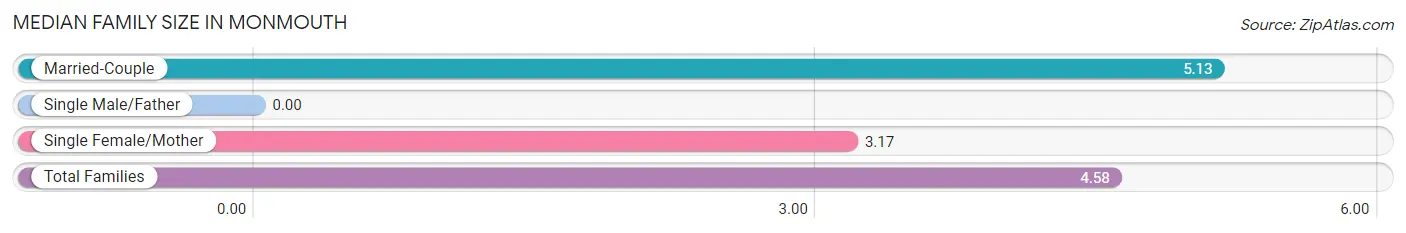
| Family Type | # Families | Family Size |
| Married-Couple | 31 (72.1%) | 5.13 |
| Single Male/Father | 0 (0.0%) | - |
| Single Female/Mother | 12 (27.9%) | 3.17 |
| Total Families | 43 (100.0%) | 4.58 |
Median Household Size in Monmouth
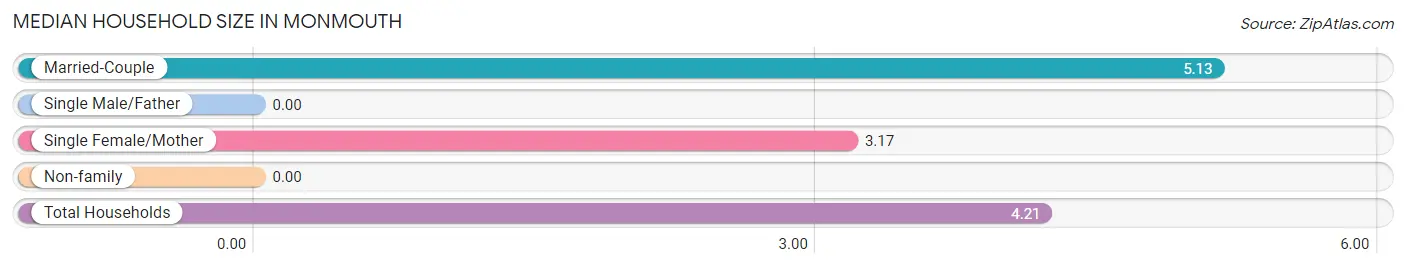
| Household Type | # Households | Household Size |
| Married-Couple | 31 (64.6%) | 5.13 |
| Single Male/Father | 0 (0.0%) | - |
| Single Female/Mother | 12 (25.0%) | 3.17 |
| Non-family | 5 (10.4%) | - |
| Total Households | 48 (100.0%) | 4.21 |
Household Size by Marriage Status in Monmouth
Out of a total of 48 households in Monmouth, 43 (89.6%) are family households, while 5 (10.4%) are nonfamily households. The most numerous type of family households are 6-person households, comprising 15, and the most common type of nonfamily households are 1-person households, comprising 5.
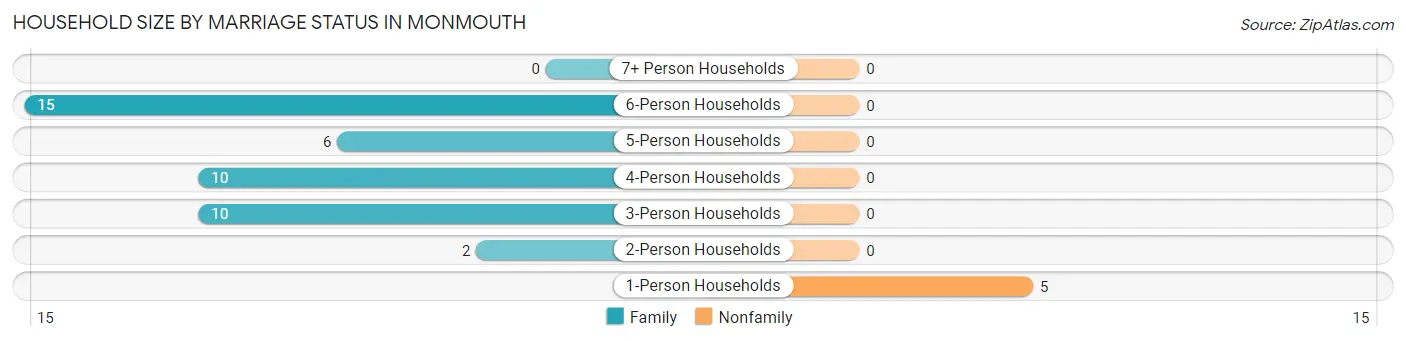
| Household Size | Family Households | Nonfamily Households |
| 1-Person Households | - | 5 (10.4%) |
| 2-Person Households | 2 (4.2%) | 0 (0.0%) |
| 3-Person Households | 10 (20.8%) | 0 (0.0%) |
| 4-Person Households | 10 (20.8%) | 0 (0.0%) |
| 5-Person Households | 6 (12.5%) | 0 (0.0%) |
| 6-Person Households | 15 (31.2%) | 0 (0.0%) |
| 7+ Person Households | 0 (0.0%) | 0 (0.0%) |
| Total | 43 (89.6%) | 5 (10.4%) |
Female Fertility in Monmouth
Fertility by Age in Monmouth
Average fertility rate in Monmouth is 212.0 births per 1,000 women. Women in the age bracket of 20 to 34 years have the highest fertility rate with 778.0 births per 1,000 women. Women in the age bracket of 20 to 34 years acount for 100.0% of all women with births.
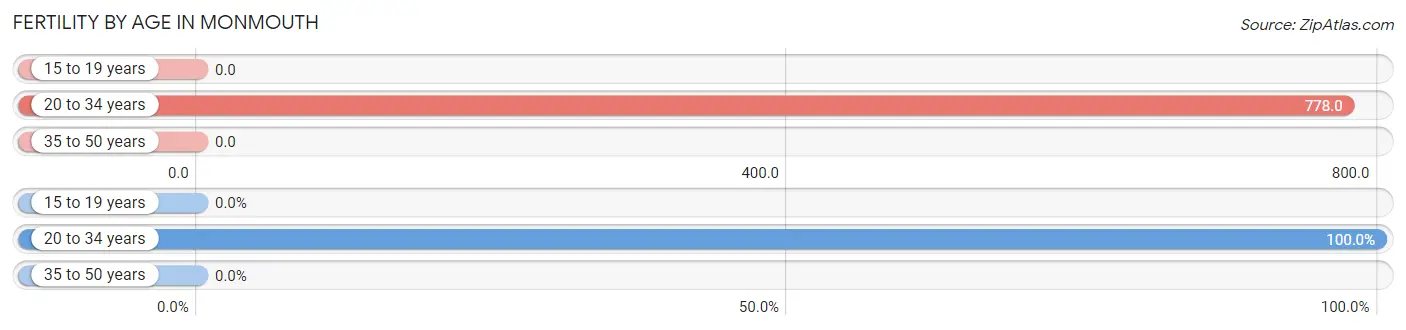
| Age Bracket | Women with Births | Births / 1,000 Women |
| 15 to 19 years | 0 (0.0%) | 0.0 |
| 20 to 34 years | 7 (100.0%) | 778.0 |
| 35 to 50 years | 0 (0.0%) | 0.0 |
| Total | 7 (100.0%) | 212.0 |
Fertility by Age by Marriage Status in Monmouth
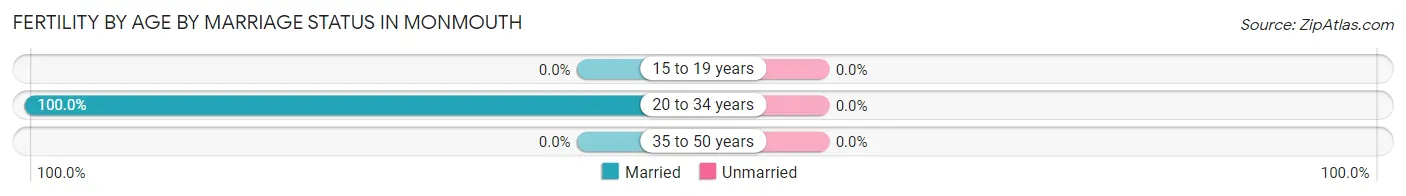
| Age Bracket | Married | Unmarried |
| 15 to 19 years | 0 (0.0%) | 0 (0.0%) |
| 20 to 34 years | 7 (100.0%) | 0 (0.0%) |
| 35 to 50 years | 0 (0.0%) | 0 (0.0%) |
| Total | 7 (100.0%) | 0 (0.0%) |
Fertility by Education in Monmouth
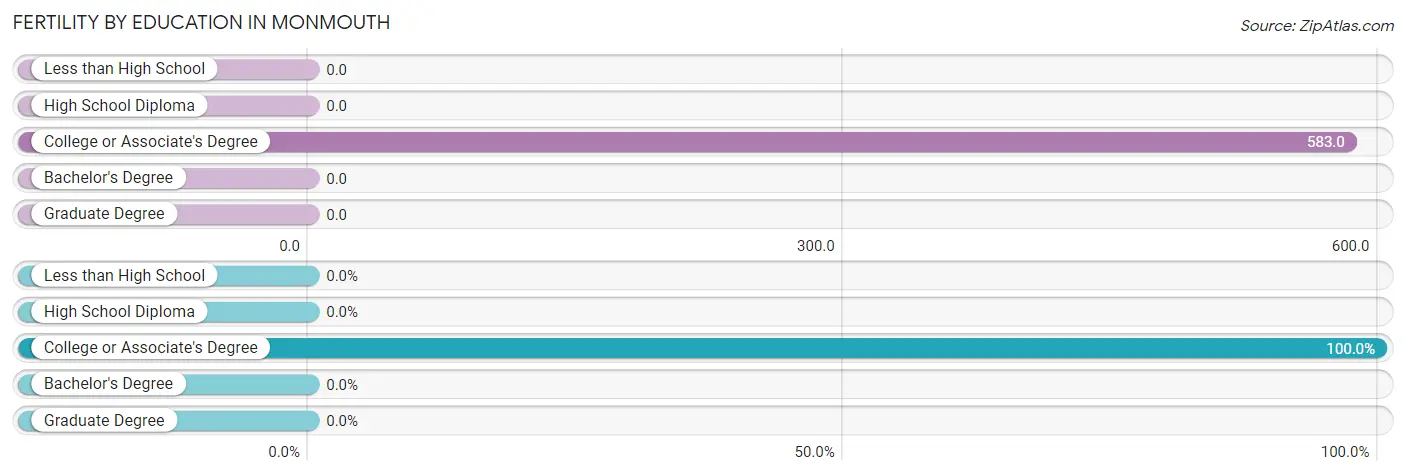
| Educational Attainment | Women with Births | Births / 1,000 Women |
| Less than High School | 0 (0.0%) | 0.0 |
| High School Diploma | 0 (0.0%) | 0.0 |
| College or Associate's Degree | 7 (100.0%) | 583.0 |
| Bachelor's Degree | 0 (0.0%) | 0.0 |
| Graduate Degree | 0 (0.0%) | 0.0 |
| Total | 7 (100.0%) | 212.0 |
Fertility by Education by Marriage Status in Monmouth
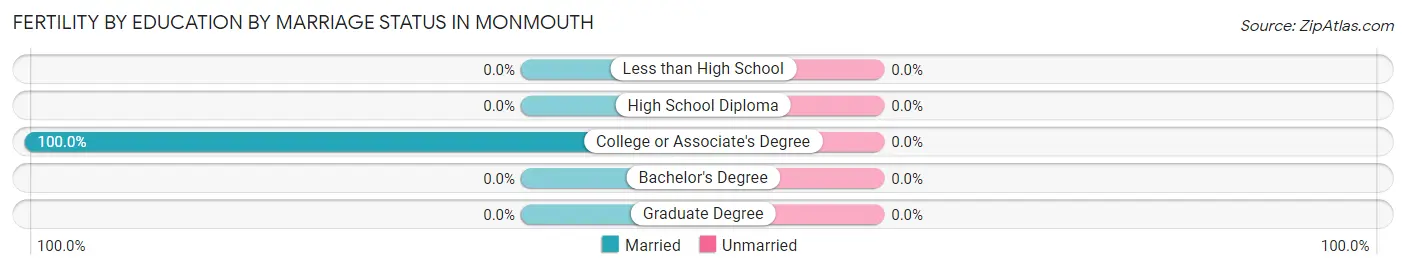
| Educational Attainment | Married | Unmarried |
| Less than High School | 0 (0.0%) | 0 (0.0%) |
| High School Diploma | 0 (0.0%) | 0 (0.0%) |
| College or Associate's Degree | 7 (100.0%) | 0 (0.0%) |
| Bachelor's Degree | 0 (0.0%) | 0 (0.0%) |
| Graduate Degree | 0 (0.0%) | 0 (0.0%) |
| Total | 7 (100.0%) | 0 (0.0%) |
Employment Characteristics in Monmouth
Employment by Class of Employer in Monmouth
Among the 62 employed individuals in Monmouth, private company employees (29 | 46.8%), local government employees (19 | 30.6%), and not-for-profit organizations (8 | 12.9%) make up the most common classes of employment.
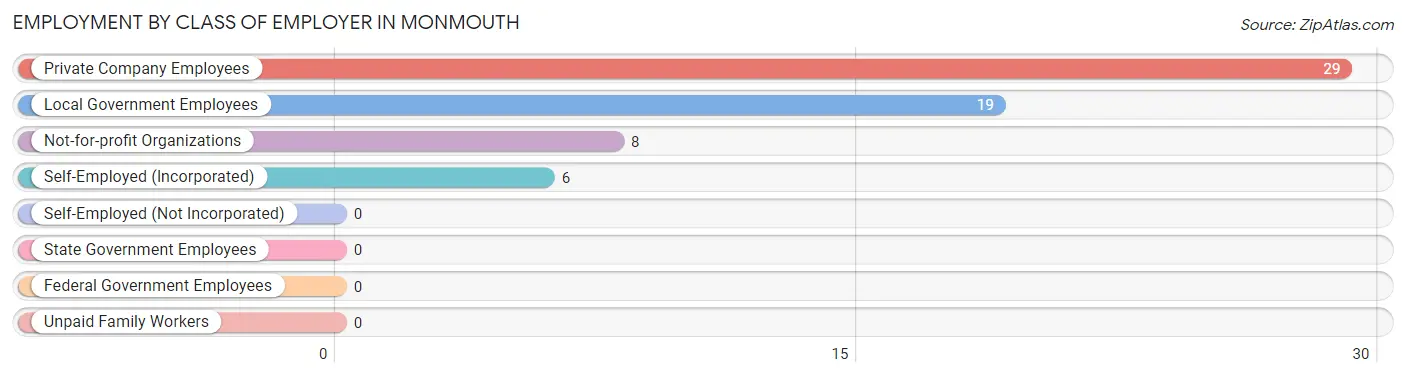
| Employer Class | # Employees | % Employees |
| Private Company Employees | 29 | 46.8% |
| Self-Employed (Incorporated) | 6 | 9.7% |
| Self-Employed (Not Incorporated) | 0 | 0.0% |
| Not-for-profit Organizations | 8 | 12.9% |
| Local Government Employees | 19 | 30.6% |
| State Government Employees | 0 | 0.0% |
| Federal Government Employees | 0 | 0.0% |
| Unpaid Family Workers | 0 | 0.0% |
| Total | 62 | 100.0% |
Employment Status by Age in Monmouth
According to the labor force statistics for Monmouth, out of the total population over 16 years of age (120), 55.0% or 66 individuals are in the labor force, with 6.1% or 4 of them unemployed. The age group with the highest labor force participation rate is 20 to 24 years, with 100.0% or 13 individuals in the labor force. Within the labor force, the 30 to 34 years age range has the highest percentage of unemployed individuals, with 50.0% or 2 of them being unemployed.
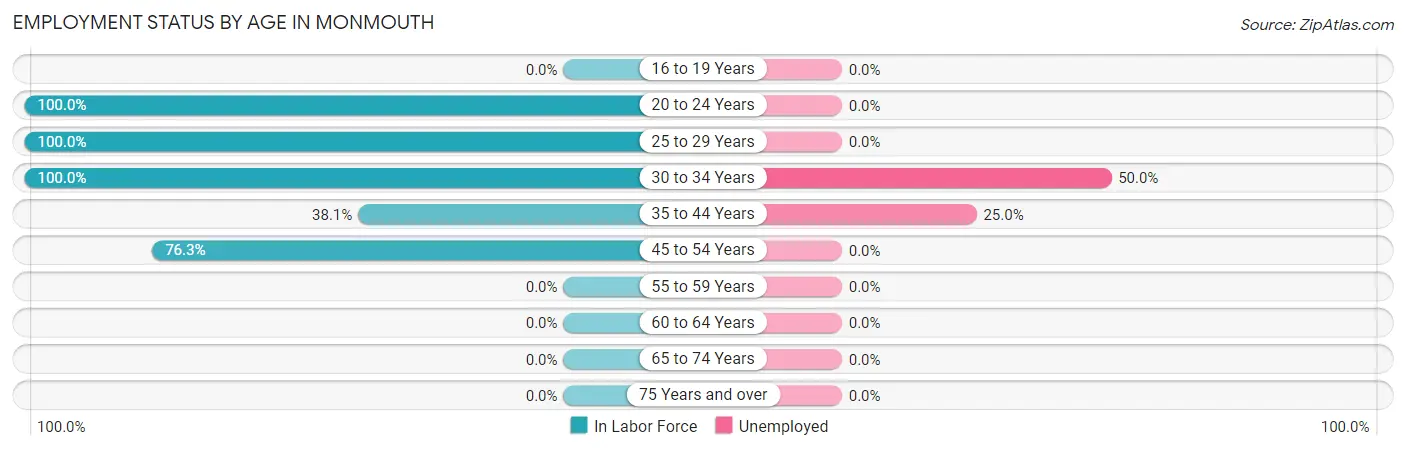
| Age Bracket | In Labor Force | Unemployed |
| 16 to 19 Years | 0 (0.0%) | 0 (0.0%) |
| 20 to 24 Years | 13 (100.0%) | 0 (0.0%) |
| 25 to 29 Years | 12 (100.0%) | 0 (0.0%) |
| 30 to 34 Years | 4 (100.0%) | 2 (50.0%) |
| 35 to 44 Years | 8 (38.1%) | 2 (25.0%) |
| 45 to 54 Years | 29 (76.3%) | 0 (0.0%) |
| 55 to 59 Years | 0 (0.0%) | 0 (0.0%) |
| 60 to 64 Years | 0 (0.0%) | 0 (0.0%) |
| 65 to 74 Years | 0 (0.0%) | 0 (0.0%) |
| 75 Years and over | 0 (0.0%) | 0 (0.0%) |
| Total | 66 (55.0%) | 4 (6.1%) |
Employment Status by Educational Attainment in Monmouth
According to labor force statistics for Monmouth, 68.8% of individuals (53) out of the total population between 25 and 64 years of age (77) are in the labor force, with 7.5% or 4 of them being unemployed. The group with the highest labor force participation rate are those with the educational attainment of college / associate degree, with 100.0% or 10 individuals in the labor force. Within the labor force, individuals with college / associate degree education have the highest percentage of unemployment, with 40.0% or 4 of them being unemployed.
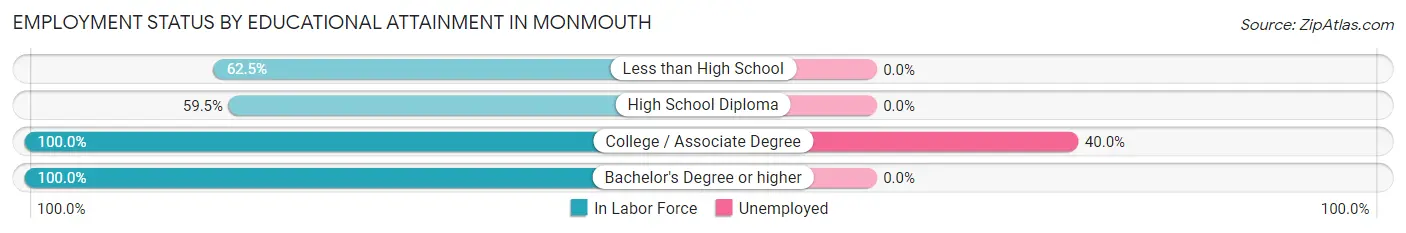
| Educational Attainment | In Labor Force | Unemployed |
| Less than High School | 15 (62.5%) | 0 (0.0%) |
| High School Diploma | 22 (59.5%) | 0 (0.0%) |
| College / Associate Degree | 10 (100.0%) | 4 (40.0%) |
| Bachelor's Degree or higher | 6 (100.0%) | 0 (0.0%) |
| Total | 53 (68.8%) | 6 (7.5%) |
Employment Occupations by Sex in Monmouth
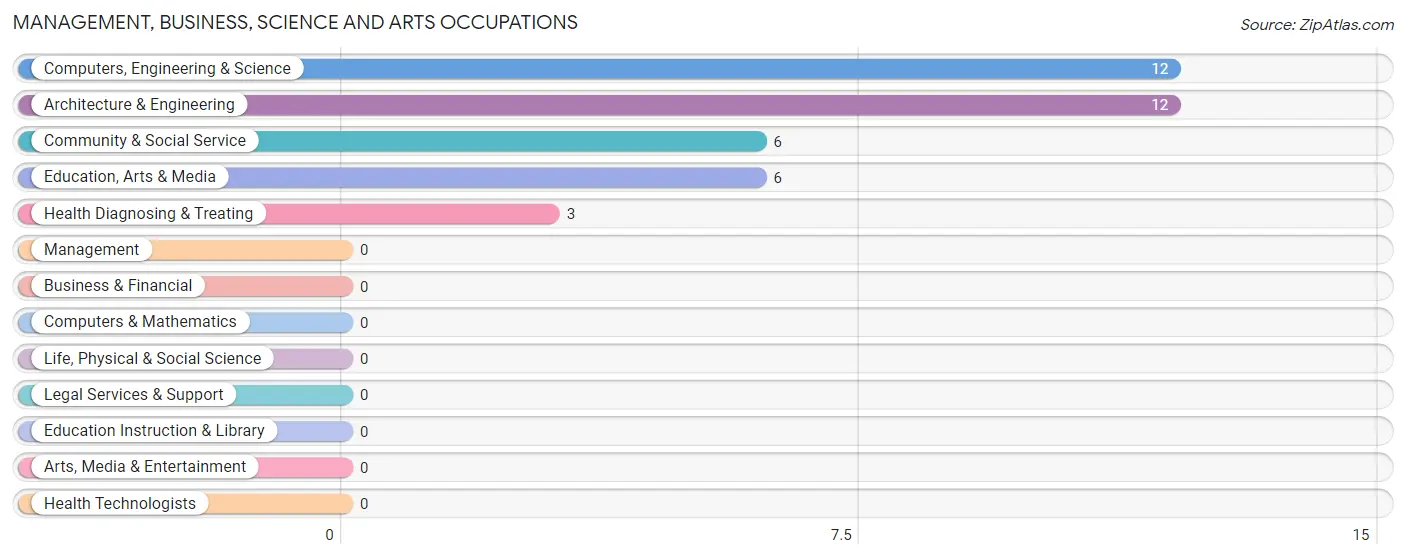
Management, Business, Science and Arts Occupations
The most common Management, Business, Science and Arts occupations in Monmouth are Computers, Engineering & Science (12 | 19.4%), Architecture & Engineering (12 | 19.4%), Community & Social Service (6 | 9.7%), Education, Arts & Media (6 | 9.7%), and Health Diagnosing & Treating (3 | 4.8%).
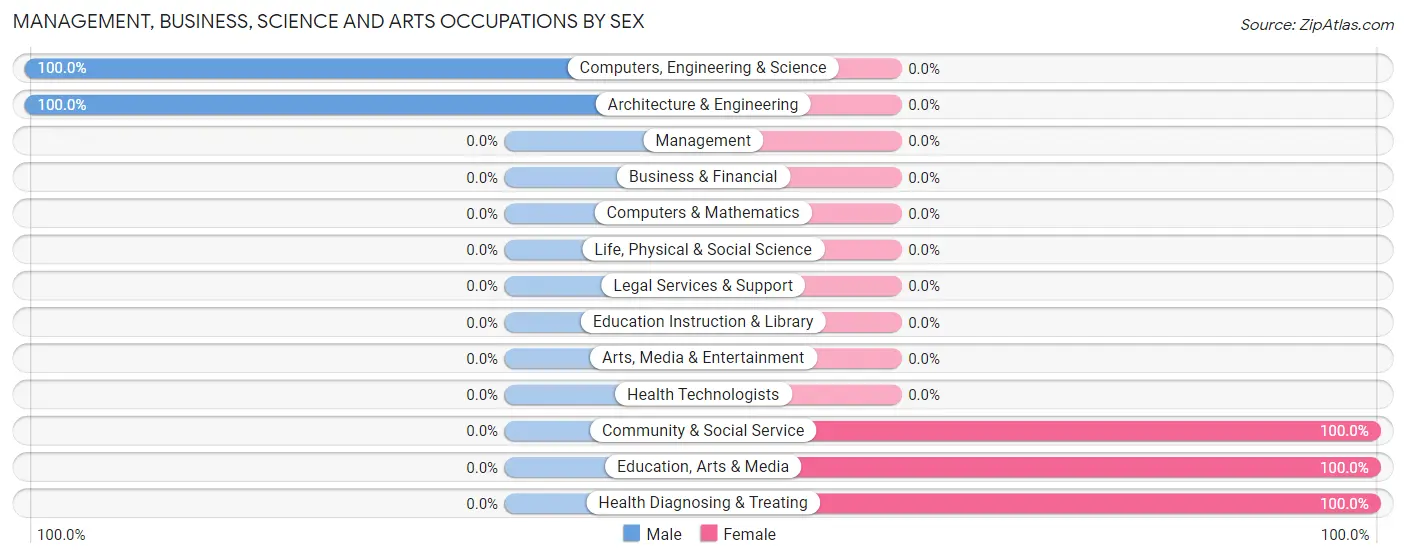
Management, Business, Science and Arts Occupations by Sex
Within the Management, Business, Science and Arts occupations in Monmouth, the most male-oriented occupations are Computers, Engineering & Science (100.0%), and Architecture & Engineering (100.0%), while the most female-oriented occupations are Community & Social Service (100.0%), Education, Arts & Media (100.0%), and Health Diagnosing & Treating (100.0%).
| Occupation | Male | Female |
| Management | 0 (0.0%) | 0 (0.0%) |
| Business & Financial | 0 (0.0%) | 0 (0.0%) |
| Computers, Engineering & Science | 12 (100.0%) | 0 (0.0%) |
| Computers & Mathematics | 0 (0.0%) | 0 (0.0%) |
| Architecture & Engineering | 12 (100.0%) | 0 (0.0%) |
| Life, Physical & Social Science | 0 (0.0%) | 0 (0.0%) |
| Community & Social Service | 0 (0.0%) | 6 (100.0%) |
| Education, Arts & Media | 0 (0.0%) | 6 (100.0%) |
| Legal Services & Support | 0 (0.0%) | 0 (0.0%) |
| Education Instruction & Library | 0 (0.0%) | 0 (0.0%) |
| Arts, Media & Entertainment | 0 (0.0%) | 0 (0.0%) |
| Health Diagnosing & Treating | 0 (0.0%) | 3 (100.0%) |
| Health Technologists | 0 (0.0%) | 0 (0.0%) |
| Total (Category) | 12 (57.1%) | 9 (42.9%) |
| Total (Overall) | 36 (58.1%) | 26 (41.9%) |
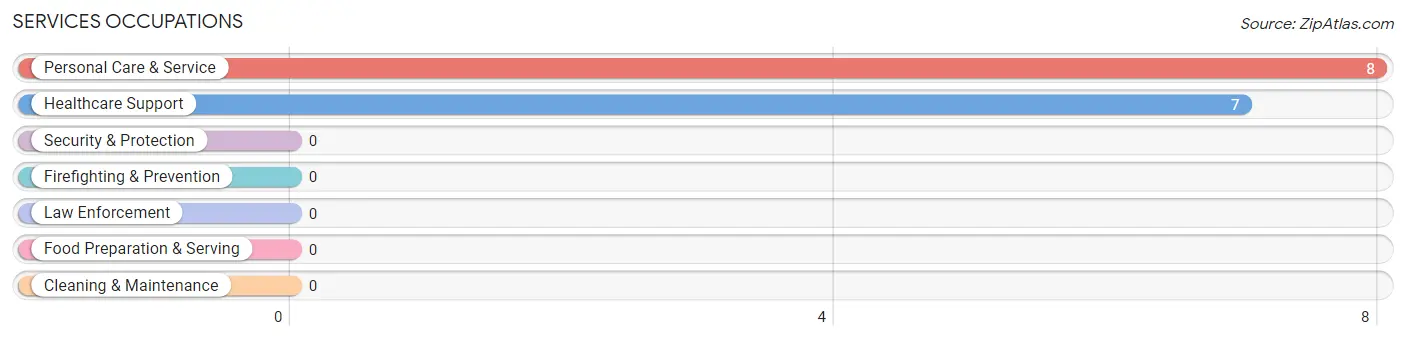
Services Occupations
The most common Services occupations in Monmouth are Personal Care & Service (8 | 12.9%), and Healthcare Support (7 | 11.3%).
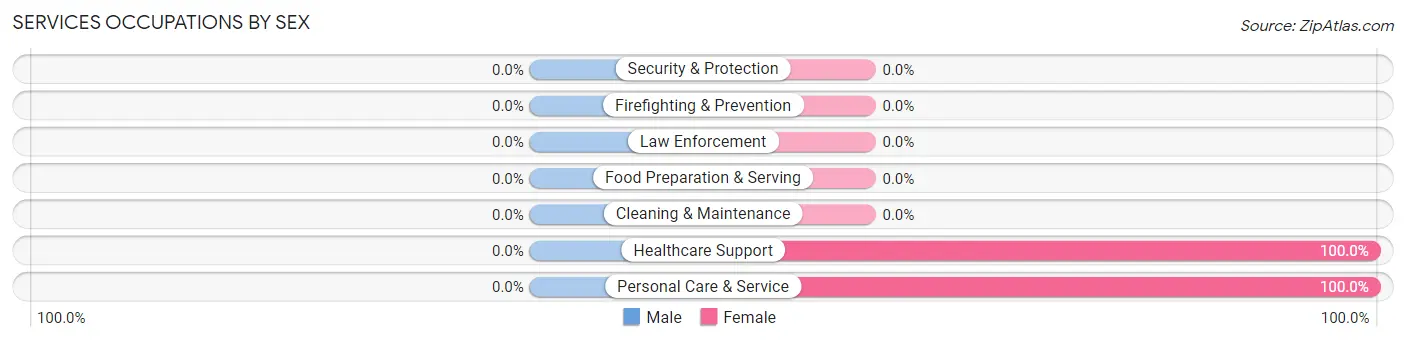
Services Occupations by Sex
| Occupation | Male | Female |
| Healthcare Support | 0 (0.0%) | 7 (100.0%) |
| Security & Protection | 0 (0.0%) | 0 (0.0%) |
| Firefighting & Prevention | 0 (0.0%) | 0 (0.0%) |
| Law Enforcement | 0 (0.0%) | 0 (0.0%) |
| Food Preparation & Serving | 0 (0.0%) | 0 (0.0%) |
| Cleaning & Maintenance | 0 (0.0%) | 0 (0.0%) |
| Personal Care & Service | 0 (0.0%) | 8 (100.0%) |
| Total (Category) | 0 (0.0%) | 15 (100.0%) |
| Total (Overall) | 36 (58.1%) | 26 (41.9%) |
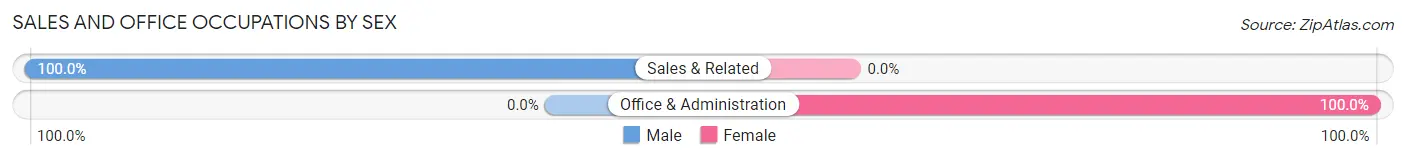
Sales and Office Occupations
The most common Sales and Office occupations in Monmouth are Sales & Related (6 | 9.7%), and Office & Administration (2 | 3.2%).
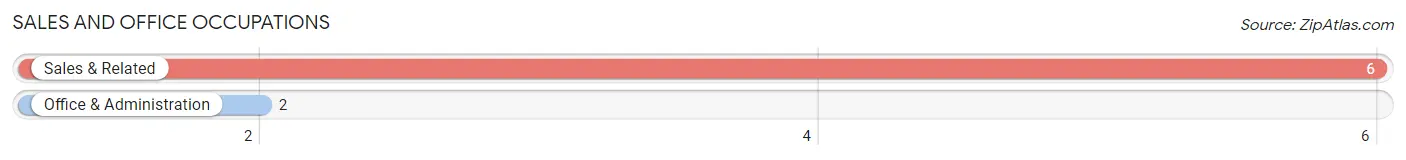
Sales and Office Occupations by Sex
| Occupation | Male | Female |
| Sales & Related | 6 (100.0%) | 0 (0.0%) |
| Office & Administration | 0 (0.0%) | 2 (100.0%) |
| Total (Category) | 6 (75.0%) | 2 (25.0%) |
| Total (Overall) | 36 (58.1%) | 26 (41.9%) |
Natural Resources, Construction and Maintenance Occupations
The most common Natural Resources, Construction and Maintenance occupations in Monmouth are Farming, Fishing & Forestry (15 | 24.2%), and Installation, Maintenance & Repair (3 | 4.8%).
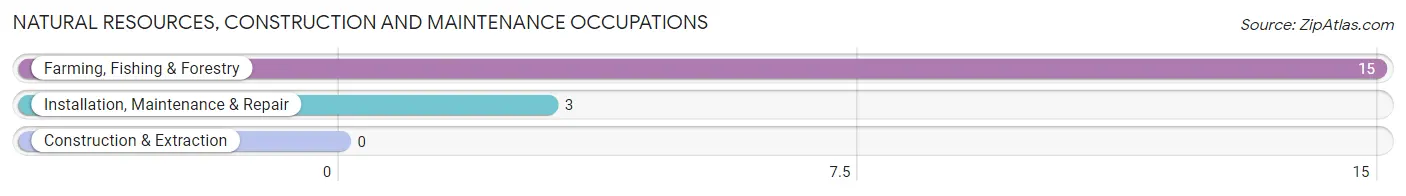
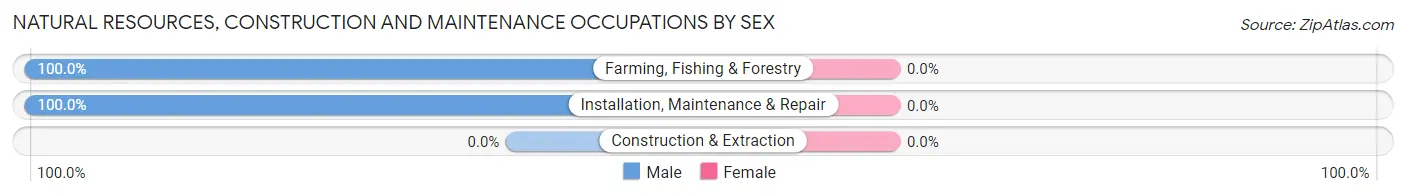
Natural Resources, Construction and Maintenance Occupations by Sex
| Occupation | Male | Female |
| Farming, Fishing & Forestry | 15 (100.0%) | 0 (0.0%) |
| Construction & Extraction | 0 (0.0%) | 0 (0.0%) |
| Installation, Maintenance & Repair | 3 (100.0%) | 0 (0.0%) |
| Total (Category) | 18 (100.0%) | 0 (0.0%) |
| Total (Overall) | 36 (58.1%) | 26 (41.9%) |
Production, Transportation and Moving Occupations
Production, Transportation and Moving Occupations by Sex
| Occupation | Male | Female |
| Production | 0 (0.0%) | 0 (0.0%) |
| Transportation | 0 (0.0%) | 0 (0.0%) |
| Material Moving | 0 (0.0%) | 0 (0.0%) |
| Total (Category) | 0 (0.0%) | 0 (0.0%) |
| Total (Overall) | 36 (58.1%) | 26 (41.9%) |
Employment Industries by Sex in Monmouth
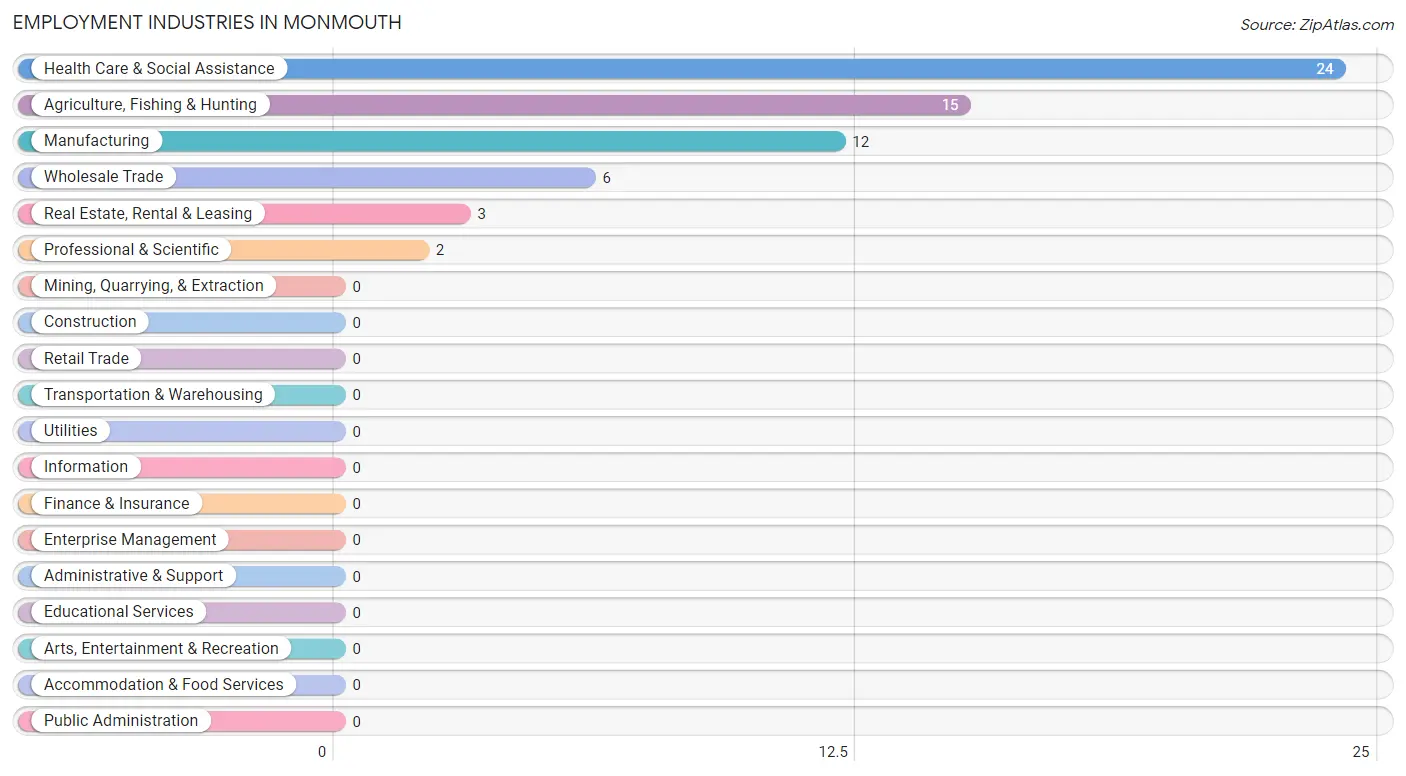
Employment Industries in Monmouth
The major employment industries in Monmouth include Health Care & Social Assistance (24 | 38.7%), Agriculture, Fishing & Hunting (15 | 24.2%), Manufacturing (12 | 19.4%), Wholesale Trade (6 | 9.7%), and Real Estate, Rental & Leasing (3 | 4.8%).
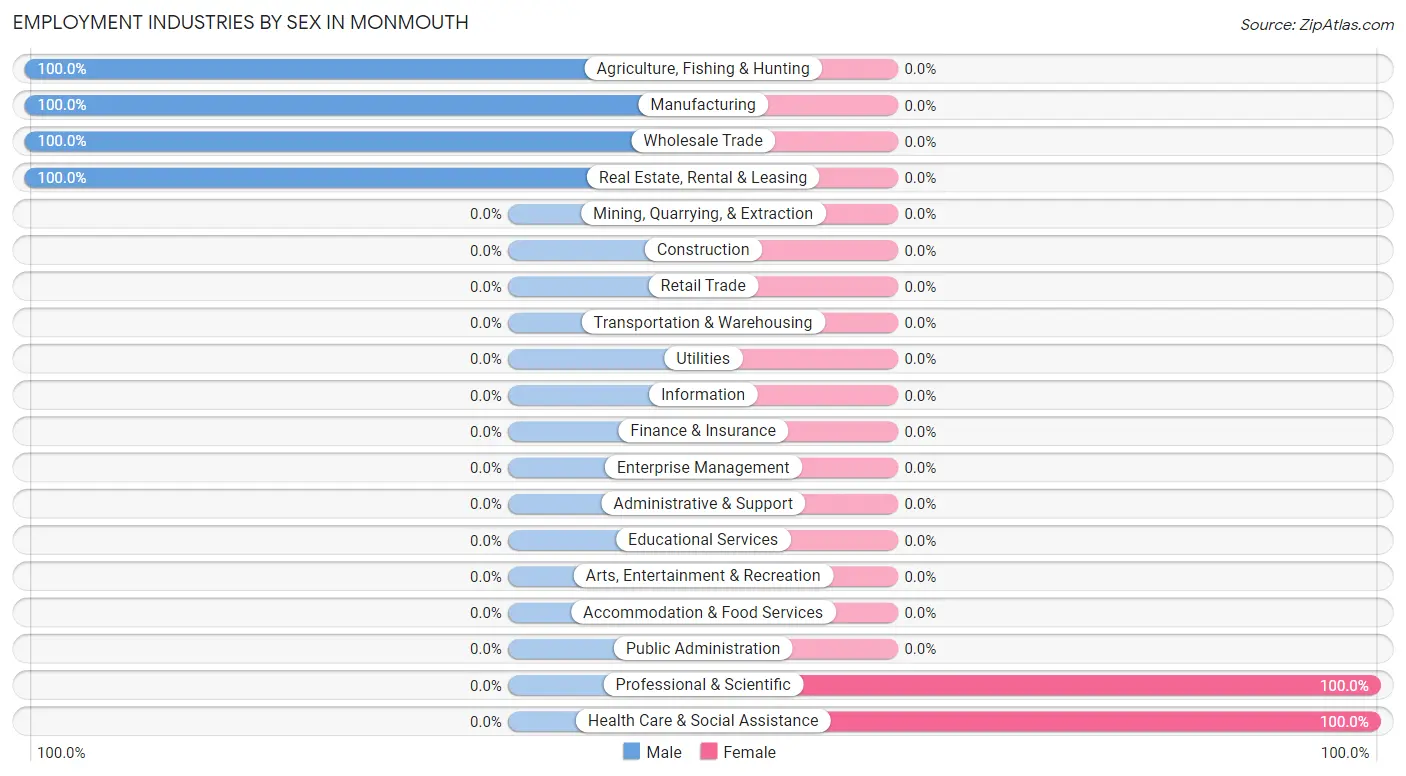
Employment Industries by Sex in Monmouth
The Monmouth industries that see more men than women are Agriculture, Fishing & Hunting (100.0%), Manufacturing (100.0%), and Wholesale Trade (100.0%), whereas the industries that tend to have a higher number of women are Professional & Scientific (100.0%), and Health Care & Social Assistance (100.0%).
| Industry | Male | Female |
| Agriculture, Fishing & Hunting | 15 (100.0%) | 0 (0.0%) |
| Mining, Quarrying, & Extraction | 0 (0.0%) | 0 (0.0%) |
| Construction | 0 (0.0%) | 0 (0.0%) |
| Manufacturing | 12 (100.0%) | 0 (0.0%) |
| Wholesale Trade | 6 (100.0%) | 0 (0.0%) |
| Retail Trade | 0 (0.0%) | 0 (0.0%) |
| Transportation & Warehousing | 0 (0.0%) | 0 (0.0%) |
| Utilities | 0 (0.0%) | 0 (0.0%) |
| Information | 0 (0.0%) | 0 (0.0%) |
| Finance & Insurance | 0 (0.0%) | 0 (0.0%) |
| Real Estate, Rental & Leasing | 3 (100.0%) | 0 (0.0%) |
| Professional & Scientific | 0 (0.0%) | 2 (100.0%) |
| Enterprise Management | 0 (0.0%) | 0 (0.0%) |
| Administrative & Support | 0 (0.0%) | 0 (0.0%) |
| Educational Services | 0 (0.0%) | 0 (0.0%) |
| Health Care & Social Assistance | 0 (0.0%) | 24 (100.0%) |
| Arts, Entertainment & Recreation | 0 (0.0%) | 0 (0.0%) |
| Accommodation & Food Services | 0 (0.0%) | 0 (0.0%) |
| Public Administration | 0 (0.0%) | 0 (0.0%) |
| Total | 36 (58.1%) | 26 (41.9%) |
Education in Monmouth
School Enrollment in Monmouth
The most common levels of schooling among the 62 students in Monmouth are middle school (19 | 30.6%), nursery / preschool (14 | 22.6%), and elementary school (14 | 22.6%).
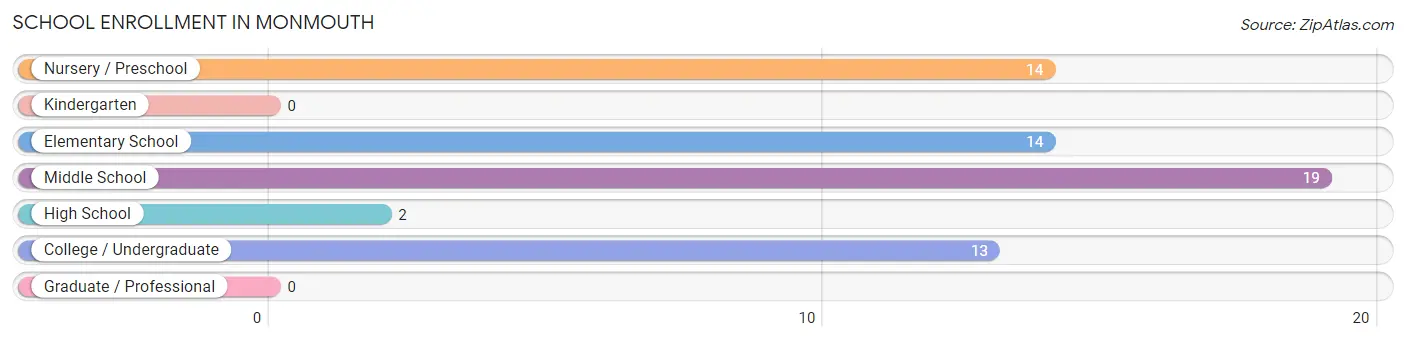
| School Level | # Students | % Students |
| Nursery / Preschool | 14 | 22.6% |
| Kindergarten | 0 | 0.0% |
| Elementary School | 14 | 22.6% |
| Middle School | 19 | 30.6% |
| High School | 2 | 3.2% |
| College / Undergraduate | 13 | 21.0% |
| Graduate / Professional | 0 | 0.0% |
| Total | 62 | 100.0% |
School Enrollment by Age by Funding Source in Monmouth
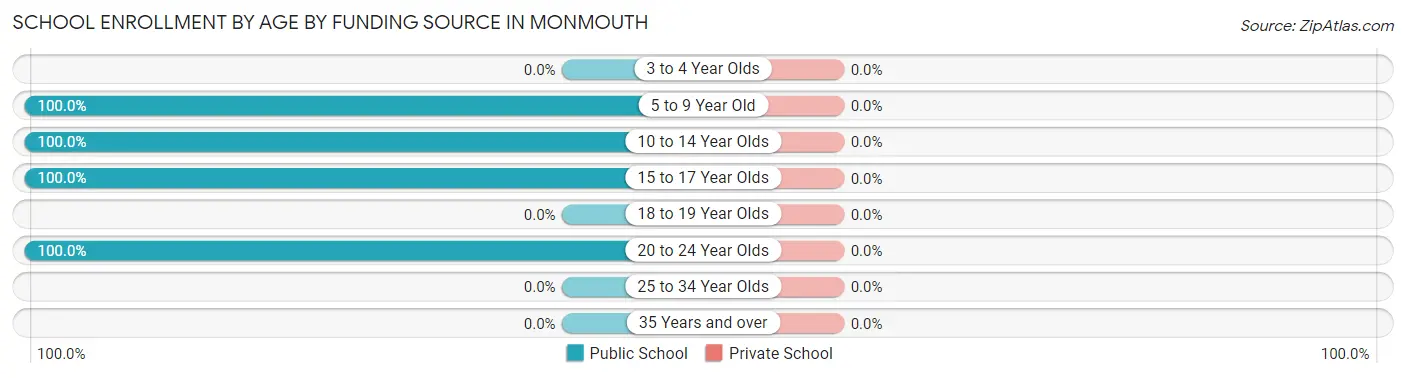
| Age Bracket | Public School | Private School |
| 3 to 4 Year Olds | 0 (0.0%) | 0 (0.0%) |
| 5 to 9 Year Old | 28 (100.0%) | 0 (0.0%) |
| 10 to 14 Year Olds | 19 (100.0%) | 0 (0.0%) |
| 15 to 17 Year Olds | 2 (100.0%) | 0 (0.0%) |
| 18 to 19 Year Olds | 0 (0.0%) | 0 (0.0%) |
| 20 to 24 Year Olds | 13 (100.0%) | 0 (0.0%) |
| 25 to 34 Year Olds | 0 (0.0%) | 0 (0.0%) |
| 35 Years and over | 0 (0.0%) | 0 (0.0%) |
| Total | 62 (100.0%) | 0 (0.0%) |
Educational Attainment by Field of Study in Monmouth
Social sciences (6 | 66.7%), and arts & humanities (3 | 33.3%) are the most common fields of study among 9 individuals in Monmouth who have obtained a bachelor's degree or higher.
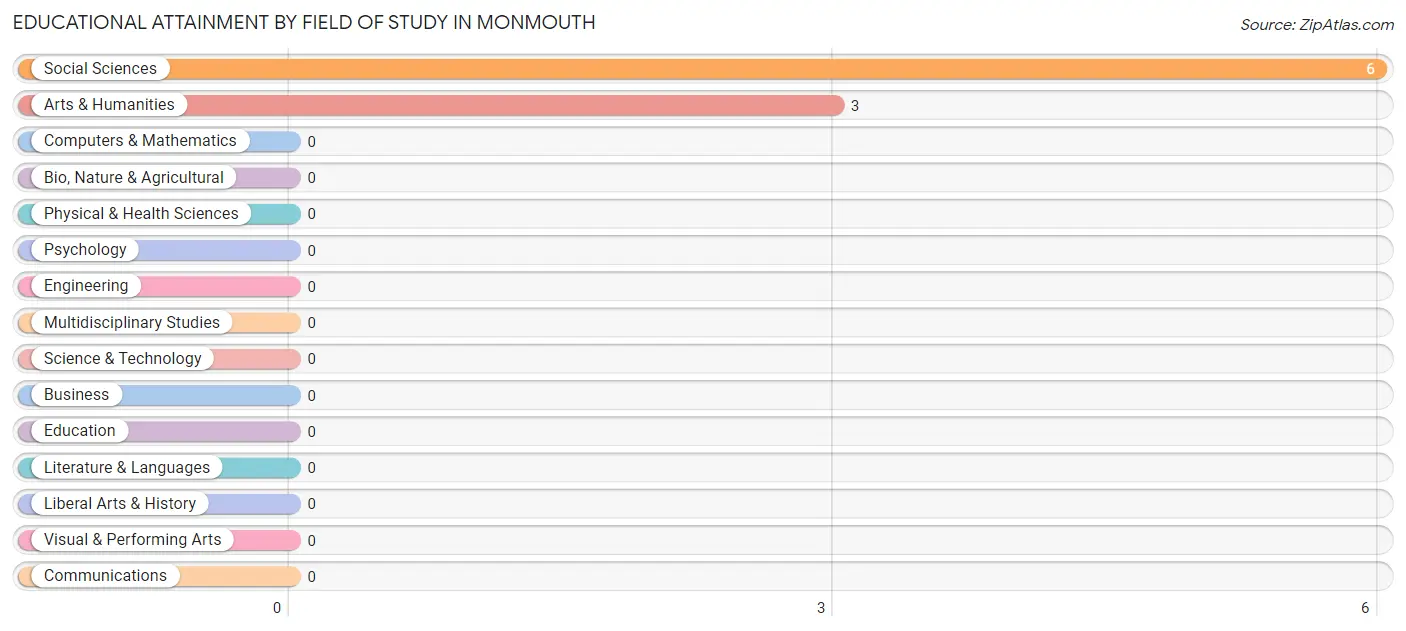
| Field of Study | # Graduates | % Graduates |
| Computers & Mathematics | 0 | 0.0% |
| Bio, Nature & Agricultural | 0 | 0.0% |
| Physical & Health Sciences | 0 | 0.0% |
| Psychology | 0 | 0.0% |
| Social Sciences | 6 | 66.7% |
| Engineering | 0 | 0.0% |
| Multidisciplinary Studies | 0 | 0.0% |
| Science & Technology | 0 | 0.0% |
| Business | 0 | 0.0% |
| Education | 0 | 0.0% |
| Literature & Languages | 0 | 0.0% |
| Liberal Arts & History | 0 | 0.0% |
| Visual & Performing Arts | 0 | 0.0% |
| Communications | 0 | 0.0% |
| Arts & Humanities | 3 | 33.3% |
| Total | 9 | 100.0% |
Transportation & Commute in Monmouth
Vehicle Availability by Sex in Monmouth
The most prevalent vehicle ownership categories in Monmouth are males with 2 vehicles (27, accounting for 75.0%) and females with 2 vehicles (15, making up 103.8%).
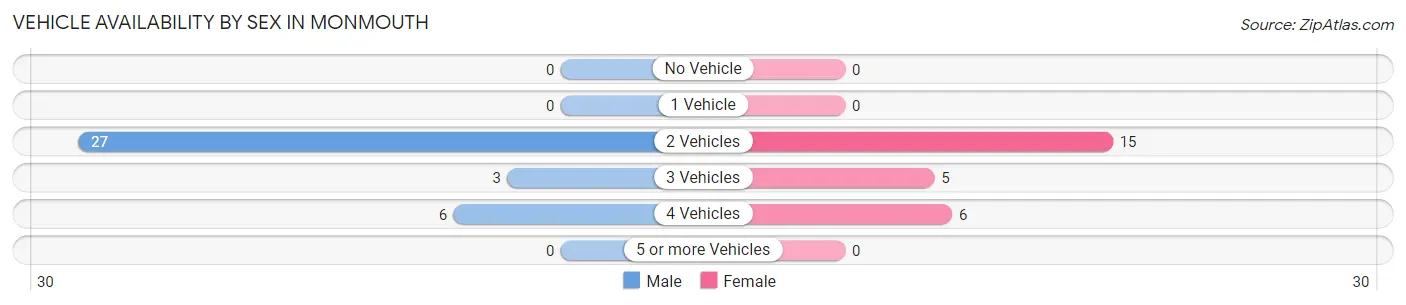
| Vehicles Available | Male | Female |
| No Vehicle | 0 (0.0%) | 0 (0.0%) |
| 1 Vehicle | 0 (0.0%) | 0 (0.0%) |
| 2 Vehicles | 27 (75.0%) | 15 (57.7%) |
| 3 Vehicles | 3 (8.3%) | 5 (19.2%) |
| 4 Vehicles | 6 (16.7%) | 6 (23.1%) |
| 5 or more Vehicles | 0 (0.0%) | 0 (0.0%) |
| Total | 36 (100.0%) | 26 (100.0%) |
Commute Time in Monmouth
The most frequently occuring commute durations in Monmouth are 30 to 34 minutes (32 commuters, 51.6%), 25 to 29 minutes (12 commuters, 19.4%), and 40 to 44 minutes (10 commuters, 16.1%).
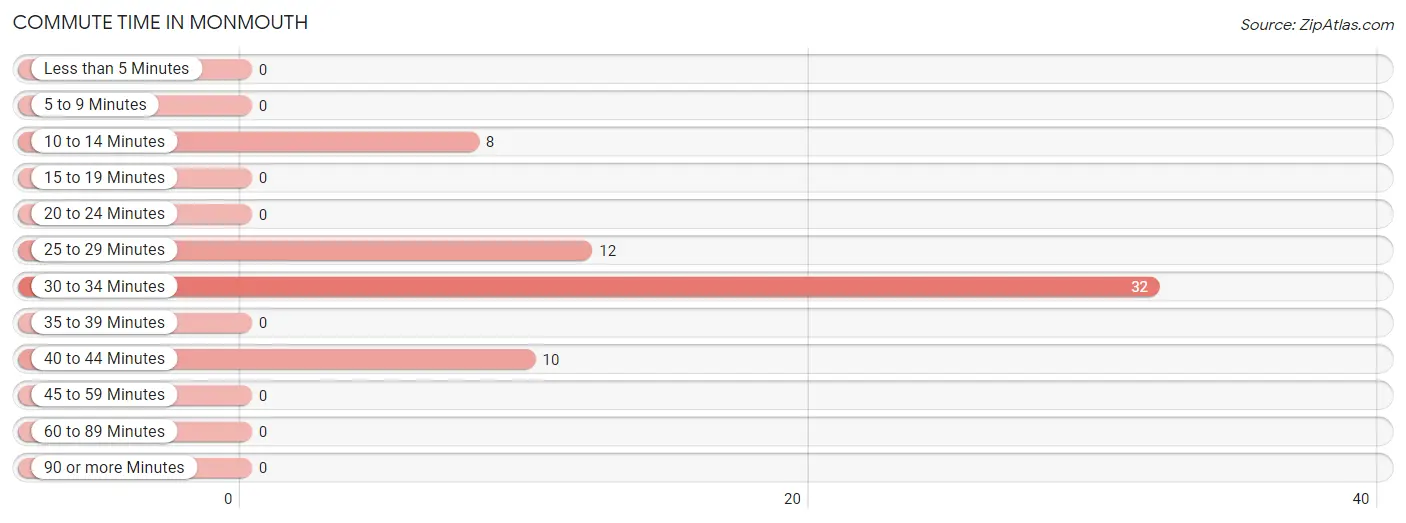
| Commute Time | # Commuters | % Commuters |
| Less than 5 Minutes | 0 | 0.0% |
| 5 to 9 Minutes | 0 | 0.0% |
| 10 to 14 Minutes | 8 | 12.9% |
| 15 to 19 Minutes | 0 | 0.0% |
| 20 to 24 Minutes | 0 | 0.0% |
| 25 to 29 Minutes | 12 | 19.4% |
| 30 to 34 Minutes | 32 | 51.6% |
| 35 to 39 Minutes | 0 | 0.0% |
| 40 to 44 Minutes | 10 | 16.1% |
| 45 to 59 Minutes | 0 | 0.0% |
| 60 to 89 Minutes | 0 | 0.0% |
| 90 or more Minutes | 0 | 0.0% |
Commute Time by Sex in Monmouth
The most common commute times in Monmouth are 30 to 34 minutes (18 commuters, 50.0%) for males and 30 to 34 minutes (14 commuters, 53.8%) for females.
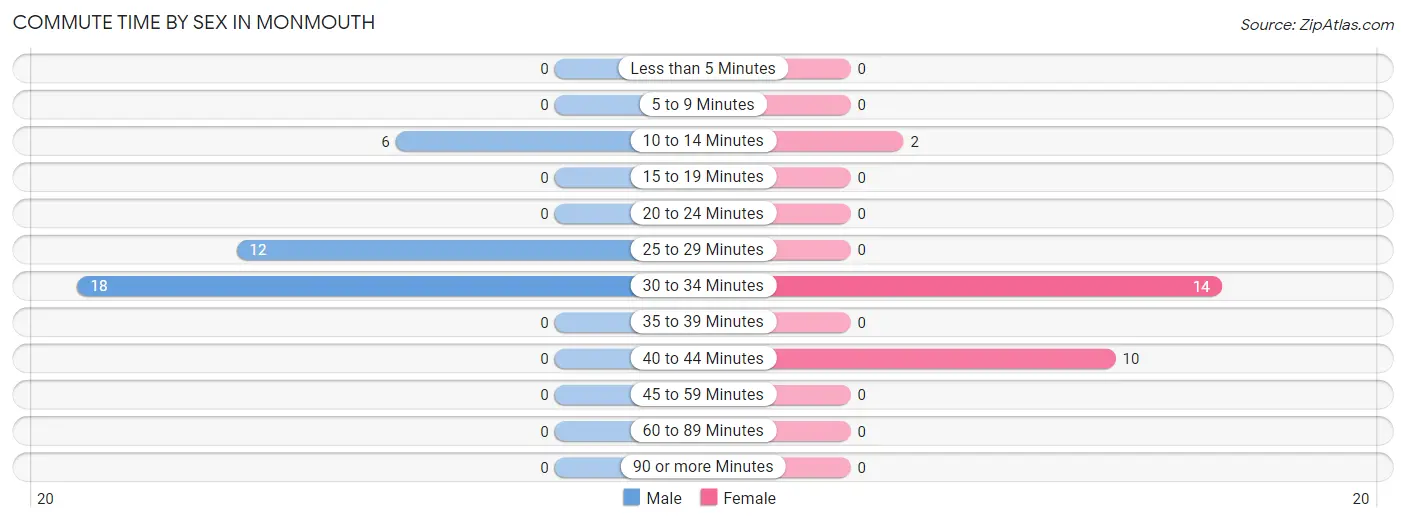
| Commute Time | Male | Female |
| Less than 5 Minutes | 0 (0.0%) | 0 (0.0%) |
| 5 to 9 Minutes | 0 (0.0%) | 0 (0.0%) |
| 10 to 14 Minutes | 6 (16.7%) | 2 (7.7%) |
| 15 to 19 Minutes | 0 (0.0%) | 0 (0.0%) |
| 20 to 24 Minutes | 0 (0.0%) | 0 (0.0%) |
| 25 to 29 Minutes | 12 (33.3%) | 0 (0.0%) |
| 30 to 34 Minutes | 18 (50.0%) | 14 (53.8%) |
| 35 to 39 Minutes | 0 (0.0%) | 0 (0.0%) |
| 40 to 44 Minutes | 0 (0.0%) | 10 (38.5%) |
| 45 to 59 Minutes | 0 (0.0%) | 0 (0.0%) |
| 60 to 89 Minutes | 0 (0.0%) | 0 (0.0%) |
| 90 or more Minutes | 0 (0.0%) | 0 (0.0%) |
Time of Departure to Work by Sex in Monmouth
The most frequent times of departure to work in Monmouth are 5:30 AM to 5:59 AM (15, 41.7%) for males and 7:30 AM to 7:59 AM (8, 30.8%) for females.
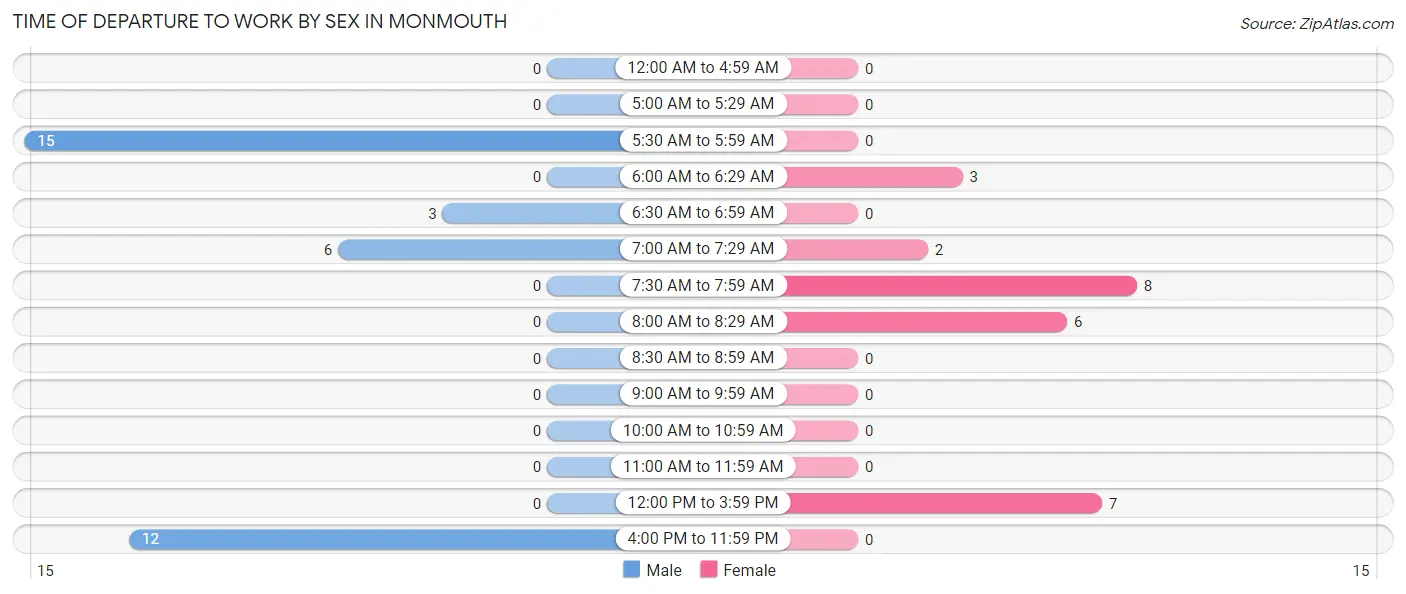
| Time of Departure | Male | Female |
| 12:00 AM to 4:59 AM | 0 (0.0%) | 0 (0.0%) |
| 5:00 AM to 5:29 AM | 0 (0.0%) | 0 (0.0%) |
| 5:30 AM to 5:59 AM | 15 (41.7%) | 0 (0.0%) |
| 6:00 AM to 6:29 AM | 0 (0.0%) | 3 (11.5%) |
| 6:30 AM to 6:59 AM | 3 (8.3%) | 0 (0.0%) |
| 7:00 AM to 7:29 AM | 6 (16.7%) | 2 (7.7%) |
| 7:30 AM to 7:59 AM | 0 (0.0%) | 8 (30.8%) |
| 8:00 AM to 8:29 AM | 0 (0.0%) | 6 (23.1%) |
| 8:30 AM to 8:59 AM | 0 (0.0%) | 0 (0.0%) |
| 9:00 AM to 9:59 AM | 0 (0.0%) | 0 (0.0%) |
| 10:00 AM to 10:59 AM | 0 (0.0%) | 0 (0.0%) |
| 11:00 AM to 11:59 AM | 0 (0.0%) | 0 (0.0%) |
| 12:00 PM to 3:59 PM | 0 (0.0%) | 7 (26.9%) |
| 4:00 PM to 11:59 PM | 12 (33.3%) | 0 (0.0%) |
| Total | 36 (100.0%) | 26 (100.0%) |
Housing Occupancy in Monmouth
Occupancy by Ownership in Monmouth
Of the total 48 dwellings in Monmouth, owner-occupied units account for 30 (62.5%), while renter-occupied units make up 18 (37.5%).
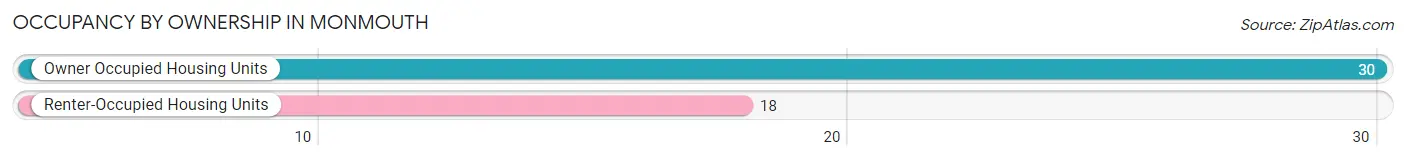
| Occupancy | # Housing Units | % Housing Units |
| Owner Occupied Housing Units | 30 | 62.5% |
| Renter-Occupied Housing Units | 18 | 37.5% |
| Total Occupied Housing Units | 48 | 100.0% |
Occupancy by Household Size in Monmouth
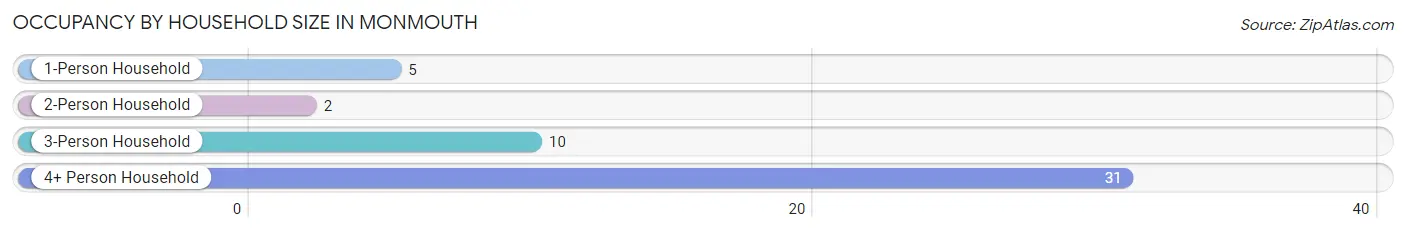
| Household Size | # Housing Units | % Housing Units |
| 1-Person Household | 5 | 10.4% |
| 2-Person Household | 2 | 4.2% |
| 3-Person Household | 10 | 20.8% |
| 4+ Person Household | 31 | 64.6% |
| Total Housing Units | 48 | 100.0% |
Occupancy by Ownership by Household Size in Monmouth
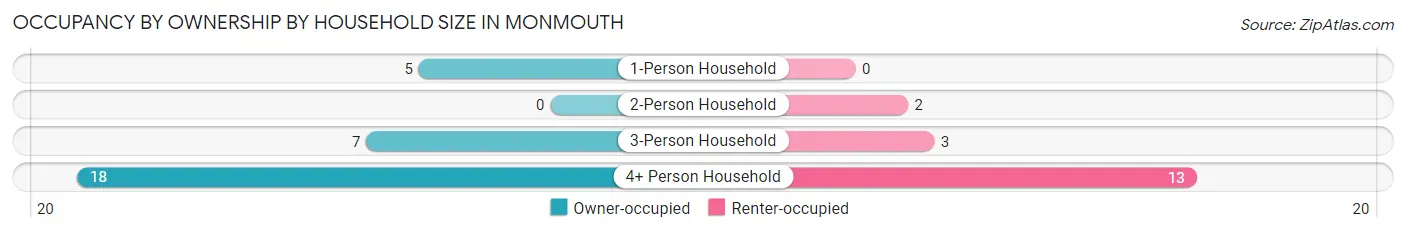
| Household Size | Owner-occupied | Renter-occupied |
| 1-Person Household | 5 (100.0%) | 0 (0.0%) |
| 2-Person Household | 0 (0.0%) | 2 (100.0%) |
| 3-Person Household | 7 (70.0%) | 3 (30.0%) |
| 4+ Person Household | 18 (58.1%) | 13 (41.9%) |
| Total Housing Units | 30 (62.5%) | 18 (37.5%) |
Occupancy by Educational Attainment in Monmouth
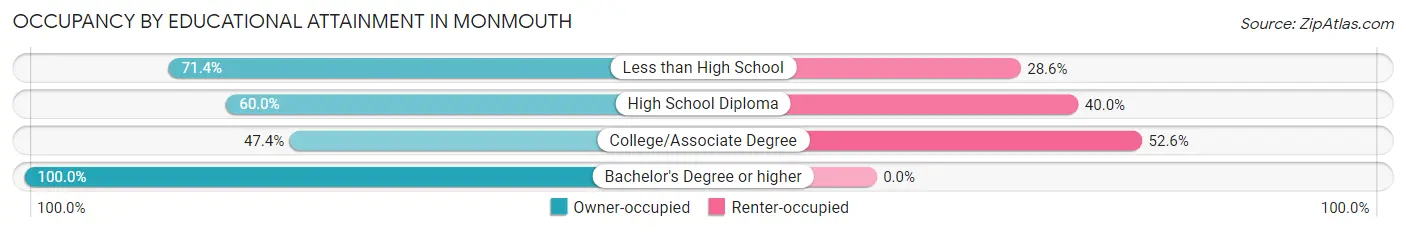
| Household Size | Owner-occupied | Renter-occupied |
| Less than High School | 15 (71.4%) | 6 (28.6%) |
| High School Diploma | 3 (60.0%) | 2 (40.0%) |
| College/Associate Degree | 9 (47.4%) | 10 (52.6%) |
| Bachelor's Degree or higher | 3 (100.0%) | 0 (0.0%) |
Occupancy by Age of Householder in Monmouth
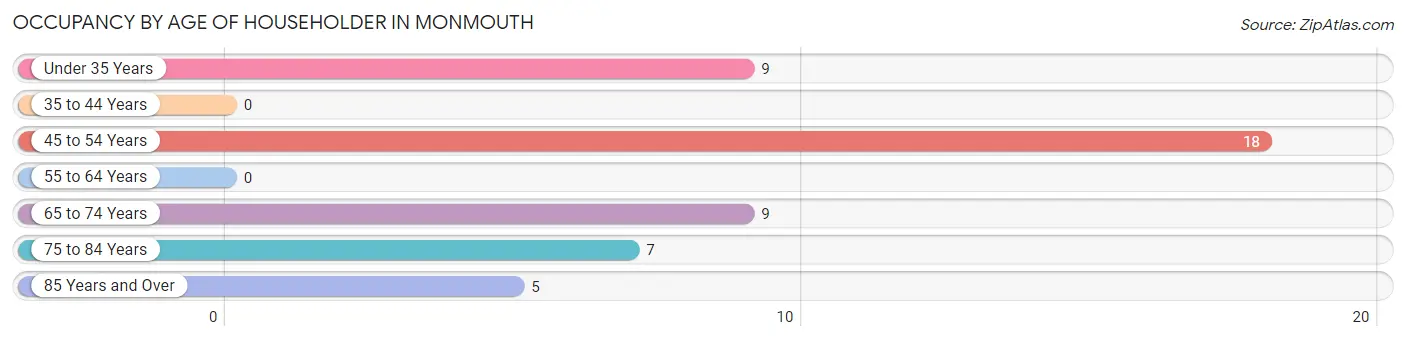
| Age Bracket | # Households | % Households |
| Under 35 Years | 9 | 18.8% |
| 35 to 44 Years | 0 | 0.0% |
| 45 to 54 Years | 18 | 37.5% |
| 55 to 64 Years | 0 | 0.0% |
| 65 to 74 Years | 9 | 18.8% |
| 75 to 84 Years | 7 | 14.6% |
| 85 Years and Over | 5 | 10.4% |
| Total | 48 | 100.0% |
Housing Finances in Monmouth
Median Income by Occupancy in Monmouth
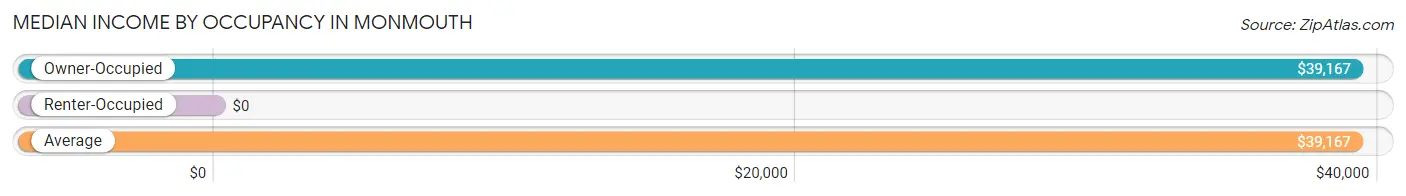
| Occupancy Type | # Households | Median Income |
| Owner-Occupied | 30 (62.5%) | $39,167 |
| Renter-Occupied | 18 (37.5%) | $0 |
| Average | 48 (100.0%) | $39,167 |
Occupancy by Householder Income Bracket in Monmouth
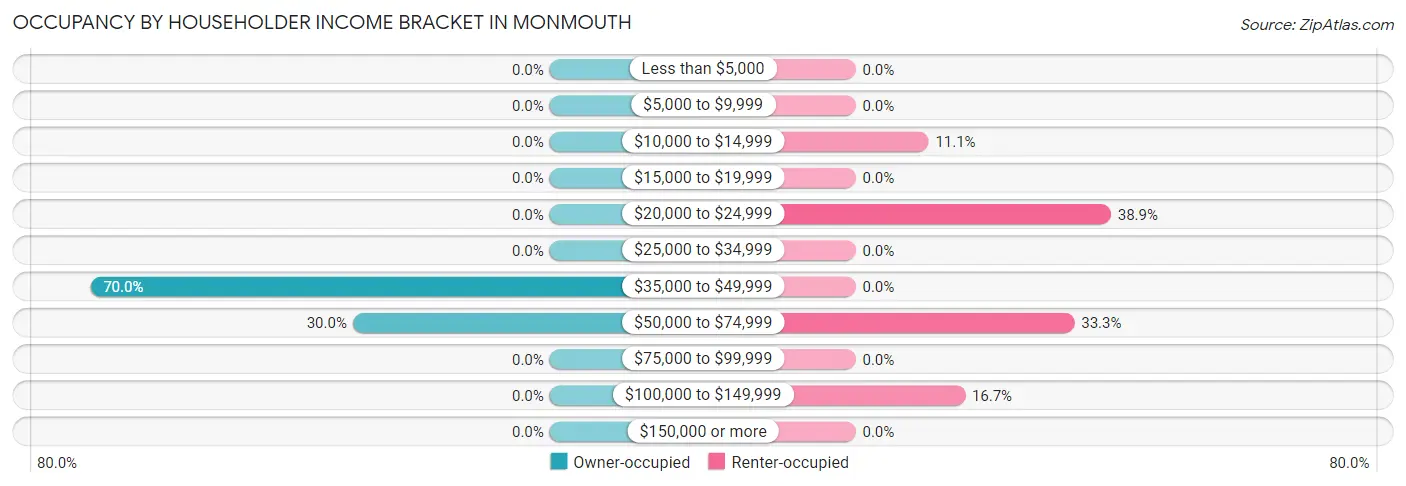
| Income Bracket | Owner-occupied | Renter-occupied |
| Less than $5,000 | 0 (0.0%) | 0 (0.0%) |
| $5,000 to $9,999 | 0 (0.0%) | 0 (0.0%) |
| $10,000 to $14,999 | 0 (0.0%) | 2 (11.1%) |
| $15,000 to $19,999 | 0 (0.0%) | 0 (0.0%) |
| $20,000 to $24,999 | 0 (0.0%) | 7 (38.9%) |
| $25,000 to $34,999 | 0 (0.0%) | 0 (0.0%) |
| $35,000 to $49,999 | 21 (70.0%) | 0 (0.0%) |
| $50,000 to $74,999 | 9 (30.0%) | 6 (33.3%) |
| $75,000 to $99,999 | 0 (0.0%) | 0 (0.0%) |
| $100,000 to $149,999 | 0 (0.0%) | 3 (16.7%) |
| $150,000 or more | 0 (0.0%) | 0 (0.0%) |
| Total | 30 (100.0%) | 18 (100.0%) |
Monthly Housing Cost Tiers in Monmouth
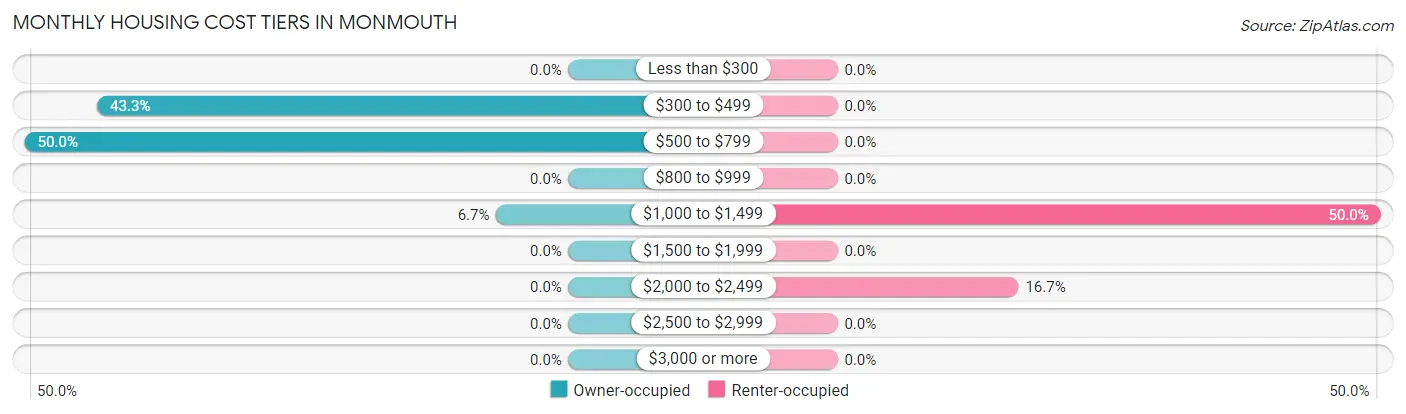
| Monthly Cost | Owner-occupied | Renter-occupied |
| Less than $300 | 0 (0.0%) | 0 (0.0%) |
| $300 to $499 | 13 (43.3%) | 0 (0.0%) |
| $500 to $799 | 15 (50.0%) | 0 (0.0%) |
| $800 to $999 | 0 (0.0%) | 0 (0.0%) |
| $1,000 to $1,499 | 2 (6.7%) | 9 (50.0%) |
| $1,500 to $1,999 | 0 (0.0%) | 0 (0.0%) |
| $2,000 to $2,499 | 0 (0.0%) | 3 (16.7%) |
| $2,500 to $2,999 | 0 (0.0%) | 0 (0.0%) |
| $3,000 or more | 0 (0.0%) | 0 (0.0%) |
| Total | 30 (100.0%) | 18 (100.0%) |
Physical Housing Characteristics in Monmouth
Housing Structures in Monmouth
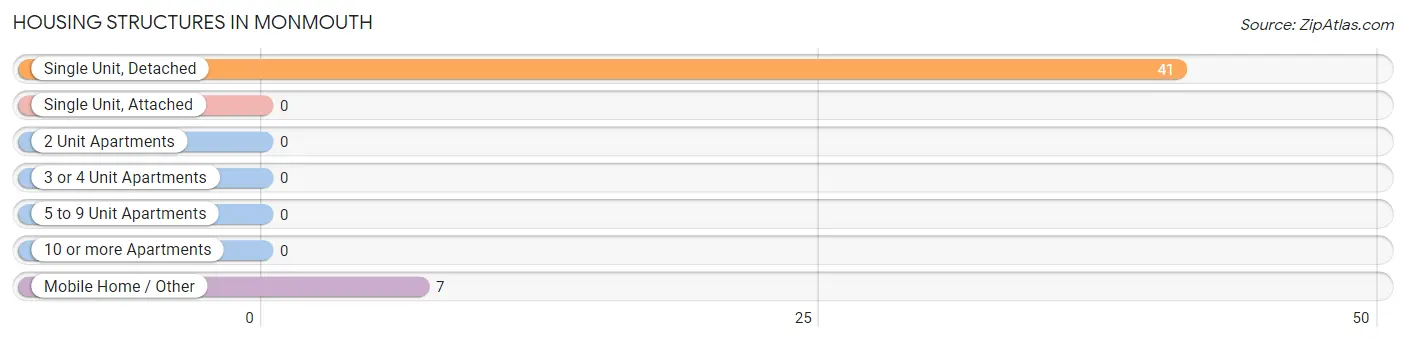
| Structure Type | # Housing Units | % Housing Units |
| Single Unit, Detached | 41 | 85.4% |
| Single Unit, Attached | 0 | 0.0% |
| 2 Unit Apartments | 0 | 0.0% |
| 3 or 4 Unit Apartments | 0 | 0.0% |
| 5 to 9 Unit Apartments | 0 | 0.0% |
| 10 or more Apartments | 0 | 0.0% |
| Mobile Home / Other | 7 | 14.6% |
| Total | 48 | 100.0% |
Housing Structures by Occupancy in Monmouth
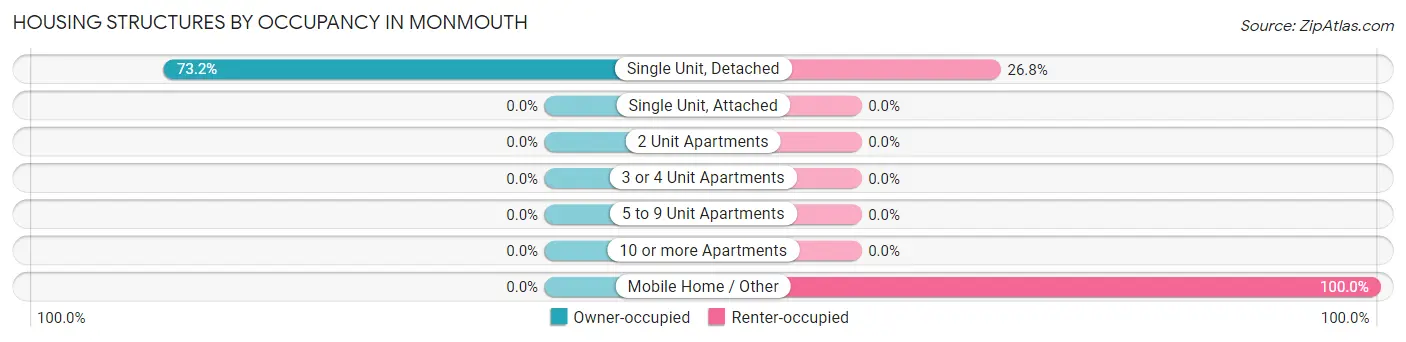
| Structure Type | Owner-occupied | Renter-occupied |
| Single Unit, Detached | 30 (73.2%) | 11 (26.8%) |
| Single Unit, Attached | 0 (0.0%) | 0 (0.0%) |
| 2 Unit Apartments | 0 (0.0%) | 0 (0.0%) |
| 3 or 4 Unit Apartments | 0 (0.0%) | 0 (0.0%) |
| 5 to 9 Unit Apartments | 0 (0.0%) | 0 (0.0%) |
| 10 or more Apartments | 0 (0.0%) | 0 (0.0%) |
| Mobile Home / Other | 0 (0.0%) | 7 (100.0%) |
| Total | 30 (62.5%) | 18 (37.5%) |
Housing Structures by Number of Rooms in Monmouth
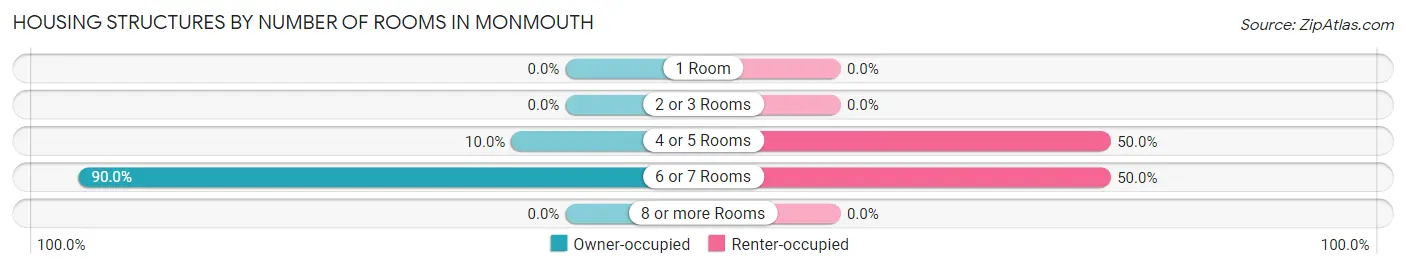
| Number of Rooms | Owner-occupied | Renter-occupied |
| 1 Room | 0 (0.0%) | 0 (0.0%) |
| 2 or 3 Rooms | 0 (0.0%) | 0 (0.0%) |
| 4 or 5 Rooms | 3 (10.0%) | 9 (50.0%) |
| 6 or 7 Rooms | 27 (90.0%) | 9 (50.0%) |
| 8 or more Rooms | 0 (0.0%) | 0 (0.0%) |
| Total | 30 (100.0%) | 18 (100.0%) |
Housing Structure by Heating Type in Monmouth
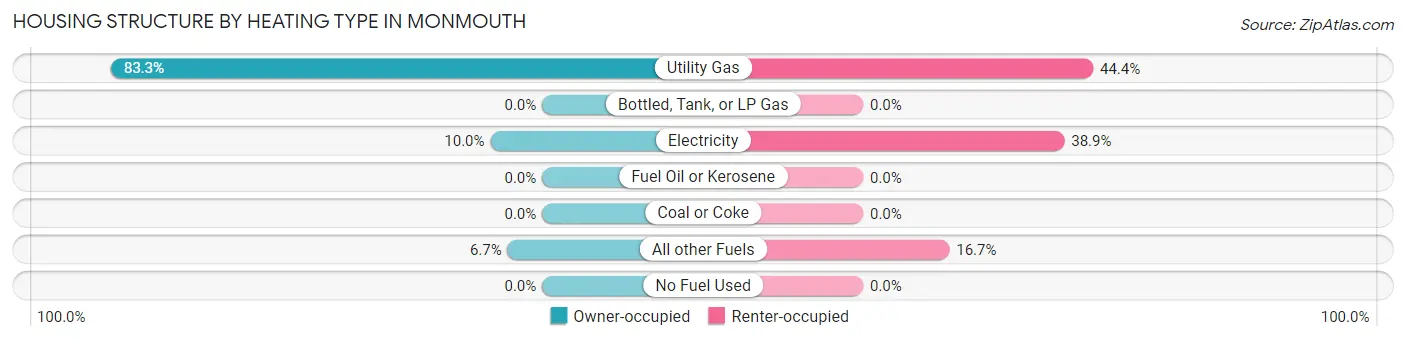
| Heating Type | Owner-occupied | Renter-occupied |
| Utility Gas | 25 (83.3%) | 8 (44.4%) |
| Bottled, Tank, or LP Gas | 0 (0.0%) | 0 (0.0%) |
| Electricity | 3 (10.0%) | 7 (38.9%) |
| Fuel Oil or Kerosene | 0 (0.0%) | 0 (0.0%) |
| Coal or Coke | 0 (0.0%) | 0 (0.0%) |
| All other Fuels | 2 (6.7%) | 3 (16.7%) |
| No Fuel Used | 0 (0.0%) | 0 (0.0%) |
| Total | 30 (100.0%) | 18 (100.0%) |
Household Vehicle Usage in Monmouth

| Vehicles per Household | Owner-occupied | Renter-occupied |
| No Vehicle | 3 (10.0%) | 0 (0.0%) |
| 1 Vehicle | 0 (0.0%) | 0 (0.0%) |
| 2 Vehicles | 27 (90.0%) | 7 (38.9%) |
| 3 or more Vehicles | 0 (0.0%) | 11 (61.1%) |
| Total | 30 (100.0%) | 18 (100.0%) |
Real Estate & Mortgages in Monmouth
Real Estate and Mortgage Overview in Monmouth
| Characteristic | Without Mortgage | With Mortgage |
| Housing Units | 15 | 15 |
| Median Property Value | $232,100 | $0 |
| Median Household Income | $53,036 | $0 |
| Monthly Housing Costs | $445 | $0 |
| Real Estate Taxes | $1,225 | $0 |
Property Value by Mortgage Status in Monmouth
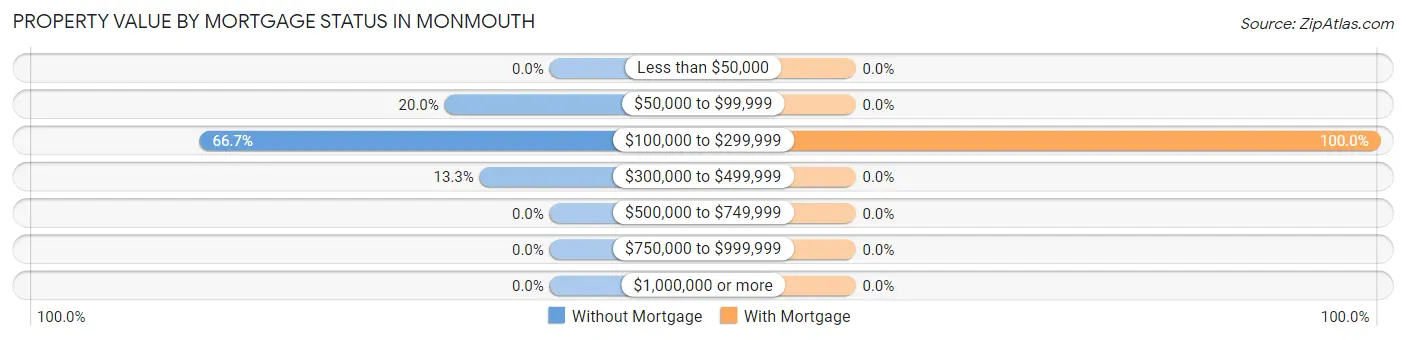
| Property Value | Without Mortgage | With Mortgage |
| Less than $50,000 | 0 (0.0%) | 0 (0.0%) |
| $50,000 to $99,999 | 3 (20.0%) | 0 (0.0%) |
| $100,000 to $299,999 | 10 (66.7%) | 15 (100.0%) |
| $300,000 to $499,999 | 2 (13.3%) | 0 (0.0%) |
| $500,000 to $749,999 | 0 (0.0%) | 0 (0.0%) |
| $750,000 to $999,999 | 0 (0.0%) | 0 (0.0%) |
| $1,000,000 or more | 0 (0.0%) | 0 (0.0%) |
| Total | 15 (100.0%) | 15 (100.0%) |
Household Income by Mortgage Status in Monmouth
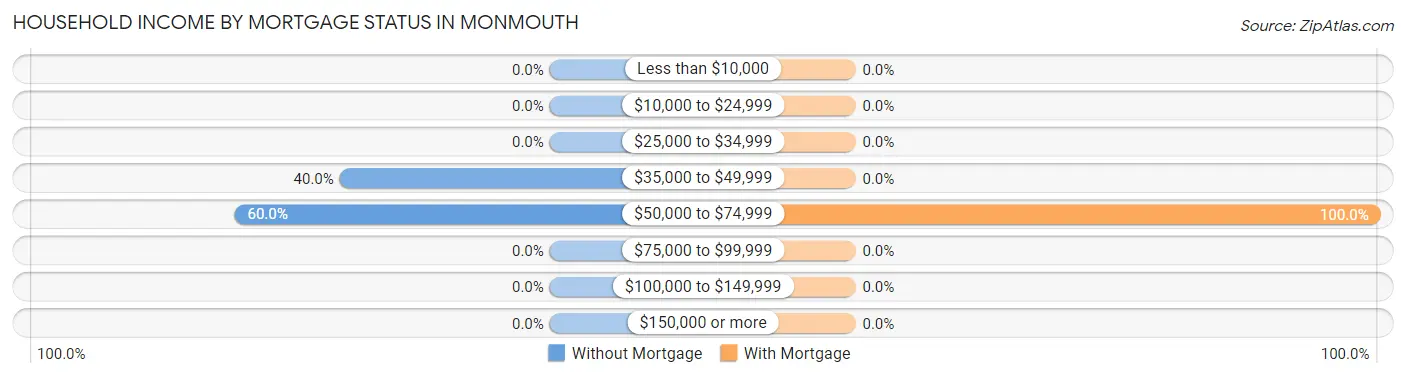
| Household Income | Without Mortgage | With Mortgage |
| Less than $10,000 | 0 (0.0%) | 0 (0.0%) |
| $10,000 to $24,999 | 0 (0.0%) | 0 (0.0%) |
| $25,000 to $34,999 | 0 (0.0%) | 0 (0.0%) |
| $35,000 to $49,999 | 6 (40.0%) | 0 (0.0%) |
| $50,000 to $74,999 | 9 (60.0%) | 15 (100.0%) |
| $75,000 to $99,999 | 0 (0.0%) | 0 (0.0%) |
| $100,000 to $149,999 | 0 (0.0%) | 0 (0.0%) |
| $150,000 or more | 0 (0.0%) | 0 (0.0%) |
| Total | 15 (100.0%) | 15 (100.0%) |
Property Value to Household Income Ratio in Monmouth
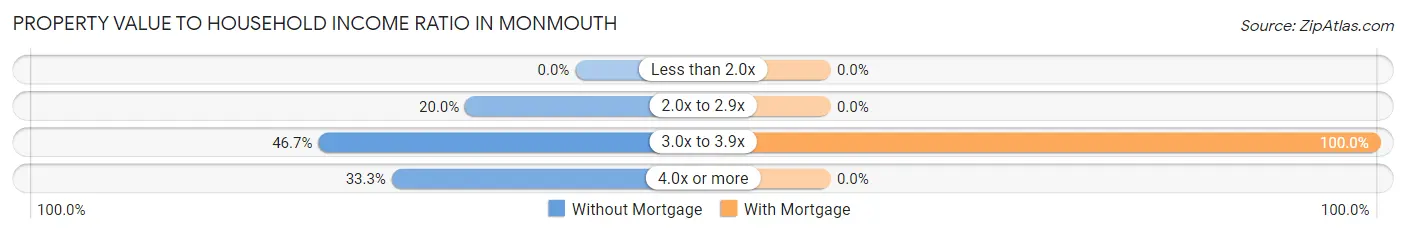
| Value-to-Income Ratio | Without Mortgage | With Mortgage |
| Less than 2.0x | 0 (0.0%) | 0 (0.0%) |
| 2.0x to 2.9x | 3 (20.0%) | 0 (0.0%) |
| 3.0x to 3.9x | 7 (46.7%) | 15 (100.0%) |
| 4.0x or more | 5 (33.3%) | 0 (0.0%) |
| Total | 15 (100.0%) | 15 (100.0%) |
Real Estate Taxes by Mortgage Status in Monmouth
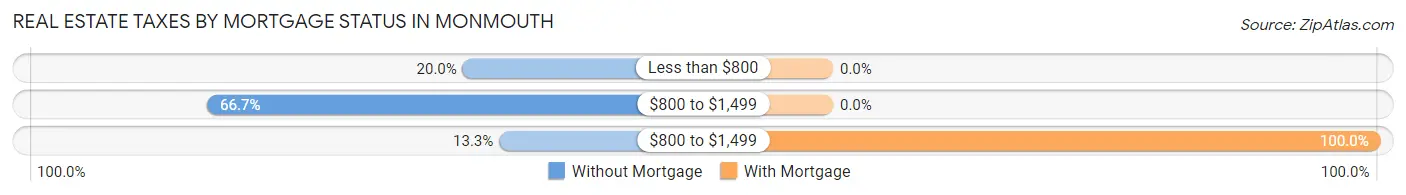
| Property Taxes | Without Mortgage | With Mortgage |
| Less than $800 | 3 (20.0%) | 0 (0.0%) |
| $800 to $1,499 | 10 (66.7%) | 0 (0.0%) |
| $800 to $1,499 | 2 (13.3%) | 15 (100.0%) |
| Total | 15 (100.0%) | 15 (100.0%) |
Health & Disability in Monmouth
Health Insurance Coverage by Age in Monmouth
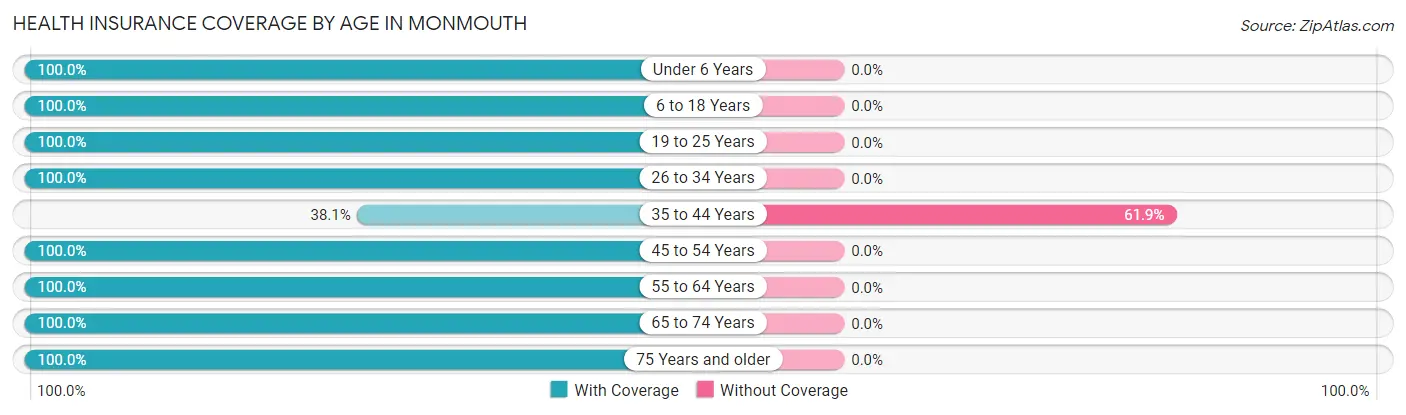
| Age Bracket | With Coverage | Without Coverage |
| Under 6 Years | 47 (100.0%) | 0 (0.0%) |
| 6 to 18 Years | 35 (100.0%) | 0 (0.0%) |
| 19 to 25 Years | 13 (100.0%) | 0 (0.0%) |
| 26 to 34 Years | 16 (100.0%) | 0 (0.0%) |
| 35 to 44 Years | 8 (38.1%) | 13 (61.9%) |
| 45 to 54 Years | 38 (100.0%) | 0 (0.0%) |
| 55 to 64 Years | 2 (100.0%) | 0 (0.0%) |
| 65 to 74 Years | 15 (100.0%) | 0 (0.0%) |
| 75 Years and older | 15 (100.0%) | 0 (0.0%) |
| Total | 189 (93.6%) | 13 (6.4%) |
Health Insurance Coverage by Citizenship Status in Monmouth
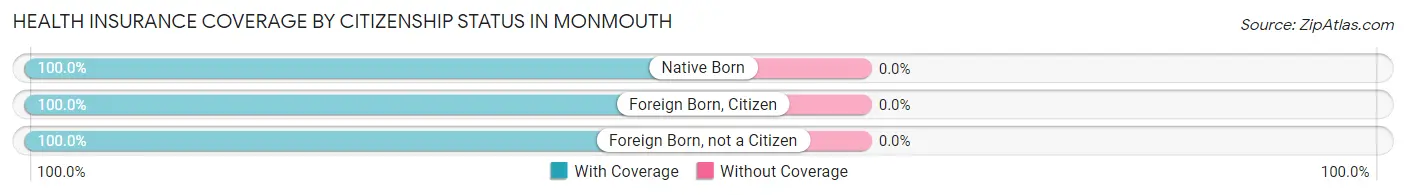
| Citizenship Status | With Coverage | Without Coverage |
| Native Born | 47 (100.0%) | 0 (0.0%) |
| Foreign Born, Citizen | 35 (100.0%) | 0 (0.0%) |
| Foreign Born, not a Citizen | 13 (100.0%) | 0 (0.0%) |
Health Insurance Coverage by Household Income in Monmouth
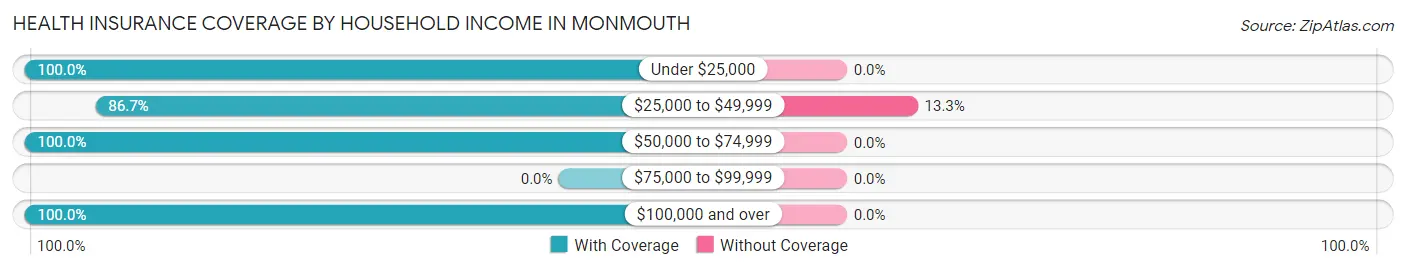
| Household Income | With Coverage | Without Coverage |
| Under $25,000 | 41 (100.0%) | 0 (0.0%) |
| $25,000 to $49,999 | 85 (86.7%) | 13 (13.3%) |
| $50,000 to $74,999 | 55 (100.0%) | 0 (0.0%) |
| $75,000 to $99,999 | 0 (0.0%) | 0 (0.0%) |
| $100,000 and over | 8 (100.0%) | 0 (0.0%) |
Public vs Private Health Insurance Coverage by Age in Monmouth
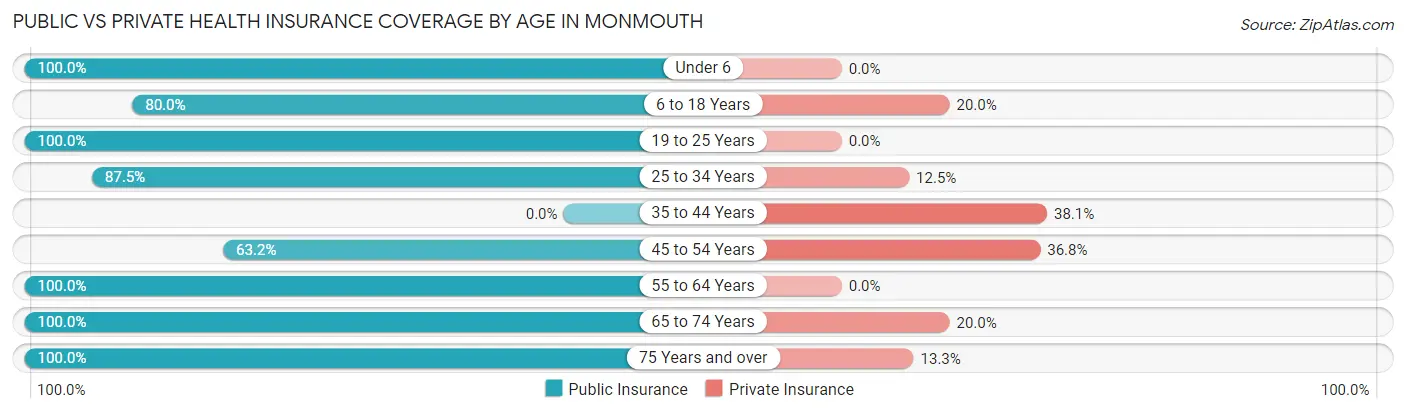
| Age Bracket | Public Insurance | Private Insurance |
| Under 6 | 47 (100.0%) | 0 (0.0%) |
| 6 to 18 Years | 28 (80.0%) | 7 (20.0%) |
| 19 to 25 Years | 13 (100.0%) | 0 (0.0%) |
| 25 to 34 Years | 14 (87.5%) | 2 (12.5%) |
| 35 to 44 Years | 0 (0.0%) | 8 (38.1%) |
| 45 to 54 Years | 24 (63.2%) | 14 (36.8%) |
| 55 to 64 Years | 2 (100.0%) | 0 (0.0%) |
| 65 to 74 Years | 15 (100.0%) | 3 (20.0%) |
| 75 Years and over | 15 (100.0%) | 2 (13.3%) |
| Total | 158 (78.2%) | 36 (17.8%) |
Disability Status by Sex by Age in Monmouth
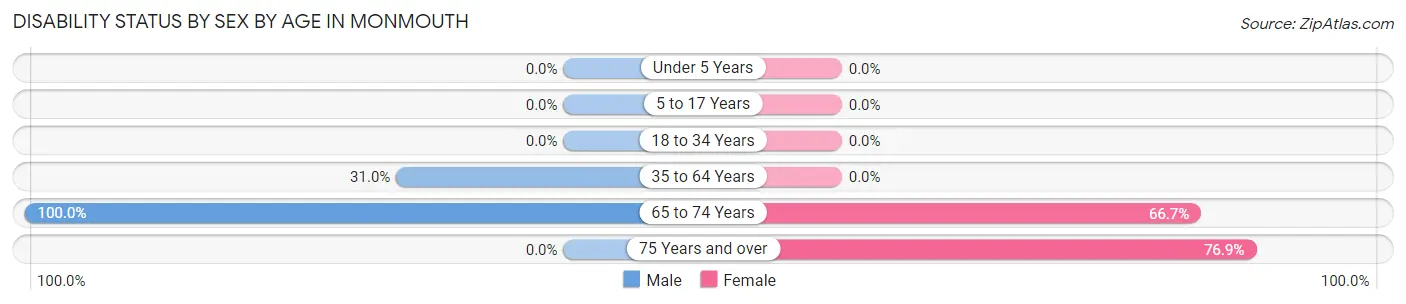
| Age Bracket | Male | Female |
| Under 5 Years | 0 (0.0%) | 0 (0.0%) |
| 5 to 17 Years | 0 (0.0%) | 0 (0.0%) |
| 18 to 34 Years | 0 (0.0%) | 0 (0.0%) |
| 35 to 64 Years | 9 (31.0%) | 0 (0.0%) |
| 65 to 74 Years | 6 (100.0%) | 6 (66.7%) |
| 75 Years and over | 0 (0.0%) | 10 (76.9%) |
Disability Class by Sex by Age in Monmouth
Disability Class: Hearing Difficulty
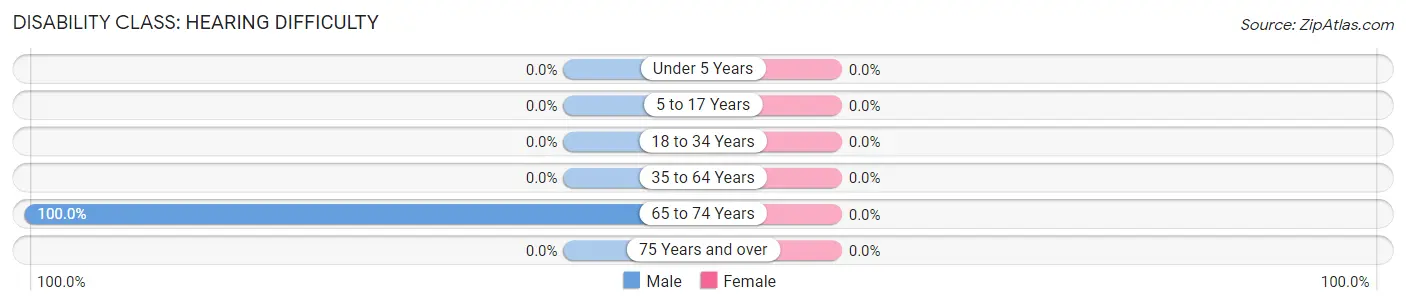
| Age Bracket | Male | Female |
| Under 5 Years | 0 (0.0%) | 0 (0.0%) |
| 5 to 17 Years | 0 (0.0%) | 0 (0.0%) |
| 18 to 34 Years | 0 (0.0%) | 0 (0.0%) |
| 35 to 64 Years | 0 (0.0%) | 0 (0.0%) |
| 65 to 74 Years | 6 (100.0%) | 0 (0.0%) |
| 75 Years and over | 0 (0.0%) | 0 (0.0%) |
Disability Class: Vision Difficulty
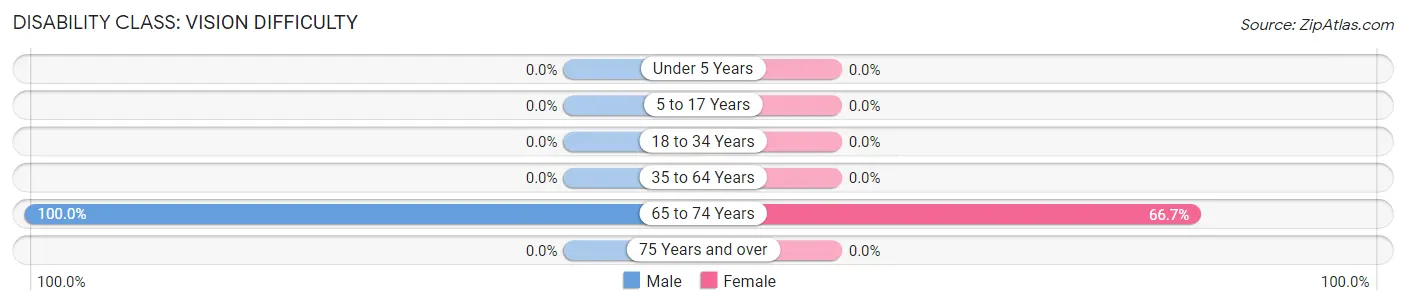
| Age Bracket | Male | Female |
| Under 5 Years | 0 (0.0%) | 0 (0.0%) |
| 5 to 17 Years | 0 (0.0%) | 0 (0.0%) |
| 18 to 34 Years | 0 (0.0%) | 0 (0.0%) |
| 35 to 64 Years | 0 (0.0%) | 0 (0.0%) |
| 65 to 74 Years | 6 (100.0%) | 6 (66.7%) |
| 75 Years and over | 0 (0.0%) | 0 (0.0%) |
Disability Class: Cognitive Difficulty
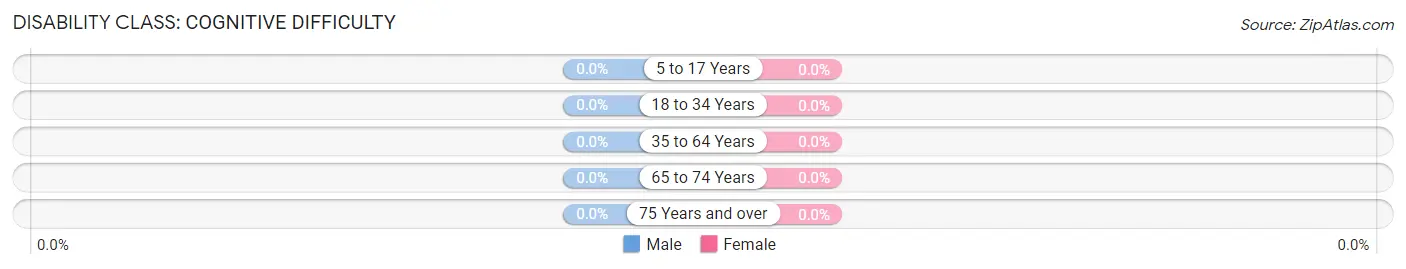
| Age Bracket | Male | Female |
| 5 to 17 Years | 0 (0.0%) | 0 (0.0%) |
| 18 to 34 Years | 0 (0.0%) | 0 (0.0%) |
| 35 to 64 Years | 0 (0.0%) | 0 (0.0%) |
| 65 to 74 Years | 0 (0.0%) | 0 (0.0%) |
| 75 Years and over | 0 (0.0%) | 0 (0.0%) |
Disability Class: Ambulatory Difficulty
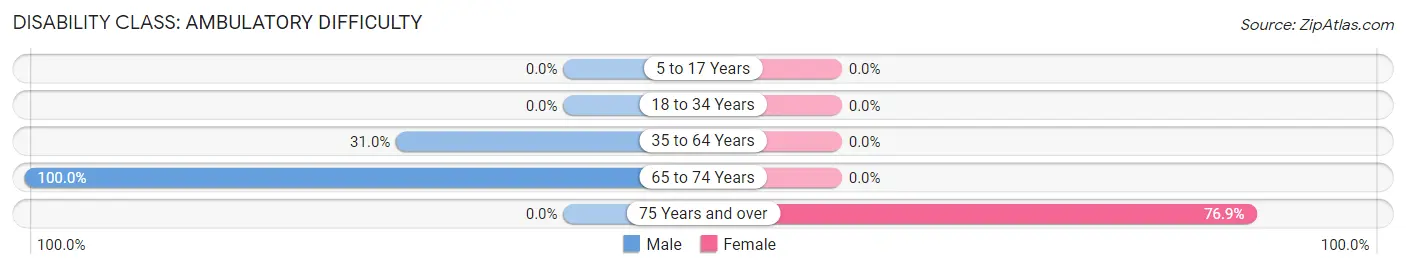
| Age Bracket | Male | Female |
| 5 to 17 Years | 0 (0.0%) | 0 (0.0%) |
| 18 to 34 Years | 0 (0.0%) | 0 (0.0%) |
| 35 to 64 Years | 9 (31.0%) | 0 (0.0%) |
| 65 to 74 Years | 6 (100.0%) | 0 (0.0%) |
| 75 Years and over | 0 (0.0%) | 10 (76.9%) |
Disability Class: Self-Care Difficulty
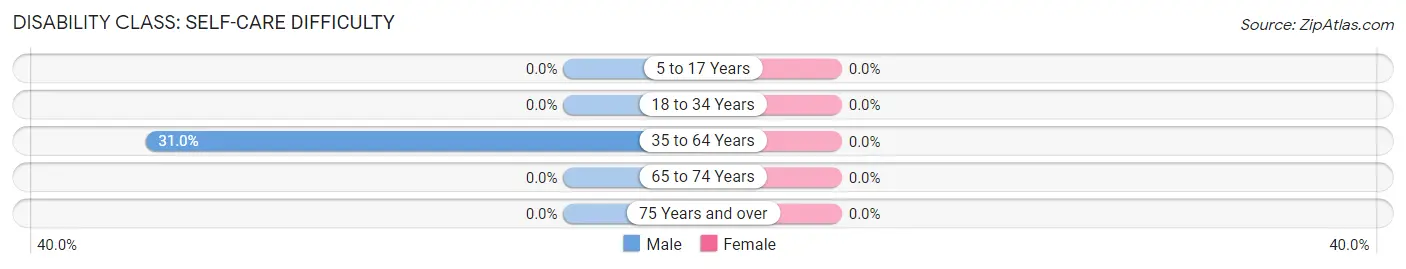
| Age Bracket | Male | Female |
| 5 to 17 Years | 0 (0.0%) | 0 (0.0%) |
| 18 to 34 Years | 0 (0.0%) | 0 (0.0%) |
| 35 to 64 Years | 9 (31.0%) | 0 (0.0%) |
| 65 to 74 Years | 0 (0.0%) | 0 (0.0%) |
| 75 Years and over | 0 (0.0%) | 0 (0.0%) |
Technology Access in Monmouth
Computing Device Access in Monmouth
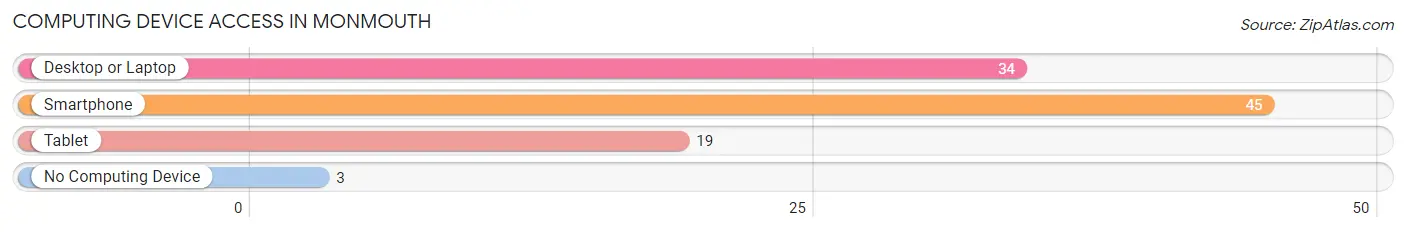
| Device Type | # Households | % Households |
| Desktop or Laptop | 34 | 70.8% |
| Smartphone | 45 | 93.8% |
| Tablet | 19 | 39.6% |
| No Computing Device | 3 | 6.2% |
| Total | 48 | 100.0% |
Internet Access in Monmouth
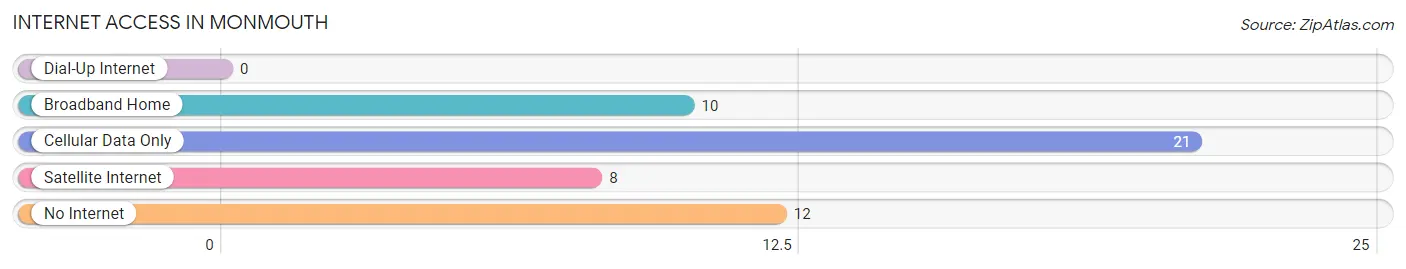
| Internet Type | # Households | % Households |
| Dial-Up Internet | 0 | 0.0% |
| Broadband Home | 10 | 20.8% |
| Cellular Data Only | 21 | 43.8% |
| Satellite Internet | 8 | 16.7% |
| No Internet | 12 | 25.0% |
| Total | 48 | 100.0% |
Monmouth Summary
Monmouth, California is a small city located in the northern part of the state, in the San Joaquin Valley. It is situated in the foothills of the Sierra Nevada Mountains, and is part of the larger metropolitan area of Fresno. The city has a population of approximately 8,000 people, and is known for its agricultural production, as well as its proximity to Yosemite National Park.
Geography
Monmouth is located in the northern part of California, in the San Joaquin Valley. It is situated in the foothills of the Sierra Nevada Mountains, and is part of the larger metropolitan area of Fresno. The city is located at an elevation of approximately 1,000 feet, and has a total area of 1.3 square miles. The climate in Monmouth is generally mild, with temperatures ranging from the mid-50s in the winter to the mid-90s in the summer.
Economy
Monmouth’s economy is largely based on agriculture. The city is home to a number of farms and ranches, which produce a variety of crops, including grapes, almonds, and olives. The city is also home to a number of wineries, which produce a variety of wines. Additionally, Monmouth is home to a number of businesses, including restaurants, retail stores, and professional services.
Demographics
As of the 2010 census, Monmouth had a population of 8,000 people. The racial makeup of the city was 75.3% White, 0.7% African American, 0.7% Native American, 0.7% Asian, 0.2% Pacific Islander, and 18.3% from other races. The median household income in Monmouth was $45,000, and the median age was 33.
History
Monmouth was founded in 1872 by a group of settlers from the Midwest. The city was named after the town of Monmouth, Illinois, which was the hometown of one of the settlers. The city quickly grew, and by the early 1900s, it had become a major agricultural center. In the 1950s, the city began to experience a population boom, as many people moved to the area to take advantage of the agricultural opportunities. Today, Monmouth is a thriving city, with a strong economy and a diverse population.
Common Questions
What is Per Capita Income in Monmouth?
Per Capita income in Monmouth is $11,478.
What is the Median Family Income in Monmouth?
Median Family Income in Monmouth is $39,083.
What is the Median Household income in Monmouth?
Median Household Income in Monmouth is $39,167.
What is Inequality or Gini Index in Monmouth?
Inequality or Gini Index in Monmouth is 0.25.
What is the Total Population of Monmouth?
Total Population of Monmouth is 202.
What is the Total Male Population of Monmouth?
Total Male Population of Monmouth is 111.
What is the Total Female Population of Monmouth?
Total Female Population of Monmouth is 91.
What is the Ratio of Males per 100 Females in Monmouth?
There are 121.98 Males per 100 Females in Monmouth.
What is the Ratio of Females per 100 Males in Monmouth?
There are 81.98 Females per 100 Males in Monmouth.
What is the Median Population Age in Monmouth?
Median Population Age in Monmouth is 28.5 Years.
What is the Average Family Size in Monmouth
Average Family Size in Monmouth is 4.6 People.
What is the Average Household Size in Monmouth
Average Household Size in Monmouth is 4.2 People.
How Large is the Labor Force in Monmouth?
There are 66 People in the Labor Forcein in Monmouth.
What is the Percentage of People in the Labor Force in Monmouth?
55.0% of People are in the Labor Force in Monmouth.
What is the Unemployment Rate in Monmouth?
Unemployment Rate in Monmouth is 6.1%.