Cities with the Highest Percentage of Population Employed in Architecture & Engineering in Texas
RELATED REPORTS & OPTIONS
Architecture & Engineering
Texas
Compare Cities
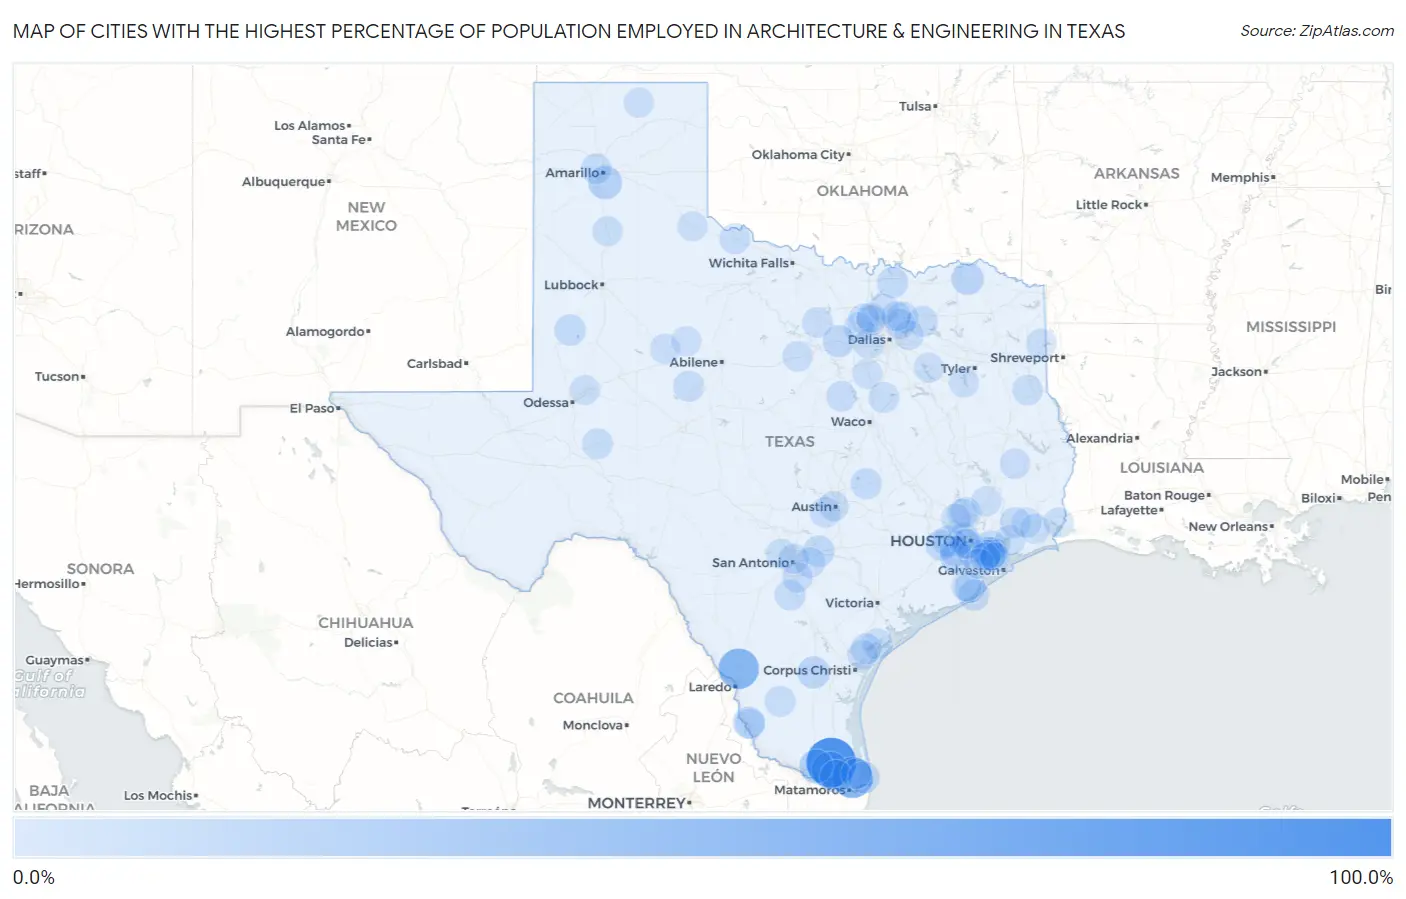
Map of Cities with the Highest Percentage of Population Employed in Architecture & Engineering in Texas
0.0%
100.0%
Cities with the Highest Percentage of Population Employed in Architecture & Engineering in Texas
| City | % Employed | vs State | vs National | |
| 1. | Yznaga | 100.0% | 2.2%(+97.8)#1 | 2.1%(+97.9)#5 |
| 2. | Pinebrook | 83.2% | 2.2%(+81.0)#2 | 2.1%(+81.1)#13 |
| 3. | East Columbia | 69.1% | 2.2%(+66.9)#3 | 2.1%(+66.9)#14 |
| 4. | Orason | 56.7% | 2.2%(+54.5)#4 | 2.1%(+54.6)#19 |
| 5. | Botines | 53.8% | 2.2%(+51.6)#5 | 2.1%(+51.7)#23 |
| 6. | Richards | 48.8% | 2.2%(+46.6)#6 | 2.1%(+46.6)#27 |
| 7. | Lyons | 45.7% | 2.2%(+43.4)#7 | 2.1%(+43.5)#32 |
| 8. | Ratamosa | 36.7% | 2.2%(+34.4)#8 | 2.1%(+34.5)#43 |
| 9. | Ben Arnold | 27.3% | 2.2%(+25.1)#9 | 2.1%(+25.1)#72 |
| 10. | Muniz | 22.5% | 2.2%(+20.3)#10 | 2.1%(+20.3)#106 |
| 11. | Palisades | 21.2% | 2.2%(+19.0)#11 | 2.1%(+19.1)#119 |
| 12. | Rangerville | 17.0% | 2.2%(+14.8)#12 | 2.1%(+14.8)#177 |
| 13. | Sun Valley | 15.9% | 2.2%(+13.7)#13 | 2.1%(+13.8)#205 |
| 14. | Coyote Acres | 15.0% | 2.2%(+12.7)#14 | 2.1%(+12.8)#232 |
| 15. | Taylor Lake Village | 14.3% | 2.2%(+12.0)#15 | 2.1%(+12.1)#254 |
| 16. | Thompsons | 14.1% | 2.2%(+11.9)#16 | 2.1%(+11.9)#263 |
| 17. | Hudson Oaks | 13.2% | 2.2%(+11.0)#17 | 2.1%(+11.1)#297 |
| 18. | Laguna Heights | 12.9% | 2.2%(+10.7)#18 | 2.1%(+10.8)#307 |
| 19. | Las Palmas | 12.8% | 2.2%(+10.6)#19 | 2.1%(+10.7)#315 |
| 20. | Cinco Ranch | 12.3% | 2.2%(+10.1)#20 | 2.1%(+10.2)#339 |
| 21. | Mcqueeney | 11.7% | 2.2%(+9.52)#21 | 2.1%(+9.60)#373 |
| 22. | Hilshire Village | 11.1% | 2.2%(+8.84)#22 | 2.1%(+8.91)#417 |
| 23. | Fulshear | 11.0% | 2.2%(+8.77)#23 | 2.1%(+8.84)#422 |
| 24. | Mcleod | 11.0% | 2.2%(+8.74)#24 | 2.1%(+8.81)#425 |
| 25. | Lucas | 10.4% | 2.2%(+8.14)#25 | 2.1%(+8.22)#466 |
| 26. | Loop | 10.3% | 2.2%(+8.07)#26 | 2.1%(+8.14)#473 |
| 27. | Morgan S Point | 10.2% | 2.2%(+7.98)#27 | 2.1%(+8.05)#478 |
| 28. | Hamshire | 10.0% | 2.2%(+7.79)#28 | 2.1%(+7.86)#491 |
| 29. | Thorndale | 9.5% | 2.2%(+7.26)#29 | 2.1%(+7.33)#541 |
| 30. | Southmayd | 9.2% | 2.2%(+7.01)#30 | 2.1%(+7.08)#554 |
| 31. | Quintana | 9.1% | 2.2%(+6.87)#31 | 2.1%(+6.94)#569 |
| 32. | Blackwell | 8.8% | 2.2%(+6.60)#32 | 2.1%(+6.67)#605 |
| 33. | South Fork Estates | 8.7% | 2.2%(+6.47)#33 | 2.1%(+6.55)#618 |
| 34. | Clute | 8.5% | 2.2%(+6.32)#34 | 2.1%(+6.39)#634 |
| 35. | Devers | 8.2% | 2.2%(+6.01)#35 | 2.1%(+6.08)#678 |
| 36. | Holiday Beach | 8.1% | 2.2%(+5.92)#36 | 2.1%(+5.99)#697 |
| 37. | Chillicothe | 8.1% | 2.2%(+5.87)#37 | 2.1%(+5.94)#707 |
| 38. | Bishop Hills | 8.0% | 2.2%(+5.82)#38 | 2.1%(+5.90)#718 |
| 39. | Clear Lake Shores | 7.9% | 2.2%(+5.68)#39 | 2.1%(+5.75)#740 |
| 40. | Rankin | 7.8% | 2.2%(+5.62)#40 | 2.1%(+5.69)#746 |
| 41. | Jourdanton | 7.7% | 2.2%(+5.43)#41 | 2.1%(+5.50)#780 |
| 42. | Caddo Mills | 7.6% | 2.2%(+5.42)#42 | 2.1%(+5.50)#782 |
| 43. | Bayside | 7.6% | 2.2%(+5.39)#43 | 2.1%(+5.47)#788 |
| 44. | Malone | 7.4% | 2.2%(+5.22)#44 | 2.1%(+5.30)#820 |
| 45. | Kemah | 7.3% | 2.2%(+5.04)#45 | 2.1%(+5.11)#856 |
| 46. | Perrin | 7.2% | 2.2%(+5.02)#46 | 2.1%(+5.10)#860 |
| 47. | Seabrook | 7.2% | 2.2%(+5.01)#47 | 2.1%(+5.08)#865 |
| 48. | Shenandoah | 7.2% | 2.2%(+4.99)#48 | 2.1%(+5.06)#873 |
| 49. | St Hedwig | 7.2% | 2.2%(+4.97)#49 | 2.1%(+5.04)#882 |
| 50. | Tradewinds | 7.1% | 2.2%(+4.87)#50 | 2.1%(+4.94)#908 |
| 51. | Sugar Land | 6.7% | 2.2%(+4.45)#51 | 2.1%(+4.53)#999 |
| 52. | Gary City | 6.6% | 2.2%(+4.37)#52 | 2.1%(+4.44)#1,025 |
| 53. | Chester | 6.5% | 2.2%(+4.28)#53 | 2.1%(+4.35)#1,046 |
| 54. | Bear Creek | 6.5% | 2.2%(+4.27)#54 | 2.1%(+4.34)#1,047 |
| 55. | Mingus | 6.4% | 2.2%(+4.21)#55 | 2.1%(+4.28)#1,074 |
| 56. | Bayview | 6.4% | 2.2%(+4.14)#56 | 2.1%(+4.21)#1,099 |
| 57. | Murphy | 6.2% | 2.2%(+3.99)#57 | 2.1%(+4.07)#1,152 |
| 58. | Uncertain | 6.1% | 2.2%(+3.84)#58 | 2.1%(+3.91)#1,210 |
| 59. | Northlake | 6.0% | 2.2%(+3.82)#59 | 2.1%(+3.90)#1,214 |
| 60. | Anahuac | 6.0% | 2.2%(+3.81)#60 | 2.1%(+3.88)#1,226 |
| 61. | Helotes | 6.0% | 2.2%(+3.78)#61 | 2.1%(+3.86)#1,235 |
| 62. | Meridian | 6.0% | 2.2%(+3.77)#62 | 2.1%(+3.85)#1,245 |
| 63. | Sienna | 6.0% | 2.2%(+3.75)#63 | 2.1%(+3.82)#1,252 |
| 64. | El Lago | 5.9% | 2.2%(+3.70)#64 | 2.1%(+3.77)#1,279 |
| 65. | Rollingwood | 5.9% | 2.2%(+3.69)#65 | 2.1%(+3.76)#1,283 |
| 66. | The Woodlands | 5.9% | 2.2%(+3.68)#66 | 2.1%(+3.76)#1,285 |
| 67. | Kress | 5.9% | 2.2%(+3.68)#67 | 2.1%(+3.75)#1,286 |
| 68. | Sandy Oaks | 5.9% | 2.2%(+3.65)#68 | 2.1%(+3.73)#1,305 |
| 69. | Alamo Heights | 5.8% | 2.2%(+3.61)#69 | 2.1%(+3.68)#1,328 |
| 70. | Hermleigh | 5.7% | 2.2%(+3.52)#70 | 2.1%(+3.59)#1,371 |
| 71. | Tomball | 5.6% | 2.2%(+3.40)#71 | 2.1%(+3.47)#1,433 |
| 72. | Little Cypress | 5.6% | 2.2%(+3.38)#72 | 2.1%(+3.46)#1,441 |
| 73. | Coffee City | 5.6% | 2.2%(+3.33)#73 | 2.1%(+3.41)#1,472 |
| 74. | Nassau Bay | 5.5% | 2.2%(+3.28)#74 | 2.1%(+3.35)#1,509 |
| 75. | Nome | 5.5% | 2.2%(+3.27)#75 | 2.1%(+3.34)#1,516 |
| 76. | Haslet | 5.5% | 2.2%(+3.25)#76 | 2.1%(+3.32)#1,519 |
| 77. | Pantego | 5.5% | 2.2%(+3.24)#77 | 2.1%(+3.32)#1,522 |
| 78. | Belterra | 5.4% | 2.2%(+3.22)#78 | 2.1%(+3.29)#1,537 |
| 79. | Fannett | 5.4% | 2.2%(+3.21)#79 | 2.1%(+3.29)#1,538 |
| 80. | Bridge City | 5.4% | 2.2%(+3.21)#80 | 2.1%(+3.28)#1,542 |
| 81. | Mabank | 5.4% | 2.2%(+3.14)#81 | 2.1%(+3.21)#1,583 |
| 82. | Savannah | 5.4% | 2.2%(+3.14)#82 | 2.1%(+3.21)#1,585 |
| 83. | Lake Jackson | 5.3% | 2.2%(+3.13)#83 | 2.1%(+3.20)#1,598 |
| 84. | Pearland | 5.3% | 2.2%(+3.11)#84 | 2.1%(+3.18)#1,609 |
| 85. | Bellaire | 5.3% | 2.2%(+3.10)#85 | 2.1%(+3.17)#1,616 |
| 86. | West University Place | 5.3% | 2.2%(+3.09)#86 | 2.1%(+3.17)#1,617 |
| 87. | Hillcrest | 5.3% | 2.2%(+3.09)#87 | 2.1%(+3.16)#1,622 |
| 88. | Spearman | 5.3% | 2.2%(+3.08)#88 | 2.1%(+3.15)#1,626 |
| 89. | North Cleveland | 5.3% | 2.2%(+3.04)#89 | 2.1%(+3.11)#1,652 |
| 90. | Grandview | 5.3% | 2.2%(+3.03)#90 | 2.1%(+3.10)#1,666 |
| 91. | Medina | 5.2% | 2.2%(+3.02)#91 | 2.1%(+3.10)#1,669 |
| 92. | Heath | 5.2% | 2.2%(+2.98)#92 | 2.1%(+3.05)#1,689 |
| 93. | Double Oak | 5.2% | 2.2%(+2.94)#93 | 2.1%(+3.01)#1,729 |
| 94. | Midland | 5.1% | 2.2%(+2.92)#94 | 2.1%(+2.99)#1,741 |
| 95. | Lantana | 5.0% | 2.2%(+2.82)#95 | 2.1%(+2.90)#1,802 |
| 96. | League City | 5.0% | 2.2%(+2.82)#96 | 2.1%(+2.89)#1,805 |
| 97. | Childress | 5.0% | 2.2%(+2.81)#97 | 2.1%(+2.89)#1,807 |
| 98. | Roby | 5.0% | 2.2%(+2.79)#98 | 2.1%(+2.87)#1,822 |
| 99. | Allen | 5.0% | 2.2%(+2.79)#99 | 2.1%(+2.86)#1,825 |
| 100. | San Leon | 5.0% | 2.2%(+2.76)#100 | 2.1%(+2.84)#1,847 |
Common Questions
What are the Top 10 Cities with the Highest Percentage of Population Employed in Architecture & Engineering in Texas?
Top 10 Cities with the Highest Percentage of Population Employed in Architecture & Engineering in Texas are:
#1
100.0%
#2
56.7%
#3
53.8%
#4
36.7%
#5
22.5%
#6
21.2%
#7
17.0%
#8
15.9%
#9
15.0%
#10
14.3%
What city has the Highest Percentage of Population Employed in Architecture & Engineering in Texas?
Yznaga has the Highest Percentage of Population Employed in Architecture & Engineering in Texas with 100.0%.
What is the Percentage of Population Employed in Architecture & Engineering in the State of Texas?
Percentage of Population Employed in Architecture & Engineering in Texas is 2.2%.
What is the Percentage of Population Employed in Architecture & Engineering in the United States?
Percentage of Population Employed in Architecture & Engineering in the United States is 2.1%.