Belmont, CA Map & Demographics
Belmont Map
Belmont Overview
$92,904
PER CAPITA INCOME
$246,250
AVG FAMILY INCOME
$185,944
AVG HOUSEHOLD INCOME
26.9%
WAGE / INCOME GAP [ % ]
73.1¢/ $1
WAGE / INCOME GAP [ $ ]
0.45
INEQUALITY / GINI INDEX
27,820
TOTAL POPULATION
14,311
MALE POPULATION
13,509
FEMALE POPULATION
105.94
MALES / 100 FEMALES
94.40
FEMALES / 100 MALES
40.9
MEDIAN AGE
3.0
AVG FAMILY SIZE
2.5
AVG HOUSEHOLD SIZE
15,646
LABOR FORCE [ PEOPLE ]
69.8%
PERCENT IN LABOR FORCE
6.5%
UNEMPLOYMENT RATE
Belmont Zip Codes
Belmont Area Codes
Income in Belmont
Income Overview in Belmont
Per Capita Income in Belmont is $92,904, while median incomes of families and households are $246,250 and $185,944 respectively.
| Characteristic | Number | Measure |
| Per Capita Income | 27,820 | $92,904 |
| Median Family Income | 7,334 | $246,250 |
| Mean Family Income | 7,334 | $293,781 |
| Median Household Income | 10,811 | $185,944 |
| Mean Household Income | 10,811 | $238,865 |
| Income Deficit | 7,334 | $0 |
| Wage / Income Gap (%) | 27,820 | 26.91% |
| Wage / Income Gap ($) | 27,820 | 73.09¢ per $1 |
| Gini / Inequality Index | 27,820 | 0.45 |
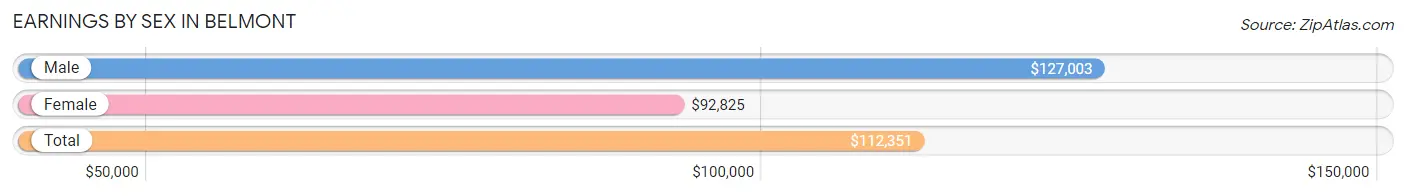
Earnings by Sex in Belmont
Average Earnings in Belmont are $112,351, $127,003 for men and $92,825 for women, a difference of 26.9%.
| Sex | Number | Average Earnings |
| Male | 8,246 (51.4%) | $127,003 |
| Female | 7,795 (48.6%) | $92,825 |
| Total | 16,041 (100.0%) | $112,351 |
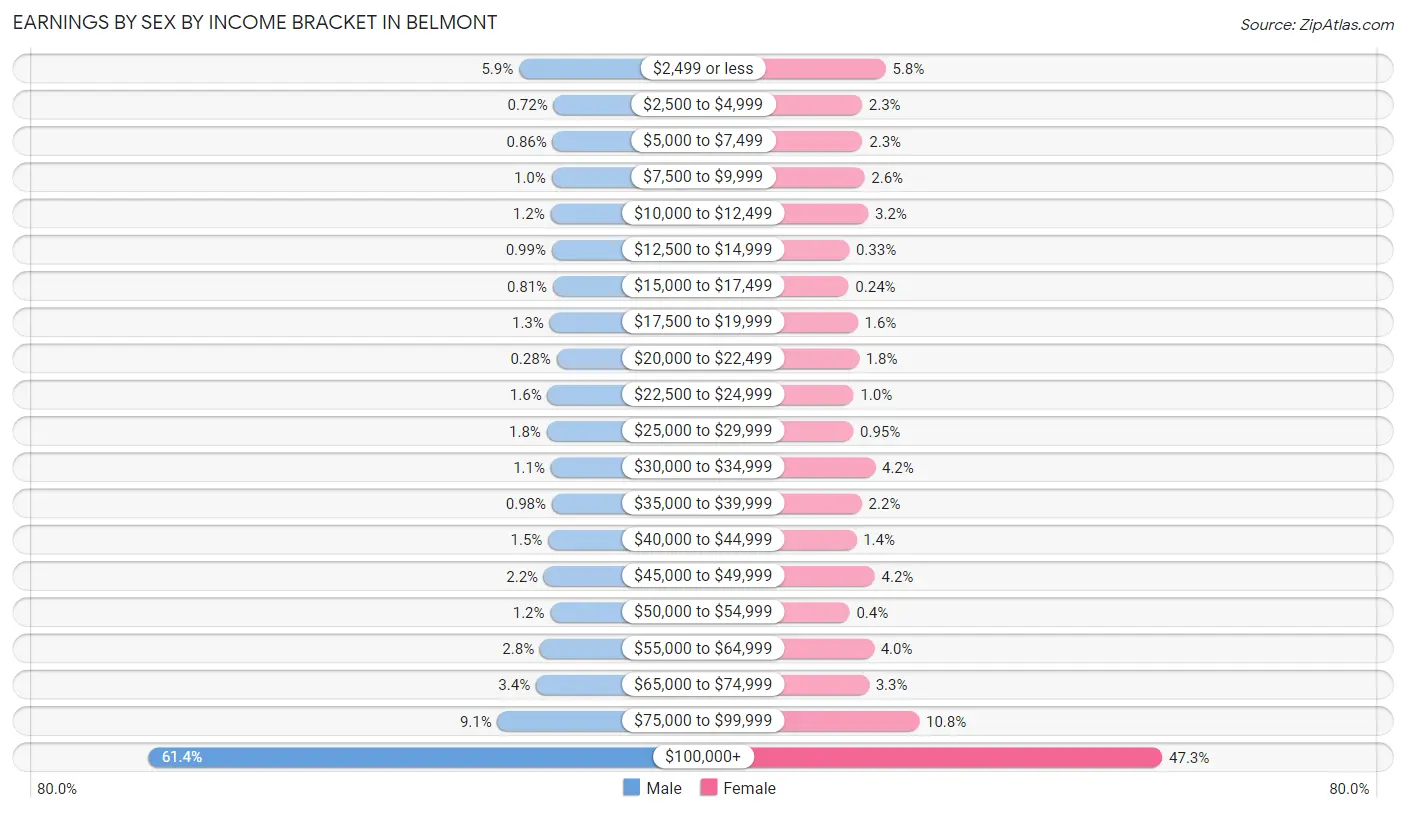
Earnings by Sex by Income Bracket in Belmont
The most common earnings brackets in Belmont are $100,000+ for men (5,062 | 61.4%) and $100,000+ for women (3,684 | 47.3%).
| Income | Male | Female |
| $2,499 or less | 486 (5.9%) | 453 (5.8%) |
| $2,500 to $4,999 | 59 (0.7%) | 176 (2.3%) |
| $5,000 to $7,499 | 71 (0.9%) | 182 (2.3%) |
| $7,500 to $9,999 | 83 (1.0%) | 205 (2.6%) |
| $10,000 to $12,499 | 97 (1.2%) | 249 (3.2%) |
| $12,500 to $14,999 | 82 (1.0%) | 26 (0.3%) |
| $15,000 to $17,499 | 67 (0.8%) | 19 (0.2%) |
| $17,500 to $19,999 | 108 (1.3%) | 126 (1.6%) |
| $20,000 to $22,499 | 23 (0.3%) | 139 (1.8%) |
| $22,500 to $24,999 | 134 (1.6%) | 78 (1.0%) |
| $25,000 to $29,999 | 144 (1.8%) | 74 (0.9%) |
| $30,000 to $34,999 | 93 (1.1%) | 330 (4.2%) |
| $35,000 to $39,999 | 81 (1.0%) | 174 (2.2%) |
| $40,000 to $44,999 | 125 (1.5%) | 110 (1.4%) |
| $45,000 to $49,999 | 178 (2.2%) | 325 (4.2%) |
| $50,000 to $54,999 | 99 (1.2%) | 31 (0.4%) |
| $55,000 to $64,999 | 227 (2.8%) | 314 (4.0%) |
| $65,000 to $74,999 | 276 (3.4%) | 256 (3.3%) |
| $75,000 to $99,999 | 751 (9.1%) | 844 (10.8%) |
| $100,000+ | 5,062 (61.4%) | 3,684 (47.3%) |
| Total | 8,246 (100.0%) | 7,795 (100.0%) |
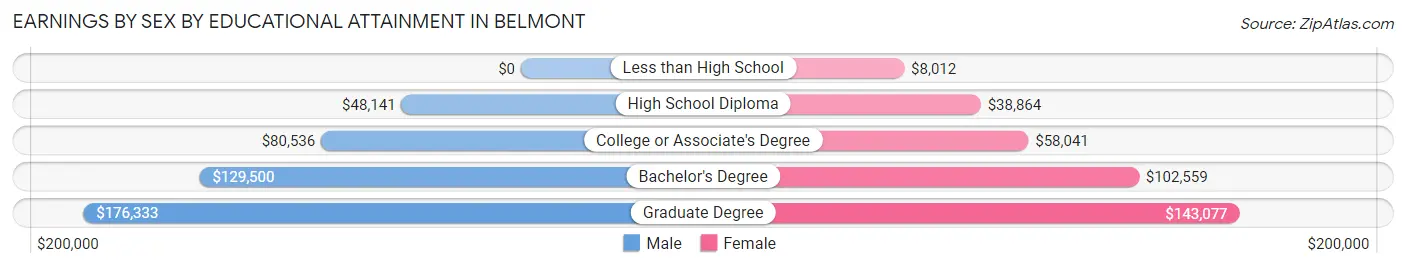
Earnings by Sex by Educational Attainment in Belmont
Average earnings in Belmont are $136,992 for men and $101,124 for women, a difference of 26.2%. Men with an educational attainment of graduate degree enjoy the highest average annual earnings of $176,333, while those with high school diploma education earn the least with $48,141. Women with an educational attainment of graduate degree earn the most with the average annual earnings of $143,077, while those with less than high school education have the smallest earnings of $8,012.
| Educational Attainment | Male Income | Female Income |
| Less than High School | - | - |
| High School Diploma | $48,141 | $38,864 |
| College or Associate's Degree | $80,536 | $58,041 |
| Bachelor's Degree | $129,500 | $102,559 |
| Graduate Degree | $176,333 | $143,077 |
| Total | $136,992 | $101,124 |
Family Income in Belmont
Family Income Brackets in Belmont
According to the Belmont family income data, there are 4,518 families falling into the $200,000+ income range, which is the most common income bracket and makes up 61.6% of all families. Conversely, the $25,000 to $34,999 income bracket is the least frequent group with only 95 families (1.3%) belonging to this category.
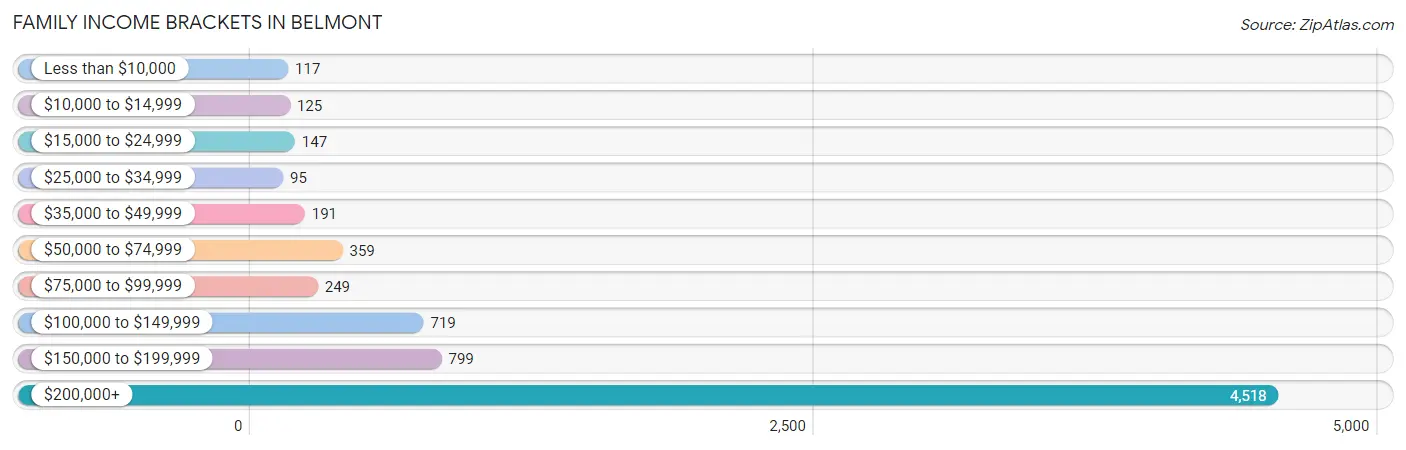
| Income Bracket | # Families | % Families |
| Less than $10,000 | 117 | 1.6% |
| $10,000 to $14,999 | 125 | 1.7% |
| $15,000 to $24,999 | 147 | 2.0% |
| $25,000 to $34,999 | 95 | 1.3% |
| $35,000 to $49,999 | 191 | 2.6% |
| $50,000 to $74,999 | 359 | 4.9% |
| $75,000 to $99,999 | 249 | 3.4% |
| $100,000 to $149,999 | 719 | 9.8% |
| $150,000 to $199,999 | 799 | 10.9% |
| $200,000+ | 4,518 | 61.6% |
Family Income by Famaliy Size in Belmont
3-person families (1,978 | 27.0%) account for the highest median family income in Belmont with $250,001 per family, while 2-person families (3,110 | 42.4%) have the highest median income of $101,739 per family member.
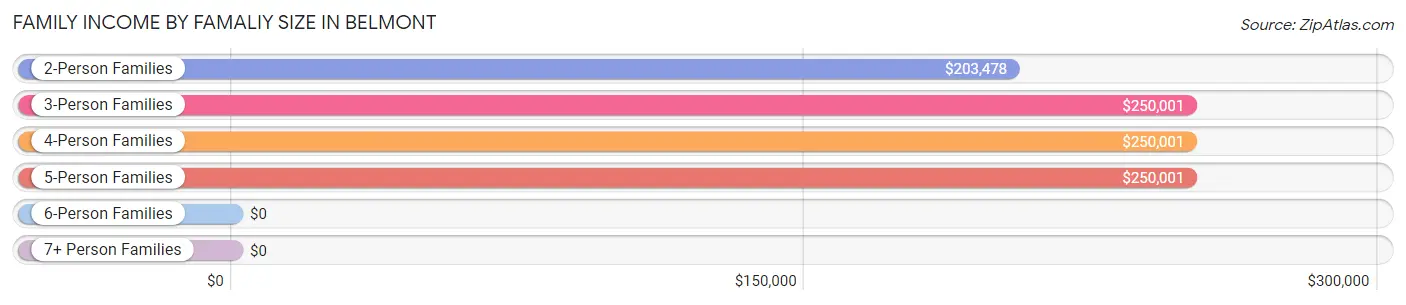
| Income Bracket | # Families | Median Income |
| 2-Person Families | 3,110 (42.4%) | $203,478 |
| 3-Person Families | 1,978 (27.0%) | $250,001 |
| 4-Person Families | 1,720 (23.4%) | $250,001 |
| 5-Person Families | 456 (6.2%) | $250,001 |
| 6-Person Families | 32 (0.4%) | $0 |
| 7+ Person Families | 38 (0.5%) | $0 |
| Total | 7,334 (100.0%) | $246,250 |
Family Income by Number of Earners in Belmont
The median family income in Belmont is $246,250, with families comprising 2 earners (3,877) having the highest median family income of $250,001, while families with no earners (663) have the lowest median family income of $83,036, accounting for 52.9% and 9.0% of families, respectively.
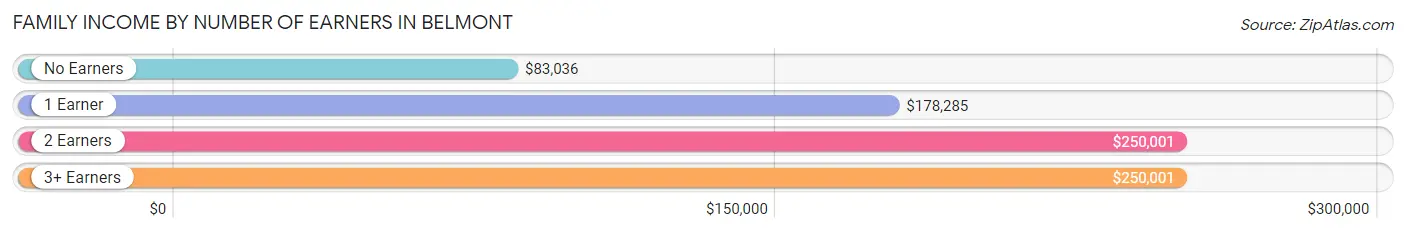
| Number of Earners | # Families | Median Income |
| No Earners | 663 (9.0%) | $83,036 |
| 1 Earner | 2,139 (29.2%) | $178,285 |
| 2 Earners | 3,877 (52.9%) | $250,001 |
| 3+ Earners | 655 (8.9%) | $250,001 |
| Total | 7,334 (100.0%) | $246,250 |
Household Income in Belmont
Household Income Brackets in Belmont
With 5,211 households falling in the category, the $200,000+ income range is the most frequent in Belmont, accounting for 48.2% of all households. In contrast, only 270 households (2.5%) fall into the less than $10,000 income bracket, making it the least populous group.
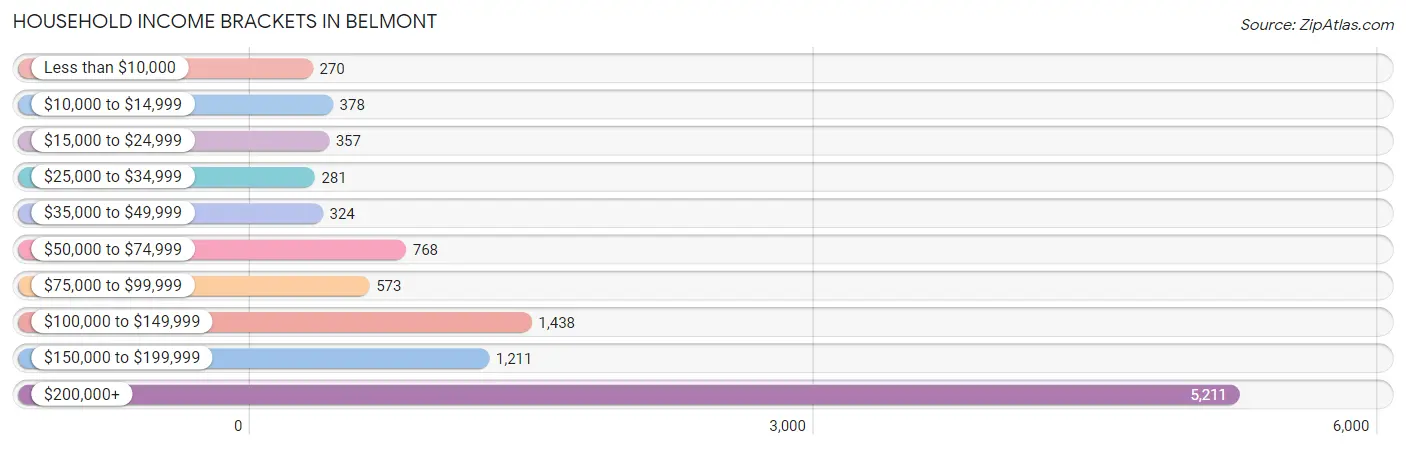
| Income Bracket | # Households | % Households |
| Less than $10,000 | 270 | 2.5% |
| $10,000 to $14,999 | 378 | 3.5% |
| $15,000 to $24,999 | 357 | 3.3% |
| $25,000 to $34,999 | 281 | 2.6% |
| $35,000 to $49,999 | 324 | 3.0% |
| $50,000 to $74,999 | 768 | 7.1% |
| $75,000 to $99,999 | 573 | 5.3% |
| $100,000 to $149,999 | 1,438 | 13.3% |
| $150,000 to $199,999 | 1,211 | 11.2% |
| $200,000+ | 5,211 | 48.2% |
Household Income by Householder Age in Belmont
The median household income in Belmont is $185,944, with the highest median household income of $226,842 found in the 45 to 64 years age bracket for the primary householder. A total of 4,446 households (41.1%) fall into this category. Meanwhile, the 15 to 24 years age bracket for the primary householder has the lowest median household income of $0, with 119 households (1.1%) in this group.
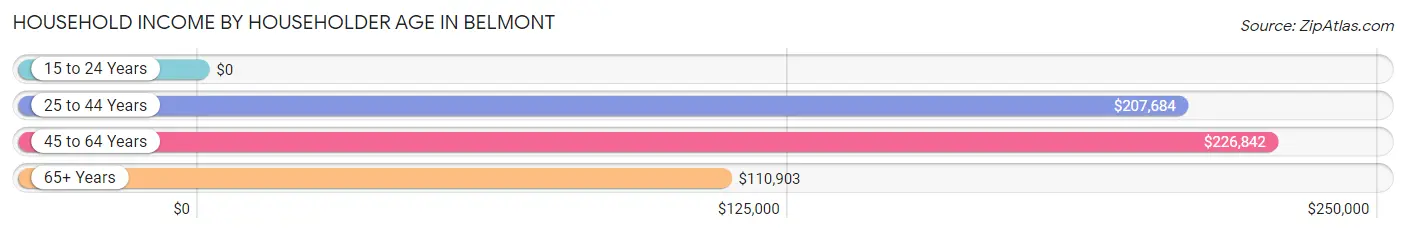
| Income Bracket | # Households | Median Income |
| 15 to 24 Years | 119 (1.1%) | $0 |
| 25 to 44 Years | 4,055 (37.5%) | $207,684 |
| 45 to 64 Years | 4,446 (41.1%) | $226,842 |
| 65+ Years | 2,191 (20.3%) | $110,903 |
| Total | 10,811 (100.0%) | $185,944 |
Poverty in Belmont
Income Below Poverty by Sex and Age in Belmont
With 5.9% poverty level for males and 7.9% for females among the residents of Belmont, 12 to 14 year old males and 25 to 34 year old females are the most vulnerable to poverty, with 113 males (20.1%) and 359 females (19.2%) in their respective age groups living below the poverty level.
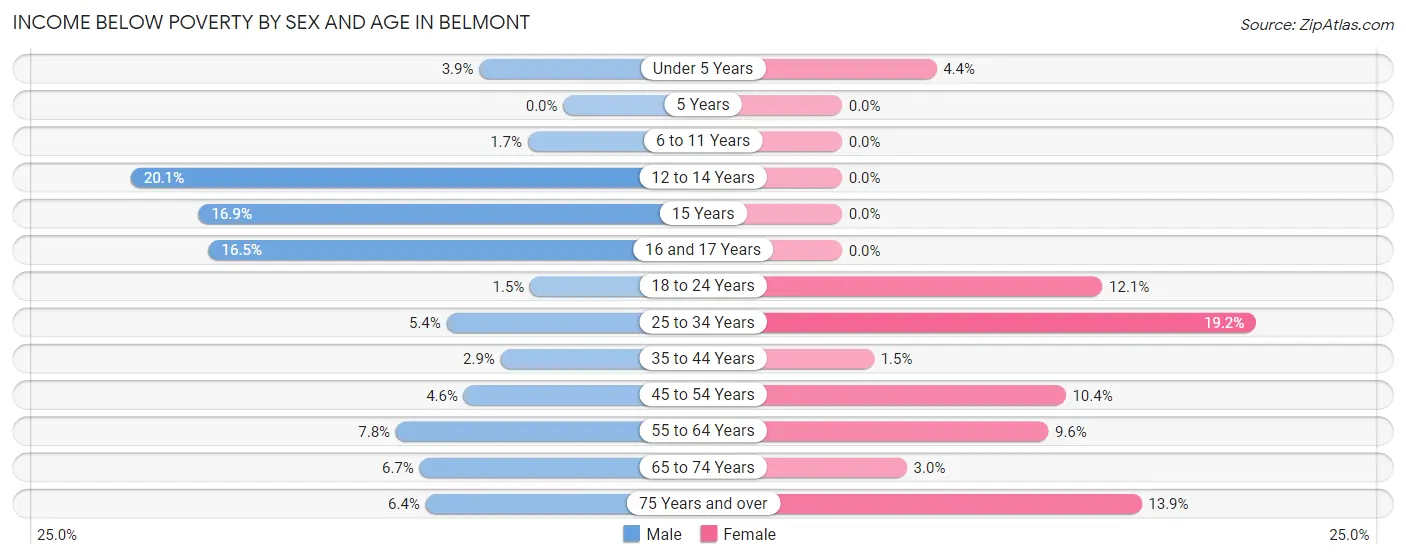
| Age Bracket | Male | Female |
| Under 5 Years | 29 (3.9%) | 30 (4.4%) |
| 5 Years | 0 (0.0%) | 0 (0.0%) |
| 6 to 11 Years | 22 (1.7%) | 0 (0.0%) |
| 12 to 14 Years | 113 (20.1%) | 0 (0.0%) |
| 15 Years | 43 (16.9%) | 0 (0.0%) |
| 16 and 17 Years | 105 (16.5%) | 0 (0.0%) |
| 18 to 24 Years | 8 (1.5%) | 68 (12.1%) |
| 25 to 34 Years | 92 (5.4%) | 359 (19.2%) |
| 35 to 44 Years | 64 (2.9%) | 35 (1.5%) |
| 45 to 54 Years | 108 (4.6%) | 219 (10.4%) |
| 55 to 64 Years | 128 (7.8%) | 185 (9.6%) |
| 65 to 74 Years | 79 (6.7%) | 28 (3.0%) |
| 75 Years and over | 46 (6.4%) | 125 (13.9%) |
| Total | 837 (5.9%) | 1,049 (7.9%) |
Income Above Poverty by Sex and Age in Belmont
According to the poverty statistics in Belmont, males aged 5 years and females aged 5 years are the age groups that are most secure financially, with 100.0% of males and 100.0% of females in these age groups living above the poverty line.
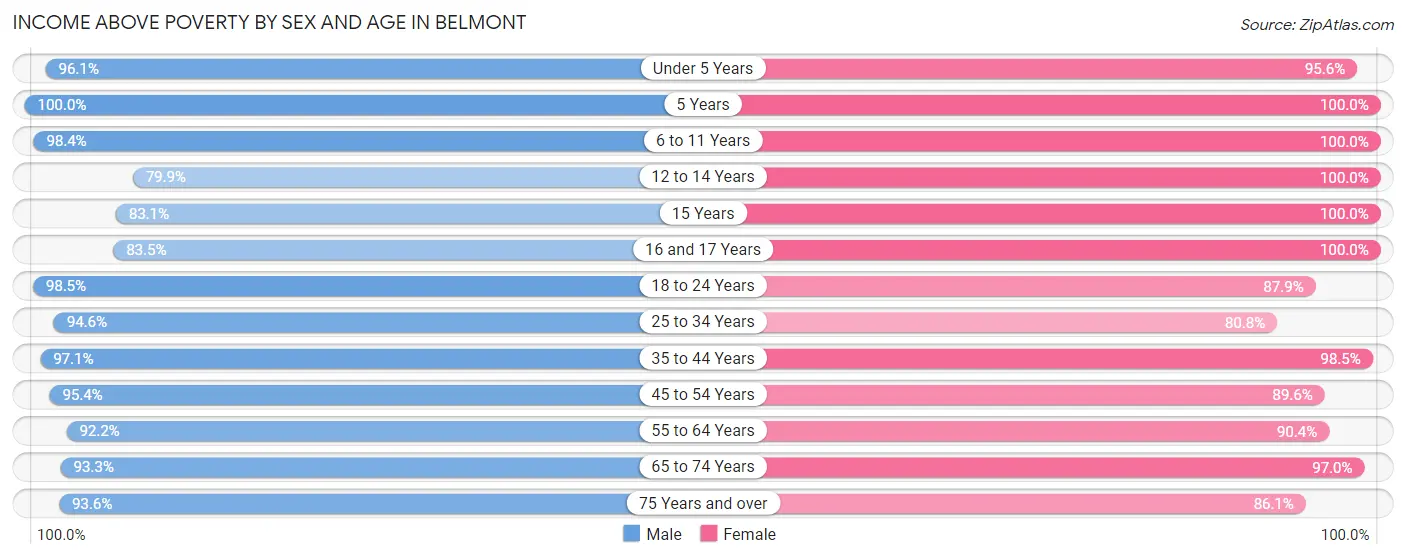
| Age Bracket | Male | Female |
| Under 5 Years | 715 (96.1%) | 655 (95.6%) |
| 5 Years | 229 (100.0%) | 72 (100.0%) |
| 6 to 11 Years | 1,311 (98.4%) | 883 (100.0%) |
| 12 to 14 Years | 450 (79.9%) | 435 (100.0%) |
| 15 Years | 211 (83.1%) | 207 (100.0%) |
| 16 and 17 Years | 533 (83.5%) | 346 (100.0%) |
| 18 to 24 Years | 513 (98.5%) | 495 (87.9%) |
| 25 to 34 Years | 1,606 (94.6%) | 1,509 (80.8%) |
| 35 to 44 Years | 2,135 (97.1%) | 2,323 (98.5%) |
| 45 to 54 Years | 2,232 (95.4%) | 1,891 (89.6%) |
| 55 to 64 Years | 1,519 (92.2%) | 1,749 (90.4%) |
| 65 to 74 Years | 1,105 (93.3%) | 903 (97.0%) |
| 75 Years and over | 674 (93.6%) | 774 (86.1%) |
| Total | 13,233 (94.1%) | 12,242 (92.1%) |
Income Below Poverty Among Married-Couple Families in Belmont
The poverty statistics for married-couple families in Belmont show that 4.1% or 269 of the total 6,500 families live below the poverty line. Families with 1 or 2 children have the highest poverty rate of 5.2%, comprising of 162 families. On the other hand, families with 3 or 4 children have the lowest poverty rate of 0.0%, which includes 0 families.
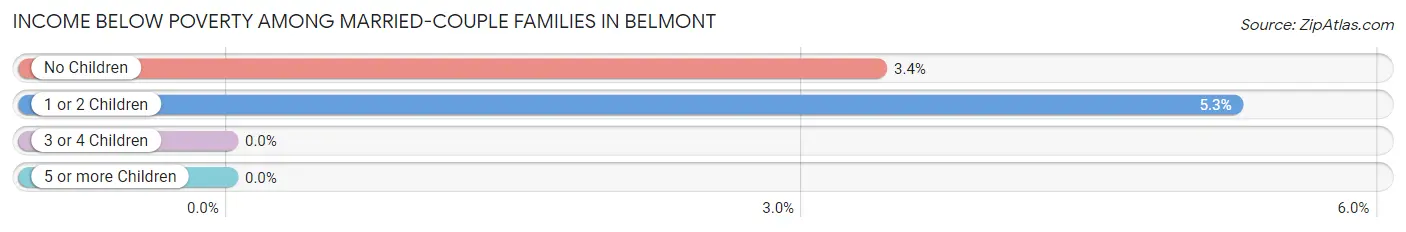
| Children | Above Poverty | Below Poverty |
| No Children | 3,047 (96.6%) | 107 (3.4%) |
| 1 or 2 Children | 2,925 (94.8%) | 162 (5.2%) |
| 3 or 4 Children | 259 (100.0%) | 0 (0.0%) |
| 5 or more Children | 0 (0.0%) | 0 (0.0%) |
| Total | 6,231 (95.9%) | 269 (4.1%) |
Income Below Poverty Among Single-Parent Households in Belmont
According to the poverty data in Belmont, 17.3% or 49 single-father households and 9.1% or 50 single-mother households are living below the poverty line. Among single-father households, those with no children have the highest poverty rate, with 49 households (41.9%) experiencing poverty. Likewise, among single-mother households, those with 1 or 2 children have the highest poverty rate, with 43 households (12.0%) falling below the poverty line.
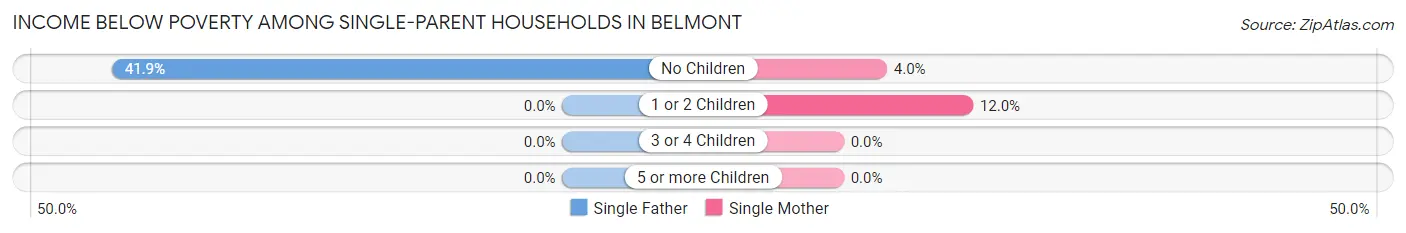
| Children | Single Father | Single Mother |
| No Children | 49 (41.9%) | 7 (4.0%) |
| 1 or 2 Children | 0 (0.0%) | 43 (12.0%) |
| 3 or 4 Children | 0 (0.0%) | 0 (0.0%) |
| 5 or more Children | 0 (0.0%) | 0 (0.0%) |
| Total | 49 (17.3%) | 50 (9.1%) |
Income Below Poverty Among Married-Couple vs Single-Parent Households in Belmont
The poverty data for Belmont shows that 269 of the married-couple family households (4.1%) and 99 of the single-parent households (11.9%) are living below the poverty level. Within the married-couple family households, those with 1 or 2 children have the highest poverty rate, with 162 households (5.2%) falling below the poverty line. Among the single-parent households, those with no children have the highest poverty rate, with 56 household (19.2%) living below poverty.
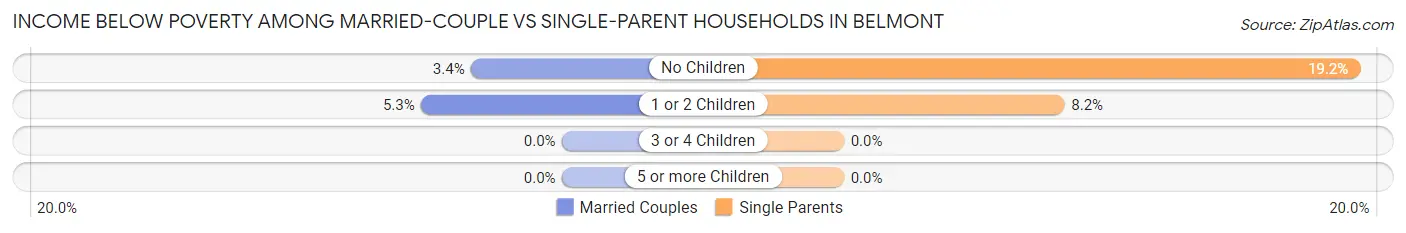
| Children | Married-Couple Families | Single-Parent Households |
| No Children | 107 (3.4%) | 56 (19.2%) |
| 1 or 2 Children | 162 (5.2%) | 43 (8.2%) |
| 3 or 4 Children | 0 (0.0%) | 0 (0.0%) |
| 5 or more Children | 0 (0.0%) | 0 (0.0%) |
| Total | 269 (4.1%) | 99 (11.9%) |
Race in Belmont
The most populous races in Belmont are White / Caucasian (14,692 | 52.8%), Asian (8,145 | 29.3%), and Hispanic or Latino (3,849 | 13.8%).
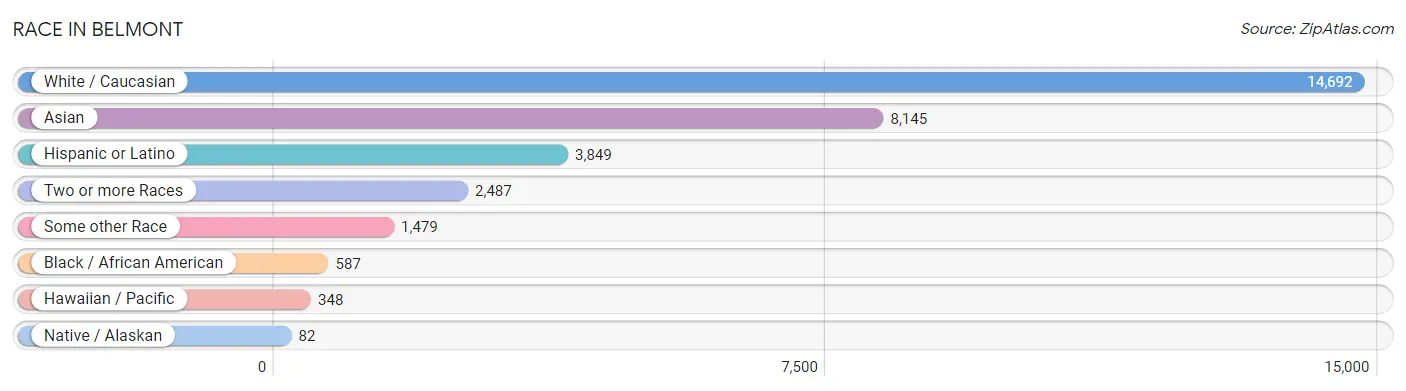
| Race | # Population | % Population |
| Asian | 8,145 | 29.3% |
| Black / African American | 587 | 2.1% |
| Hawaiian / Pacific | 348 | 1.3% |
| Hispanic or Latino | 3,849 | 13.8% |
| Native / Alaskan | 82 | 0.3% |
| White / Caucasian | 14,692 | 52.8% |
| Two or more Races | 2,487 | 8.9% |
| Some other Race | 1,479 | 5.3% |
| Total | 27,820 | 100.0% |
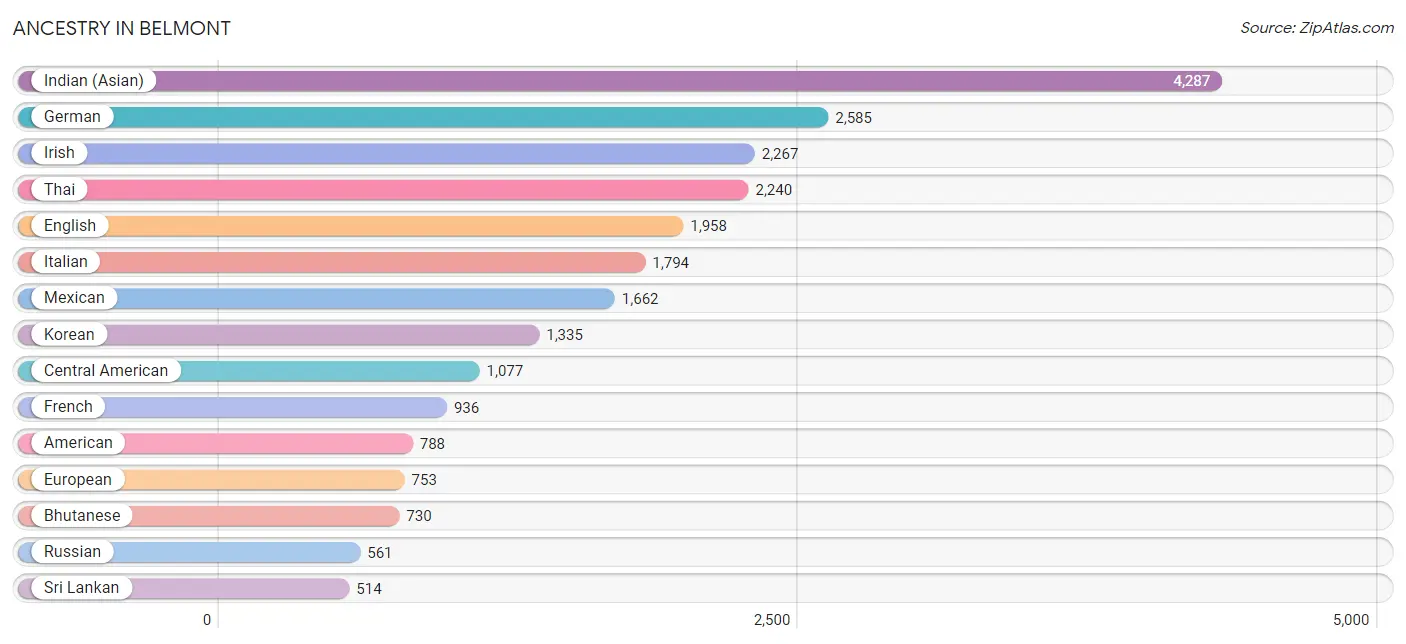
Ancestry in Belmont
The most populous ancestries reported in Belmont are Indian (Asian) (4,287 | 15.4%), German (2,585 | 9.3%), Irish (2,267 | 8.2%), Thai (2,240 | 8.1%), and English (1,958 | 7.0%), together accounting for 47.9% of all Belmont residents.
| Ancestry | # Population | % Population |
| American | 788 | 2.8% |
| Apache | 25 | 0.1% |
| Arab | 336 | 1.2% |
| Argentinean | 109 | 0.4% |
| Armenian | 78 | 0.3% |
| Assyrian / Chaldean / Syriac | 29 | 0.1% |
| Australian | 14 | 0.1% |
| Austrian | 139 | 0.5% |
| Belgian | 6 | 0.0% |
| Bhutanese | 730 | 2.6% |
| Brazilian | 219 | 0.8% |
| British | 194 | 0.7% |
| Bulgarian | 60 | 0.2% |
| Burmese | 457 | 1.6% |
| Canadian | 91 | 0.3% |
| Celtic | 19 | 0.1% |
| Central American | 1,077 | 3.9% |
| Central American Indian | 20 | 0.1% |
| Cherokee | 36 | 0.1% |
| Chilean | 49 | 0.2% |
| Colombian | 66 | 0.2% |
| Croatian | 54 | 0.2% |
| Cuban | 85 | 0.3% |
| Czech | 56 | 0.2% |
| Danish | 176 | 0.6% |
| Dutch | 389 | 1.4% |
| Eastern European | 278 | 1.0% |
| Egyptian | 98 | 0.4% |
| English | 1,958 | 7.0% |
| Ethiopian | 14 | 0.1% |
| European | 753 | 2.7% |
| Filipino | 78 | 0.3% |
| Finnish | 17 | 0.1% |
| French | 936 | 3.4% |
| French American Indian | 14 | 0.1% |
| French Canadian | 48 | 0.2% |
| German | 2,585 | 9.3% |
| Greek | 256 | 0.9% |
| Guamanian / Chamorro | 86 | 0.3% |
| Guatemalan | 148 | 0.5% |
| Honduran | 11 | 0.0% |
| Hungarian | 85 | 0.3% |
| Indian (Asian) | 4,287 | 15.4% |
| Iranian | 375 | 1.3% |
| Irish | 2,267 | 8.2% |
| Israeli | 14 | 0.1% |
| Italian | 1,794 | 6.5% |
| Japanese | 10 | 0.0% |
| Jordanian | 44 | 0.2% |
| Korean | 1,335 | 4.8% |
| Laotian | 26 | 0.1% |
| Latvian | 40 | 0.1% |
| Lebanese | 57 | 0.2% |
| Lithuanian | 23 | 0.1% |
| Malaysian | 10 | 0.0% |
| Maltese | 24 | 0.1% |
| Mexican | 1,662 | 6.0% |
| Mexican American Indian | 37 | 0.1% |
| Mongolian | 8 | 0.0% |
| Moroccan | 6 | 0.0% |
| Native Hawaiian | 48 | 0.2% |
| New Zealander | 5 | 0.0% |
| Nicaraguan | 427 | 1.5% |
| Northern European | 204 | 0.7% |
| Norwegian | 154 | 0.5% |
| Ottawa | 39 | 0.1% |
| Pakistani | 148 | 0.5% |
| Panamanian | 53 | 0.2% |
| Peruvian | 166 | 0.6% |
| Polish | 209 | 0.7% |
| Portuguese | 249 | 0.9% |
| Pueblo | 19 | 0.1% |
| Puerto Rican | 133 | 0.5% |
| Romanian | 34 | 0.1% |
| Russian | 561 | 2.0% |
| Salvadoran | 438 | 1.6% |
| Samoan | 82 | 0.3% |
| Scandinavian | 224 | 0.8% |
| Scotch-Irish | 142 | 0.5% |
| Scottish | 290 | 1.0% |
| Slovak | 25 | 0.1% |
| Slovene | 26 | 0.1% |
| South American | 456 | 1.6% |
| Spaniard | 193 | 0.7% |
| Spanish | 49 | 0.2% |
| Sri Lankan | 514 | 1.8% |
| Subsaharan African | 33 | 0.1% |
| Swedish | 324 | 1.2% |
| Swiss | 98 | 0.4% |
| Syrian | 64 | 0.2% |
| Thai | 2,240 | 8.1% |
| Tongan | 291 | 1.1% |
| Turkish | 96 | 0.4% |
| Ukrainian | 167 | 0.6% |
| Uruguayan | 33 | 0.1% |
| Venezuelan | 23 | 0.1% |
| Welsh | 155 | 0.6% |
| Yuman | 15 | 0.1% | View All 98 Rows |
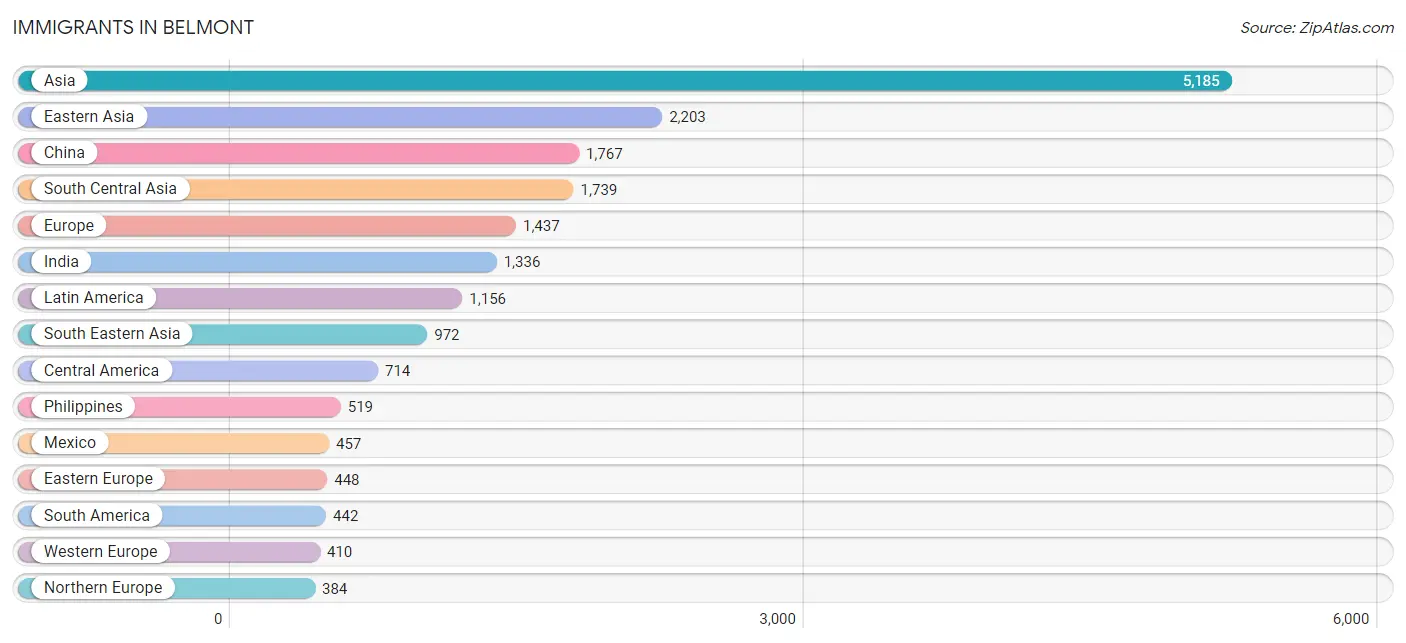
Immigrants in Belmont
The most numerous immigrant groups reported in Belmont came from Asia (5,185 | 18.6%), Eastern Asia (2,203 | 7.9%), China (1,767 | 6.4%), South Central Asia (1,739 | 6.2%), and Europe (1,437 | 5.2%), together accounting for 44.3% of all Belmont residents.
| Immigration Origin | # Population | % Population |
| Africa | 153 | 0.5% |
| Argentina | 33 | 0.1% |
| Asia | 5,185 | 18.6% |
| Australia | 42 | 0.2% |
| Brazil | 247 | 0.9% |
| Bulgaria | 55 | 0.2% |
| Cambodia | 12 | 0.0% |
| Canada | 185 | 0.7% |
| Central America | 714 | 2.6% |
| China | 1,767 | 6.4% |
| Colombia | 3 | 0.0% |
| Czechoslovakia | 18 | 0.1% |
| Denmark | 62 | 0.2% |
| Eastern Africa | 33 | 0.1% |
| Eastern Asia | 2,203 | 7.9% |
| Eastern Europe | 448 | 1.6% |
| Egypt | 79 | 0.3% |
| El Salvador | 178 | 0.6% |
| England | 108 | 0.4% |
| Europe | 1,437 | 5.2% |
| France | 156 | 0.6% |
| Germany | 163 | 0.6% |
| Greece | 16 | 0.1% |
| Guatemala | 14 | 0.1% |
| Guyana | 32 | 0.1% |
| Honduras | 11 | 0.0% |
| Hong Kong | 335 | 1.2% |
| Hungary | 13 | 0.1% |
| India | 1,336 | 4.8% |
| Indonesia | 33 | 0.1% |
| Iran | 285 | 1.0% |
| Iraq | 25 | 0.1% |
| Ireland | 19 | 0.1% |
| Israel | 16 | 0.1% |
| Italy | 157 | 0.6% |
| Japan | 150 | 0.5% |
| Jordan | 82 | 0.3% |
| Korea | 286 | 1.0% |
| Latin America | 1,156 | 4.2% |
| Latvia | 11 | 0.0% |
| Lebanon | 22 | 0.1% |
| Malaysia | 31 | 0.1% |
| Mexico | 457 | 1.6% |
| Morocco | 6 | 0.0% |
| Nepal | 95 | 0.3% |
| Netherlands | 32 | 0.1% |
| Nicaragua | 42 | 0.2% |
| Northern Africa | 106 | 0.4% |
| Northern Europe | 384 | 1.4% |
| Oceania | 157 | 0.6% |
| Panama | 12 | 0.0% |
| Peru | 71 | 0.3% |
| Philippines | 519 | 1.9% |
| Poland | 13 | 0.1% |
| Portugal | 22 | 0.1% |
| Romania | 49 | 0.2% |
| Russia | 101 | 0.4% |
| Saudi Arabia | 7 | 0.0% |
| Singapore | 11 | 0.0% |
| South Africa | 14 | 0.1% |
| South America | 442 | 1.6% |
| South Central Asia | 1,739 | 6.2% |
| South Eastern Asia | 972 | 3.5% |
| Southern Europe | 195 | 0.7% |
| Sri Lanka | 14 | 0.1% |
| Sweden | 109 | 0.4% |
| Switzerland | 42 | 0.2% |
| Taiwan | 278 | 1.0% |
| Thailand | 78 | 0.3% |
| Turkey | 64 | 0.2% |
| Ukraine | 66 | 0.2% |
| Uruguay | 33 | 0.1% |
| Uzbekistan | 9 | 0.0% |
| Venezuela | 23 | 0.1% |
| Vietnam | 288 | 1.0% |
| Western Asia | 271 | 1.0% |
| Western Europe | 410 | 1.5% | View All 77 Rows |
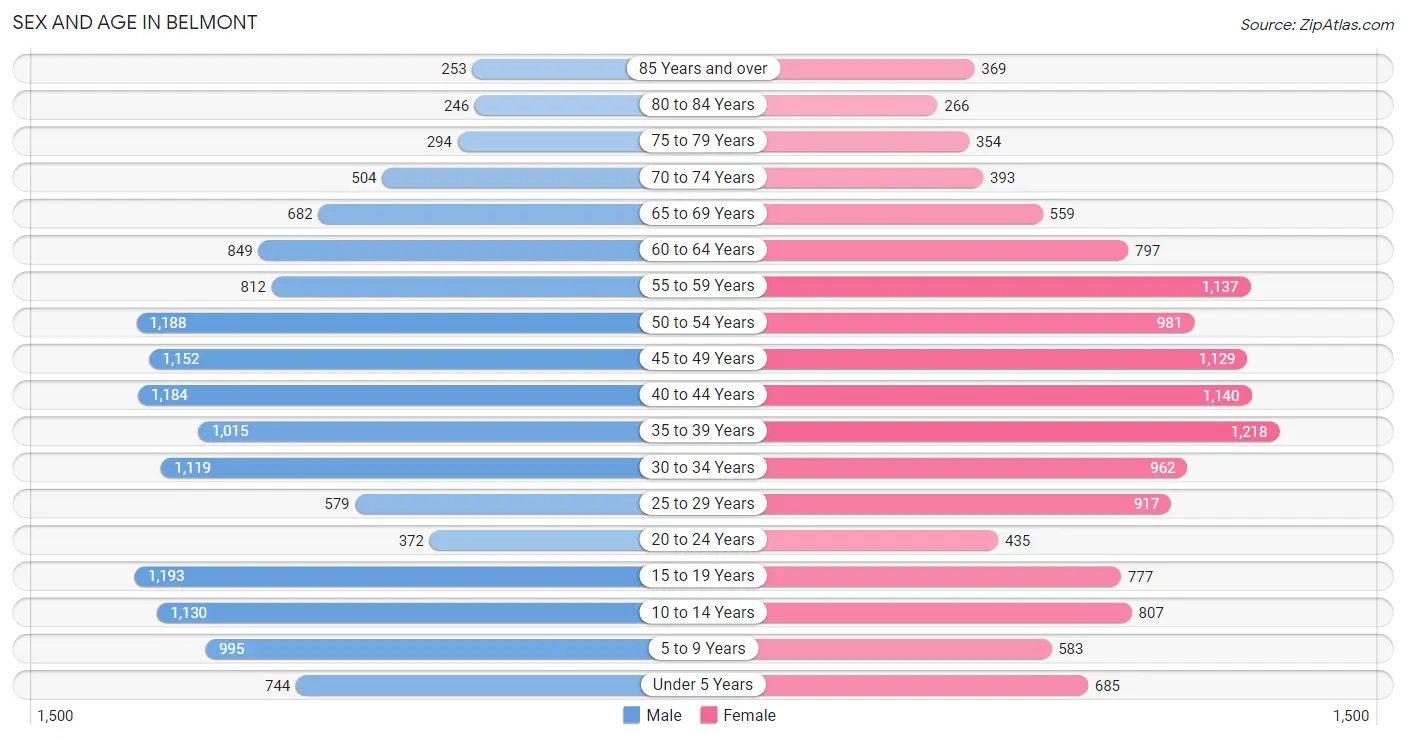
Sex and Age in Belmont
Sex and Age in Belmont
The most populous age groups in Belmont are 15 to 19 Years (1,193 | 8.3%) for men and 35 to 39 Years (1,218 | 9.0%) for women.
| Age Bracket | Male | Female |
| Under 5 Years | 744 (5.2%) | 685 (5.1%) |
| 5 to 9 Years | 995 (7.0%) | 583 (4.3%) |
| 10 to 14 Years | 1,130 (7.9%) | 807 (6.0%) |
| 15 to 19 Years | 1,193 (8.3%) | 777 (5.8%) |
| 20 to 24 Years | 372 (2.6%) | 435 (3.2%) |
| 25 to 29 Years | 579 (4.1%) | 917 (6.8%) |
| 30 to 34 Years | 1,119 (7.8%) | 962 (7.1%) |
| 35 to 39 Years | 1,015 (7.1%) | 1,218 (9.0%) |
| 40 to 44 Years | 1,184 (8.3%) | 1,140 (8.4%) |
| 45 to 49 Years | 1,152 (8.1%) | 1,129 (8.4%) |
| 50 to 54 Years | 1,188 (8.3%) | 981 (7.3%) |
| 55 to 59 Years | 812 (5.7%) | 1,137 (8.4%) |
| 60 to 64 Years | 849 (5.9%) | 797 (5.9%) |
| 65 to 69 Years | 682 (4.8%) | 559 (4.1%) |
| 70 to 74 Years | 504 (3.5%) | 393 (2.9%) |
| 75 to 79 Years | 294 (2.1%) | 354 (2.6%) |
| 80 to 84 Years | 246 (1.7%) | 266 (2.0%) |
| 85 Years and over | 253 (1.8%) | 369 (2.7%) |
| Total | 14,311 (100.0%) | 13,509 (100.0%) |
Families and Households in Belmont
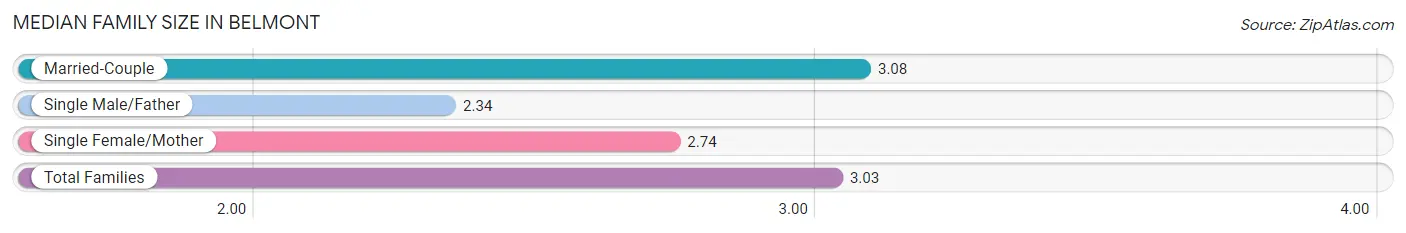
Median Family Size in Belmont
The median family size in Belmont is 3.03 persons per family, with married-couple families (6,500 | 88.6%) accounting for the largest median family size of 3.08 persons per family. On the other hand, single male/father families (283 | 3.9%) represent the smallest median family size with 2.34 persons per family.
| Family Type | # Families | Family Size |
| Married-Couple | 6,500 (88.6%) | 3.08 |
| Single Male/Father | 283 (3.9%) | 2.34 |
| Single Female/Mother | 551 (7.5%) | 2.74 |
| Total Families | 7,334 (100.0%) | 3.03 |
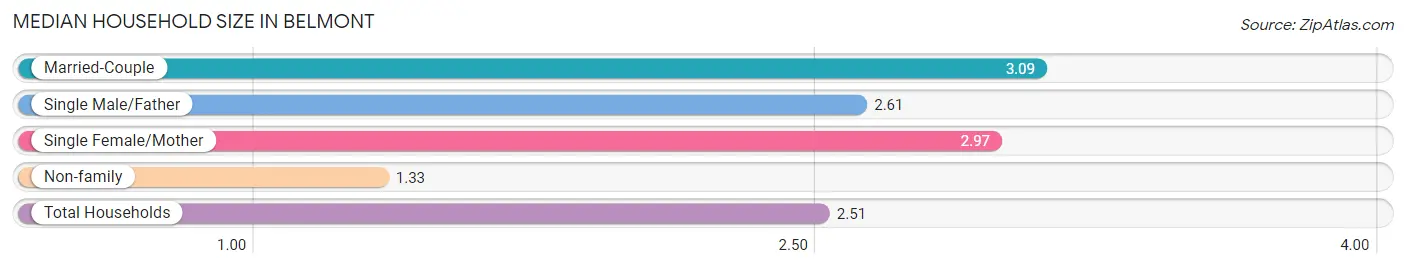
Median Household Size in Belmont
The median household size in Belmont is 2.51 persons per household, with married-couple households (6,500 | 60.1%) accounting for the largest median household size of 3.09 persons per household. non-family households (3,477 | 32.2%) represent the smallest median household size with 1.33 persons per household.
| Household Type | # Households | Household Size |
| Married-Couple | 6,500 (60.1%) | 3.09 |
| Single Male/Father | 283 (2.6%) | 2.61 |
| Single Female/Mother | 551 (5.1%) | 2.97 |
| Non-family | 3,477 (32.2%) | 1.33 |
| Total Households | 10,811 (100.0%) | 2.51 |
Household Size by Marriage Status in Belmont
Out of a total of 10,811 households in Belmont, 7,334 (67.8%) are family households, while 3,477 (32.2%) are nonfamily households. The most numerous type of family households are 2-person households, comprising 2,935, and the most common type of nonfamily households are 1-person households, comprising 2,558.
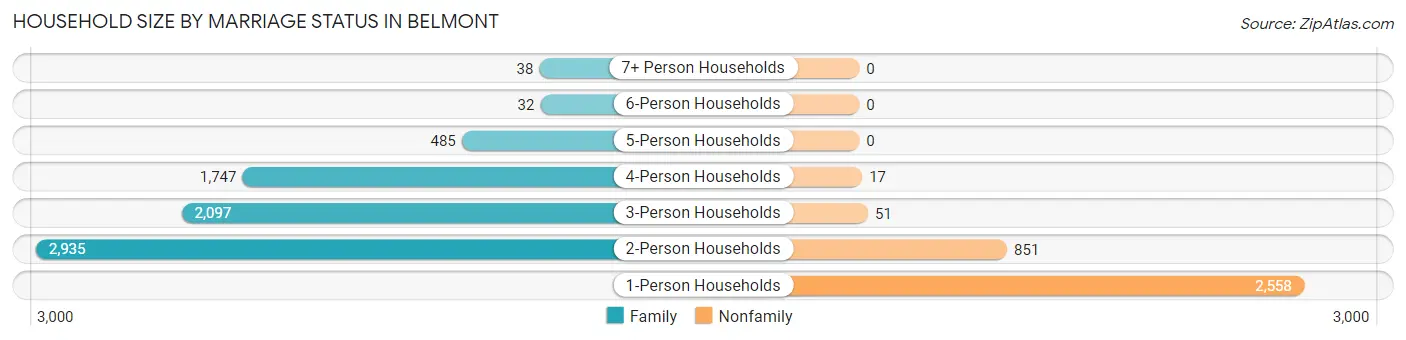
| Household Size | Family Households | Nonfamily Households |
| 1-Person Households | - | 2,558 (23.7%) |
| 2-Person Households | 2,935 (27.2%) | 851 (7.9%) |
| 3-Person Households | 2,097 (19.4%) | 51 (0.5%) |
| 4-Person Households | 1,747 (16.2%) | 17 (0.2%) |
| 5-Person Households | 485 (4.5%) | 0 (0.0%) |
| 6-Person Households | 32 (0.3%) | 0 (0.0%) |
| 7+ Person Households | 38 (0.4%) | 0 (0.0%) |
| Total | 7,334 (67.8%) | 3,477 (32.2%) |
Female Fertility in Belmont
Fertility by Age in Belmont
Average fertility rate in Belmont is 66.0 births per 1,000 women. Women in the age bracket of 20 to 34 years have the highest fertility rate with 82.0 births per 1,000 women. Women in the age bracket of 35 to 50 years acount for 57.5% of all women with births.
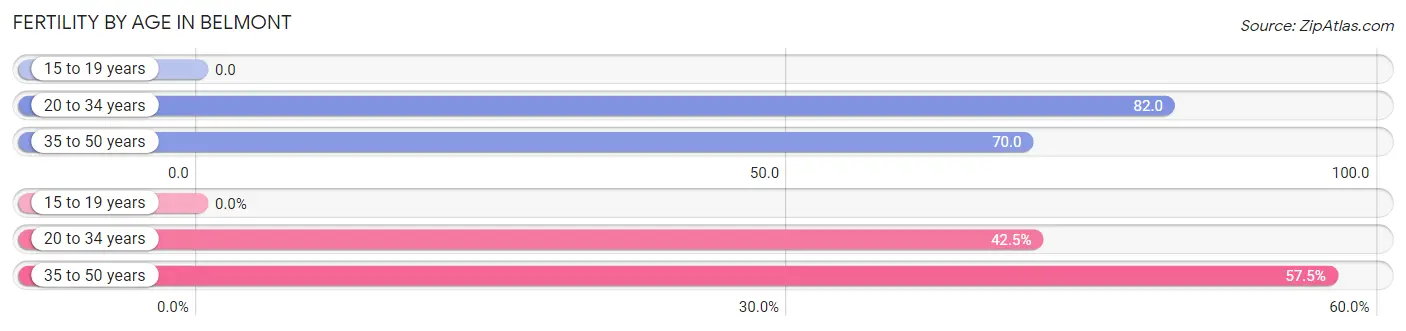
| Age Bracket | Women with Births | Births / 1,000 Women |
| 15 to 19 years | 0 (0.0%) | 0.0 |
| 20 to 34 years | 190 (42.5%) | 82.0 |
| 35 to 50 years | 257 (57.5%) | 70.0 |
| Total | 447 (100.0%) | 66.0 |
Fertility by Age by Marriage Status in Belmont
87.5% of women with births (447) in Belmont are married. The highest percentage of unmarried women with births falls into 35 to 50 years age bracket with 21.8% of them unmarried at the time of birth, while the lowest percentage of unmarried women with births belong to 20 to 34 years age bracket with 0.0% of them unmarried.
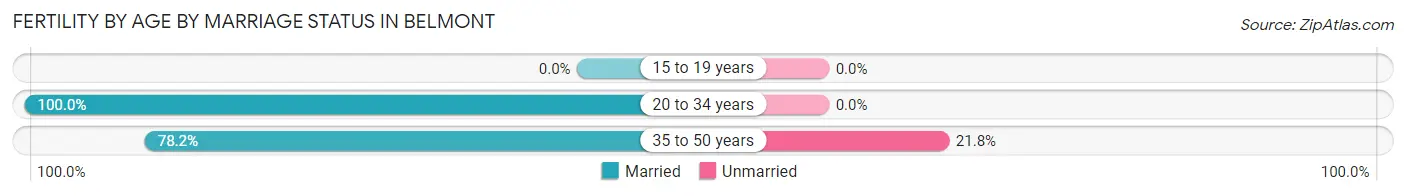
| Age Bracket | Married | Unmarried |
| 15 to 19 years | 0 (0.0%) | 0 (0.0%) |
| 20 to 34 years | 190 (100.0%) | 0 (0.0%) |
| 35 to 50 years | 201 (78.2%) | 56 (21.8%) |
| Total | 391 (87.5%) | 56 (12.5%) |
Fertility by Education in Belmont
Average fertility rate in Belmont is 66.0 births per 1,000 women. Women with the education attainment of bachelor's degree have the highest fertility rate of 105.0 births per 1,000 women, while women with the education attainment of less than high school have the lowest fertility at 28.0 births per 1,000 women. Women with the education attainment of bachelor's degree represent 57.7% of all women with births.
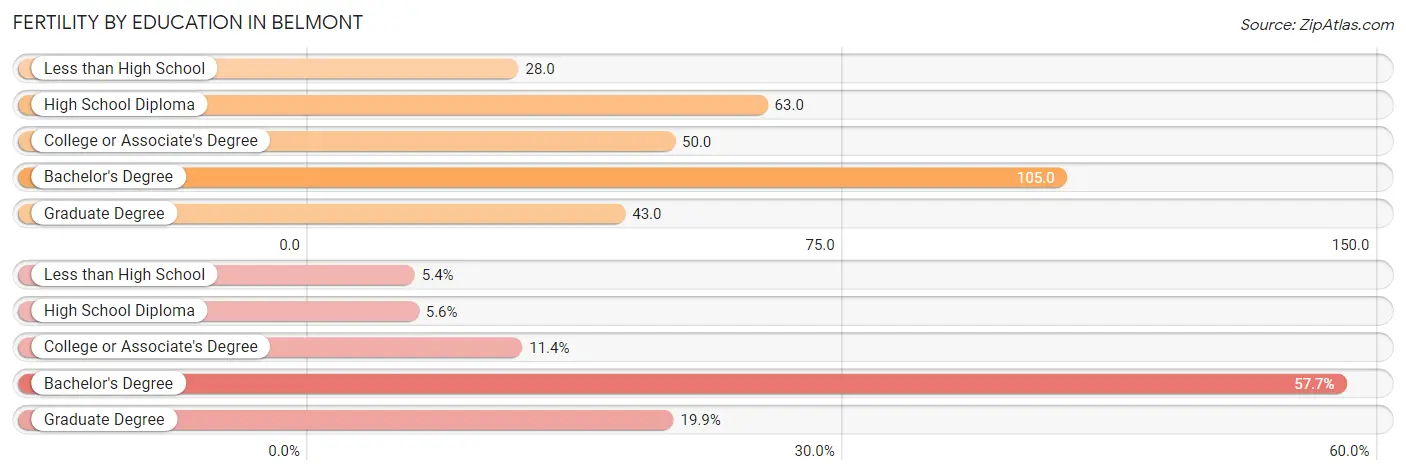
| Educational Attainment | Women with Births | Births / 1,000 Women |
| Less than High School | 24 (5.4%) | 28.0 |
| High School Diploma | 25 (5.6%) | 63.0 |
| College or Associate's Degree | 51 (11.4%) | 50.0 |
| Bachelor's Degree | 258 (57.7%) | 105.0 |
| Graduate Degree | 89 (19.9%) | 43.0 |
| Total | 447 (100.0%) | 66.0 |
Fertility by Education by Marriage Status in Belmont
12.5% of women with births in Belmont are unmarried. Women with the educational attainment of less than high school are most likely to be married with 100.0% of them married at childbirth, while women with the educational attainment of college or associate's degree are least likely to be married with 58.8% of them unmarried at childbirth.
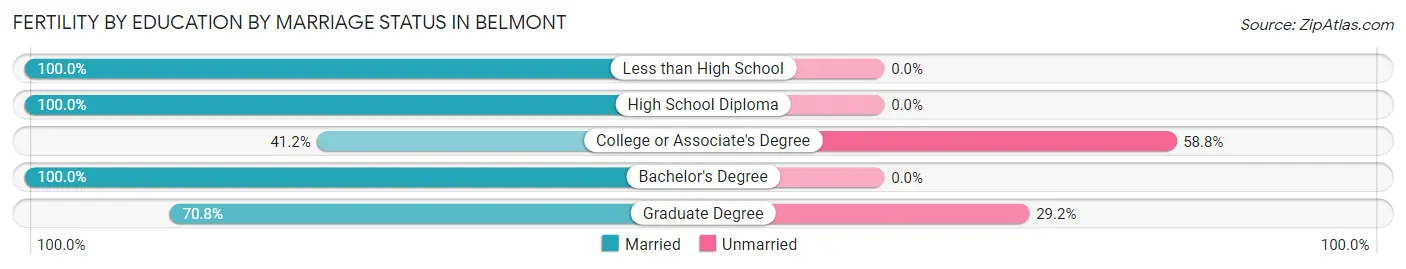
| Educational Attainment | Married | Unmarried |
| Less than High School | 24 (100.0%) | 0 (0.0%) |
| High School Diploma | 25 (100.0%) | 0 (0.0%) |
| College or Associate's Degree | 21 (41.2%) | 30 (58.8%) |
| Bachelor's Degree | 258 (100.0%) | 0 (0.0%) |
| Graduate Degree | 63 (70.8%) | 26 (29.2%) |
| Total | 391 (87.5%) | 56 (12.5%) |
Employment Characteristics in Belmont
Employment by Class of Employer in Belmont
Among the 14,294 employed individuals in Belmont, private company employees (10,792 | 75.5%), local government employees (1,159 | 8.1%), and not-for-profit organizations (981 | 6.9%) make up the most common classes of employment.
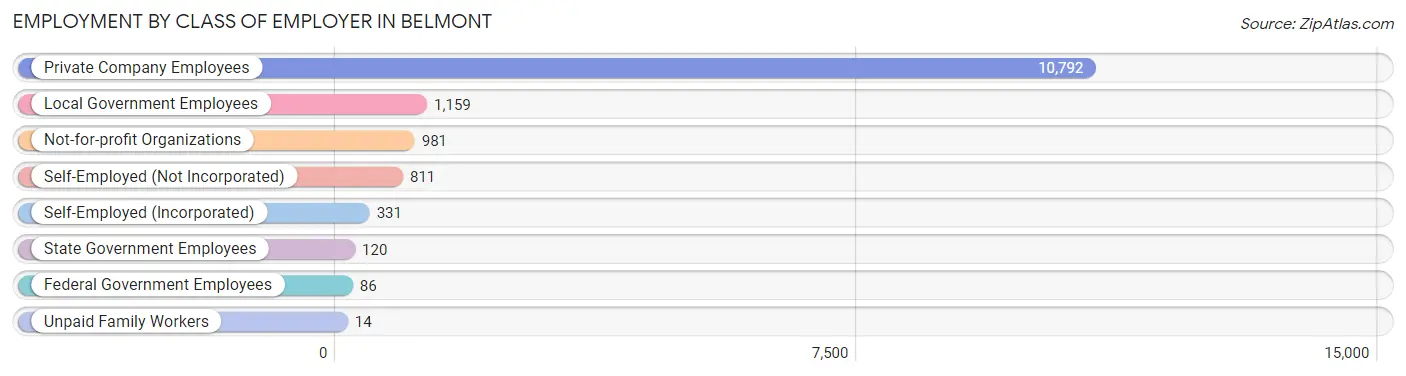
| Employer Class | # Employees | % Employees |
| Private Company Employees | 10,792 | 75.5% |
| Self-Employed (Incorporated) | 331 | 2.3% |
| Self-Employed (Not Incorporated) | 811 | 5.7% |
| Not-for-profit Organizations | 981 | 6.9% |
| Local Government Employees | 1,159 | 8.1% |
| State Government Employees | 120 | 0.8% |
| Federal Government Employees | 86 | 0.6% |
| Unpaid Family Workers | 14 | 0.1% |
| Total | 14,294 | 100.0% |
Employment Status by Age in Belmont
According to the labor force statistics for Belmont, out of the total population over 16 years of age (22,415), 69.8% or 15,646 individuals are in the labor force, with 6.5% or 1,017 of them unemployed. The age group with the highest labor force participation rate is 35 to 44 years, with 90.7% or 4,133 individuals in the labor force. Within the labor force, the 16 to 19 years age range has the highest percentage of unemployed individuals, with 19.9% or 87 of them being unemployed.
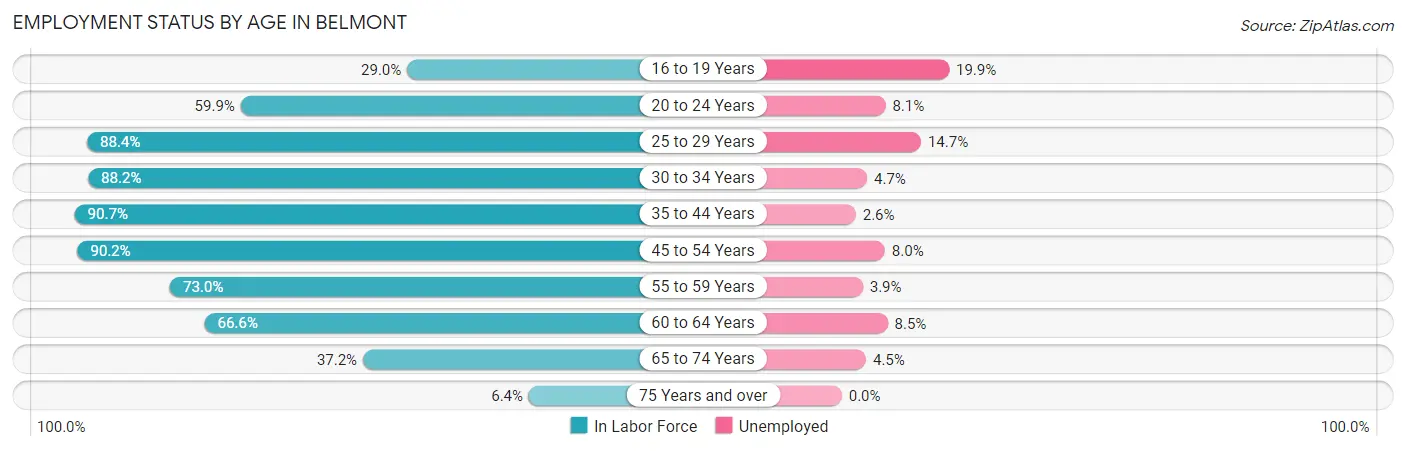
| Age Bracket | In Labor Force | Unemployed |
| 16 to 19 Years | 438 (29.0%) | 87 (19.9%) |
| 20 to 24 Years | 483 (59.9%) | 39 (8.1%) |
| 25 to 29 Years | 1,322 (88.4%) | 194 (14.7%) |
| 30 to 34 Years | 1,835 (88.2%) | 86 (4.7%) |
| 35 to 44 Years | 4,133 (90.7%) | 107 (2.6%) |
| 45 to 54 Years | 4,014 (90.2%) | 321 (8.0%) |
| 55 to 59 Years | 1,423 (73.0%) | 55 (3.9%) |
| 60 to 64 Years | 1,096 (66.6%) | 93 (8.5%) |
| 65 to 74 Years | 795 (37.2%) | 36 (4.5%) |
| 75 Years and over | 114 (6.4%) | 0 (0.0%) |
| Total | 15,646 (69.8%) | 1,017 (6.5%) |
Employment Status by Educational Attainment in Belmont
According to labor force statistics for Belmont, 85.5% of individuals (13,833) out of the total population between 25 and 64 years of age (16,179) are in the labor force, with 6.2% or 858 of them being unemployed. The group with the highest labor force participation rate are those with the educational attainment of bachelor's degree or higher, with 88.9% or 10,578 individuals in the labor force. Within the labor force, individuals with college / associate degree education have the highest percentage of unemployment, with 14.0% or 302 of them being unemployed.
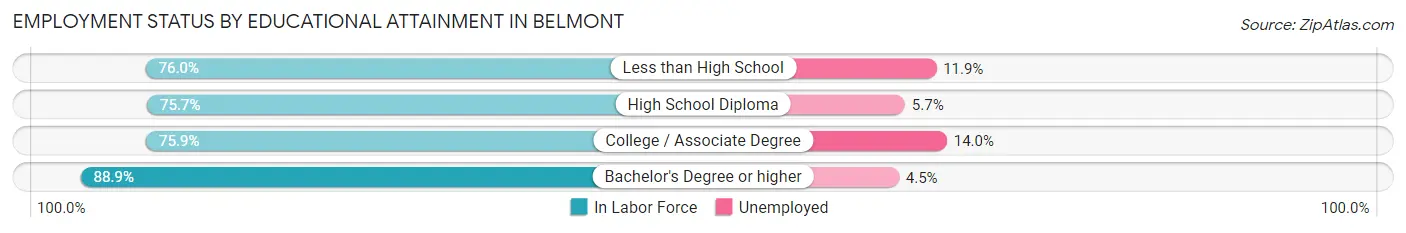
| Educational Attainment | In Labor Force | Unemployed |
| Less than High School | 352 (76.0%) | 55 (11.9%) |
| High School Diploma | 740 (75.7%) | 56 (5.7%) |
| College / Associate Degree | 2,155 (75.9%) | 397 (14.0%) |
| Bachelor's Degree or higher | 10,578 (88.9%) | 535 (4.5%) |
| Total | 13,833 (85.5%) | 1,003 (6.2%) |
Employment Occupations by Sex in Belmont
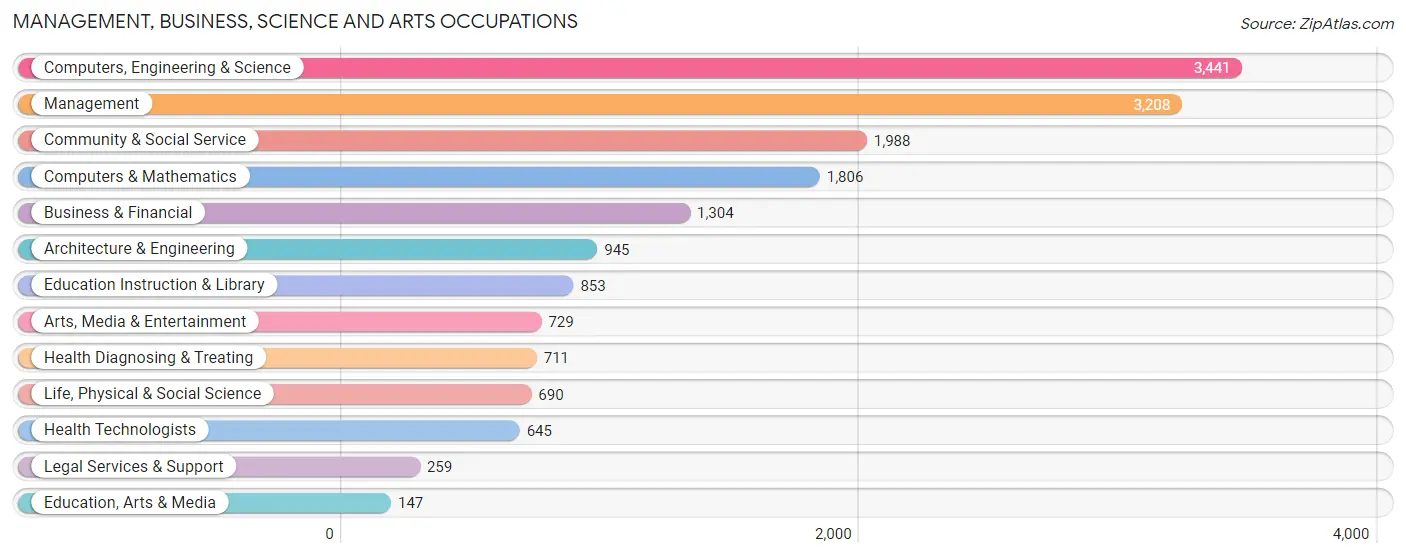
Management, Business, Science and Arts Occupations
The most common Management, Business, Science and Arts occupations in Belmont are Computers, Engineering & Science (3,441 | 23.5%), Management (3,208 | 21.9%), Community & Social Service (1,988 | 13.6%), Computers & Mathematics (1,806 | 12.3%), and Business & Financial (1,304 | 8.9%).
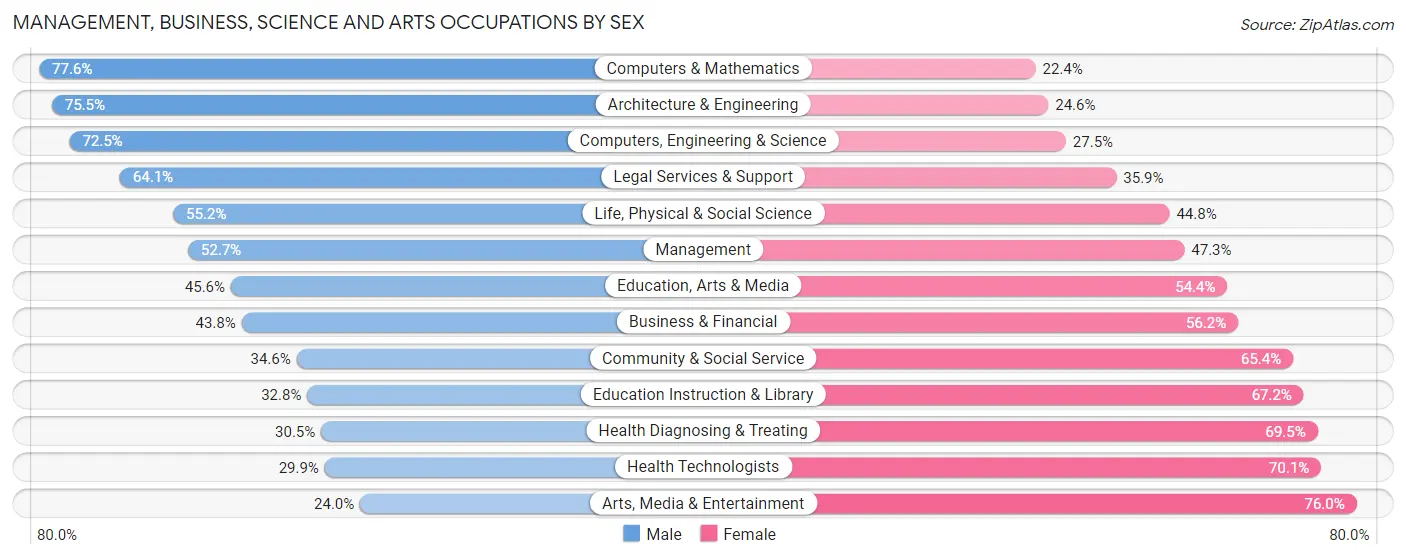
Management, Business, Science and Arts Occupations by Sex
Within the Management, Business, Science and Arts occupations in Belmont, the most male-oriented occupations are Computers & Mathematics (77.6%), Architecture & Engineering (75.4%), and Computers, Engineering & Science (72.5%), while the most female-oriented occupations are Arts, Media & Entertainment (76.0%), Health Technologists (70.1%), and Health Diagnosing & Treating (69.5%).
| Occupation | Male | Female |
| Management | 1,692 (52.7%) | 1,516 (47.3%) |
| Business & Financial | 571 (43.8%) | 733 (56.2%) |
| Computers, Engineering & Science | 2,495 (72.5%) | 946 (27.5%) |
| Computers & Mathematics | 1,401 (77.6%) | 405 (22.4%) |
| Architecture & Engineering | 713 (75.4%) | 232 (24.5%) |
| Life, Physical & Social Science | 381 (55.2%) | 309 (44.8%) |
| Community & Social Service | 688 (34.6%) | 1,300 (65.4%) |
| Education, Arts & Media | 67 (45.6%) | 80 (54.4%) |
| Legal Services & Support | 166 (64.1%) | 93 (35.9%) |
| Education Instruction & Library | 280 (32.8%) | 573 (67.2%) |
| Arts, Media & Entertainment | 175 (24.0%) | 554 (76.0%) |
| Health Diagnosing & Treating | 217 (30.5%) | 494 (69.5%) |
| Health Technologists | 193 (29.9%) | 452 (70.1%) |
| Total (Category) | 5,663 (53.2%) | 4,989 (46.8%) |
| Total (Overall) | 7,634 (52.2%) | 7,000 (47.8%) |
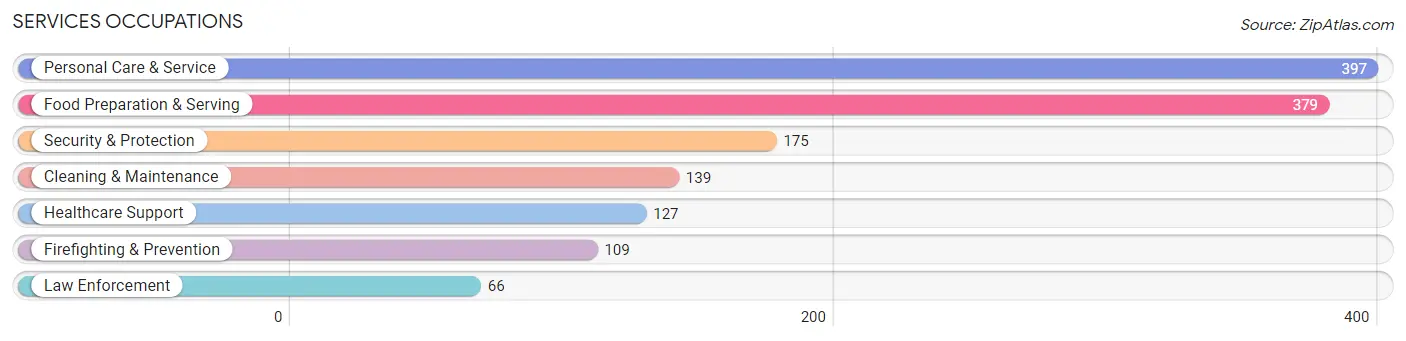
Services Occupations
The most common Services occupations in Belmont are Personal Care & Service (397 | 2.7%), Food Preparation & Serving (379 | 2.6%), Security & Protection (175 | 1.2%), Cleaning & Maintenance (139 | 0.9%), and Healthcare Support (127 | 0.9%).
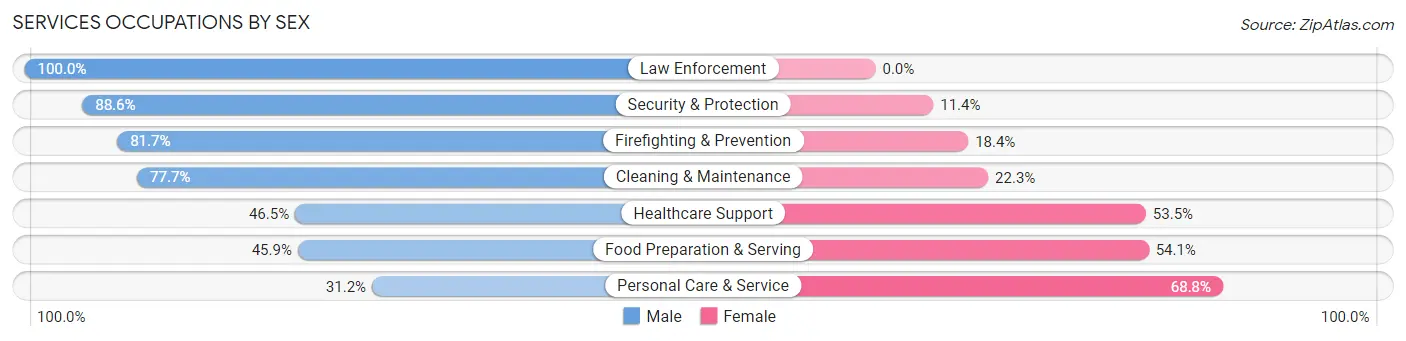
Services Occupations by Sex
Within the Services occupations in Belmont, the most male-oriented occupations are Law Enforcement (100.0%), Security & Protection (88.6%), and Firefighting & Prevention (81.7%), while the most female-oriented occupations are Personal Care & Service (68.8%), Food Preparation & Serving (54.1%), and Healthcare Support (53.5%).
| Occupation | Male | Female |
| Healthcare Support | 59 (46.5%) | 68 (53.5%) |
| Security & Protection | 155 (88.6%) | 20 (11.4%) |
| Firefighting & Prevention | 89 (81.7%) | 20 (18.3%) |
| Law Enforcement | 66 (100.0%) | 0 (0.0%) |
| Food Preparation & Serving | 174 (45.9%) | 205 (54.1%) |
| Cleaning & Maintenance | 108 (77.7%) | 31 (22.3%) |
| Personal Care & Service | 124 (31.2%) | 273 (68.8%) |
| Total (Category) | 620 (50.9%) | 597 (49.1%) |
| Total (Overall) | 7,634 (52.2%) | 7,000 (47.8%) |
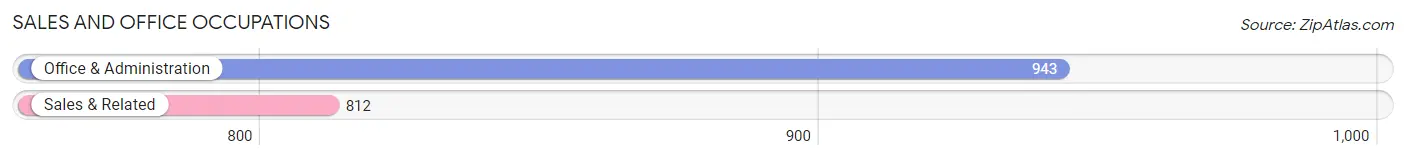
Sales and Office Occupations
The most common Sales and Office occupations in Belmont are Office & Administration (943 | 6.4%), and Sales & Related (812 | 5.6%).
Sales and Office Occupations by Sex

| Occupation | Male | Female |
| Sales & Related | 380 (46.8%) | 432 (53.2%) |
| Office & Administration | 186 (19.7%) | 757 (80.3%) |
| Total (Category) | 566 (32.3%) | 1,189 (67.7%) |
| Total (Overall) | 7,634 (52.2%) | 7,000 (47.8%) |
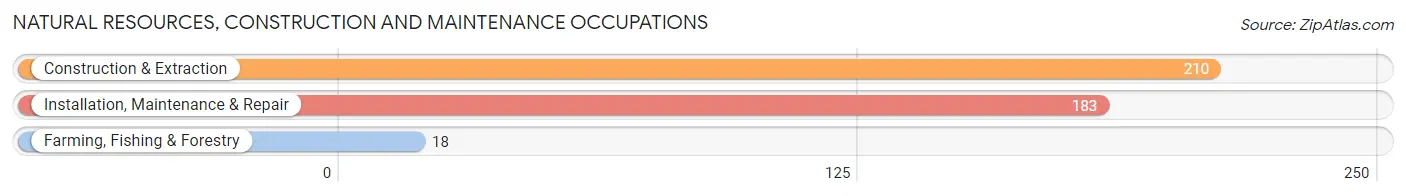
Natural Resources, Construction and Maintenance Occupations
The most common Natural Resources, Construction and Maintenance occupations in Belmont are Construction & Extraction (210 | 1.4%), Installation, Maintenance & Repair (183 | 1.3%), and Farming, Fishing & Forestry (18 | 0.1%).
Natural Resources, Construction and Maintenance Occupations by Sex
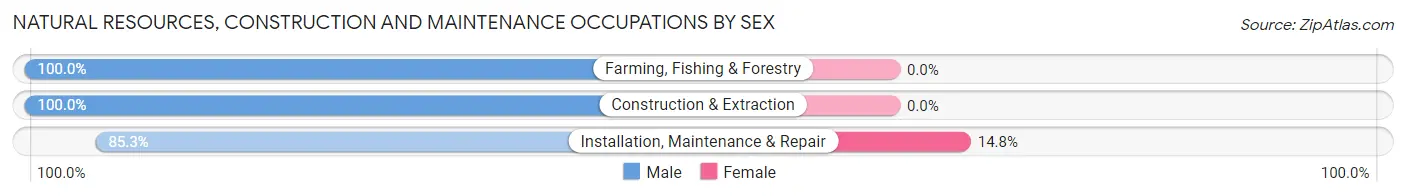
| Occupation | Male | Female |
| Farming, Fishing & Forestry | 18 (100.0%) | 0 (0.0%) |
| Construction & Extraction | 210 (100.0%) | 0 (0.0%) |
| Installation, Maintenance & Repair | 156 (85.3%) | 27 (14.7%) |
| Total (Category) | 384 (93.4%) | 27 (6.6%) |
| Total (Overall) | 7,634 (52.2%) | 7,000 (47.8%) |
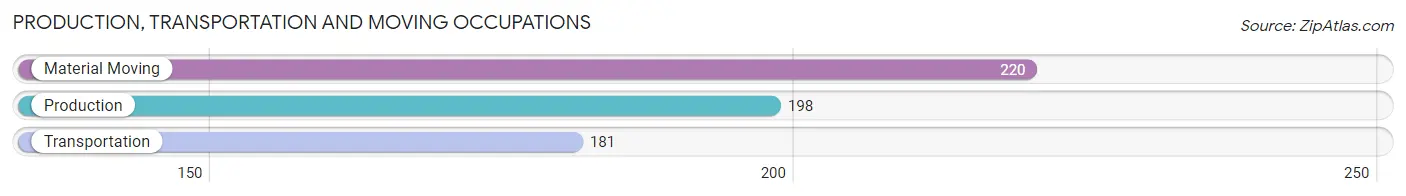
Production, Transportation and Moving Occupations
The most common Production, Transportation and Moving occupations in Belmont are Material Moving (220 | 1.5%), Production (198 | 1.3%), and Transportation (181 | 1.2%).
Production, Transportation and Moving Occupations by Sex
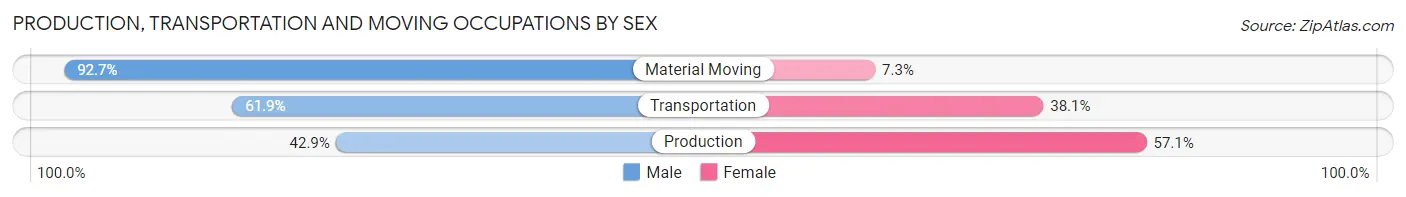
| Occupation | Male | Female |
| Production | 85 (42.9%) | 113 (57.1%) |
| Transportation | 112 (61.9%) | 69 (38.1%) |
| Material Moving | 204 (92.7%) | 16 (7.3%) |
| Total (Category) | 401 (66.9%) | 198 (33.1%) |
| Total (Overall) | 7,634 (52.2%) | 7,000 (47.8%) |
Employment Industries by Sex in Belmont
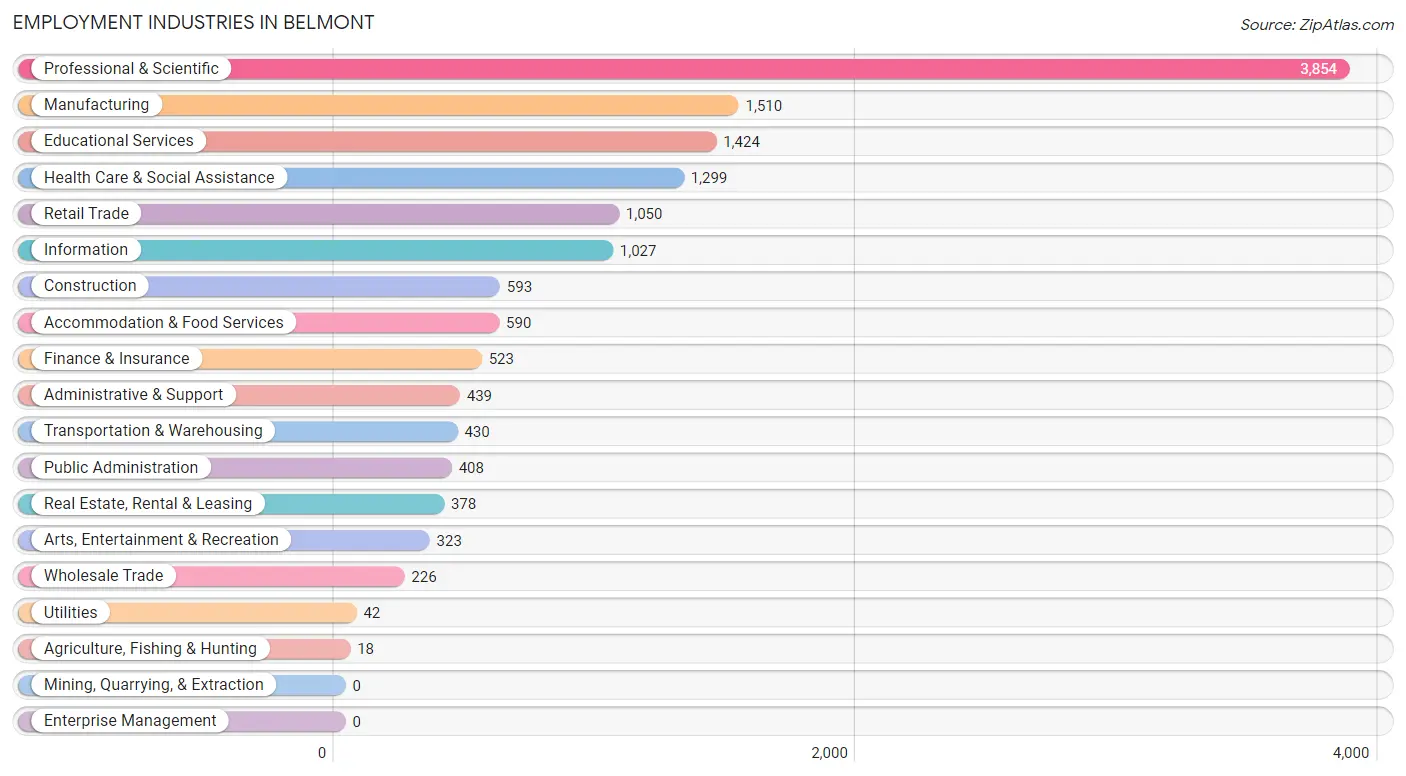
Employment Industries in Belmont
The major employment industries in Belmont include Professional & Scientific (3,854 | 26.3%), Manufacturing (1,510 | 10.3%), Educational Services (1,424 | 9.7%), Health Care & Social Assistance (1,299 | 8.9%), and Retail Trade (1,050 | 7.2%).
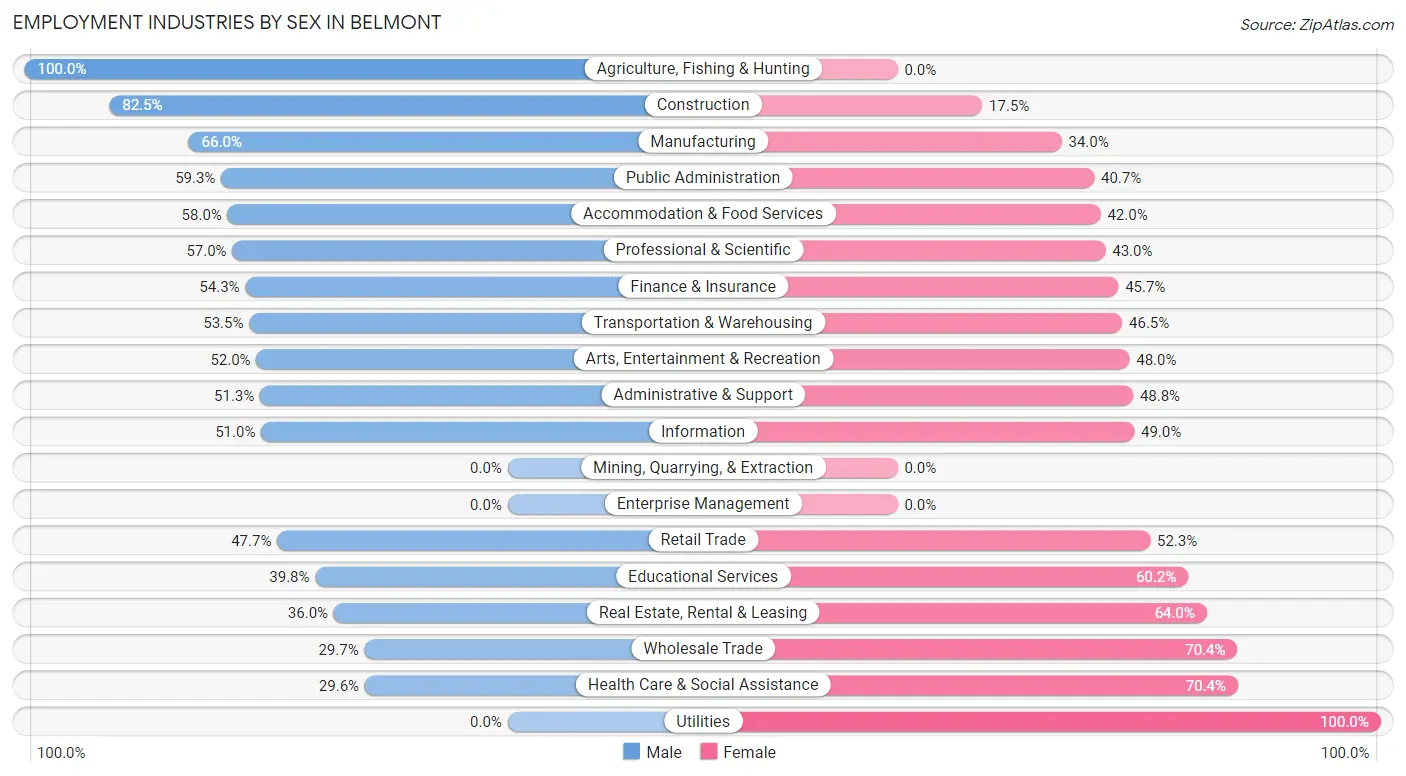
Employment Industries by Sex in Belmont
The Belmont industries that see more men than women are Agriculture, Fishing & Hunting (100.0%), Construction (82.5%), and Manufacturing (66.0%), whereas the industries that tend to have a higher number of women are Utilities (100.0%), Health Care & Social Assistance (70.4%), and Wholesale Trade (70.4%).
| Industry | Male | Female |
| Agriculture, Fishing & Hunting | 18 (100.0%) | 0 (0.0%) |
| Mining, Quarrying, & Extraction | 0 (0.0%) | 0 (0.0%) |
| Construction | 489 (82.5%) | 104 (17.5%) |
| Manufacturing | 997 (66.0%) | 513 (34.0%) |
| Wholesale Trade | 67 (29.6%) | 159 (70.4%) |
| Retail Trade | 501 (47.7%) | 549 (52.3%) |
| Transportation & Warehousing | 230 (53.5%) | 200 (46.5%) |
| Utilities | 0 (0.0%) | 42 (100.0%) |
| Information | 524 (51.0%) | 503 (49.0%) |
| Finance & Insurance | 284 (54.3%) | 239 (45.7%) |
| Real Estate, Rental & Leasing | 136 (36.0%) | 242 (64.0%) |
| Professional & Scientific | 2,196 (57.0%) | 1,658 (43.0%) |
| Enterprise Management | 0 (0.0%) | 0 (0.0%) |
| Administrative & Support | 225 (51.2%) | 214 (48.7%) |
| Educational Services | 567 (39.8%) | 857 (60.2%) |
| Health Care & Social Assistance | 384 (29.6%) | 915 (70.4%) |
| Arts, Entertainment & Recreation | 168 (52.0%) | 155 (48.0%) |
| Accommodation & Food Services | 342 (58.0%) | 248 (42.0%) |
| Public Administration | 242 (59.3%) | 166 (40.7%) |
| Total | 7,634 (52.2%) | 7,000 (47.8%) |
Education in Belmont
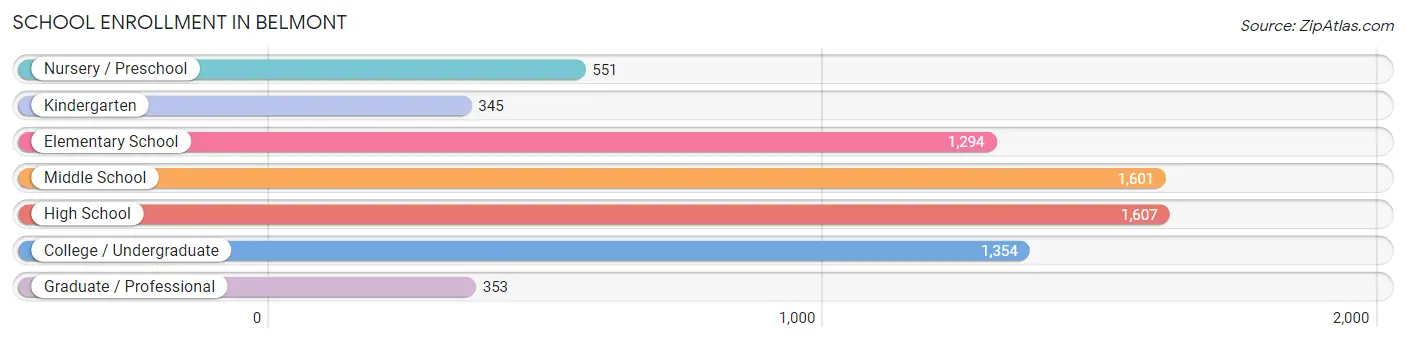
School Enrollment in Belmont
The most common levels of schooling among the 7,105 students in Belmont are high school (1,607 | 22.6%), middle school (1,601 | 22.5%), and college / undergraduate (1,354 | 19.1%).
| School Level | # Students | % Students |
| Nursery / Preschool | 551 | 7.8% |
| Kindergarten | 345 | 4.9% |
| Elementary School | 1,294 | 18.2% |
| Middle School | 1,601 | 22.5% |
| High School | 1,607 | 22.6% |
| College / Undergraduate | 1,354 | 19.1% |
| Graduate / Professional | 353 | 5.0% |
| Total | 7,105 | 100.0% |
School Enrollment by Age by Funding Source in Belmont
Out of a total of 7,105 students who are enrolled in schools in Belmont, 1,314 (18.5%) attend a private institution, while the remaining 5,791 (81.5%) are enrolled in public schools. The age group of 3 to 4 year olds has the highest likelihood of being enrolled in private schools, with 308 (74.8% in the age bracket) enrolled. Conversely, the age group of 10 to 14 year olds has the lowest likelihood of being enrolled in a private school, with 1,855 (95.8% in the age bracket) attending a public institution.
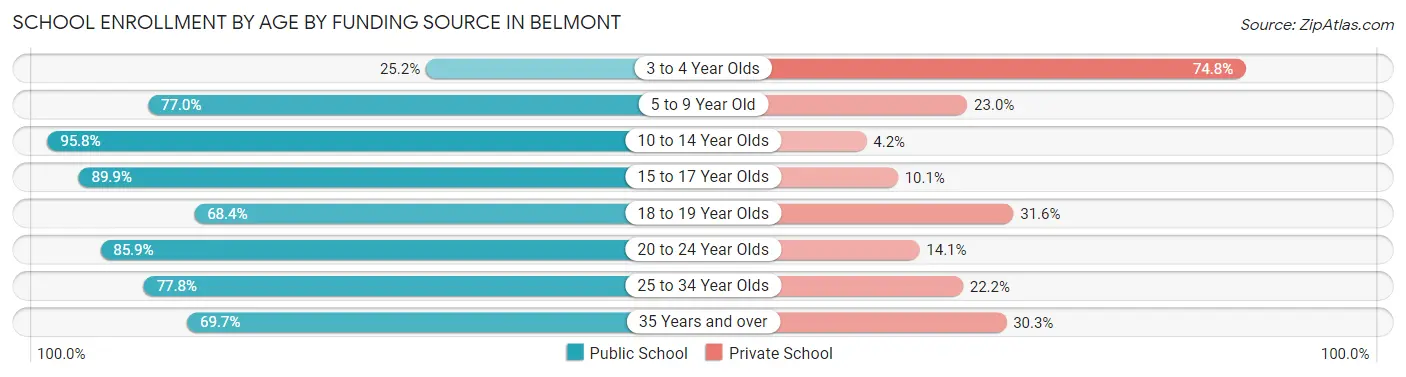
| Age Bracket | Public School | Private School |
| 3 to 4 Year Olds | 104 (25.2%) | 308 (74.8%) |
| 5 to 9 Year Old | 1,195 (77.0%) | 357 (23.0%) |
| 10 to 14 Year Olds | 1,855 (95.8%) | 82 (4.2%) |
| 15 to 17 Year Olds | 1,261 (89.9%) | 141 (10.1%) |
| 18 to 19 Year Olds | 329 (68.4%) | 152 (31.6%) |
| 20 to 24 Year Olds | 524 (85.9%) | 86 (14.1%) |
| 25 to 34 Year Olds | 291 (77.8%) | 83 (22.2%) |
| 35 Years and over | 235 (69.7%) | 102 (30.3%) |
| Total | 5,791 (81.5%) | 1,314 (18.5%) |
Educational Attainment by Field of Study in Belmont
Business (2,194 | 14.8%), engineering (2,106 | 14.2%), computers & mathematics (1,758 | 11.8%), social sciences (1,591 | 10.7%), and bio, nature & agricultural (1,466 | 9.9%) are the most common fields of study among 14,847 individuals in Belmont who have obtained a bachelor's degree or higher.
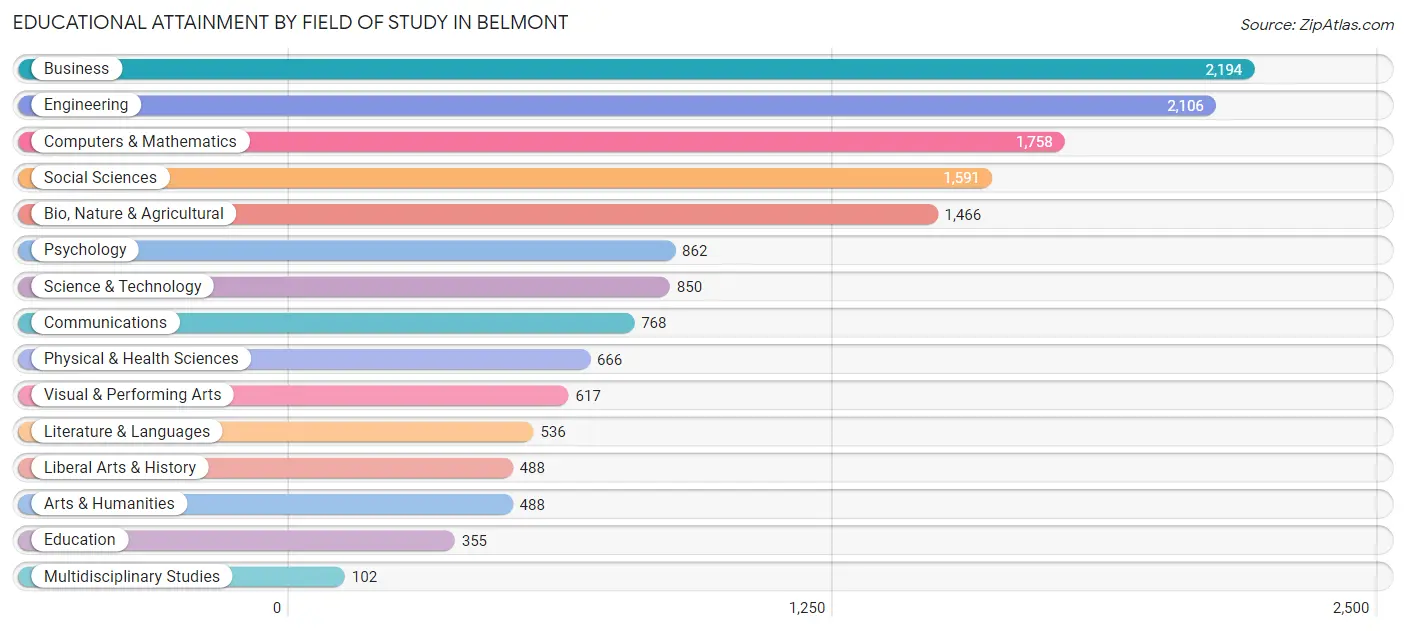
| Field of Study | # Graduates | % Graduates |
| Computers & Mathematics | 1,758 | 11.8% |
| Bio, Nature & Agricultural | 1,466 | 9.9% |
| Physical & Health Sciences | 666 | 4.5% |
| Psychology | 862 | 5.8% |
| Social Sciences | 1,591 | 10.7% |
| Engineering | 2,106 | 14.2% |
| Multidisciplinary Studies | 102 | 0.7% |
| Science & Technology | 850 | 5.7% |
| Business | 2,194 | 14.8% |
| Education | 355 | 2.4% |
| Literature & Languages | 536 | 3.6% |
| Liberal Arts & History | 488 | 3.3% |
| Visual & Performing Arts | 617 | 4.2% |
| Communications | 768 | 5.2% |
| Arts & Humanities | 488 | 3.3% |
| Total | 14,847 | 100.0% |
Transportation & Commute in Belmont
Vehicle Availability by Sex in Belmont
The most prevalent vehicle ownership categories in Belmont are males with 2 vehicles (3,682, accounting for 49.3%) and females with 2 vehicles (3,231, making up 55.1%).
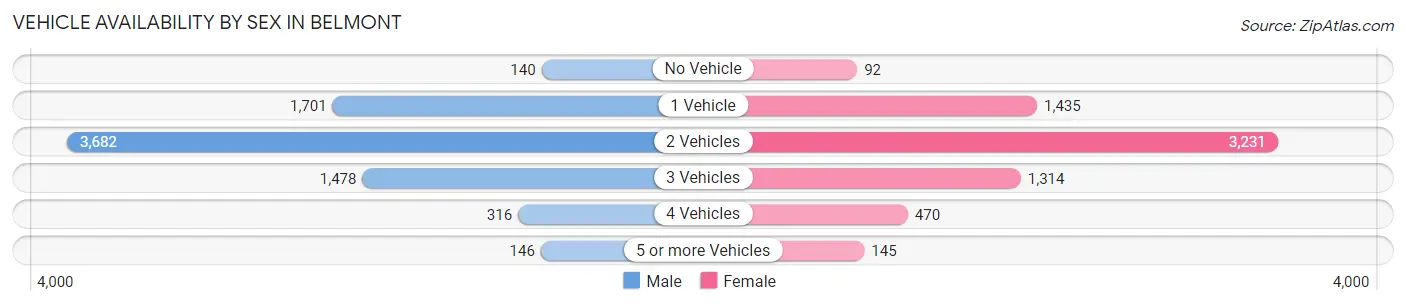
| Vehicles Available | Male | Female |
| No Vehicle | 140 (1.9%) | 92 (1.4%) |
| 1 Vehicle | 1,701 (22.8%) | 1,435 (21.5%) |
| 2 Vehicles | 3,682 (49.3%) | 3,231 (48.3%) |
| 3 Vehicles | 1,478 (19.8%) | 1,314 (19.7%) |
| 4 Vehicles | 316 (4.2%) | 470 (7.0%) |
| 5 or more Vehicles | 146 (2.0%) | 145 (2.2%) |
| Total | 7,463 (100.0%) | 6,687 (100.0%) |
Commute Time in Belmont
The most frequently occuring commute durations in Belmont are 20 to 24 minutes (1,520 commuters, 14.7%), 15 to 19 minutes (1,462 commuters, 14.2%), and 10 to 14 minutes (1,407 commuters, 13.7%).
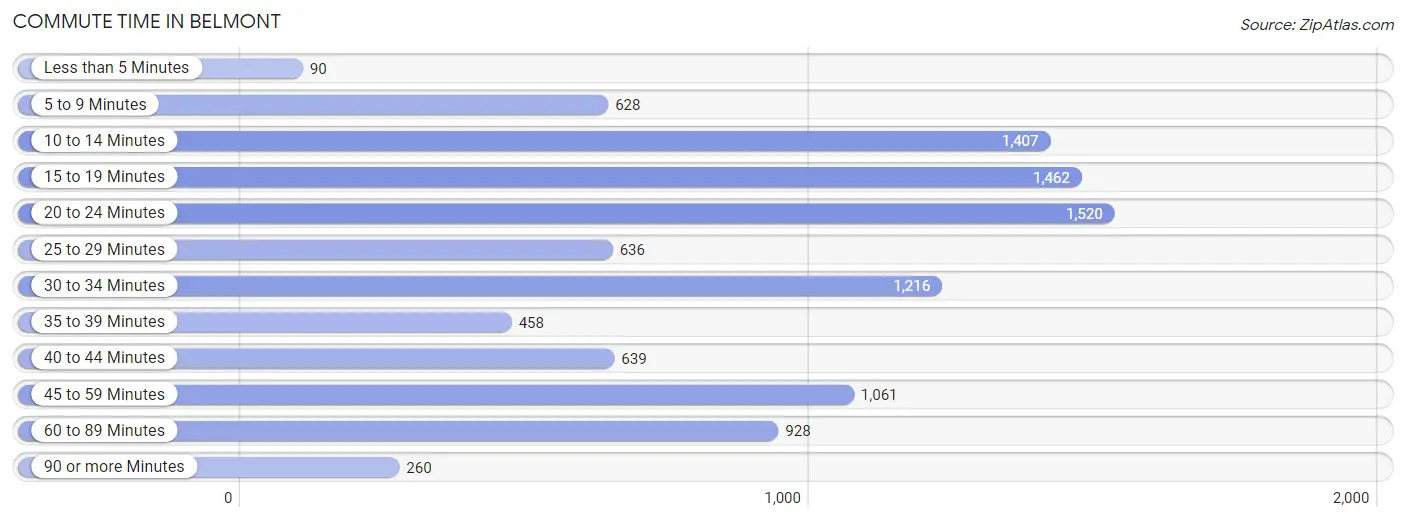
| Commute Time | # Commuters | % Commuters |
| Less than 5 Minutes | 90 | 0.9% |
| 5 to 9 Minutes | 628 | 6.1% |
| 10 to 14 Minutes | 1,407 | 13.7% |
| 15 to 19 Minutes | 1,462 | 14.2% |
| 20 to 24 Minutes | 1,520 | 14.7% |
| 25 to 29 Minutes | 636 | 6.2% |
| 30 to 34 Minutes | 1,216 | 11.8% |
| 35 to 39 Minutes | 458 | 4.4% |
| 40 to 44 Minutes | 639 | 6.2% |
| 45 to 59 Minutes | 1,061 | 10.3% |
| 60 to 89 Minutes | 928 | 9.0% |
| 90 or more Minutes | 260 | 2.5% |
Commute Time by Sex in Belmont
The most common commute times in Belmont are 15 to 19 minutes (768 commuters, 14.0%) for males and 20 to 24 minutes (827 commuters, 17.2%) for females.
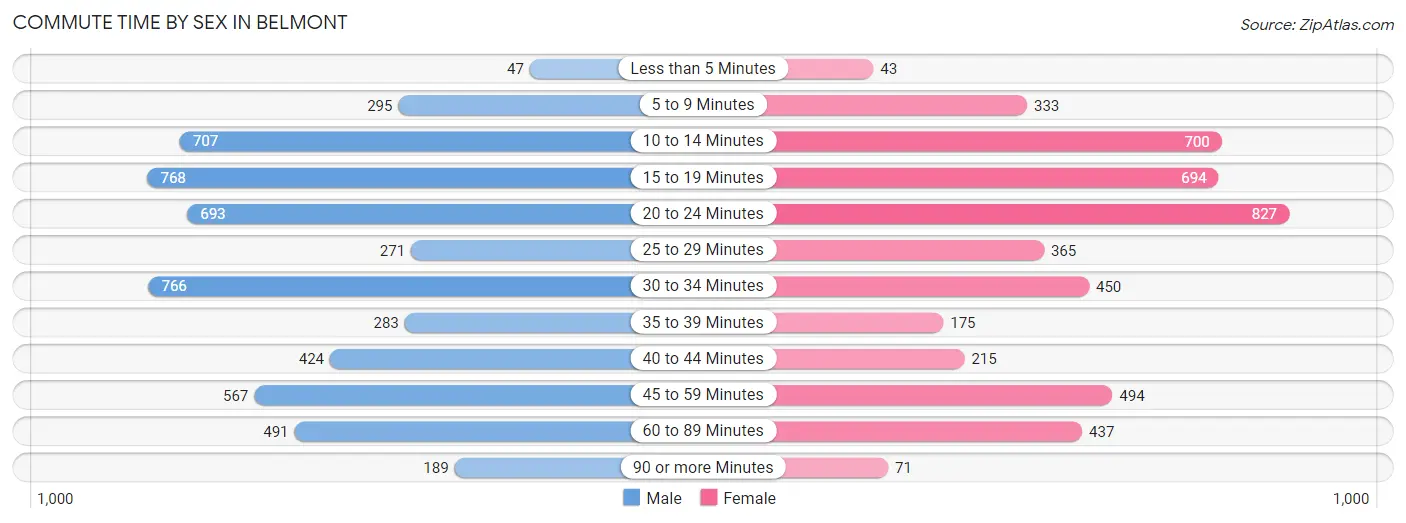
| Commute Time | Male | Female |
| Less than 5 Minutes | 47 (0.9%) | 43 (0.9%) |
| 5 to 9 Minutes | 295 (5.4%) | 333 (6.9%) |
| 10 to 14 Minutes | 707 (12.9%) | 700 (14.6%) |
| 15 to 19 Minutes | 768 (14.0%) | 694 (14.4%) |
| 20 to 24 Minutes | 693 (12.6%) | 827 (17.2%) |
| 25 to 29 Minutes | 271 (4.9%) | 365 (7.6%) |
| 30 to 34 Minutes | 766 (13.9%) | 450 (9.4%) |
| 35 to 39 Minutes | 283 (5.1%) | 175 (3.6%) |
| 40 to 44 Minutes | 424 (7.7%) | 215 (4.5%) |
| 45 to 59 Minutes | 567 (10.3%) | 494 (10.3%) |
| 60 to 89 Minutes | 491 (8.9%) | 437 (9.1%) |
| 90 or more Minutes | 189 (3.4%) | 71 (1.5%) |
Time of Departure to Work by Sex in Belmont
The most frequent times of departure to work in Belmont are 8:00 AM to 8:29 AM (1,020, 18.5%) for males and 7:30 AM to 7:59 AM (1,215, 25.3%) for females.
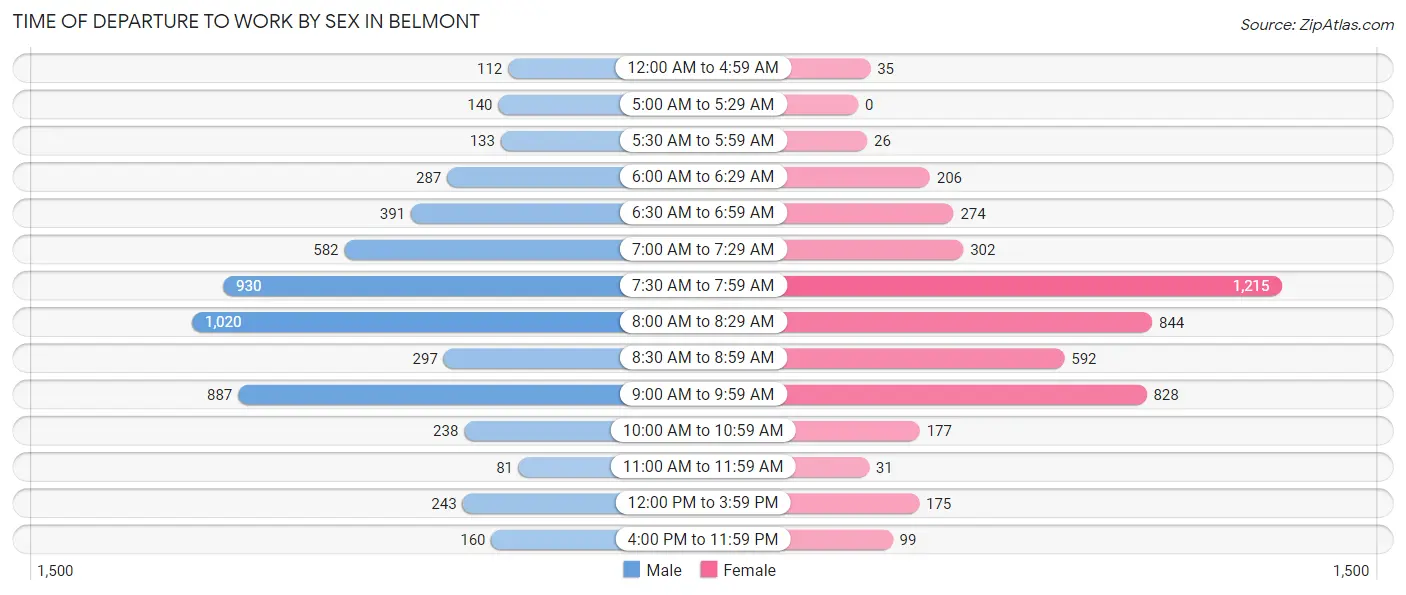
| Time of Departure | Male | Female |
| 12:00 AM to 4:59 AM | 112 (2.0%) | 35 (0.7%) |
| 5:00 AM to 5:29 AM | 140 (2.5%) | 0 (0.0%) |
| 5:30 AM to 5:59 AM | 133 (2.4%) | 26 (0.5%) |
| 6:00 AM to 6:29 AM | 287 (5.2%) | 206 (4.3%) |
| 6:30 AM to 6:59 AM | 391 (7.1%) | 274 (5.7%) |
| 7:00 AM to 7:29 AM | 582 (10.6%) | 302 (6.3%) |
| 7:30 AM to 7:59 AM | 930 (16.9%) | 1,215 (25.3%) |
| 8:00 AM to 8:29 AM | 1,020 (18.5%) | 844 (17.6%) |
| 8:30 AM to 8:59 AM | 297 (5.4%) | 592 (12.3%) |
| 9:00 AM to 9:59 AM | 887 (16.1%) | 828 (17.2%) |
| 10:00 AM to 10:59 AM | 238 (4.3%) | 177 (3.7%) |
| 11:00 AM to 11:59 AM | 81 (1.5%) | 31 (0.6%) |
| 12:00 PM to 3:59 PM | 243 (4.4%) | 175 (3.6%) |
| 4:00 PM to 11:59 PM | 160 (2.9%) | 99 (2.1%) |
| Total | 5,501 (100.0%) | 4,804 (100.0%) |
Housing Occupancy in Belmont
Occupancy by Ownership in Belmont
Of the total 10,811 dwellings in Belmont, owner-occupied units account for 6,122 (56.6%), while renter-occupied units make up 4,689 (43.4%).
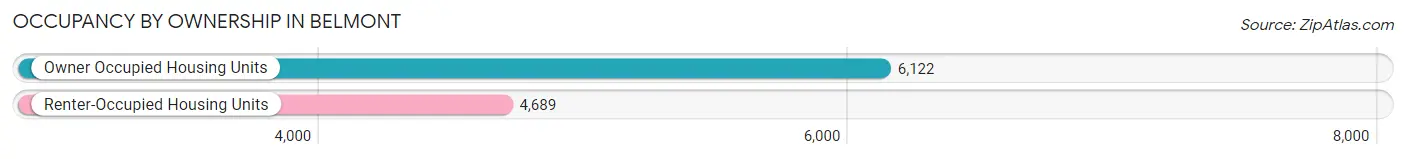
| Occupancy | # Housing Units | % Housing Units |
| Owner Occupied Housing Units | 6,122 | 56.6% |
| Renter-Occupied Housing Units | 4,689 | 43.4% |
| Total Occupied Housing Units | 10,811 | 100.0% |
Occupancy by Household Size in Belmont
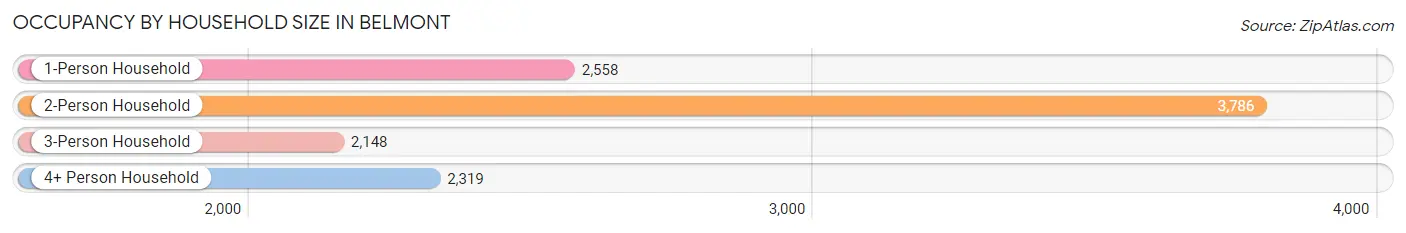
| Household Size | # Housing Units | % Housing Units |
| 1-Person Household | 2,558 | 23.7% |
| 2-Person Household | 3,786 | 35.0% |
| 3-Person Household | 2,148 | 19.9% |
| 4+ Person Household | 2,319 | 21.4% |
| Total Housing Units | 10,811 | 100.0% |
Occupancy by Ownership by Household Size in Belmont
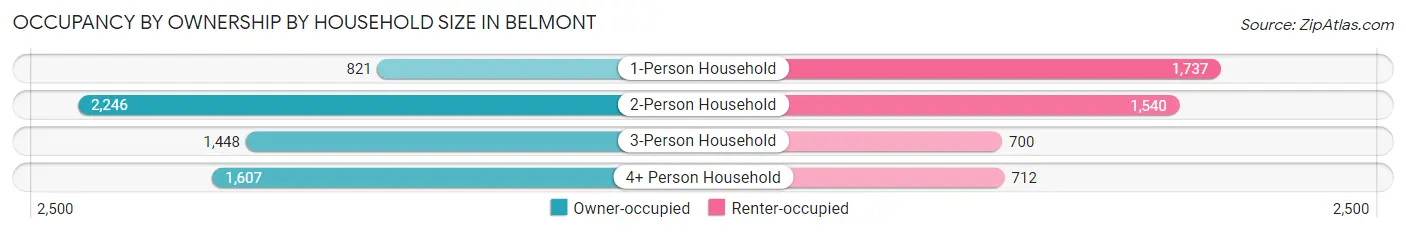
| Household Size | Owner-occupied | Renter-occupied |
| 1-Person Household | 821 (32.1%) | 1,737 (67.9%) |
| 2-Person Household | 2,246 (59.3%) | 1,540 (40.7%) |
| 3-Person Household | 1,448 (67.4%) | 700 (32.6%) |
| 4+ Person Household | 1,607 (69.3%) | 712 (30.7%) |
| Total Housing Units | 6,122 (56.6%) | 4,689 (43.4%) |
Occupancy by Educational Attainment in Belmont
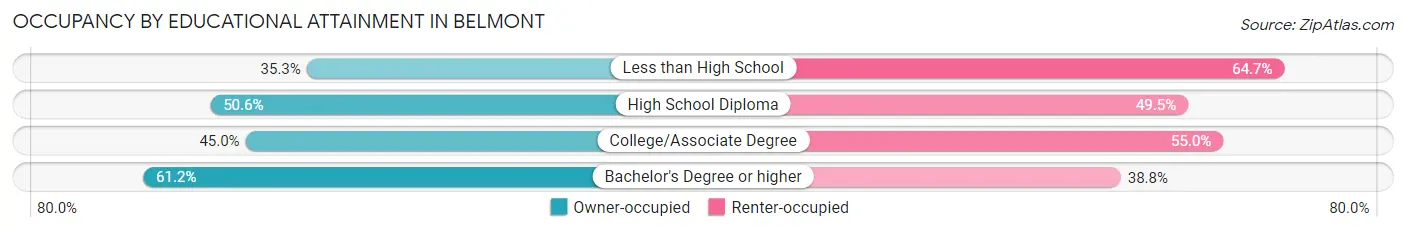
| Household Size | Owner-occupied | Renter-occupied |
| Less than High School | 97 (35.3%) | 178 (64.7%) |
| High School Diploma | 322 (50.5%) | 315 (49.4%) |
| College/Associate Degree | 984 (45.0%) | 1,204 (55.0%) |
| Bachelor's Degree or higher | 4,719 (61.2%) | 2,992 (38.8%) |
Occupancy by Age of Householder in Belmont
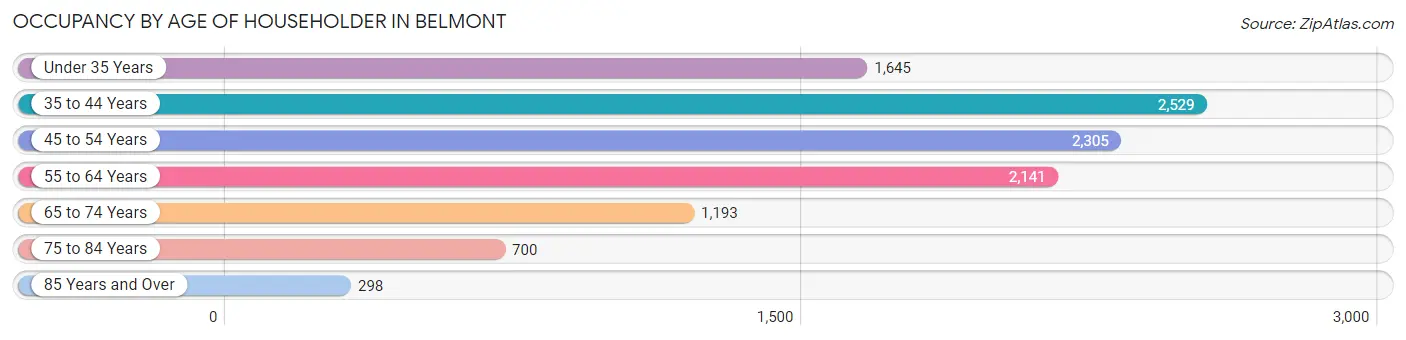
| Age Bracket | # Households | % Households |
| Under 35 Years | 1,645 | 15.2% |
| 35 to 44 Years | 2,529 | 23.4% |
| 45 to 54 Years | 2,305 | 21.3% |
| 55 to 64 Years | 2,141 | 19.8% |
| 65 to 74 Years | 1,193 | 11.0% |
| 75 to 84 Years | 700 | 6.5% |
| 85 Years and Over | 298 | 2.8% |
| Total | 10,811 | 100.0% |
Housing Finances in Belmont
Median Income by Occupancy in Belmont
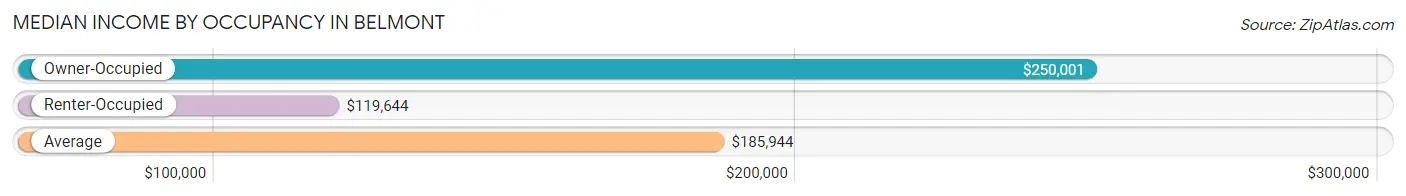
| Occupancy Type | # Households | Median Income |
| Owner-Occupied | 6,122 (56.6%) | $250,001 |
| Renter-Occupied | 4,689 (43.4%) | $119,644 |
| Average | 10,811 (100.0%) | $185,944 |
Occupancy by Householder Income Bracket in Belmont
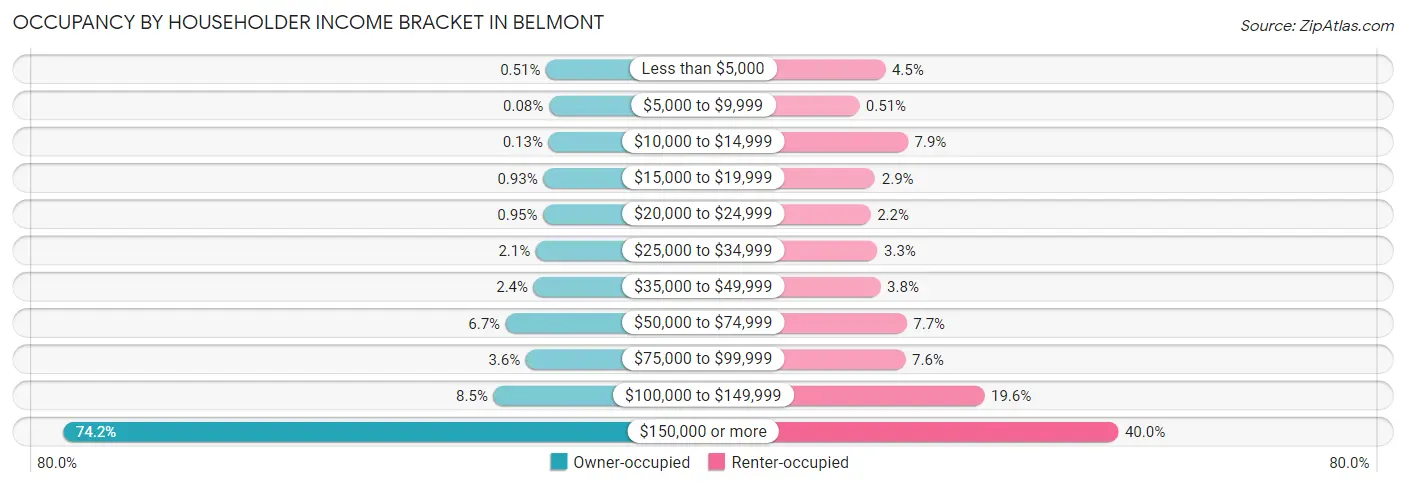
| Income Bracket | Owner-occupied | Renter-occupied |
| Less than $5,000 | 31 (0.5%) | 210 (4.5%) |
| $5,000 to $9,999 | 5 (0.1%) | 24 (0.5%) |
| $10,000 to $14,999 | 8 (0.1%) | 372 (7.9%) |
| $15,000 to $19,999 | 57 (0.9%) | 138 (2.9%) |
| $20,000 to $24,999 | 58 (0.9%) | 105 (2.2%) |
| $25,000 to $34,999 | 127 (2.1%) | 154 (3.3%) |
| $35,000 to $49,999 | 147 (2.4%) | 176 (3.7%) |
| $50,000 to $74,999 | 408 (6.7%) | 363 (7.7%) |
| $75,000 to $99,999 | 220 (3.6%) | 354 (7.5%) |
| $100,000 to $149,999 | 521 (8.5%) | 918 (19.6%) |
| $150,000 or more | 4,540 (74.2%) | 1,875 (40.0%) |
| Total | 6,122 (100.0%) | 4,689 (100.0%) |
Monthly Housing Cost Tiers in Belmont
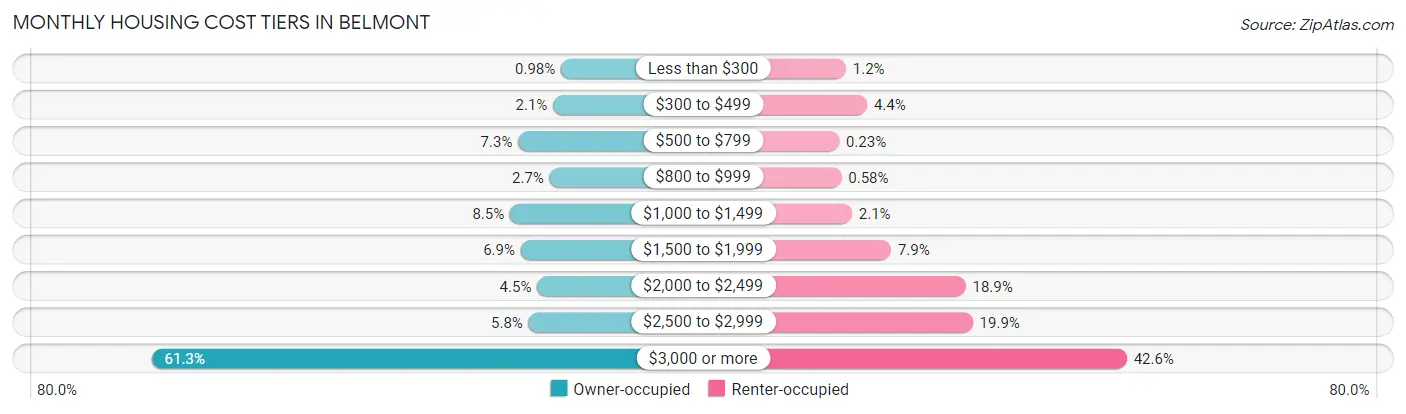
| Monthly Cost | Owner-occupied | Renter-occupied |
| Less than $300 | 60 (1.0%) | 58 (1.2%) |
| $300 to $499 | 131 (2.1%) | 204 (4.3%) |
| $500 to $799 | 446 (7.3%) | 11 (0.2%) |
| $800 to $999 | 163 (2.7%) | 27 (0.6%) |
| $1,000 to $1,499 | 520 (8.5%) | 100 (2.1%) |
| $1,500 to $1,999 | 423 (6.9%) | 370 (7.9%) |
| $2,000 to $2,499 | 275 (4.5%) | 885 (18.9%) |
| $2,500 to $2,999 | 352 (5.8%) | 934 (19.9%) |
| $3,000 or more | 3,752 (61.3%) | 1,998 (42.6%) |
| Total | 6,122 (100.0%) | 4,689 (100.0%) |
Physical Housing Characteristics in Belmont
Housing Structures in Belmont
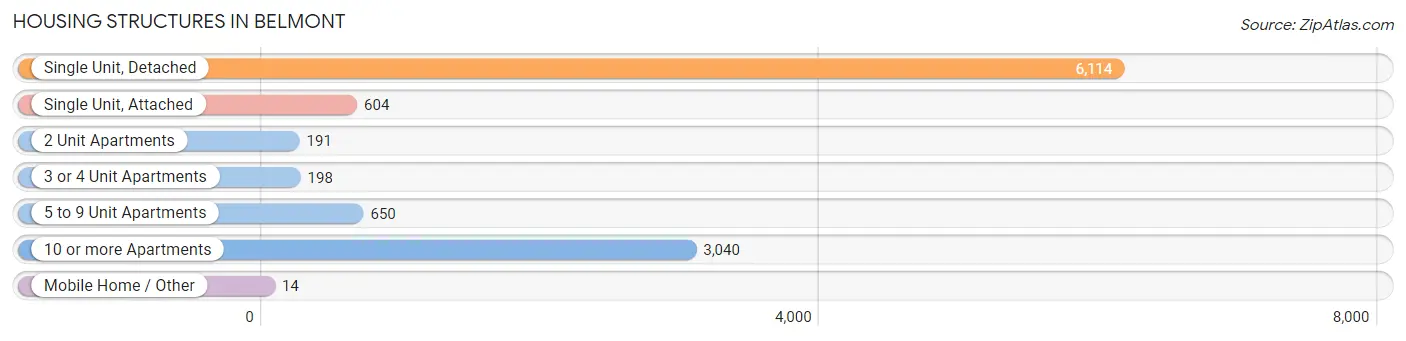
| Structure Type | # Housing Units | % Housing Units |
| Single Unit, Detached | 6,114 | 56.6% |
| Single Unit, Attached | 604 | 5.6% |
| 2 Unit Apartments | 191 | 1.8% |
| 3 or 4 Unit Apartments | 198 | 1.8% |
| 5 to 9 Unit Apartments | 650 | 6.0% |
| 10 or more Apartments | 3,040 | 28.1% |
| Mobile Home / Other | 14 | 0.1% |
| Total | 10,811 | 100.0% |
Housing Structures by Occupancy in Belmont
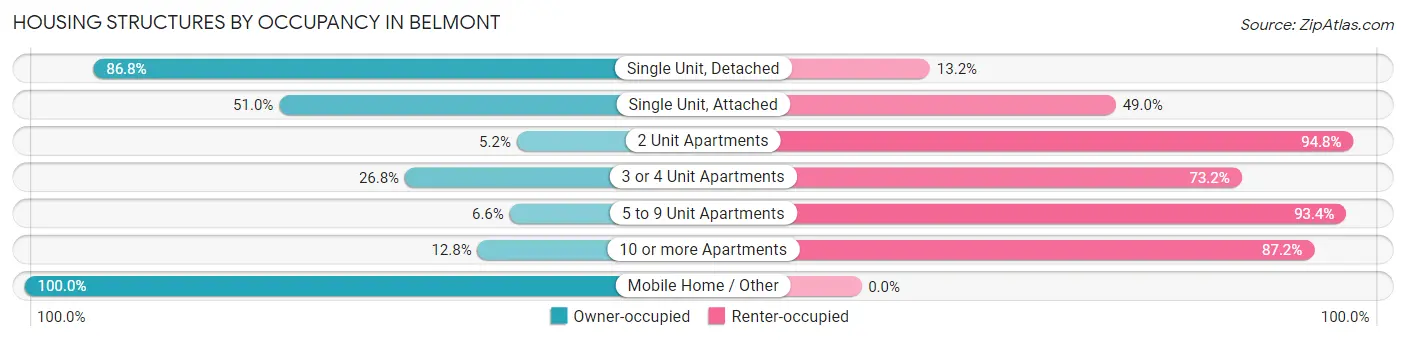
| Structure Type | Owner-occupied | Renter-occupied |
| Single Unit, Detached | 5,305 (86.8%) | 809 (13.2%) |
| Single Unit, Attached | 308 (51.0%) | 296 (49.0%) |
| 2 Unit Apartments | 10 (5.2%) | 181 (94.8%) |
| 3 or 4 Unit Apartments | 53 (26.8%) | 145 (73.2%) |
| 5 to 9 Unit Apartments | 43 (6.6%) | 607 (93.4%) |
| 10 or more Apartments | 389 (12.8%) | 2,651 (87.2%) |
| Mobile Home / Other | 14 (100.0%) | 0 (0.0%) |
| Total | 6,122 (56.6%) | 4,689 (43.4%) |
Housing Structures by Number of Rooms in Belmont
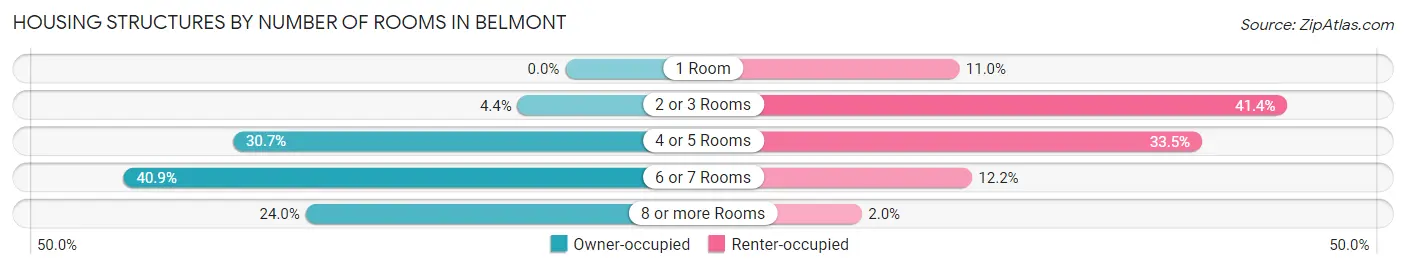
| Number of Rooms | Owner-occupied | Renter-occupied |
| 1 Room | 0 (0.0%) | 516 (11.0%) |
| 2 or 3 Rooms | 270 (4.4%) | 1,940 (41.4%) |
| 4 or 5 Rooms | 1,881 (30.7%) | 1,570 (33.5%) |
| 6 or 7 Rooms | 2,501 (40.8%) | 570 (12.2%) |
| 8 or more Rooms | 1,470 (24.0%) | 93 (2.0%) |
| Total | 6,122 (100.0%) | 4,689 (100.0%) |
Housing Structure by Heating Type in Belmont
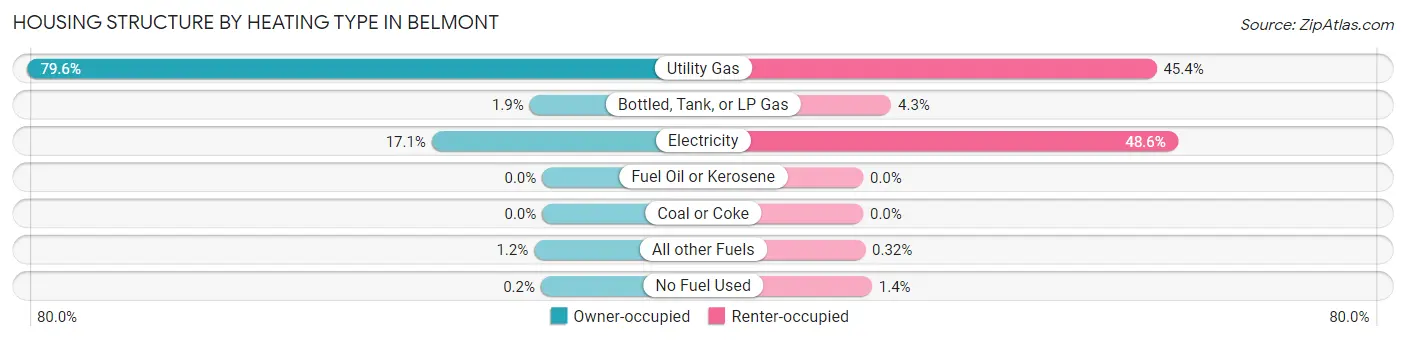
| Heating Type | Owner-occupied | Renter-occupied |
| Utility Gas | 4,870 (79.5%) | 2,127 (45.4%) |
| Bottled, Tank, or LP Gas | 119 (1.9%) | 203 (4.3%) |
| Electricity | 1,045 (17.1%) | 2,280 (48.6%) |
| Fuel Oil or Kerosene | 0 (0.0%) | 0 (0.0%) |
| Coal or Coke | 0 (0.0%) | 0 (0.0%) |
| All other Fuels | 76 (1.2%) | 15 (0.3%) |
| No Fuel Used | 12 (0.2%) | 64 (1.4%) |
| Total | 6,122 (100.0%) | 4,689 (100.0%) |
Household Vehicle Usage in Belmont
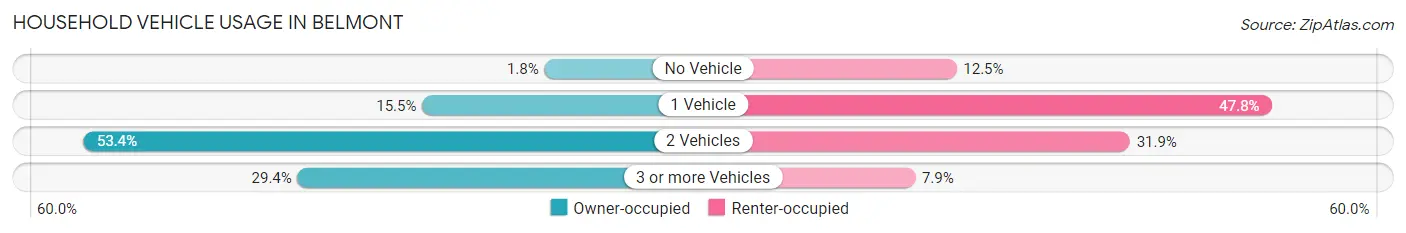
| Vehicles per Household | Owner-occupied | Renter-occupied |
| No Vehicle | 108 (1.8%) | 585 (12.5%) |
| 1 Vehicle | 946 (15.4%) | 2,240 (47.8%) |
| 2 Vehicles | 3,267 (53.4%) | 1,496 (31.9%) |
| 3 or more Vehicles | 1,801 (29.4%) | 368 (7.9%) |
| Total | 6,122 (100.0%) | 4,689 (100.0%) |
Real Estate & Mortgages in Belmont
Real Estate and Mortgage Overview in Belmont
| Characteristic | Without Mortgage | With Mortgage |
| Housing Units | 1,744 | 4,378 |
| Median Property Value | $1,937,800 | $2,000,001 |
| Median Household Income | $165,938 | $3,563 |
| Monthly Housing Costs | $1,121 | $3,731 |
| Real Estate Taxes | $6,933 | $22 |
Property Value by Mortgage Status in Belmont
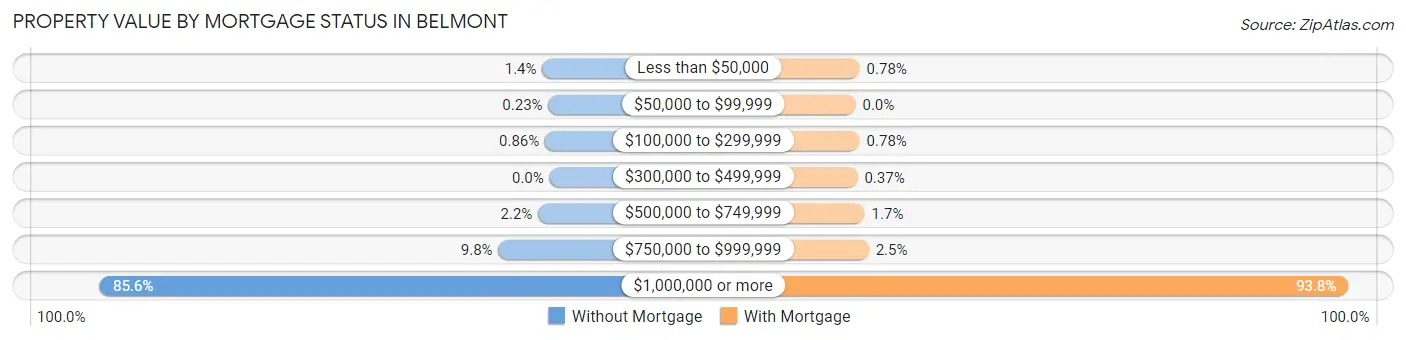
| Property Value | Without Mortgage | With Mortgage |
| Less than $50,000 | 24 (1.4%) | 34 (0.8%) |
| $50,000 to $99,999 | 4 (0.2%) | 0 (0.0%) |
| $100,000 to $299,999 | 15 (0.9%) | 34 (0.8%) |
| $300,000 to $499,999 | 0 (0.0%) | 16 (0.4%) |
| $500,000 to $749,999 | 38 (2.2%) | 76 (1.7%) |
| $750,000 to $999,999 | 170 (9.8%) | 110 (2.5%) |
| $1,000,000 or more | 1,493 (85.6%) | 4,108 (93.8%) |
| Total | 1,744 (100.0%) | 4,378 (100.0%) |
Household Income by Mortgage Status in Belmont
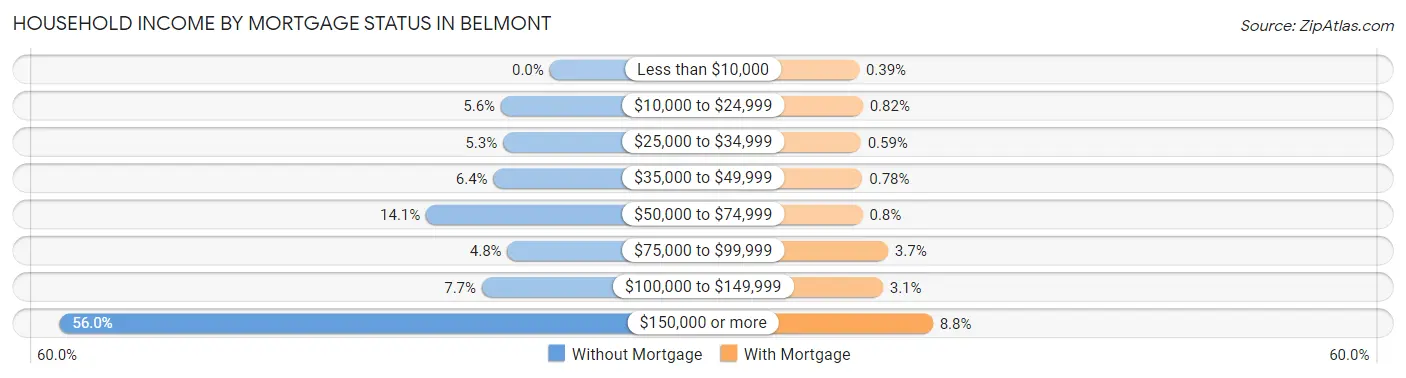
| Household Income | Without Mortgage | With Mortgage |
| Less than $10,000 | 0 (0.0%) | 17 (0.4%) |
| $10,000 to $24,999 | 97 (5.6%) | 36 (0.8%) |
| $25,000 to $34,999 | 93 (5.3%) | 26 (0.6%) |
| $35,000 to $49,999 | 112 (6.4%) | 34 (0.8%) |
| $50,000 to $74,999 | 246 (14.1%) | 35 (0.8%) |
| $75,000 to $99,999 | 84 (4.8%) | 162 (3.7%) |
| $100,000 to $149,999 | 135 (7.7%) | 136 (3.1%) |
| $150,000 or more | 977 (56.0%) | 386 (8.8%) |
| Total | 1,744 (100.0%) | 4,378 (100.0%) |
Property Value to Household Income Ratio in Belmont
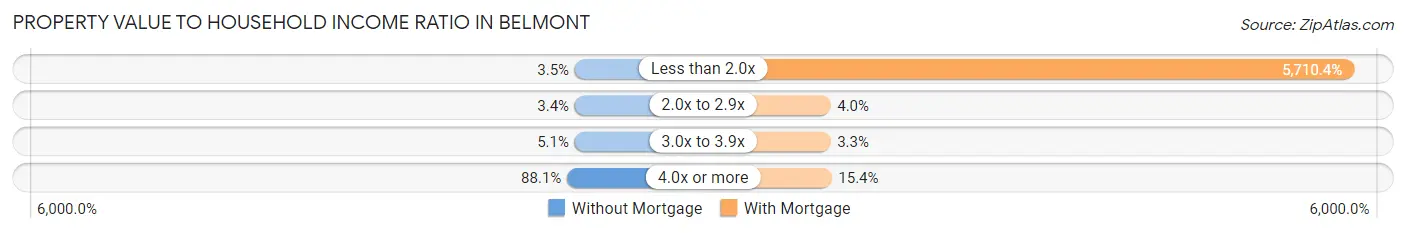
| Value-to-Income Ratio | Without Mortgage | With Mortgage |
| Less than 2.0x | 61 (3.5%) | 250,001 (5,710.4%) |
| 2.0x to 2.9x | 59 (3.4%) | 174 (4.0%) |
| 3.0x to 3.9x | 88 (5.1%) | 144 (3.3%) |
| 4.0x or more | 1,536 (88.1%) | 672 (15.3%) |
| Total | 1,744 (100.0%) | 4,378 (100.0%) |
Real Estate Taxes by Mortgage Status in Belmont
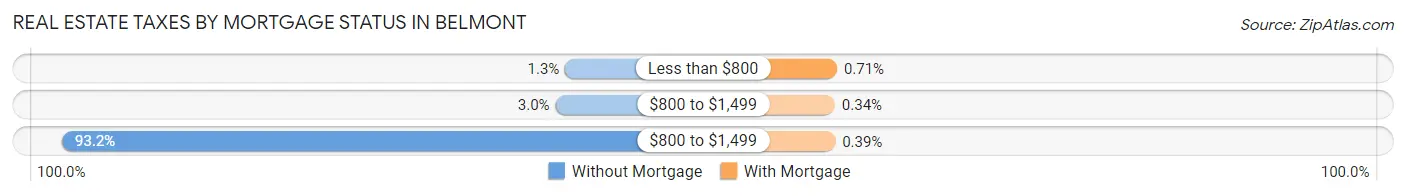
| Property Taxes | Without Mortgage | With Mortgage |
| Less than $800 | 22 (1.3%) | 31 (0.7%) |
| $800 to $1,499 | 53 (3.0%) | 15 (0.3%) |
| $800 to $1,499 | 1,625 (93.2%) | 17 (0.4%) |
| Total | 1,744 (100.0%) | 4,378 (100.0%) |
Health & Disability in Belmont
Health Insurance Coverage by Age in Belmont
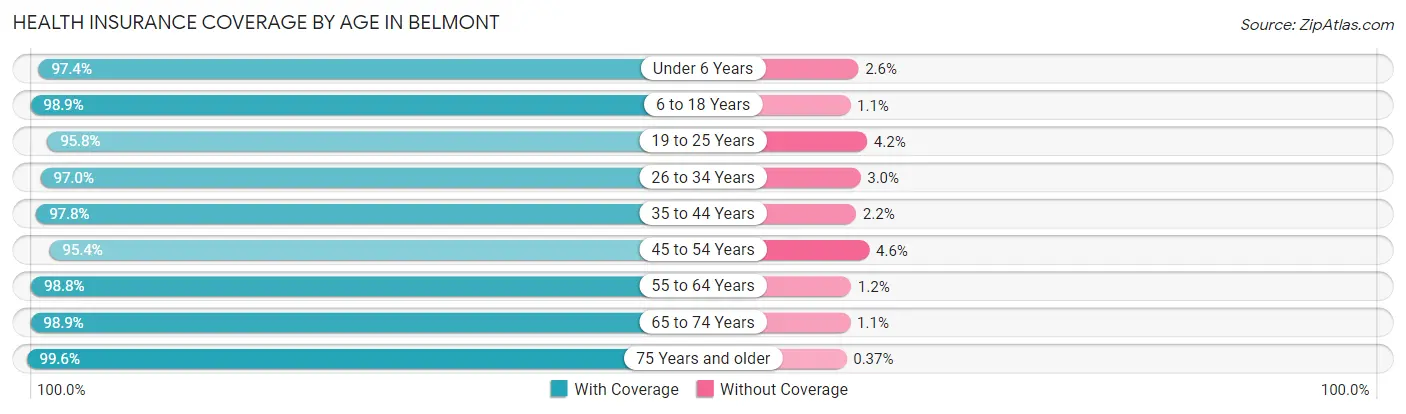
| Age Bracket | With Coverage | Without Coverage |
| Under 6 Years | 1,685 (97.4%) | 45 (2.6%) |
| 6 to 18 Years | 4,854 (98.9%) | 53 (1.1%) |
| 19 to 25 Years | 1,179 (95.8%) | 52 (4.2%) |
| 26 to 34 Years | 3,317 (97.0%) | 102 (3.0%) |
| 35 to 44 Years | 4,458 (97.8%) | 99 (2.2%) |
| 45 to 54 Years | 4,244 (95.4%) | 206 (4.6%) |
| 55 to 64 Years | 3,537 (98.8%) | 44 (1.2%) |
| 65 to 74 Years | 2,092 (98.9%) | 23 (1.1%) |
| 75 Years and older | 1,613 (99.6%) | 6 (0.4%) |
| Total | 26,979 (97.7%) | 630 (2.3%) |
Health Insurance Coverage by Citizenship Status in Belmont
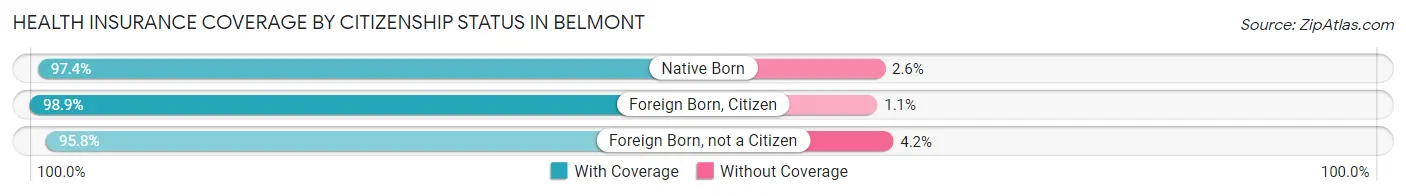
| Citizenship Status | With Coverage | Without Coverage |
| Native Born | 1,685 (97.4%) | 45 (2.6%) |
| Foreign Born, Citizen | 4,854 (98.9%) | 53 (1.1%) |
| Foreign Born, not a Citizen | 1,179 (95.8%) | 52 (4.2%) |
Health Insurance Coverage by Household Income in Belmont
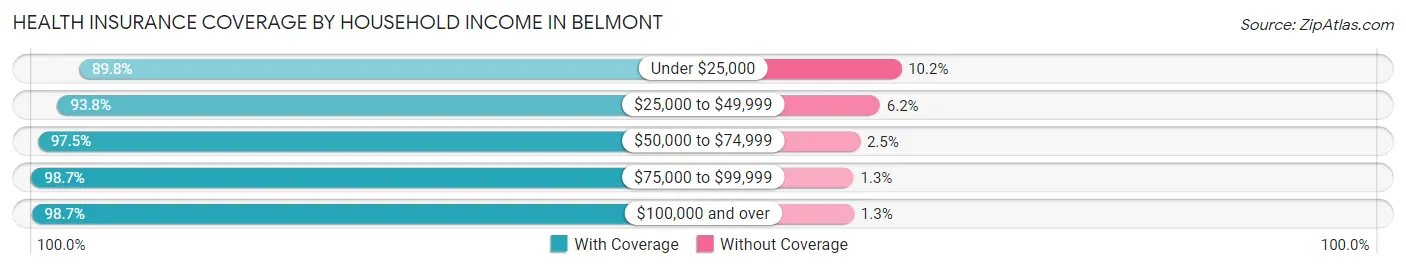
| Household Income | With Coverage | Without Coverage |
| Under $25,000 | 1,488 (89.8%) | 169 (10.2%) |
| $25,000 to $49,999 | 925 (93.8%) | 61 (6.2%) |
| $50,000 to $74,999 | 1,421 (97.5%) | 36 (2.5%) |
| $75,000 to $99,999 | 1,232 (98.7%) | 16 (1.3%) |
| $100,000 and over | 21,444 (98.7%) | 290 (1.3%) |
Public vs Private Health Insurance Coverage by Age in Belmont
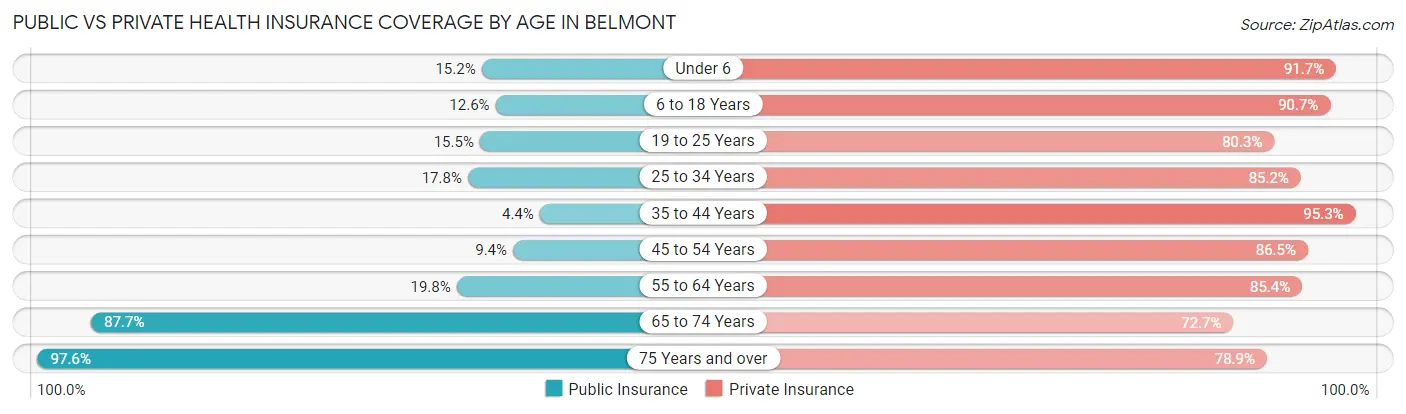
| Age Bracket | Public Insurance | Private Insurance |
| Under 6 | 263 (15.2%) | 1,587 (91.7%) |
| 6 to 18 Years | 619 (12.6%) | 4,448 (90.6%) |
| 19 to 25 Years | 191 (15.5%) | 988 (80.3%) |
| 25 to 34 Years | 607 (17.7%) | 2,912 (85.2%) |
| 35 to 44 Years | 201 (4.4%) | 4,344 (95.3%) |
| 45 to 54 Years | 417 (9.4%) | 3,849 (86.5%) |
| 55 to 64 Years | 710 (19.8%) | 3,059 (85.4%) |
| 65 to 74 Years | 1,854 (87.7%) | 1,537 (72.7%) |
| 75 Years and over | 1,580 (97.6%) | 1,277 (78.9%) |
| Total | 6,442 (23.3%) | 24,001 (86.9%) |
Disability Status by Sex by Age in Belmont
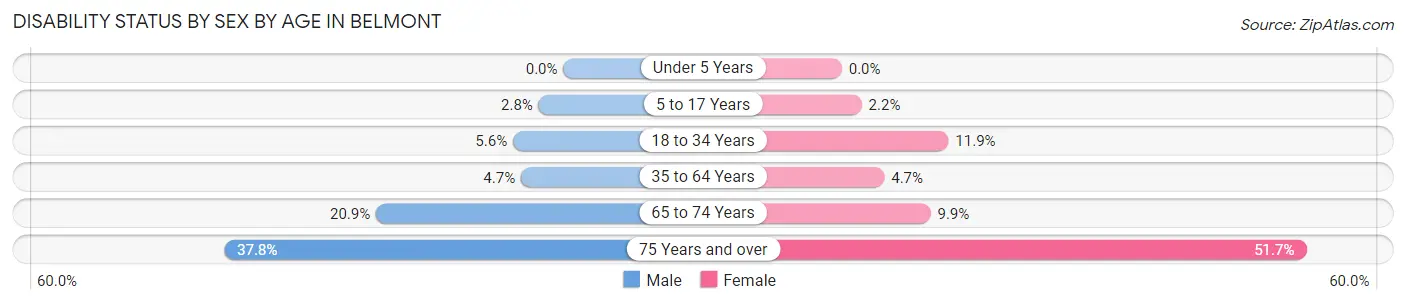
| Age Bracket | Male | Female |
| Under 5 Years | 0 (0.0%) | 0 (0.0%) |
| 5 to 17 Years | 83 (2.8%) | 43 (2.2%) |
| 18 to 34 Years | 133 (5.6%) | 300 (11.9%) |
| 35 to 64 Years | 292 (4.7%) | 303 (4.7%) |
| 65 to 74 Years | 247 (20.9%) | 92 (9.9%) |
| 75 Years and over | 272 (37.8%) | 465 (51.7%) |
Disability Class by Sex by Age in Belmont
Disability Class: Hearing Difficulty
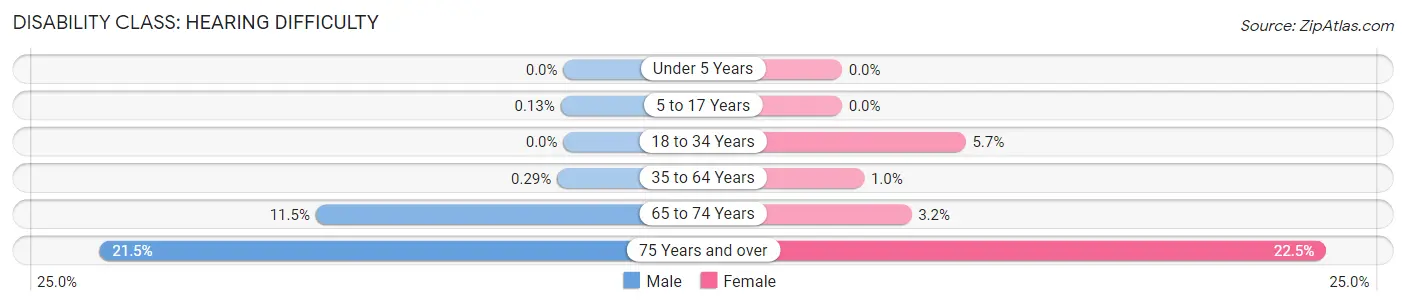
| Age Bracket | Male | Female |
| Under 5 Years | 0 (0.0%) | 0 (0.0%) |
| 5 to 17 Years | 4 (0.1%) | 0 (0.0%) |
| 18 to 34 Years | 0 (0.0%) | 145 (5.7%) |
| 35 to 64 Years | 18 (0.3%) | 66 (1.0%) |
| 65 to 74 Years | 136 (11.5%) | 30 (3.2%) |
| 75 Years and over | 155 (21.5%) | 202 (22.5%) |
Disability Class: Vision Difficulty
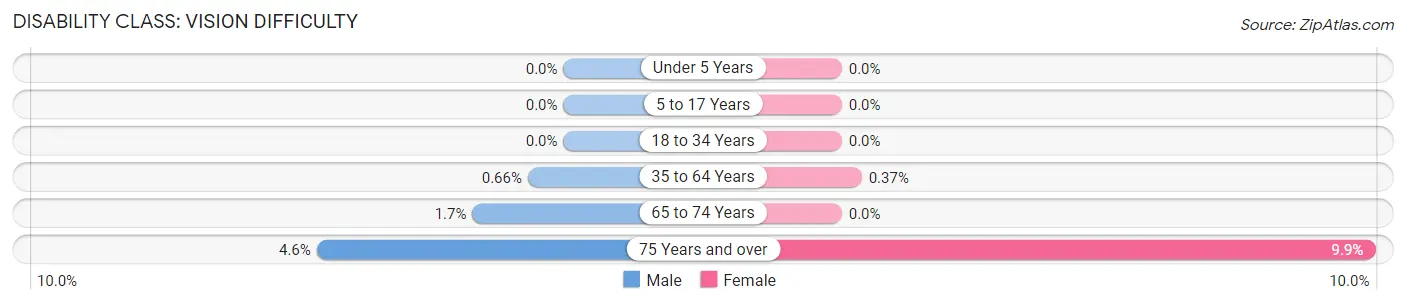
| Age Bracket | Male | Female |
| Under 5 Years | 0 (0.0%) | 0 (0.0%) |
| 5 to 17 Years | 0 (0.0%) | 0 (0.0%) |
| 18 to 34 Years | 0 (0.0%) | 0 (0.0%) |
| 35 to 64 Years | 41 (0.7%) | 24 (0.4%) |
| 65 to 74 Years | 20 (1.7%) | 0 (0.0%) |
| 75 Years and over | 33 (4.6%) | 89 (9.9%) |
Disability Class: Cognitive Difficulty
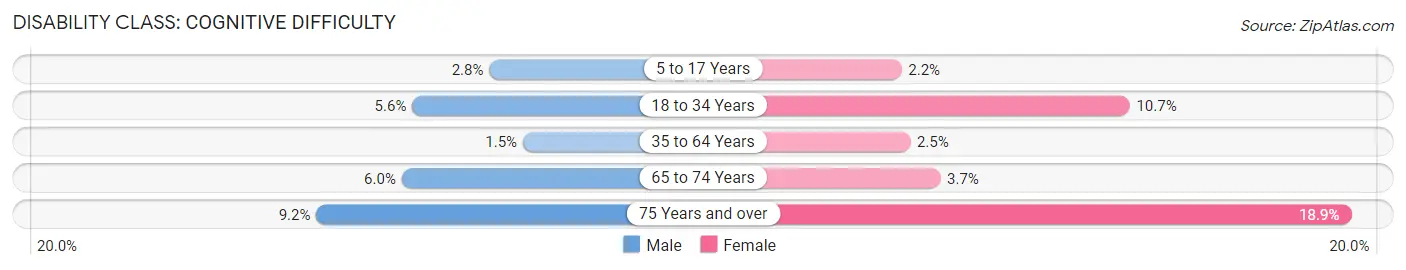
| Age Bracket | Male | Female |
| 5 to 17 Years | 83 (2.8%) | 43 (2.2%) |
| 18 to 34 Years | 133 (5.6%) | 270 (10.7%) |
| 35 to 64 Years | 93 (1.5%) | 162 (2.5%) |
| 65 to 74 Years | 71 (6.0%) | 34 (3.6%) |
| 75 Years and over | 66 (9.2%) | 170 (18.9%) |
Disability Class: Ambulatory Difficulty
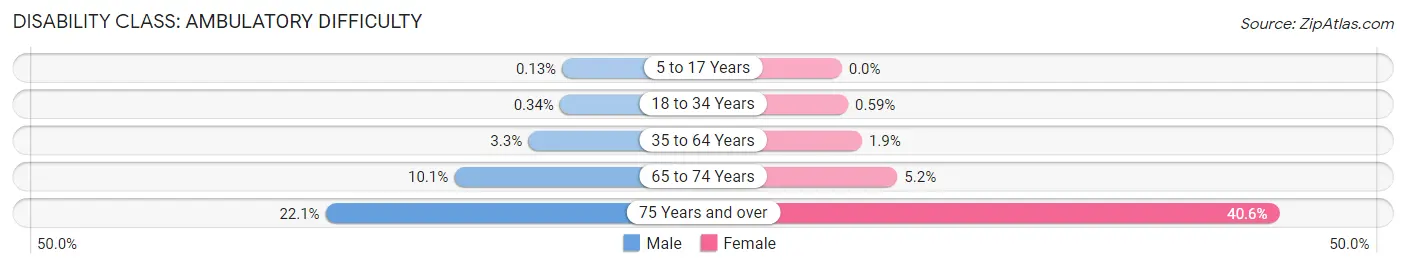
| Age Bracket | Male | Female |
| 5 to 17 Years | 4 (0.1%) | 0 (0.0%) |
| 18 to 34 Years | 8 (0.3%) | 15 (0.6%) |
| 35 to 64 Years | 203 (3.3%) | 120 (1.9%) |
| 65 to 74 Years | 120 (10.1%) | 48 (5.2%) |
| 75 Years and over | 159 (22.1%) | 365 (40.6%) |
Disability Class: Self-Care Difficulty
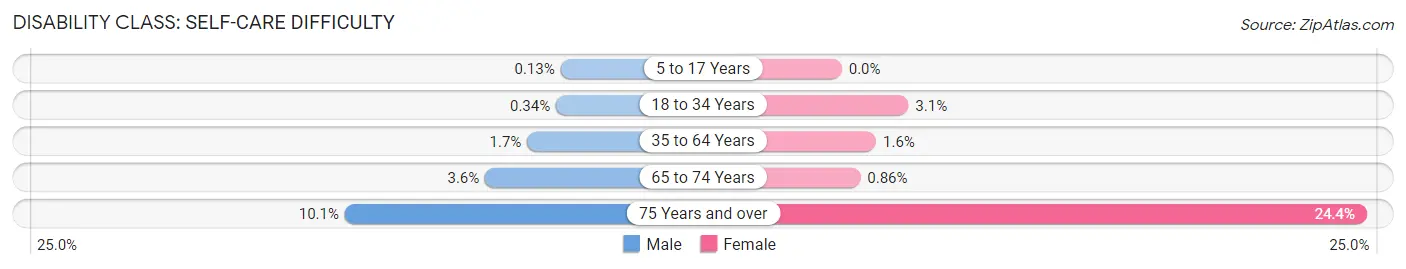
| Age Bracket | Male | Female |
| 5 to 17 Years | 4 (0.1%) | 0 (0.0%) |
| 18 to 34 Years | 8 (0.3%) | 78 (3.1%) |
| 35 to 64 Years | 104 (1.7%) | 102 (1.6%) |
| 65 to 74 Years | 43 (3.6%) | 8 (0.9%) |
| 75 Years and over | 73 (10.1%) | 219 (24.4%) |
Technology Access in Belmont
Computing Device Access in Belmont
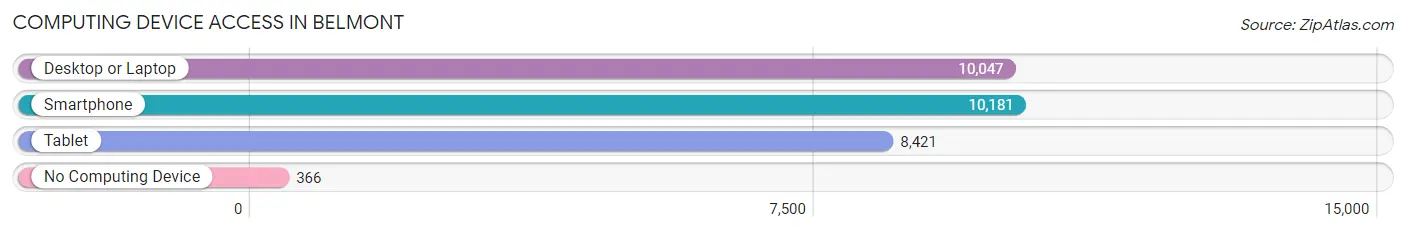
| Device Type | # Households | % Households |
| Desktop or Laptop | 10,047 | 92.9% |
| Smartphone | 10,181 | 94.2% |
| Tablet | 8,421 | 77.9% |
| No Computing Device | 366 | 3.4% |
| Total | 10,811 | 100.0% |
Internet Access in Belmont
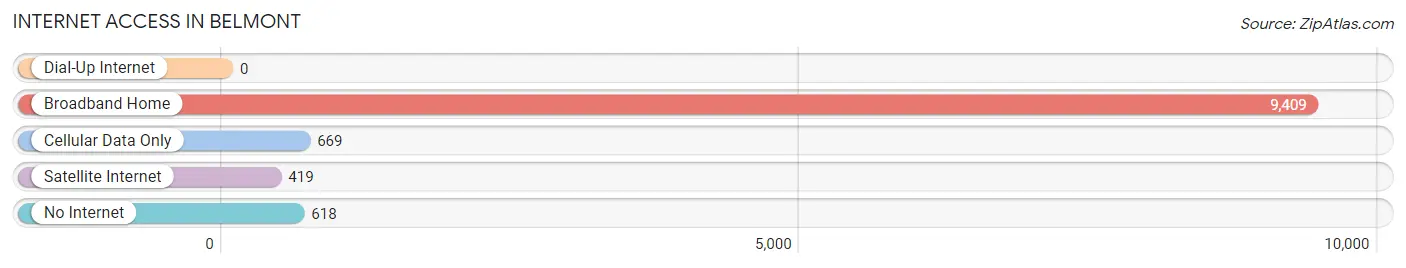
| Internet Type | # Households | % Households |
| Dial-Up Internet | 0 | 0.0% |
| Broadband Home | 9,409 | 87.0% |
| Cellular Data Only | 669 | 6.2% |
| Satellite Internet | 419 | 3.9% |
| No Internet | 618 | 5.7% |
| Total | 10,811 | 100.0% |
Belmont Summary
Belmont, California is a city located in San Mateo County, California, United States. It is situated in the San Francisco Bay Area, between San Carlos and San Mateo. The population of Belmont was 25,835 at the 2010 census.
Geography
Belmont is located at 37°31'N 122°17'W (37.5179, -122.2845). According to the United States Census Bureau, the city has a total area of 4.6 square miles (11.9 km2), all of it land.
Belmont is bordered by San Mateo to the north, San Carlos to the south, and Redwood City to the east. The San Francisco Bay lies to the northwest of the city.
History
Belmont was originally part of the Rancho de las Pulgas, a Mexican land grant dating back to 1839. The area was first settled in the 1850s by William Davis Merry Howard, who named the area after his hometown of Belmont, Massachusetts.
The city was incorporated in 1926 and the first mayor was elected in 1927
Economy
Belmont is home to a number of technology companies, including Oracle, Electronic Arts, and Symantec. The city is also home to a number of retail stores, restaurants, and other businesses.
Demographics
As of the 2010 census, Belmont had a population of 25,835. The racial makeup of the city was 61.2% White, 22.2% Asian, 8.3% Hispanic or Latino, 4.2% African American, 0.3% Native American, 0.1% Pacific Islander, and 3.8% from other races.
The median household income in Belmont was 101 872 in 2017 The median age was 43 7 years
Education
Belmont is served by the Belmont-Redwood Shores School District, which includes five elementary schools, two middle schools, and one high school. The city is also home to Notre Dame de Namur University, a private Catholic university.
Common Questions
What is Per Capita Income in Belmont?
Per Capita income in Belmont is $92,904.
What is the Median Family Income in Belmont?
Median Family Income in Belmont is $246,250.
What is the Median Household income in Belmont?
Median Household Income in Belmont is $185,944.
What is Income or Wage Gap in Belmont?
Income or Wage Gap in Belmont is 26.9%.
Women in Belmont earn 73.1 cents for every dollar earned by a man.
What is Inequality or Gini Index in Belmont?
Inequality or Gini Index in Belmont is 0.45.
What is the Total Population of Belmont?
Total Population of Belmont is 27,820.
What is the Total Male Population of Belmont?
Total Male Population of Belmont is 14,311.
What is the Total Female Population of Belmont?
Total Female Population of Belmont is 13,509.
What is the Ratio of Males per 100 Females in Belmont?
There are 105.94 Males per 100 Females in Belmont.
What is the Ratio of Females per 100 Males in Belmont?
There are 94.40 Females per 100 Males in Belmont.
What is the Median Population Age in Belmont?
Median Population Age in Belmont is 40.9 Years.
What is the Average Family Size in Belmont
Average Family Size in Belmont is 3.0 People.
What is the Average Household Size in Belmont
Average Household Size in Belmont is 2.5 People.
How Large is the Labor Force in Belmont?
There are 15,646 People in the Labor Forcein in Belmont.
What is the Percentage of People in the Labor Force in Belmont?
69.8% of People are in the Labor Force in Belmont.
What is the Unemployment Rate in Belmont?
Unemployment Rate in Belmont is 6.5%.