Zip Codes with the Highest Percentage of Population Employed in Architecture & Engineering in California
RELATED REPORTS & OPTIONS
Architecture & Engineering
California
Compare Zip Codes
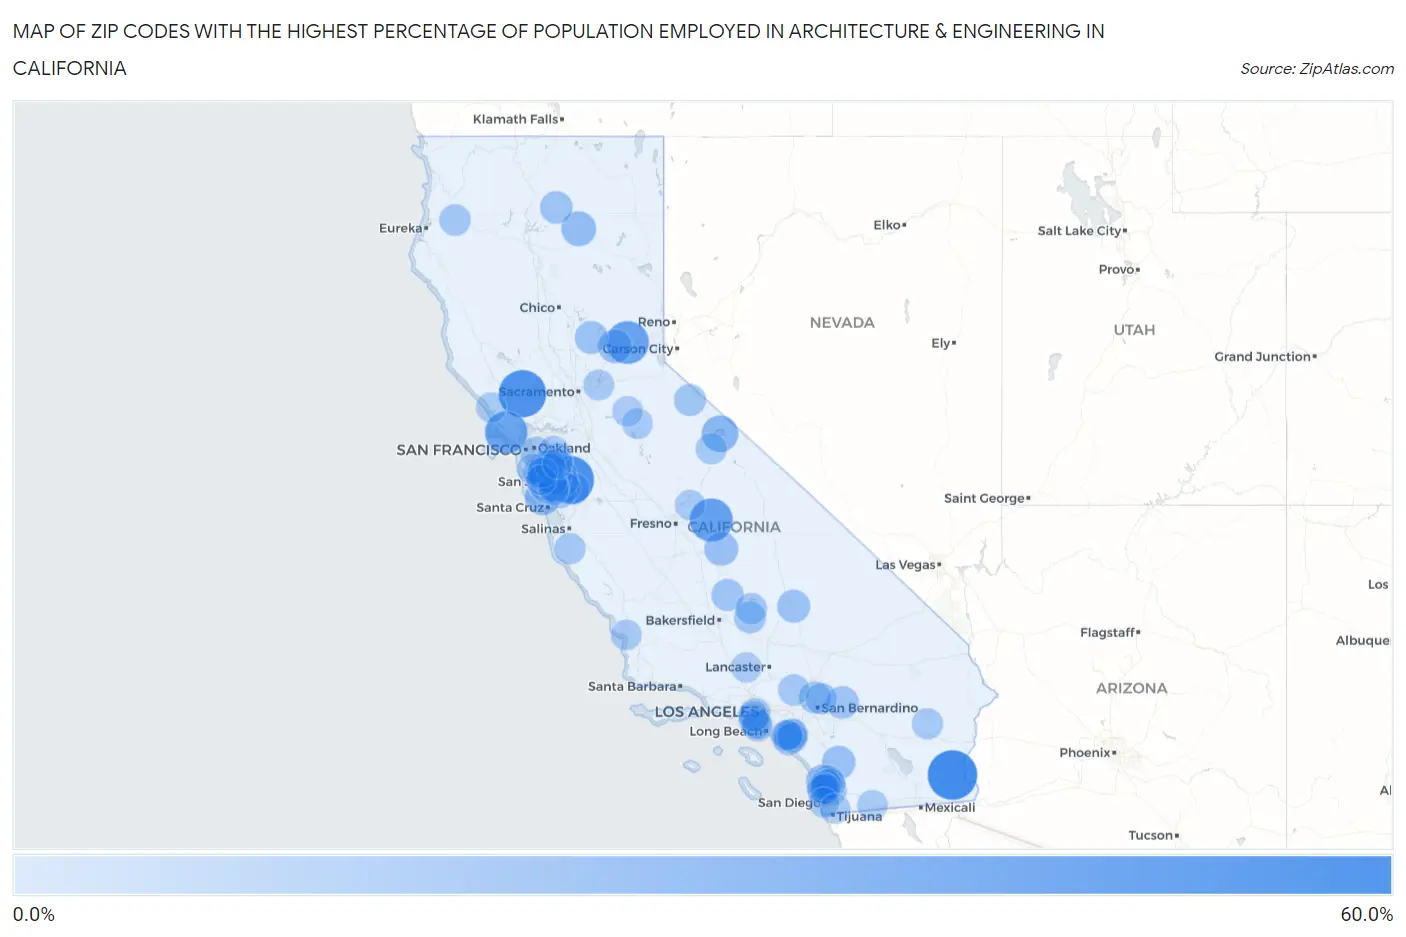
Map of Zip Codes with the Highest Percentage of Population Employed in Architecture & Engineering in California
0.0%
60.0%
Zip Codes with the Highest Percentage of Population Employed in Architecture & Engineering in California
| Zip Code | % Employed | vs State | vs National | |
| 1. | 92266 | 51.9% | 2.6%(+49.3)#1 | 2.1%(+49.7)#15 |
| 2. | 95140 | 48.0% | 2.6%(+45.4)#2 | 2.1%(+45.9)#19 |
| 3. | 94576 | 46.7% | 2.6%(+44.1)#3 | 2.1%(+44.5)#20 |
| 4. | 93621 | 36.5% | 2.6%(+34.0)#4 | 2.1%(+34.4)#37 |
| 5. | 95715 | 35.8% | 2.6%(+33.3)#5 | 2.1%(+33.7)#41 |
| 6. | 94950 | 34.8% | 2.6%(+32.2)#6 | 2.1%(+32.6)#46 |
| 7. | 93541 | 20.6% | 2.6%(+18.1)#7 | 2.1%(+18.5)#92 |
| 8. | 95007 | 17.7% | 2.6%(+15.2)#8 | 2.1%(+15.6)#116 |
| 9. | 96040 | 16.7% | 2.6%(+14.1)#9 | 2.1%(+14.5)#128 |
| 10. | 95134 | 16.5% | 2.6%(+14.0)#10 | 2.1%(+14.4)#130 |
| 11. | 93244 | 14.7% | 2.6%(+12.1)#11 | 2.1%(+12.5)#153 |
| 12. | 95714 | 14.4% | 2.6%(+11.8)#12 | 2.1%(+12.2)#160 |
| 13. | 95129 | 14.3% | 2.6%(+11.8)#13 | 2.1%(+12.2)#162 |
| 14. | 95014 | 14.0% | 2.6%(+11.4)#14 | 2.1%(+11.8)#174 |
| 15. | 95131 | 13.5% | 2.6%(+10.9)#15 | 2.1%(+11.4)#184 |
| 16. | 92061 | 13.4% | 2.6%(+10.8)#16 | 2.1%(+11.2)#187 |
| 17. | 92091 | 12.9% | 2.6%(+10.4)#17 | 2.1%(+10.8)#201 |
| 18. | 93555 | 12.4% | 2.6%(+9.88)#18 | 2.1%(+10.3)#221 |
| 19. | 95962 | 12.3% | 2.6%(+9.71)#19 | 2.1%(+10.1)#225 |
| 20. | 92305 | 11.9% | 2.6%(+9.33)#20 | 2.1%(+9.73)#247 |
| 21. | 94539 | 11.5% | 2.6%(+8.94)#21 | 2.1%(+9.35)#263 |
| 22. | 96011 | 11.4% | 2.6%(+8.87)#22 | 2.1%(+9.28)#267 |
| 23. | 94087 | 10.9% | 2.6%(+8.38)#23 | 2.1%(+8.78)#289 |
| 24. | 95113 | 10.9% | 2.6%(+8.32)#24 | 2.1%(+8.72)#291 |
| 25. | 92127 | 10.8% | 2.6%(+8.25)#25 | 2.1%(+8.66)#293 |
| 26. | 93287 | 10.5% | 2.6%(+7.97)#26 | 2.1%(+8.38)#312 |
| 27. | 95132 | 10.3% | 2.6%(+7.79)#27 | 2.1%(+8.19)#322 |
| 28. | 96107 | 10.3% | 2.6%(+7.72)#28 | 2.1%(+8.12)#325 |
| 29. | 92322 | 10.0% | 2.6%(+7.42)#29 | 2.1%(+7.82)#343 |
| 30. | 93518 | 9.7% | 2.6%(+7.19)#30 | 2.1%(+7.60)#361 |
| 31. | 95051 | 9.7% | 2.6%(+7.17)#31 | 2.1%(+7.57)#362 |
| 32. | 95133 | 9.6% | 2.6%(+7.04)#32 | 2.1%(+7.45)#370 |
| 33. | 95130 | 9.5% | 2.6%(+6.93)#33 | 2.1%(+7.34)#376 |
| 34. | 95573 | 9.2% | 2.6%(+6.65)#34 | 2.1%(+7.05)#395 |
| 35. | 93205 | 9.2% | 2.6%(+6.61)#35 | 2.1%(+7.02)#396 |
| 36. | 94086 | 9.1% | 2.6%(+6.57)#36 | 2.1%(+6.97)#400 |
| 37. | 95070 | 9.1% | 2.6%(+6.52)#37 | 2.1%(+6.92)#410 |
| 38. | 95135 | 9.0% | 2.6%(+6.46)#38 | 2.1%(+6.86)#417 |
| 39. | 95120 | 9.0% | 2.6%(+6.45)#39 | 2.1%(+6.86)#419 |
| 40. | 92397 | 9.0% | 2.6%(+6.40)#40 | 2.1%(+6.80)#425 |
| 41. | 95054 | 8.8% | 2.6%(+6.26)#41 | 2.1%(+6.66)#443 |
| 42. | 90232 | 8.8% | 2.6%(+6.23)#42 | 2.1%(+6.63)#445 |
| 43. | 95148 | 8.8% | 2.6%(+6.23)#43 | 2.1%(+6.63)#446 |
| 44. | 94502 | 8.7% | 2.6%(+6.17)#44 | 2.1%(+6.57)#456 |
| 45. | 94041 | 8.7% | 2.6%(+6.15)#45 | 2.1%(+6.55)#463 |
| 46. | 94024 | 8.6% | 2.6%(+6.06)#46 | 2.1%(+6.47)#473 |
| 47. | 92378 | 8.6% | 2.6%(+6.06)#47 | 2.1%(+6.46)#474 |
| 48. | 94555 | 8.5% | 2.6%(+5.90)#48 | 2.1%(+6.31)#489 |
| 49. | 92239 | 8.5% | 2.6%(+5.90)#49 | 2.1%(+6.30)#490 |
| 50. | 95110 | 8.3% | 2.6%(+5.78)#50 | 2.1%(+6.18)#510 |
| 51. | 92620 | 8.2% | 2.6%(+5.61)#51 | 2.1%(+6.02)#543 |
| 52. | 92131 | 8.2% | 2.6%(+5.60)#52 | 2.1%(+6.00)#547 |
| 53. | 93529 | 8.0% | 2.6%(+5.49)#53 | 2.1%(+5.89)#567 |
| 54. | 95035 | 8.0% | 2.6%(+5.45)#54 | 2.1%(+5.86)#571 |
| 55. | 93924 | 8.0% | 2.6%(+5.42)#55 | 2.1%(+5.82)#579 |
| 56. | 92128 | 7.9% | 2.6%(+5.33)#56 | 2.1%(+5.73)#590 |
| 57. | 92130 | 7.8% | 2.6%(+5.22)#57 | 2.1%(+5.63)#614 |
| 58. | 94040 | 7.7% | 2.6%(+5.12)#58 | 2.1%(+5.53)#625 |
| 59. | 94301 | 7.6% | 2.6%(+5.01)#59 | 2.1%(+5.42)#644 |
| 60. | 95008 | 7.5% | 2.6%(+4.99)#60 | 2.1%(+5.39)#649 |
| 61. | 94566 | 7.5% | 2.6%(+4.96)#61 | 2.1%(+5.36)#652 |
| 62. | 92121 | 7.5% | 2.6%(+4.96)#62 | 2.1%(+5.36)#654 |
| 63. | 92129 | 7.5% | 2.6%(+4.92)#63 | 2.1%(+5.33)#659 |
| 64. | 94306 | 7.4% | 2.6%(+4.89)#64 | 2.1%(+5.29)#664 |
| 65. | 94089 | 7.4% | 2.6%(+4.88)#65 | 2.1%(+5.28)#665 |
| 66. | 94085 | 7.4% | 2.6%(+4.85)#66 | 2.1%(+5.25)#673 |
| 67. | 92614 | 7.4% | 2.6%(+4.81)#67 | 2.1%(+5.21)#679 |
| 68. | 90245 | 7.4% | 2.6%(+4.80)#68 | 2.1%(+5.20)#682 |
| 69. | 94043 | 7.3% | 2.6%(+4.78)#69 | 2.1%(+5.19)#684 |
| 70. | 94582 | 7.3% | 2.6%(+4.76)#70 | 2.1%(+5.17)#689 |
| 71. | 95630 | 7.1% | 2.6%(+4.59)#71 | 2.1%(+4.99)#715 |
| 72. | 95138 | 7.1% | 2.6%(+4.57)#72 | 2.1%(+4.97)#721 |
| 73. | 92126 | 7.1% | 2.6%(+4.50)#73 | 2.1%(+4.90)#739 |
| 74. | 94027 | 7.0% | 2.6%(+4.49)#74 | 2.1%(+4.89)#742 |
| 75. | 95247 | 7.0% | 2.6%(+4.48)#75 | 2.1%(+4.88)#745 |
| 76. | 93449 | 7.0% | 2.6%(+4.45)#76 | 2.1%(+4.86)#749 |
| 77. | 90503 | 6.8% | 2.6%(+4.25)#77 | 2.1%(+4.66)#800 |
| 78. | 94538 | 6.8% | 2.6%(+4.24)#78 | 2.1%(+4.64)#802 |
| 79. | 94923 | 6.8% | 2.6%(+4.23)#79 | 2.1%(+4.64)#803 |
| 80. | 90094 | 6.8% | 2.6%(+4.21)#80 | 2.1%(+4.61)#809 |
| 81. | 92603 | 6.7% | 2.6%(+4.17)#81 | 2.1%(+4.57)#817 |
| 82. | 95117 | 6.7% | 2.6%(+4.15)#82 | 2.1%(+4.56)#823 |
| 83. | 91905 | 6.6% | 2.6%(+4.05)#83 | 2.1%(+4.46)#850 |
| 84. | 93532 | 6.6% | 2.6%(+4.02)#84 | 2.1%(+4.42)#861 |
| 85. | 95032 | 6.5% | 2.6%(+3.98)#85 | 2.1%(+4.39)#874 |
| 86. | 95050 | 6.4% | 2.6%(+3.89)#86 | 2.1%(+4.30)#908 |
| 87. | 94002 | 6.4% | 2.6%(+3.89)#87 | 2.1%(+4.30)#909 |
| 88. | 92101 | 6.4% | 2.6%(+3.89)#88 | 2.1%(+4.29)#913 |
| 89. | 92602 | 6.4% | 2.6%(+3.84)#89 | 2.1%(+4.25)#925 |
| 90. | 93651 | 6.4% | 2.6%(+3.84)#90 | 2.1%(+4.24)#927 |
| 91. | 94536 | 6.4% | 2.6%(+3.82)#91 | 2.1%(+4.22)#932 |
| 92. | 90278 | 6.3% | 2.6%(+3.78)#92 | 2.1%(+4.19)#945 |
| 93. | 95124 | 6.3% | 2.6%(+3.76)#93 | 2.1%(+4.17)#951 |
| 94. | 92618 | 6.3% | 2.6%(+3.76)#94 | 2.1%(+4.16)#952 |
| 95. | 95245 | 6.3% | 2.6%(+3.75)#95 | 2.1%(+4.16)#954 |
| 96. | 91913 | 6.3% | 2.6%(+3.74)#96 | 2.1%(+4.14)#960 |
| 97. | 94303 | 6.3% | 2.6%(+3.74)#97 | 2.1%(+4.14)#961 |
| 98. | 92606 | 6.3% | 2.6%(+3.72)#98 | 2.1%(+4.12)#968 |
| 99. | 94022 | 6.3% | 2.6%(+3.71)#99 | 2.1%(+4.11)#976 |
| 100. | 94586 | 6.2% | 2.6%(+3.64)#100 | 2.1%(+4.05)#1,003 |
Common Questions
What are the Top 10 Zip Codes with the Highest Percentage of Population Employed in Architecture & Engineering in California?
Top 10 Zip Codes with the Highest Percentage of Population Employed in Architecture & Engineering in California are:
What zip code has the Highest Percentage of Population Employed in Architecture & Engineering in California?
92266 has the Highest Percentage of Population Employed in Architecture & Engineering in California with 51.9%.
What is the Percentage of Population Employed in Architecture & Engineering in the State of California?
Percentage of Population Employed in Architecture & Engineering in California is 2.6%.
What is the Percentage of Population Employed in Architecture & Engineering in the United States?
Percentage of Population Employed in Architecture & Engineering in the United States is 2.1%.