Monte Sereno, CA Map & Demographics
Monte Sereno Map
Monte Sereno Overview
$157,911
PER CAPITA INCOME
$250,001
AVG FAMILY INCOME
$250,001
AVG HOUSEHOLD INCOME
57.8%
WAGE / INCOME GAP [ % ]
42.2¢/ $1
WAGE / INCOME GAP [ $ ]
0.49
INEQUALITY / GINI INDEX
3,444
TOTAL POPULATION
1,804
MALE POPULATION
1,640
FEMALE POPULATION
110.00
MALES / 100 FEMALES
90.91
FEMALES / 100 MALES
53.7
MEDIAN AGE
3.0
AVG FAMILY SIZE
2.7
AVG HOUSEHOLD SIZE
1,542
LABOR FORCE [ PEOPLE ]
52.9%
PERCENT IN LABOR FORCE
0.9%
UNEMPLOYMENT RATE
Income in Monte Sereno
Income Overview in Monte Sereno
Per Capita Income in Monte Sereno is $157,911, while median incomes of families and households are $250,001 and $250,001 respectively.
| Characteristic | Number | Measure |
| Per Capita Income | 3,444 | $157,911 |
| Median Family Income | 1,045 | $250,001 |
| Mean Family Income | 1,045 | $473,311 |
| Median Household Income | 1,270 | $250,001 |
| Mean Household Income | 1,270 | $422,996 |
| Income Deficit | 1,045 | $0 |
| Wage / Income Gap (%) | 3,444 | 57.77% |
| Wage / Income Gap ($) | 3,444 | 42.23¢ per $1 |
| Gini / Inequality Index | 3,444 | 0.49 |
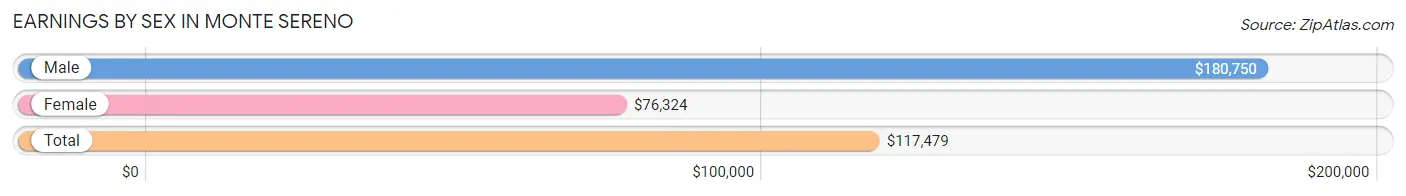
Earnings by Sex in Monte Sereno
Average Earnings in Monte Sereno are $117,479, $180,750 for men and $76,324 for women, a difference of 57.8%.
| Sex | Number | Average Earnings |
| Male | 997 (61.7%) | $180,750 |
| Female | 620 (38.3%) | $76,324 |
| Total | 1,617 (100.0%) | $117,479 |
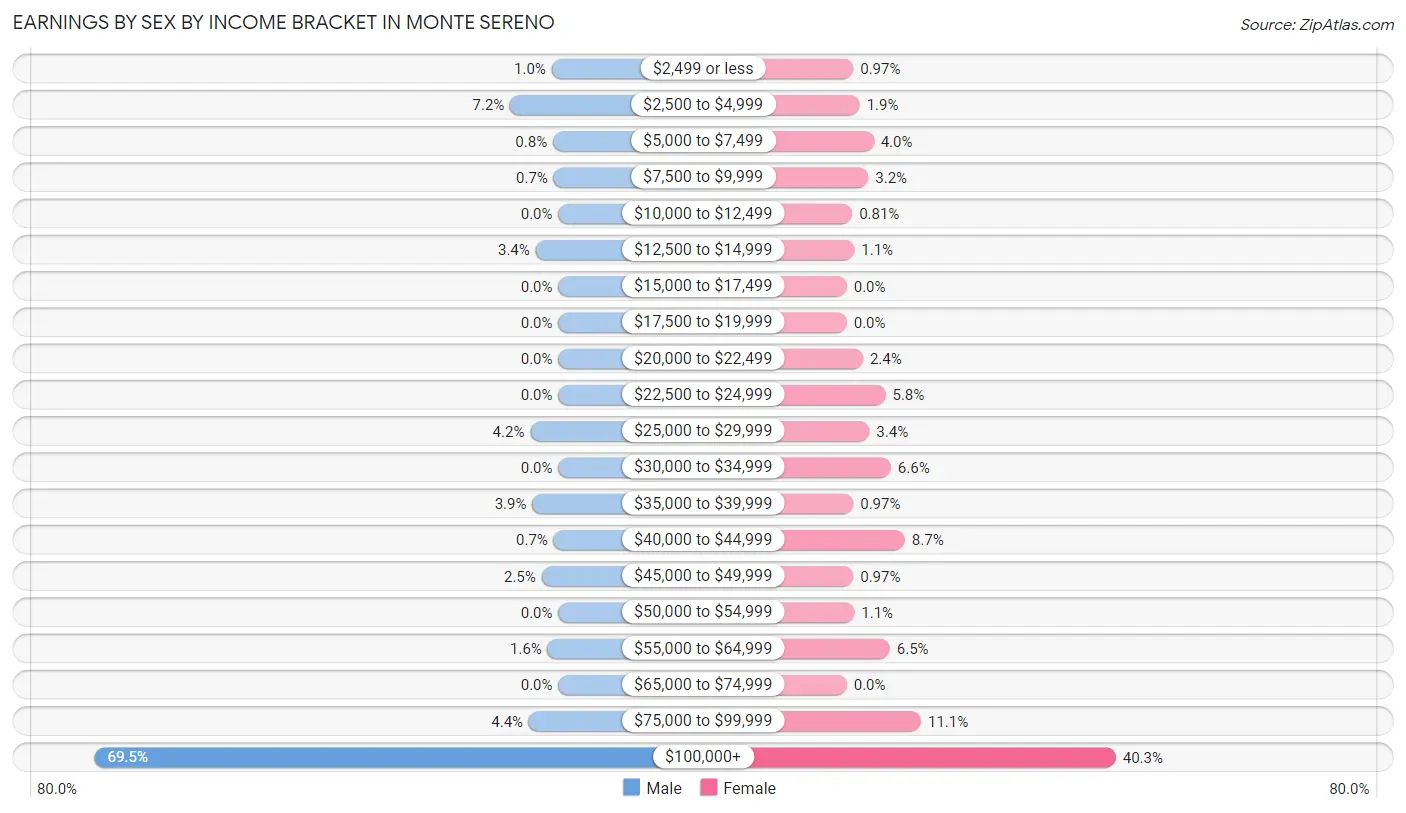
Earnings by Sex by Income Bracket in Monte Sereno
The most common earnings brackets in Monte Sereno are $100,000+ for men (693 | 69.5%) and $100,000+ for women (250 | 40.3%).
| Income | Male | Female |
| $2,499 or less | 10 (1.0%) | 6 (1.0%) |
| $2,500 to $4,999 | 72 (7.2%) | 12 (1.9%) |
| $5,000 to $7,499 | 8 (0.8%) | 25 (4.0%) |
| $7,500 to $9,999 | 7 (0.7%) | 20 (3.2%) |
| $10,000 to $12,499 | 0 (0.0%) | 5 (0.8%) |
| $12,500 to $14,999 | 34 (3.4%) | 7 (1.1%) |
| $15,000 to $17,499 | 0 (0.0%) | 0 (0.0%) |
| $17,500 to $19,999 | 0 (0.0%) | 0 (0.0%) |
| $20,000 to $22,499 | 0 (0.0%) | 15 (2.4%) |
| $22,500 to $24,999 | 0 (0.0%) | 36 (5.8%) |
| $25,000 to $29,999 | 42 (4.2%) | 21 (3.4%) |
| $30,000 to $34,999 | 0 (0.0%) | 41 (6.6%) |
| $35,000 to $39,999 | 39 (3.9%) | 6 (1.0%) |
| $40,000 to $44,999 | 7 (0.7%) | 54 (8.7%) |
| $45,000 to $49,999 | 25 (2.5%) | 6 (1.0%) |
| $50,000 to $54,999 | 0 (0.0%) | 7 (1.1%) |
| $55,000 to $64,999 | 16 (1.6%) | 40 (6.5%) |
| $65,000 to $74,999 | 0 (0.0%) | 0 (0.0%) |
| $75,000 to $99,999 | 44 (4.4%) | 69 (11.1%) |
| $100,000+ | 693 (69.5%) | 250 (40.3%) |
| Total | 997 (100.0%) | 620 (100.0%) |
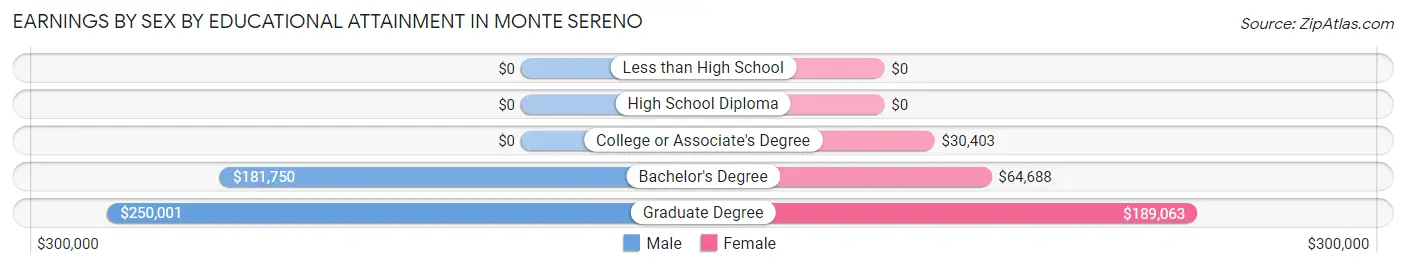
Earnings by Sex by Educational Attainment in Monte Sereno
Average earnings in Monte Sereno are $232,813 for men and $80,164 for women, a difference of 65.6%. Men with an educational attainment of graduate degree enjoy the highest average annual earnings of $250,001, while those with bachelor's degree education earn the least with $181,750. Women with an educational attainment of graduate degree earn the most with the average annual earnings of $189,063, while those with college or associate's degree education have the smallest earnings of $30,403.
| Educational Attainment | Male Income | Female Income |
| Less than High School | - | - |
| High School Diploma | - | - |
| College or Associate's Degree | - | - |
| Bachelor's Degree | $181,750 | $64,688 |
| Graduate Degree | $250,001 | $189,063 |
| Total | $232,813 | $80,164 |
Family Income in Monte Sereno
Family Income Brackets in Monte Sereno
According to the Monte Sereno family income data, there are 701 families falling into the $200,000+ income range, which is the most common income bracket and makes up 67.1% of all families. Conversely, the $10,000 to $14,999 income bracket is the least frequent group with only 3 families (0.3%) belonging to this category.
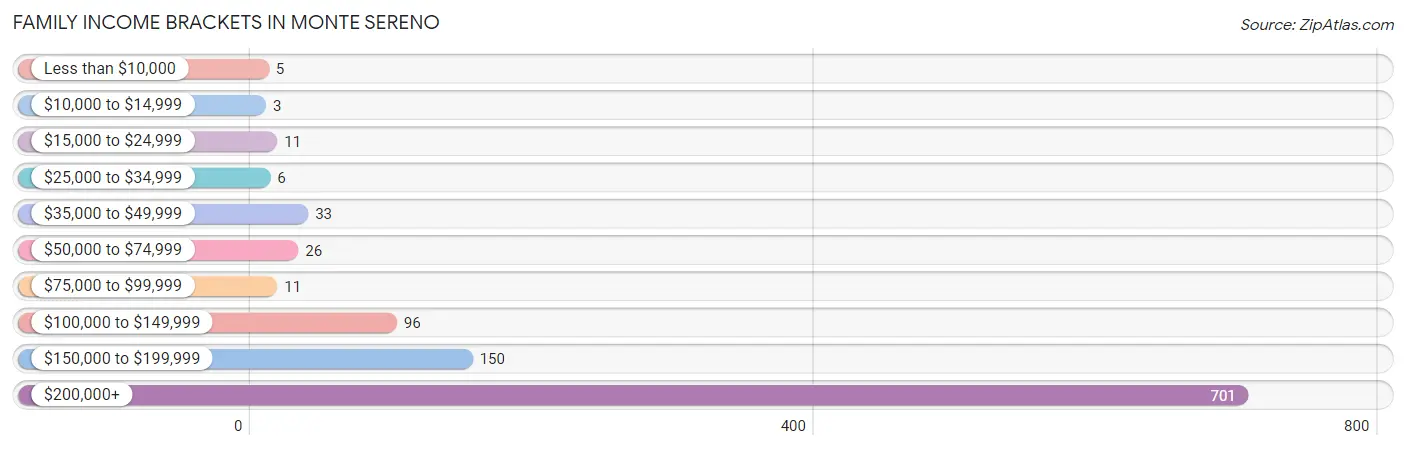
| Income Bracket | # Families | % Families |
| Less than $10,000 | 5 | 0.5% |
| $10,000 to $14,999 | 3 | 0.3% |
| $15,000 to $24,999 | 11 | 1.1% |
| $25,000 to $34,999 | 6 | 0.6% |
| $35,000 to $49,999 | 33 | 3.2% |
| $50,000 to $74,999 | 26 | 2.5% |
| $75,000 to $99,999 | 11 | 1.1% |
| $100,000 to $149,999 | 96 | 9.2% |
| $150,000 to $199,999 | 150 | 14.4% |
| $200,000+ | 701 | 67.1% |
Family Income by Famaliy Size in Monte Sereno
2-person families (453 | 43.3%) account for the highest median family income in Monte Sereno with $250,001 per family, while 2-person families (453 | 43.3%) have the highest median income of $125,000 per family member.
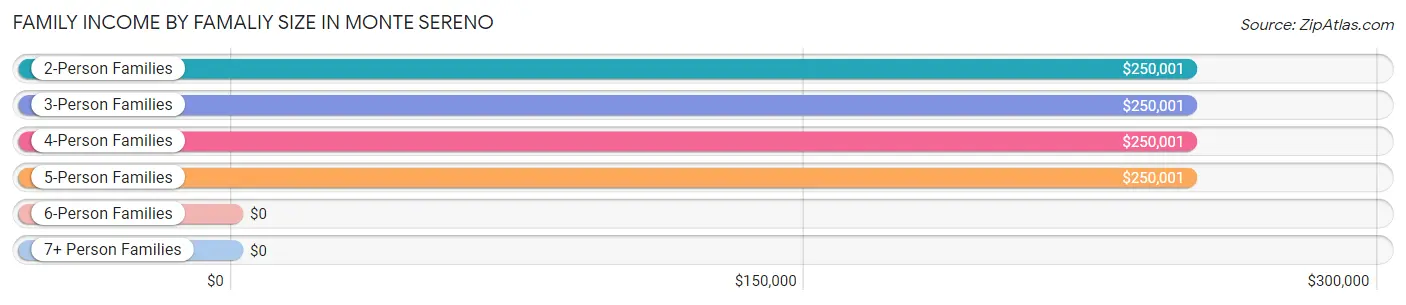
| Income Bracket | # Families | Median Income |
| 2-Person Families | 453 (43.3%) | $250,001 |
| 3-Person Families | 307 (29.4%) | $250,001 |
| 4-Person Families | 222 (21.2%) | $250,001 |
| 5-Person Families | 53 (5.1%) | $250,001 |
| 6-Person Families | 10 (1.0%) | $0 |
| 7+ Person Families | 0 (0.0%) | $0 |
| Total | 1,045 (100.0%) | $250,001 |
Family Income by Number of Earners in Monte Sereno
The median family income in Monte Sereno is $250,001, with families comprising 1 earner (357) having the highest median family income of $250,001, while families with no earners (182) have the lowest median family income of $161,250, accounting for 34.2% and 17.4% of families, respectively.
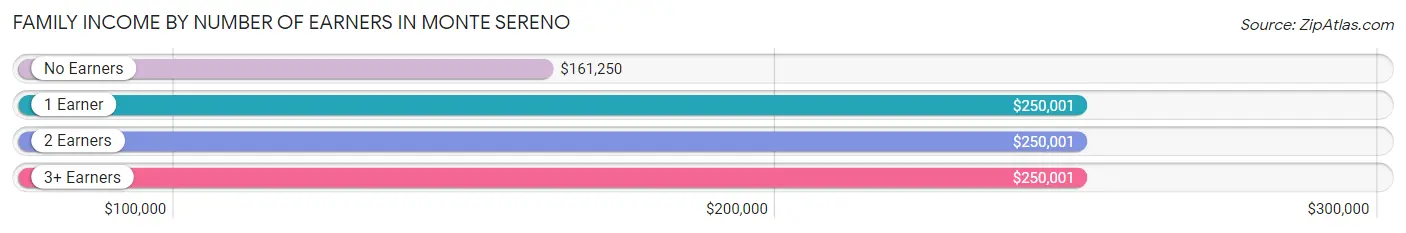
| Number of Earners | # Families | Median Income |
| No Earners | 182 (17.4%) | $161,250 |
| 1 Earner | 357 (34.2%) | $250,001 |
| 2 Earners | 399 (38.2%) | $250,001 |
| 3+ Earners | 107 (10.2%) | $250,001 |
| Total | 1,045 (100.0%) | $250,001 |
Household Income in Monte Sereno
Household Income Brackets in Monte Sereno
With 773 households falling in the category, the $200,000+ income range is the most frequent in Monte Sereno, accounting for 60.9% of all households. In contrast, only 3 households (0.2%) fall into the $10,000 to $14,999 income bracket, making it the least populous group.
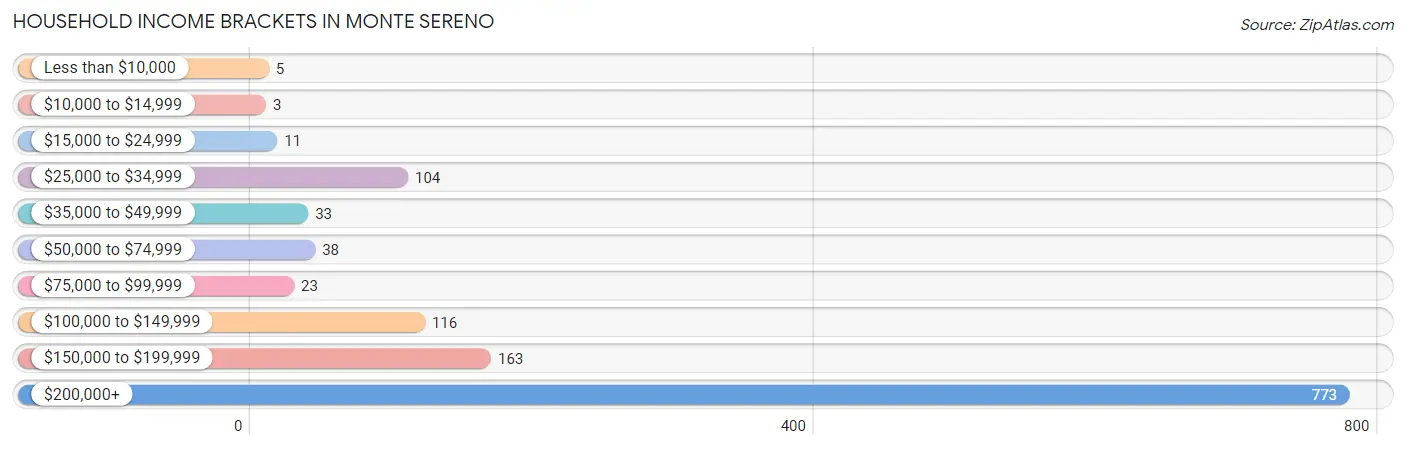
| Income Bracket | # Households | % Households |
| Less than $10,000 | 5 | 0.4% |
| $10,000 to $14,999 | 3 | 0.2% |
| $15,000 to $24,999 | 11 | 0.9% |
| $25,000 to $34,999 | 104 | 8.2% |
| $35,000 to $49,999 | 33 | 2.6% |
| $50,000 to $74,999 | 38 | 3.0% |
| $75,000 to $99,999 | 23 | 1.8% |
| $100,000 to $149,999 | 116 | 9.1% |
| $150,000 to $199,999 | 163 | 12.8% |
| $200,000+ | 773 | 60.9% |
Household Income by Householder Age in Monte Sereno
The median household income in Monte Sereno is $250,001, with the highest median household income of $250,001 found in the 45 to 64 years age bracket for the primary householder. A total of 613 households (48.3%) fall into this category.
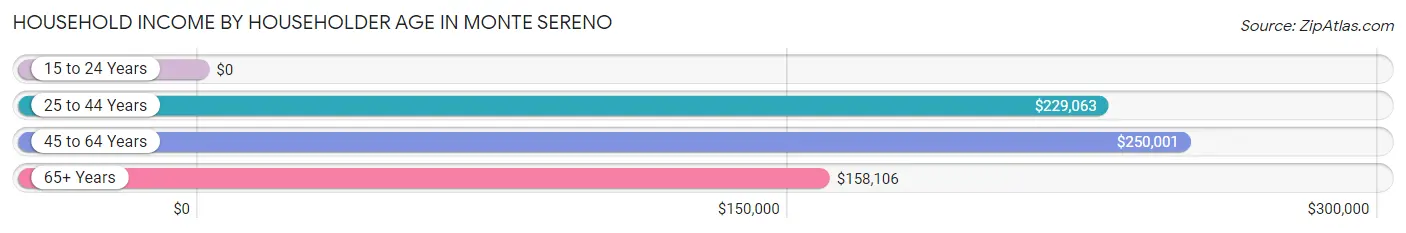
| Income Bracket | # Households | Median Income |
| 15 to 24 Years | 0 (0.0%) | $0 |
| 25 to 44 Years | 91 (7.2%) | $229,063 |
| 45 to 64 Years | 613 (48.3%) | $250,001 |
| 65+ Years | 566 (44.6%) | $158,106 |
| Total | 1,270 (100.0%) | $250,001 |
Poverty in Monte Sereno
Income Below Poverty by Sex and Age in Monte Sereno
With 0.3% poverty level for males and 1.0% for females among the residents of Monte Sereno, 55 to 64 year old males and 55 to 64 year old females are the most vulnerable to poverty, with 5 males (1.4%) and 8 females (2.3%) in their respective age groups living below the poverty level.
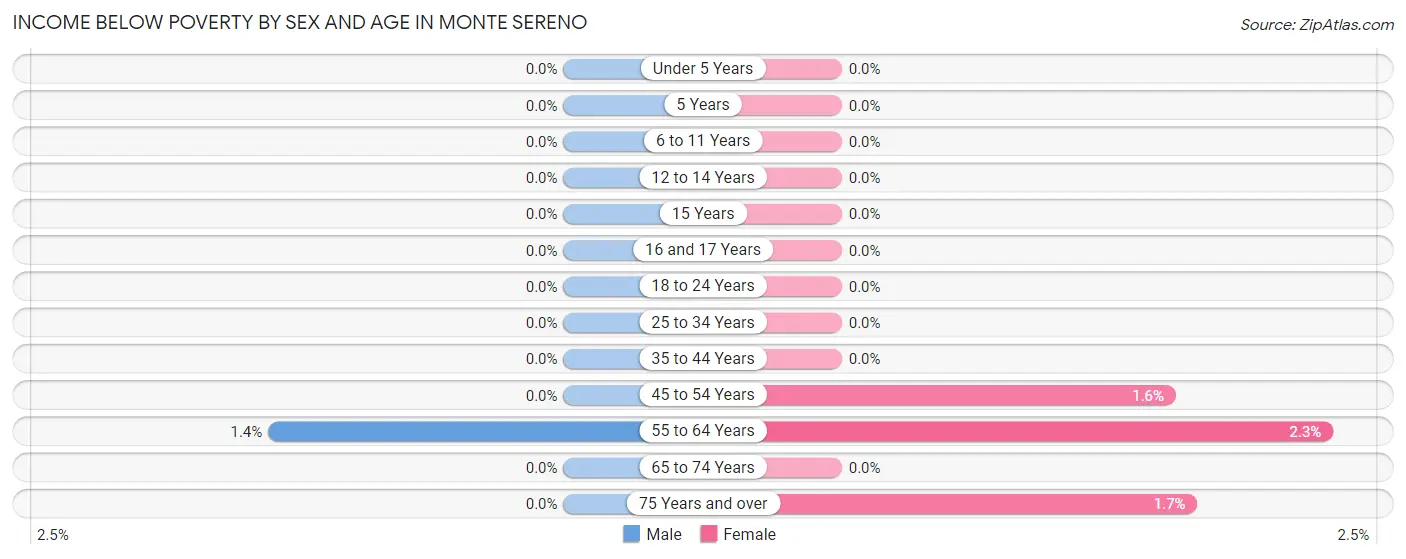
| Age Bracket | Male | Female |
| Under 5 Years | 0 (0.0%) | 0 (0.0%) |
| 5 Years | 0 (0.0%) | 0 (0.0%) |
| 6 to 11 Years | 0 (0.0%) | 0 (0.0%) |
| 12 to 14 Years | 0 (0.0%) | 0 (0.0%) |
| 15 Years | 0 (0.0%) | 0 (0.0%) |
| 16 and 17 Years | 0 (0.0%) | 0 (0.0%) |
| 18 to 24 Years | 0 (0.0%) | 0 (0.0%) |
| 25 to 34 Years | 0 (0.0%) | 0 (0.0%) |
| 35 to 44 Years | 0 (0.0%) | 0 (0.0%) |
| 45 to 54 Years | 0 (0.0%) | 5 (1.5%) |
| 55 to 64 Years | 5 (1.4%) | 8 (2.3%) |
| 65 to 74 Years | 0 (0.0%) | 0 (0.0%) |
| 75 Years and over | 0 (0.0%) | 3 (1.7%) |
| Total | 5 (0.3%) | 16 (1.0%) |
Income Above Poverty by Sex and Age in Monte Sereno
According to the poverty statistics in Monte Sereno, males aged under 5 years and females aged under 5 years are the age groups that are most secure financially, with 100.0% of males and 100.0% of females in these age groups living above the poverty line.
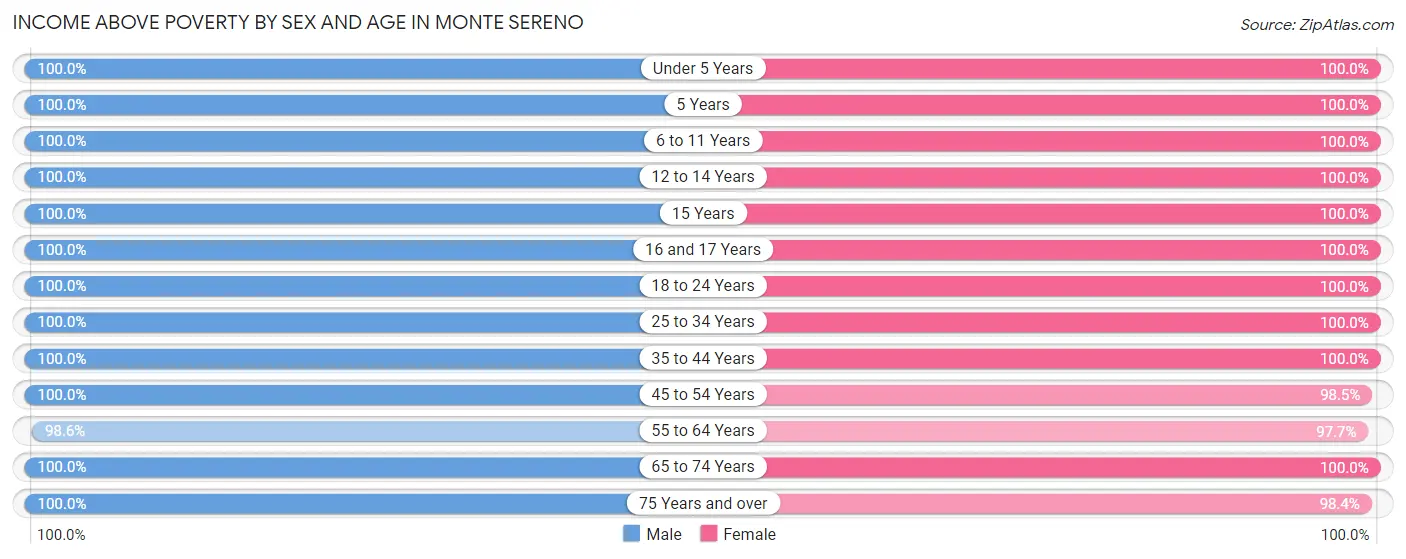
| Age Bracket | Male | Female |
| Under 5 Years | 7 (100.0%) | 14 (100.0%) |
| 5 Years | 15 (100.0%) | 28 (100.0%) |
| 6 to 11 Years | 116 (100.0%) | 84 (100.0%) |
| 12 to 14 Years | 79 (100.0%) | 82 (100.0%) |
| 15 Years | 69 (100.0%) | 16 (100.0%) |
| 16 and 17 Years | 21 (100.0%) | 32 (100.0%) |
| 18 to 24 Years | 185 (100.0%) | 37 (100.0%) |
| 25 to 34 Years | 133 (100.0%) | 73 (100.0%) |
| 35 to 44 Years | 114 (100.0%) | 107 (100.0%) |
| 45 to 54 Years | 261 (100.0%) | 317 (98.5%) |
| 55 to 64 Years | 361 (98.6%) | 343 (97.7%) |
| 65 to 74 Years | 207 (100.0%) | 293 (100.0%) |
| 75 Years and over | 231 (100.0%) | 179 (98.4%) |
| Total | 1,799 (99.7%) | 1,605 (99.0%) |
Income Below Poverty Among Married-Couple Families in Monte Sereno
The poverty statistics for married-couple families in Monte Sereno show that 0.5% or 5 of the total 928 families live below the poverty line. Families with no children have the highest poverty rate of 0.8%, comprising of 5 families. On the other hand, families with 1 or 2 children have the lowest poverty rate of 0.0%, which includes 0 families.
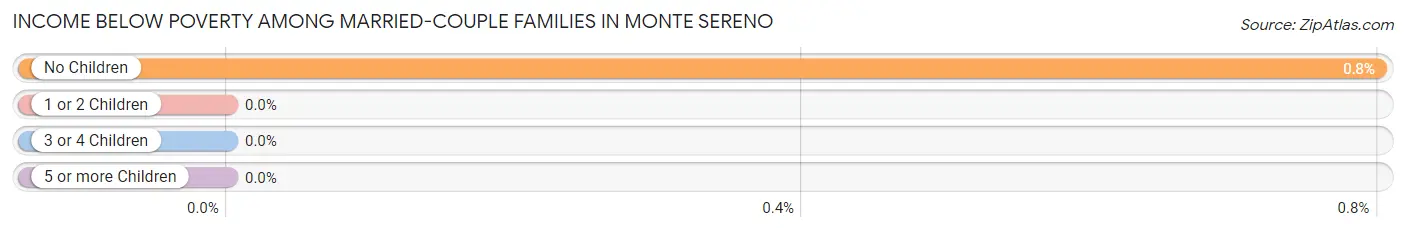
| Children | Above Poverty | Below Poverty |
| No Children | 622 (99.2%) | 5 (0.8%) |
| 1 or 2 Children | 280 (100.0%) | 0 (0.0%) |
| 3 or 4 Children | 21 (100.0%) | 0 (0.0%) |
| 5 or more Children | 0 (0.0%) | 0 (0.0%) |
| Total | 923 (99.5%) | 5 (0.5%) |
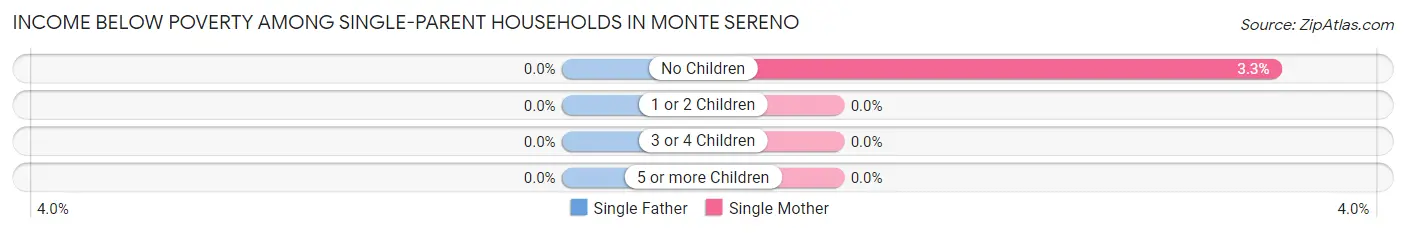
Income Below Poverty Among Single-Parent Households in Monte Sereno
| Children | Single Father | Single Mother |
| No Children | 0 (0.0%) | 3 (3.3%) |
| 1 or 2 Children | 0 (0.0%) | 0 (0.0%) |
| 3 or 4 Children | 0 (0.0%) | 0 (0.0%) |
| 5 or more Children | 0 (0.0%) | 0 (0.0%) |
| Total | 0 (0.0%) | 3 (2.8%) |
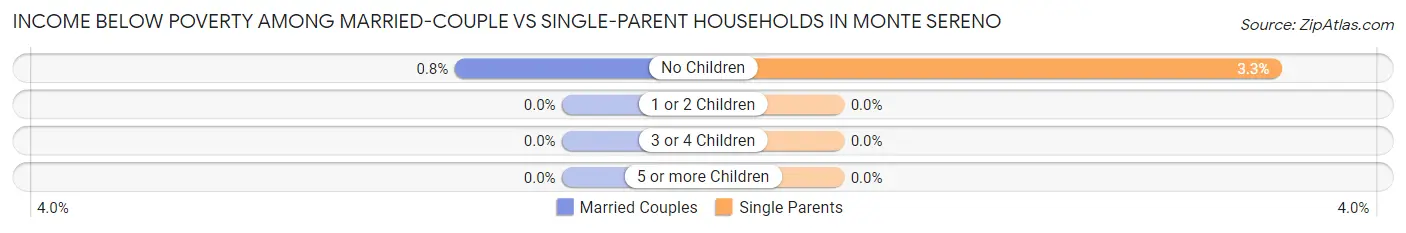
Income Below Poverty Among Married-Couple vs Single-Parent Households in Monte Sereno
The poverty data for Monte Sereno shows that 5 of the married-couple family households (0.5%) and 3 of the single-parent households (2.6%) are living below the poverty level. Within the married-couple family households, those with no children have the highest poverty rate, with 5 households (0.8%) falling below the poverty line. Among the single-parent households, those with no children have the highest poverty rate, with 3 household (3.3%) living below poverty.
| Children | Married-Couple Families | Single-Parent Households |
| No Children | 5 (0.8%) | 3 (3.3%) |
| 1 or 2 Children | 0 (0.0%) | 0 (0.0%) |
| 3 or 4 Children | 0 (0.0%) | 0 (0.0%) |
| 5 or more Children | 0 (0.0%) | 0 (0.0%) |
| Total | 5 (0.5%) | 3 (2.6%) |
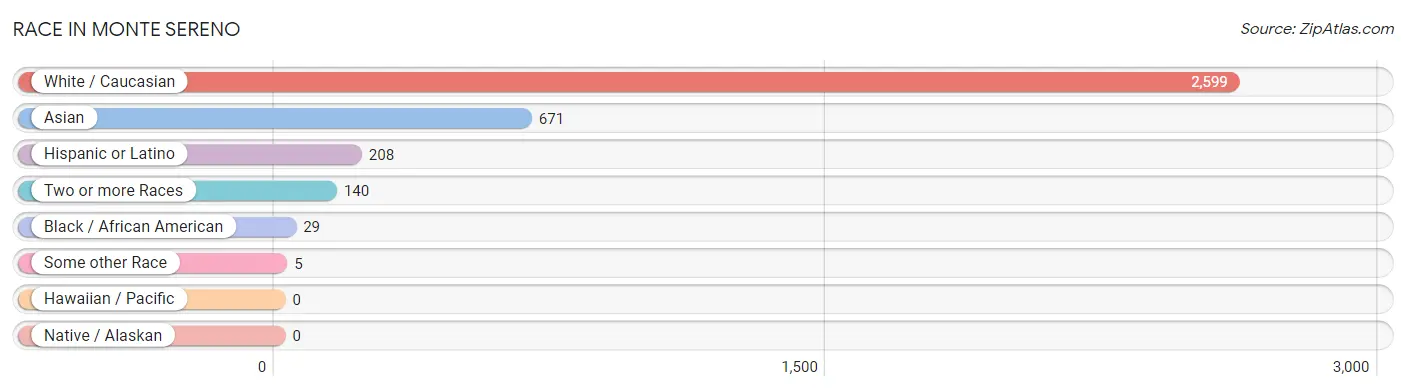
Race in Monte Sereno
The most populous races in Monte Sereno are White / Caucasian (2,599 | 75.5%), Asian (671 | 19.5%), and Hispanic or Latino (208 | 6.0%).
| Race | # Population | % Population |
| Asian | 671 | 19.5% |
| Black / African American | 29 | 0.8% |
| Hawaiian / Pacific | 0 | 0.0% |
| Hispanic or Latino | 208 | 6.0% |
| Native / Alaskan | 0 | 0.0% |
| White / Caucasian | 2,599 | 75.5% |
| Two or more Races | 140 | 4.1% |
| Some other Race | 5 | 0.2% |
| Total | 3,444 | 100.0% |
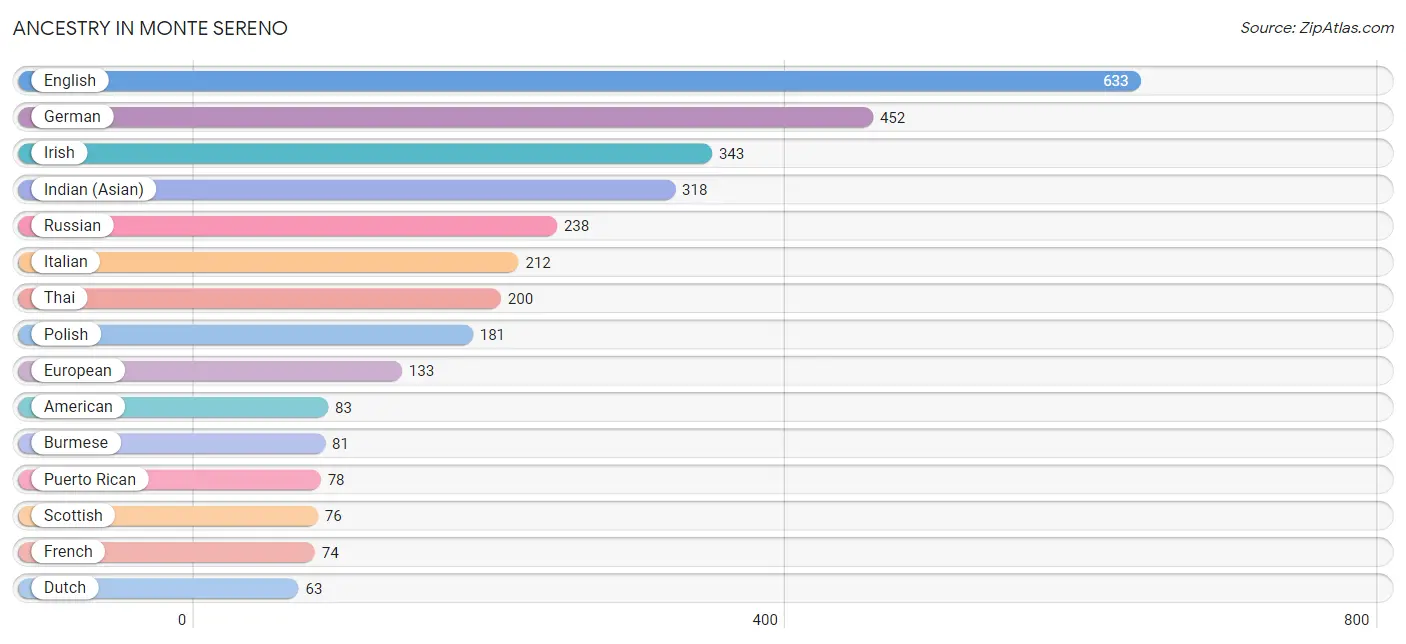
Ancestry in Monte Sereno
The most populous ancestries reported in Monte Sereno are English (633 | 18.4%), German (452 | 13.1%), Irish (343 | 10.0%), Indian (Asian) (318 | 9.2%), and Russian (238 | 6.9%), together accounting for 57.6% of all Monte Sereno residents.
| Ancestry | # Population | % Population |
| American | 83 | 2.4% |
| Arab | 26 | 0.7% |
| Argentinean | 38 | 1.1% |
| Armenian | 11 | 0.3% |
| Austrian | 23 | 0.7% |
| Belgian | 12 | 0.4% |
| Bhutanese | 34 | 1.0% |
| British | 22 | 0.6% |
| Burmese | 81 | 2.4% |
| Canadian | 12 | 0.4% |
| Croatian | 11 | 0.3% |
| Dutch | 63 | 1.8% |
| Eastern European | 6 | 0.2% |
| English | 633 | 18.4% |
| European | 133 | 3.9% |
| Filipino | 47 | 1.4% |
| French | 74 | 2.1% |
| German | 452 | 13.1% |
| Greek | 13 | 0.4% |
| Hungarian | 10 | 0.3% |
| Indian (Asian) | 318 | 9.2% |
| Iranian | 30 | 0.9% |
| Irish | 343 | 10.0% |
| Italian | 212 | 6.2% |
| Korean | 16 | 0.5% |
| Latvian | 7 | 0.2% |
| Lebanese | 26 | 0.7% |
| Lithuanian | 33 | 1.0% |
| Mexican | 61 | 1.8% |
| Northern European | 37 | 1.1% |
| Norwegian | 10 | 0.3% |
| Pakistani | 31 | 0.9% |
| Polish | 181 | 5.3% |
| Portuguese | 12 | 0.4% |
| Puerto Rican | 78 | 2.3% |
| Romanian | 6 | 0.2% |
| Russian | 238 | 6.9% |
| Scandinavian | 29 | 0.8% |
| Scotch-Irish | 13 | 0.4% |
| Scottish | 76 | 2.2% |
| Slovak | 6 | 0.2% |
| South American | 38 | 1.1% |
| Spaniard | 6 | 0.2% |
| Spanish | 13 | 0.4% |
| Sri Lankan | 10 | 0.3% |
| Swedish | 18 | 0.5% |
| Swiss | 7 | 0.2% |
| Thai | 200 | 5.8% |
| Turkish | 29 | 0.8% |
| Ukrainian | 24 | 0.7% |
| Welsh | 32 | 0.9% | View All 51 Rows |
Immigrants in Monte Sereno
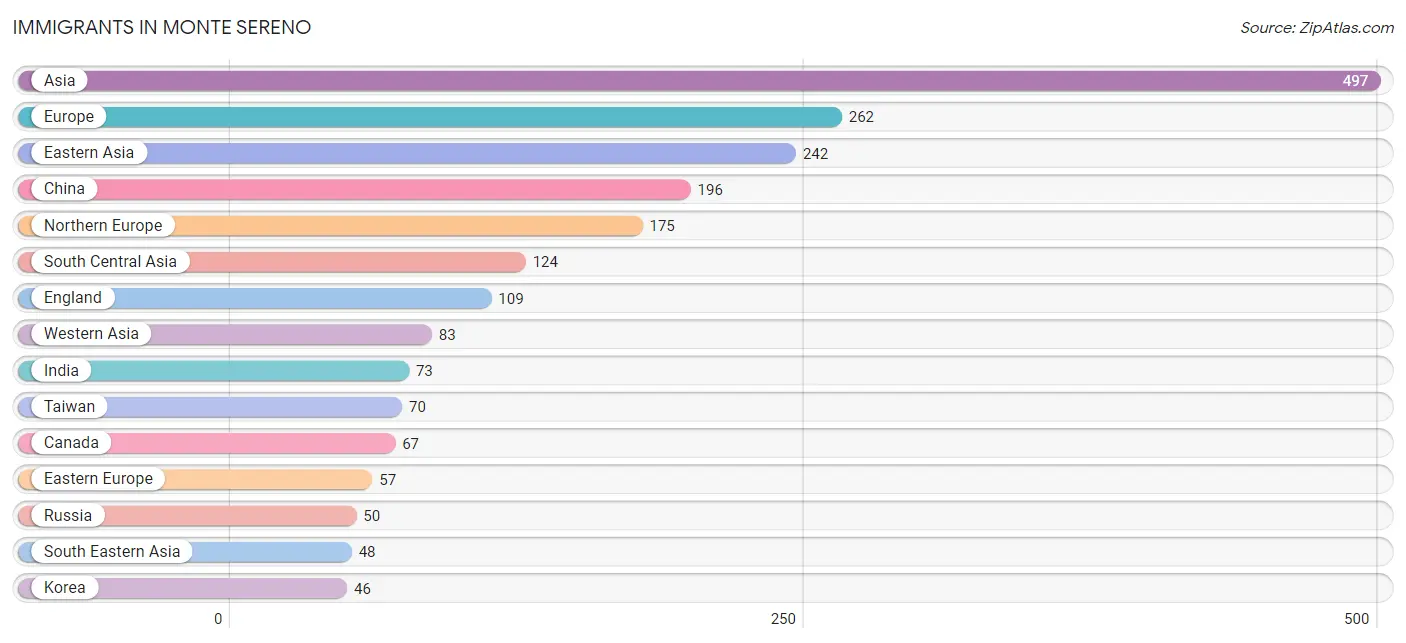
The most numerous immigrant groups reported in Monte Sereno came from Asia (497 | 14.4%), Europe (262 | 7.6%), Eastern Asia (242 | 7.0%), China (196 | 5.7%), and Northern Europe (175 | 5.1%), together accounting for 39.8% of all Monte Sereno residents.
| Immigration Origin | # Population | % Population |
| Africa | 28 | 0.8% |
| Asia | 497 | 14.4% |
| Canada | 67 | 1.9% |
| Central America | 17 | 0.5% |
| China | 196 | 5.7% |
| Eastern Africa | 22 | 0.6% |
| Eastern Asia | 242 | 7.0% |
| Eastern Europe | 57 | 1.7% |
| England | 109 | 3.2% |
| Europe | 262 | 7.6% |
| France | 6 | 0.2% |
| Germany | 5 | 0.2% |
| Greece | 6 | 0.2% |
| Hong Kong | 6 | 0.2% |
| India | 73 | 2.1% |
| Indonesia | 9 | 0.3% |
| Iran | 10 | 0.3% |
| Italy | 7 | 0.2% |
| Korea | 46 | 1.3% |
| Latin America | 17 | 0.5% |
| Latvia | 7 | 0.2% |
| Lebanon | 23 | 0.7% |
| Mexico | 17 | 0.5% |
| Northern Europe | 175 | 5.1% |
| Pakistan | 41 | 1.2% |
| Philippines | 5 | 0.2% |
| Russia | 50 | 1.5% |
| Singapore | 8 | 0.2% |
| South Africa | 6 | 0.2% |
| South Central Asia | 124 | 3.6% |
| South Eastern Asia | 48 | 1.4% |
| Southern Europe | 19 | 0.5% |
| Spain | 6 | 0.2% |
| Taiwan | 70 | 2.0% |
| Thailand | 16 | 0.5% |
| Turkey | 29 | 0.8% |
| Vietnam | 10 | 0.3% |
| Western Asia | 83 | 2.4% |
| Western Europe | 11 | 0.3% |
| Zimbabwe | 22 | 0.6% | View All 40 Rows |
Sex and Age in Monte Sereno
Sex and Age in Monte Sereno
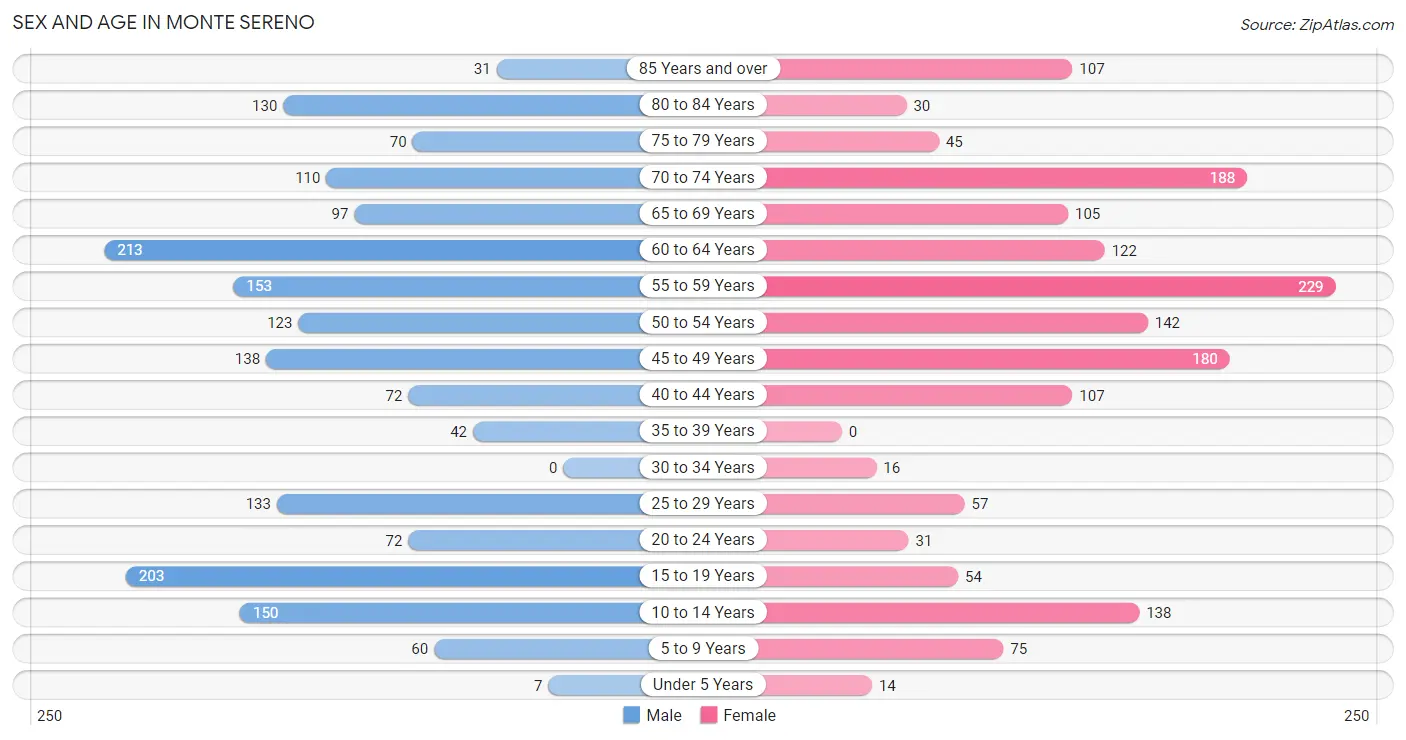
The most populous age groups in Monte Sereno are 60 to 64 Years (213 | 11.8%) for men and 55 to 59 Years (229 | 14.0%) for women.
| Age Bracket | Male | Female |
| Under 5 Years | 7 (0.4%) | 14 (0.9%) |
| 5 to 9 Years | 60 (3.3%) | 75 (4.6%) |
| 10 to 14 Years | 150 (8.3%) | 138 (8.4%) |
| 15 to 19 Years | 203 (11.3%) | 54 (3.3%) |
| 20 to 24 Years | 72 (4.0%) | 31 (1.9%) |
| 25 to 29 Years | 133 (7.4%) | 57 (3.5%) |
| 30 to 34 Years | 0 (0.0%) | 16 (1.0%) |
| 35 to 39 Years | 42 (2.3%) | 0 (0.0%) |
| 40 to 44 Years | 72 (4.0%) | 107 (6.5%) |
| 45 to 49 Years | 138 (7.6%) | 180 (11.0%) |
| 50 to 54 Years | 123 (6.8%) | 142 (8.7%) |
| 55 to 59 Years | 153 (8.5%) | 229 (14.0%) |
| 60 to 64 Years | 213 (11.8%) | 122 (7.4%) |
| 65 to 69 Years | 97 (5.4%) | 105 (6.4%) |
| 70 to 74 Years | 110 (6.1%) | 188 (11.5%) |
| 75 to 79 Years | 70 (3.9%) | 45 (2.7%) |
| 80 to 84 Years | 130 (7.2%) | 30 (1.8%) |
| 85 Years and over | 31 (1.7%) | 107 (6.5%) |
| Total | 1,804 (100.0%) | 1,640 (100.0%) |
Families and Households in Monte Sereno
Median Family Size in Monte Sereno
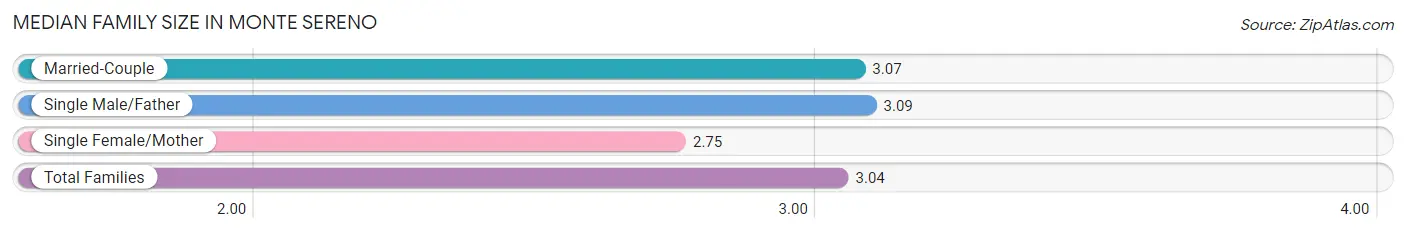
The median family size in Monte Sereno is 3.04 persons per family, with single male/father families (11 | 1.1%) accounting for the largest median family size of 3.09 persons per family. On the other hand, single female/mother families (106 | 10.1%) represent the smallest median family size with 2.75 persons per family.
| Family Type | # Families | Family Size |
| Married-Couple | 928 (88.8%) | 3.07 |
| Single Male/Father | 11 (1.1%) | 3.09 |
| Single Female/Mother | 106 (10.1%) | 2.75 |
| Total Families | 1,045 (100.0%) | 3.04 |
Median Household Size in Monte Sereno
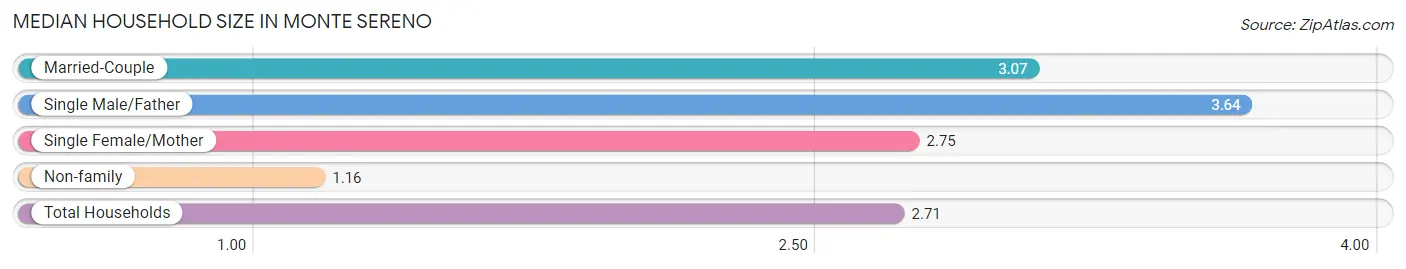
The median household size in Monte Sereno is 2.71 persons per household, with single male/father households (11 | 0.9%) accounting for the largest median household size of 3.64 persons per household. non-family households (225 | 17.7%) represent the smallest median household size with 1.16 persons per household.
| Household Type | # Households | Household Size |
| Married-Couple | 928 (73.1%) | 3.07 |
| Single Male/Father | 11 (0.9%) | 3.64 |
| Single Female/Mother | 106 (8.4%) | 2.75 |
| Non-family | 225 (17.7%) | 1.16 |
| Total Households | 1,270 (100.0%) | 2.71 |
Household Size by Marriage Status in Monte Sereno
Out of a total of 1,270 households in Monte Sereno, 1,045 (82.3%) are family households, while 225 (17.7%) are nonfamily households. The most numerous type of family households are 2-person households, comprising 453, and the most common type of nonfamily households are 1-person households, comprising 211.
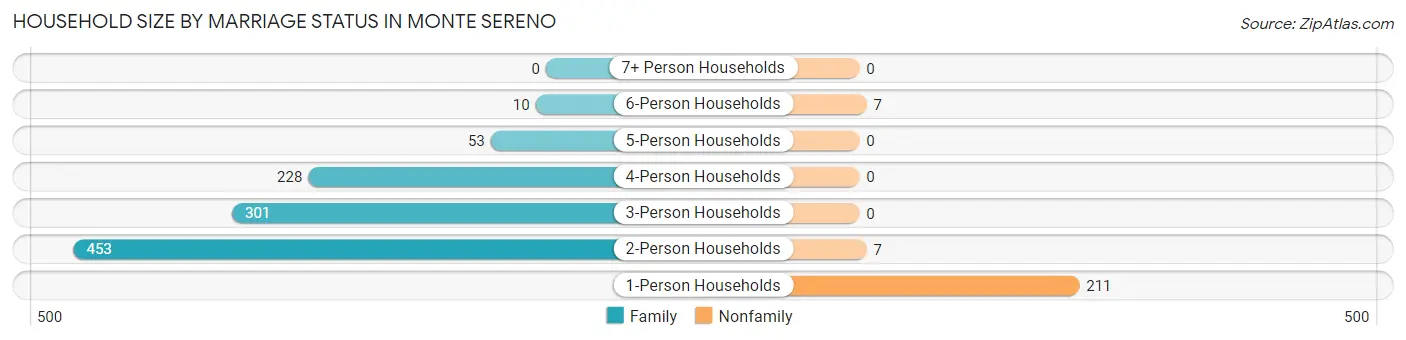
| Household Size | Family Households | Nonfamily Households |
| 1-Person Households | - | 211 (16.6%) |
| 2-Person Households | 453 (35.7%) | 7 (0.5%) |
| 3-Person Households | 301 (23.7%) | 0 (0.0%) |
| 4-Person Households | 228 (17.9%) | 0 (0.0%) |
| 5-Person Households | 53 (4.2%) | 0 (0.0%) |
| 6-Person Households | 10 (0.8%) | 7 (0.5%) |
| 7+ Person Households | 0 (0.0%) | 0 (0.0%) |
| Total | 1,045 (82.3%) | 225 (17.7%) |
Female Fertility in Monte Sereno
Fertility by Age in Monte Sereno
Average fertility rate in Monte Sereno is 17.0 births per 1,000 women. Women in the age bracket of 20 to 34 years have the highest fertility rate with 77.0 births per 1,000 women. Women in the age bracket of 20 to 34 years acount for 100.0% of all women with births.
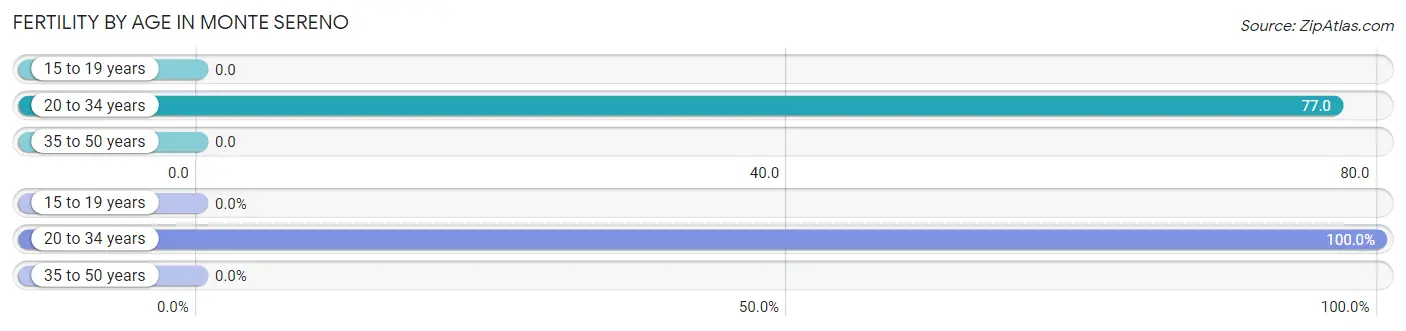
| Age Bracket | Women with Births | Births / 1,000 Women |
| 15 to 19 years | 0 (0.0%) | 0.0 |
| 20 to 34 years | 8 (100.0%) | 77.0 |
| 35 to 50 years | 0 (0.0%) | 0.0 |
| Total | 8 (100.0%) | 17.0 |
Fertility by Age by Marriage Status in Monte Sereno
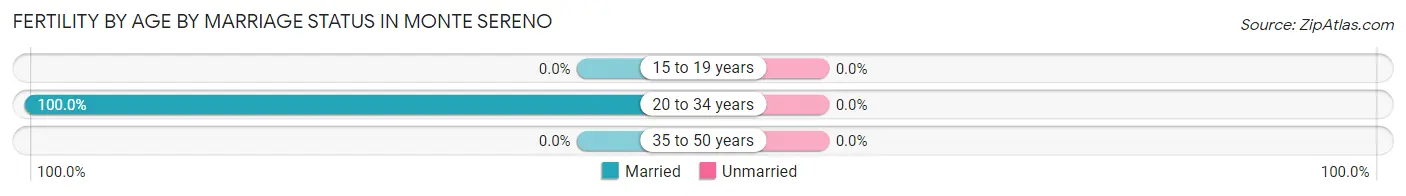
| Age Bracket | Married | Unmarried |
| 15 to 19 years | 0 (0.0%) | 0 (0.0%) |
| 20 to 34 years | 8 (100.0%) | 0 (0.0%) |
| 35 to 50 years | 0 (0.0%) | 0 (0.0%) |
| Total | 8 (100.0%) | 0 (0.0%) |
Fertility by Education in Monte Sereno
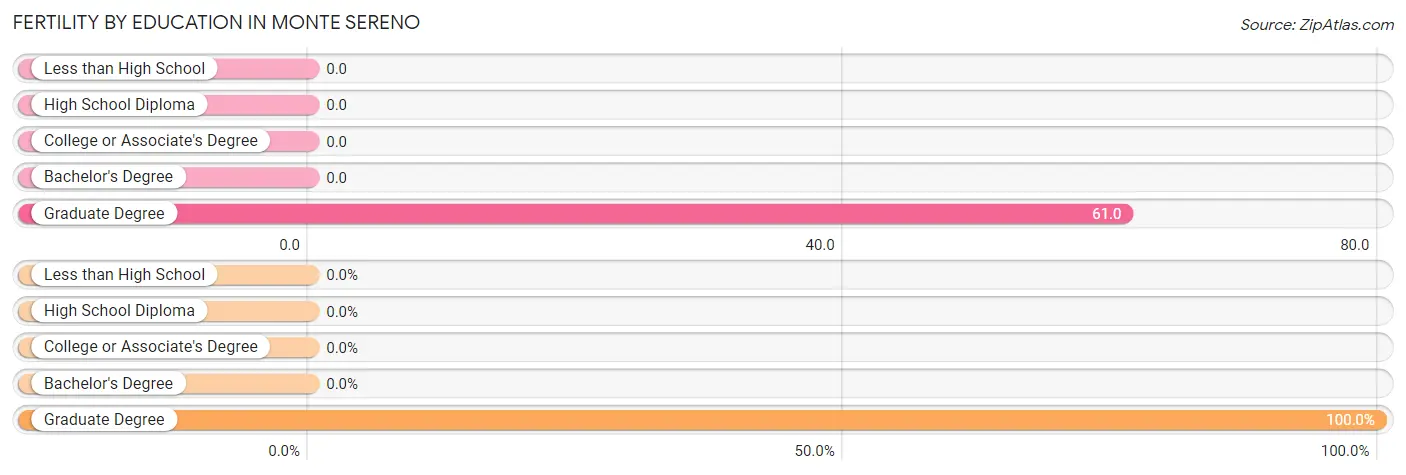
| Educational Attainment | Women with Births | Births / 1,000 Women |
| Less than High School | 0 (0.0%) | 0.0 |
| High School Diploma | 0 (0.0%) | 0.0 |
| College or Associate's Degree | 0 (0.0%) | 0.0 |
| Bachelor's Degree | 0 (0.0%) | 0.0 |
| Graduate Degree | 8 (100.0%) | 61.0 |
| Total | 8 (100.0%) | 17.0 |
Fertility by Education by Marriage Status in Monte Sereno
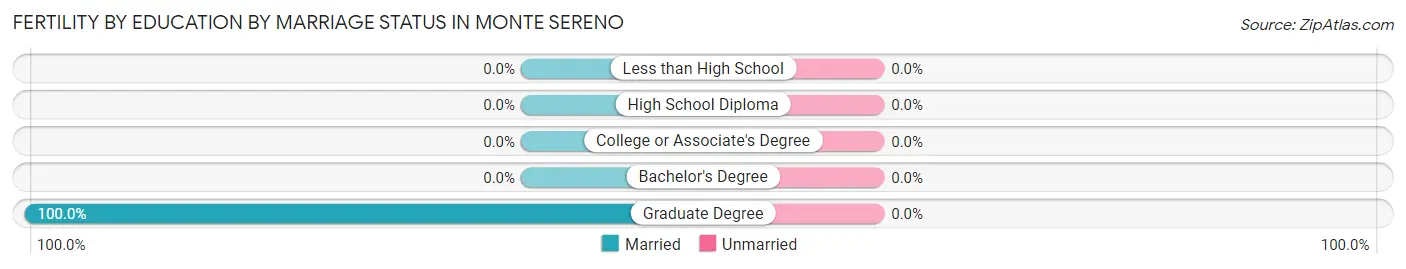
| Educational Attainment | Married | Unmarried |
| Less than High School | 0 (0.0%) | 0 (0.0%) |
| High School Diploma | 0 (0.0%) | 0 (0.0%) |
| College or Associate's Degree | 0 (0.0%) | 0 (0.0%) |
| Bachelor's Degree | 0 (0.0%) | 0 (0.0%) |
| Graduate Degree | 8 (100.0%) | 0 (0.0%) |
| Total | 8 (100.0%) | 0 (0.0%) |
Employment Characteristics in Monte Sereno
Employment by Class of Employer in Monte Sereno
Among the 1,403 employed individuals in Monte Sereno, private company employees (871 | 62.1%), self-employed (incorporated) (175 | 12.5%), and self-employed (not incorporated) (140 | 10.0%) make up the most common classes of employment.

| Employer Class | # Employees | % Employees |
| Private Company Employees | 871 | 62.1% |
| Self-Employed (Incorporated) | 175 | 12.5% |
| Self-Employed (Not Incorporated) | 140 | 10.0% |
| Not-for-profit Organizations | 106 | 7.6% |
| Local Government Employees | 93 | 6.6% |
| State Government Employees | 6 | 0.4% |
| Federal Government Employees | 12 | 0.9% |
| Unpaid Family Workers | 0 | 0.0% |
| Total | 1,403 | 100.0% |
Employment Status by Age in Monte Sereno
According to the labor force statistics for Monte Sereno, out of the total population over 16 years of age (2,915), 52.9% or 1,542 individuals are in the labor force, with 0.9% or 14 of them unemployed. The age group with the highest labor force participation rate is 30 to 34 years, with 100.0% or 16 individuals in the labor force. Within the labor force, the 20 to 24 years age range has the highest percentage of unemployed individuals, with 46.7% or 14 of them being unemployed.
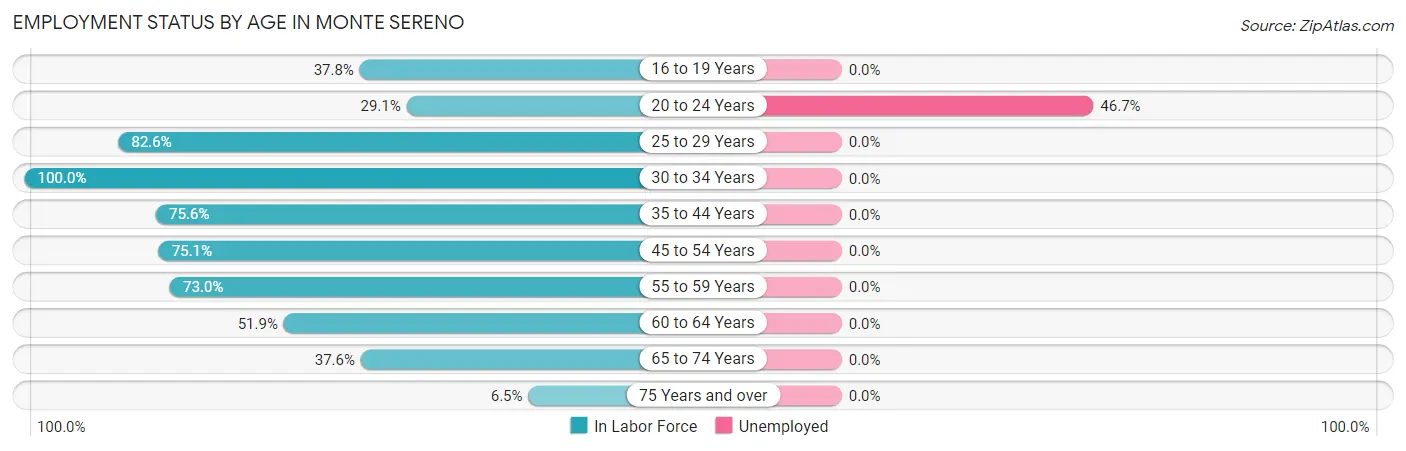
| Age Bracket | In Labor Force | Unemployed |
| 16 to 19 Years | 65 (37.8%) | 0 (0.0%) |
| 20 to 24 Years | 30 (29.1%) | 14 (46.7%) |
| 25 to 29 Years | 157 (82.6%) | 0 (0.0%) |
| 30 to 34 Years | 16 (100.0%) | 0 (0.0%) |
| 35 to 44 Years | 167 (75.6%) | 0 (0.0%) |
| 45 to 54 Years | 438 (75.1%) | 0 (0.0%) |
| 55 to 59 Years | 279 (73.0%) | 0 (0.0%) |
| 60 to 64 Years | 174 (51.9%) | 0 (0.0%) |
| 65 to 74 Years | 188 (37.6%) | 0 (0.0%) |
| 75 Years and over | 27 (6.5%) | 0 (0.0%) |
| Total | 1,542 (52.9%) | 14 (0.9%) |
Employment Status by Educational Attainment in Monte Sereno
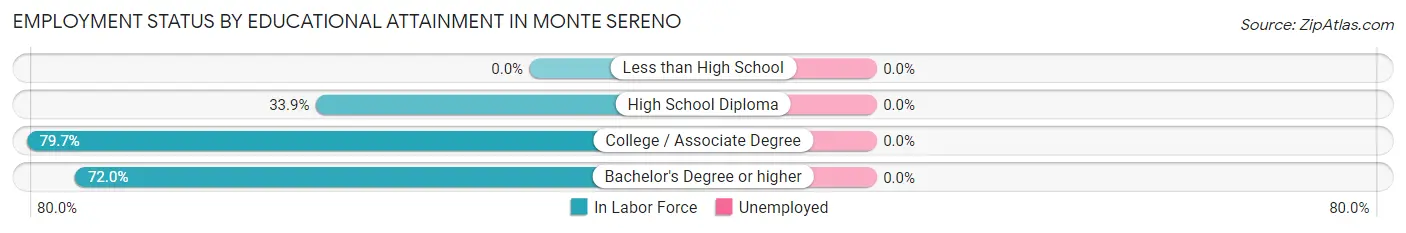
| Educational Attainment | In Labor Force | Unemployed |
| Less than High School | 0 (0.0%) | 0 (0.0%) |
| High School Diploma | 21 (33.9%) | 0 (0.0%) |
| College / Associate Degree | 161 (79.7%) | 0 (0.0%) |
| Bachelor's Degree or higher | 1,048 (72.0%) | 0 (0.0%) |
| Total | 1,231 (71.3%) | 0 (0.0%) |
Employment Occupations by Sex in Monte Sereno
Management, Business, Science and Arts Occupations
The most common Management, Business, Science and Arts occupations in Monte Sereno are Management (319 | 20.9%), Computers, Engineering & Science (230 | 15.1%), Health Diagnosing & Treating (221 | 14.5%), Health Technologists (216 | 14.1%), and Community & Social Service (187 | 12.2%).
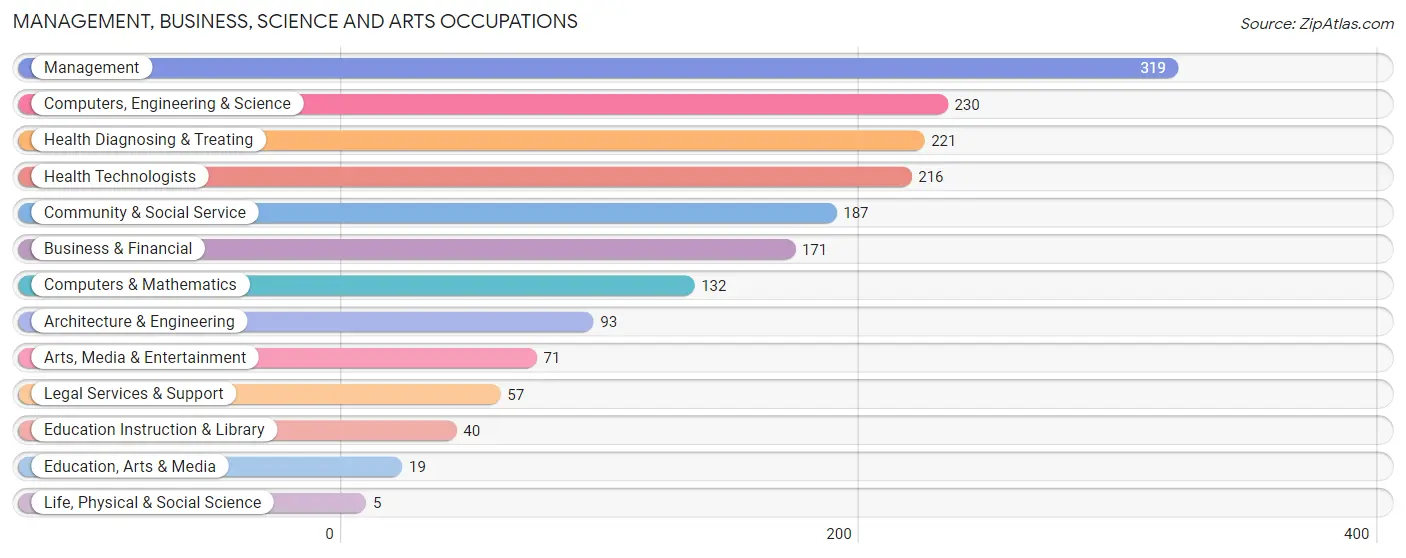
Management, Business, Science and Arts Occupations by Sex
Within the Management, Business, Science and Arts occupations in Monte Sereno, the most male-oriented occupations are Arts, Media & Entertainment (91.5%), Architecture & Engineering (91.4%), and Computers, Engineering & Science (77.8%), while the most female-oriented occupations are Life, Physical & Social Science (100.0%), Business & Financial (50.9%), and Health Diagnosing & Treating (49.3%).

| Occupation | Male | Female |
| Management | 219 (68.6%) | 100 (31.4%) |
| Business & Financial | 84 (49.1%) | 87 (50.9%) |
| Computers, Engineering & Science | 179 (77.8%) | 51 (22.2%) |
| Computers & Mathematics | 94 (71.2%) | 38 (28.8%) |
| Architecture & Engineering | 85 (91.4%) | 8 (8.6%) |
| Life, Physical & Social Science | 0 (0.0%) | 5 (100.0%) |
| Community & Social Service | 141 (75.4%) | 46 (24.6%) |
| Education, Arts & Media | 13 (68.4%) | 6 (31.6%) |
| Legal Services & Support | 41 (71.9%) | 16 (28.1%) |
| Education Instruction & Library | 22 (55.0%) | 18 (45.0%) |
| Arts, Media & Entertainment | 65 (91.5%) | 6 (8.5%) |
| Health Diagnosing & Treating | 112 (50.7%) | 109 (49.3%) |
| Health Technologists | 112 (51.8%) | 104 (48.1%) |
| Total (Category) | 735 (65.2%) | 393 (34.8%) |
| Total (Overall) | 953 (62.4%) | 574 (37.6%) |
Services Occupations
The most common Services occupations in Monte Sereno are Food Preparation & Serving (51 | 3.3%), Healthcare Support (7 | 0.5%), Security & Protection (6 | 0.4%), and Law Enforcement (6 | 0.4%).
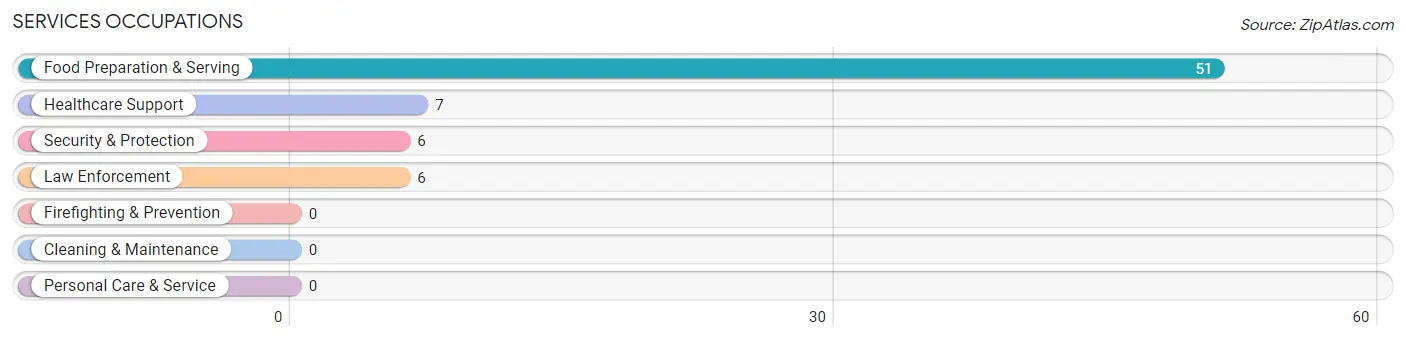
Services Occupations by Sex
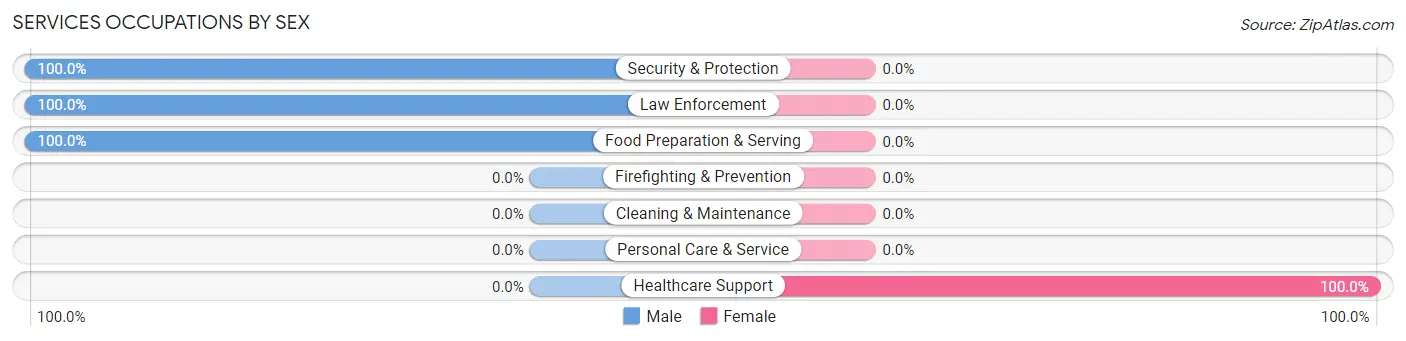
| Occupation | Male | Female |
| Healthcare Support | 0 (0.0%) | 7 (100.0%) |
| Security & Protection | 6 (100.0%) | 0 (0.0%) |
| Firefighting & Prevention | 0 (0.0%) | 0 (0.0%) |
| Law Enforcement | 6 (100.0%) | 0 (0.0%) |
| Food Preparation & Serving | 51 (100.0%) | 0 (0.0%) |
| Cleaning & Maintenance | 0 (0.0%) | 0 (0.0%) |
| Personal Care & Service | 0 (0.0%) | 0 (0.0%) |
| Total (Category) | 57 (89.1%) | 7 (10.9%) |
| Total (Overall) | 953 (62.4%) | 574 (37.6%) |
Sales and Office Occupations
The most common Sales and Office occupations in Monte Sereno are Office & Administration (150 | 9.8%), and Sales & Related (104 | 6.8%).
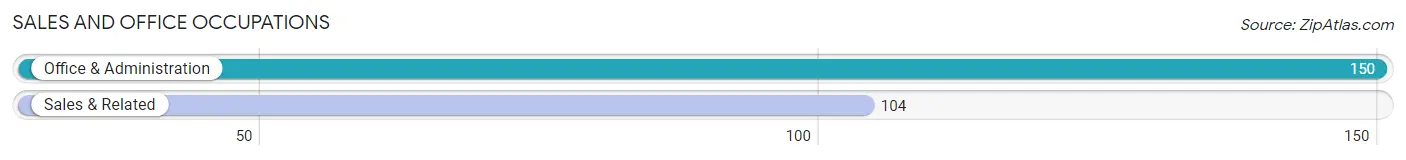
Sales and Office Occupations by Sex
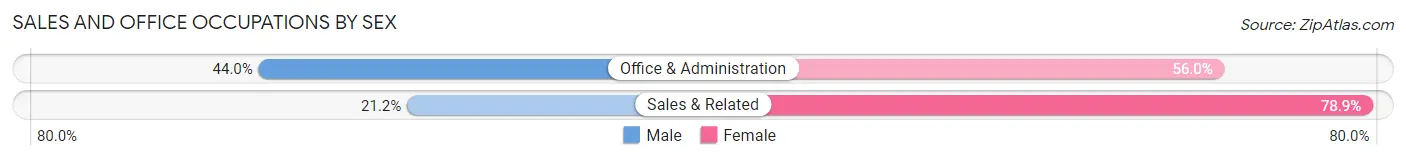
| Occupation | Male | Female |
| Sales & Related | 22 (21.1%) | 82 (78.8%) |
| Office & Administration | 66 (44.0%) | 84 (56.0%) |
| Total (Category) | 88 (34.6%) | 166 (65.3%) |
| Total (Overall) | 953 (62.4%) | 574 (37.6%) |
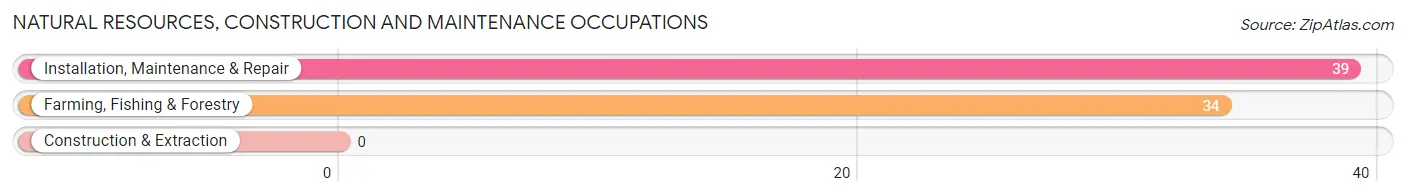
Natural Resources, Construction and Maintenance Occupations
The most common Natural Resources, Construction and Maintenance occupations in Monte Sereno are Installation, Maintenance & Repair (39 | 2.5%), and Farming, Fishing & Forestry (34 | 2.2%).
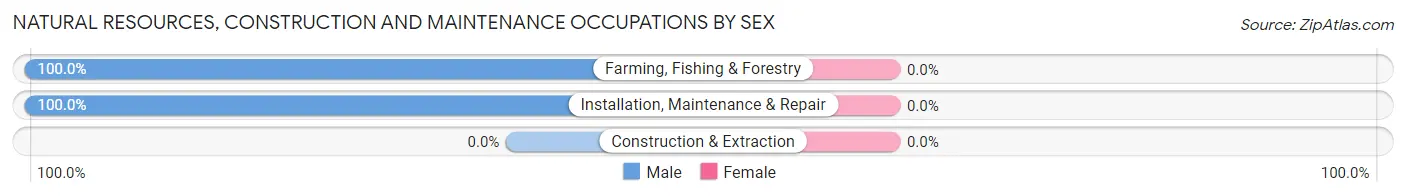
Natural Resources, Construction and Maintenance Occupations by Sex
| Occupation | Male | Female |
| Farming, Fishing & Forestry | 34 (100.0%) | 0 (0.0%) |
| Construction & Extraction | 0 (0.0%) | 0 (0.0%) |
| Installation, Maintenance & Repair | 39 (100.0%) | 0 (0.0%) |
| Total (Category) | 73 (100.0%) | 0 (0.0%) |
| Total (Overall) | 953 (62.4%) | 574 (37.6%) |
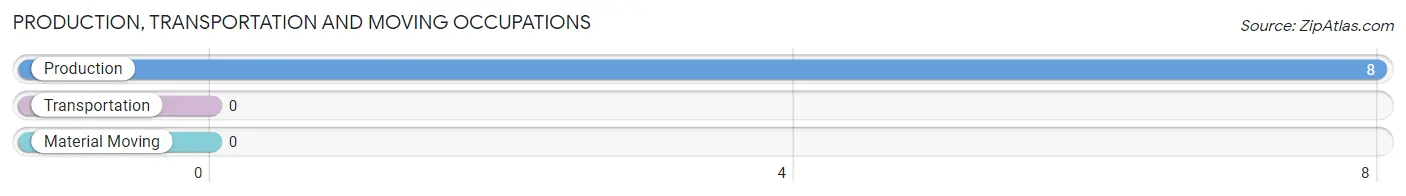
Production, Transportation and Moving Occupations
The most common Production, Transportation and Moving occupations in Monte Sereno are , and Production (8 | 0.5%).
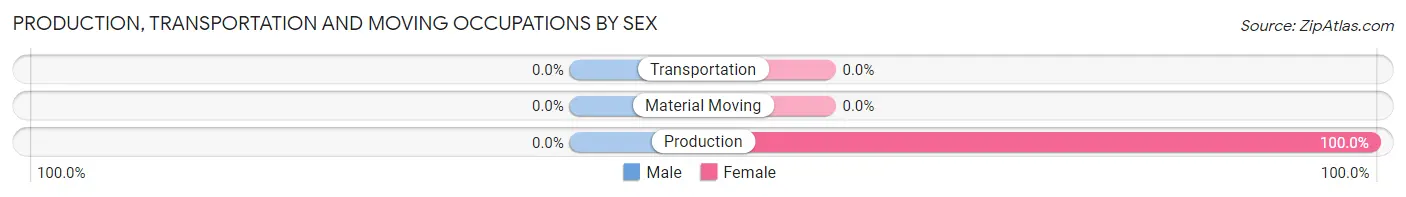
Production, Transportation and Moving Occupations by Sex
| Occupation | Male | Female |
| Production | 0 (0.0%) | 8 (100.0%) |
| Transportation | 0 (0.0%) | 0 (0.0%) |
| Material Moving | 0 (0.0%) | 0 (0.0%) |
| Total (Category) | 0 (0.0%) | 8 (100.0%) |
| Total (Overall) | 953 (62.4%) | 574 (37.6%) |
Employment Industries by Sex in Monte Sereno
Employment Industries in Monte Sereno
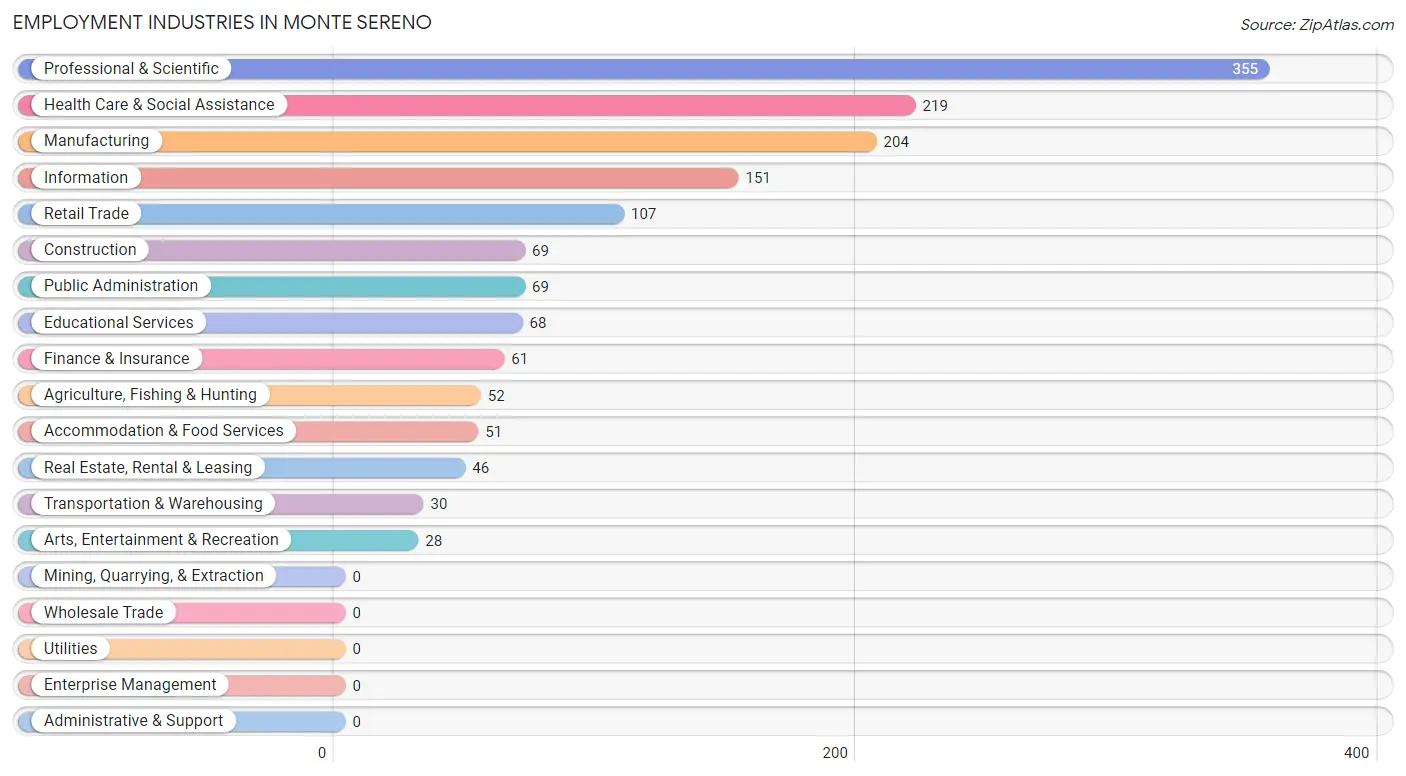
The major employment industries in Monte Sereno include Professional & Scientific (355 | 23.3%), Health Care & Social Assistance (219 | 14.3%), Manufacturing (204 | 13.4%), Information (151 | 9.9%), and Retail Trade (107 | 7.0%).
Employment Industries by Sex in Monte Sereno
The Monte Sereno industries that see more men than women are Arts, Entertainment & Recreation (100.0%), Accommodation & Food Services (100.0%), and Information (88.1%), whereas the industries that tend to have a higher number of women are Transportation & Warehousing (100.0%), Public Administration (91.3%), and Retail Trade (85.1%).
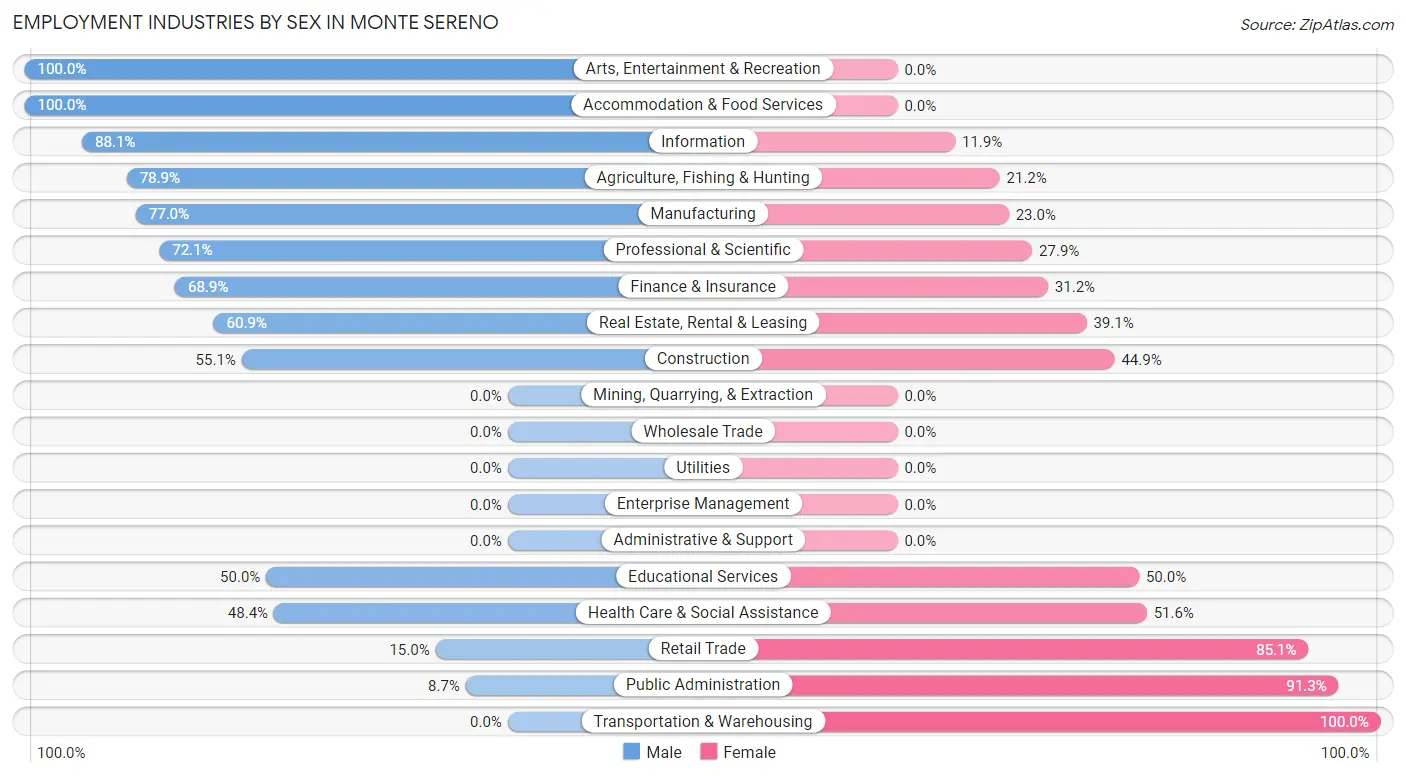
| Industry | Male | Female |
| Agriculture, Fishing & Hunting | 41 (78.8%) | 11 (21.1%) |
| Mining, Quarrying, & Extraction | 0 (0.0%) | 0 (0.0%) |
| Construction | 38 (55.1%) | 31 (44.9%) |
| Manufacturing | 157 (77.0%) | 47 (23.0%) |
| Wholesale Trade | 0 (0.0%) | 0 (0.0%) |
| Retail Trade | 16 (14.9%) | 91 (85.1%) |
| Transportation & Warehousing | 0 (0.0%) | 30 (100.0%) |
| Utilities | 0 (0.0%) | 0 (0.0%) |
| Information | 133 (88.1%) | 18 (11.9%) |
| Finance & Insurance | 42 (68.9%) | 19 (31.1%) |
| Real Estate, Rental & Leasing | 28 (60.9%) | 18 (39.1%) |
| Professional & Scientific | 256 (72.1%) | 99 (27.9%) |
| Enterprise Management | 0 (0.0%) | 0 (0.0%) |
| Administrative & Support | 0 (0.0%) | 0 (0.0%) |
| Educational Services | 34 (50.0%) | 34 (50.0%) |
| Health Care & Social Assistance | 106 (48.4%) | 113 (51.6%) |
| Arts, Entertainment & Recreation | 28 (100.0%) | 0 (0.0%) |
| Accommodation & Food Services | 51 (100.0%) | 0 (0.0%) |
| Public Administration | 6 (8.7%) | 63 (91.3%) |
| Total | 953 (62.4%) | 574 (37.6%) |
Education in Monte Sereno
School Enrollment in Monte Sereno
The most common levels of schooling among the 757 students in Monte Sereno are middle school (249 | 32.9%), high school (188 | 24.8%), and college / undergraduate (114 | 15.1%).
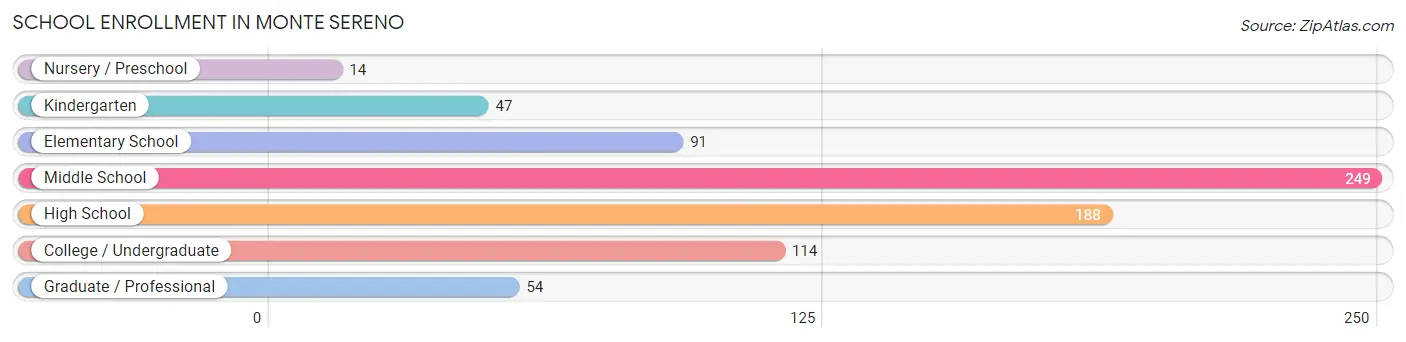
| School Level | # Students | % Students |
| Nursery / Preschool | 14 | 1.8% |
| Kindergarten | 47 | 6.2% |
| Elementary School | 91 | 12.0% |
| Middle School | 249 | 32.9% |
| High School | 188 | 24.8% |
| College / Undergraduate | 114 | 15.1% |
| Graduate / Professional | 54 | 7.1% |
| Total | 757 | 100.0% |
School Enrollment by Age by Funding Source in Monte Sereno
Out of a total of 757 students who are enrolled in schools in Monte Sereno, 153 (20.2%) attend a private institution, while the remaining 604 (79.8%) are enrolled in public schools. The age group of 3 to 4 year olds has the highest likelihood of being enrolled in private schools, with 7 (100.0% in the age bracket) enrolled. Conversely, the age group of 18 to 19 year olds has the lowest likelihood of being enrolled in a private school, with 61 (100.0% in the age bracket) attending a public institution.
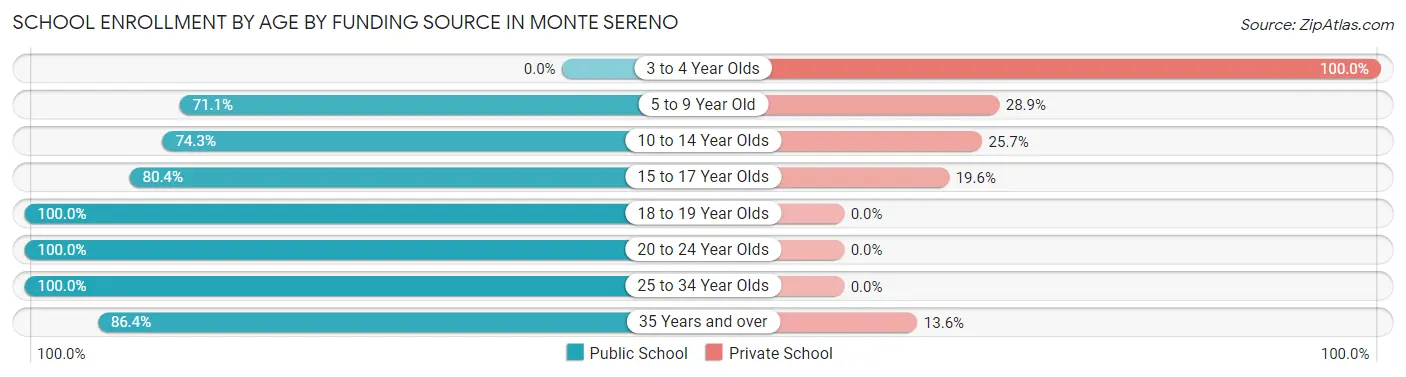
| Age Bracket | Public School | Private School |
| 3 to 4 Year Olds | 0 (0.0%) | 7 (100.0%) |
| 5 to 9 Year Old | 96 (71.1%) | 39 (28.9%) |
| 10 to 14 Year Olds | 214 (74.3%) | 74 (25.7%) |
| 15 to 17 Year Olds | 111 (80.4%) | 27 (19.6%) |
| 18 to 19 Year Olds | 61 (100.0%) | 0 (0.0%) |
| 20 to 24 Year Olds | 65 (100.0%) | 0 (0.0%) |
| 25 to 34 Year Olds | 19 (100.0%) | 0 (0.0%) |
| 35 Years and over | 38 (86.4%) | 6 (13.6%) |
| Total | 604 (79.8%) | 153 (20.2%) |
Educational Attainment by Field of Study in Monte Sereno
Engineering (476 | 20.2%), business (413 | 17.5%), social sciences (229 | 9.7%), science & technology (199 | 8.5%), and computers & mathematics (171 | 7.3%) are the most common fields of study among 2,354 individuals in Monte Sereno who have obtained a bachelor's degree or higher.
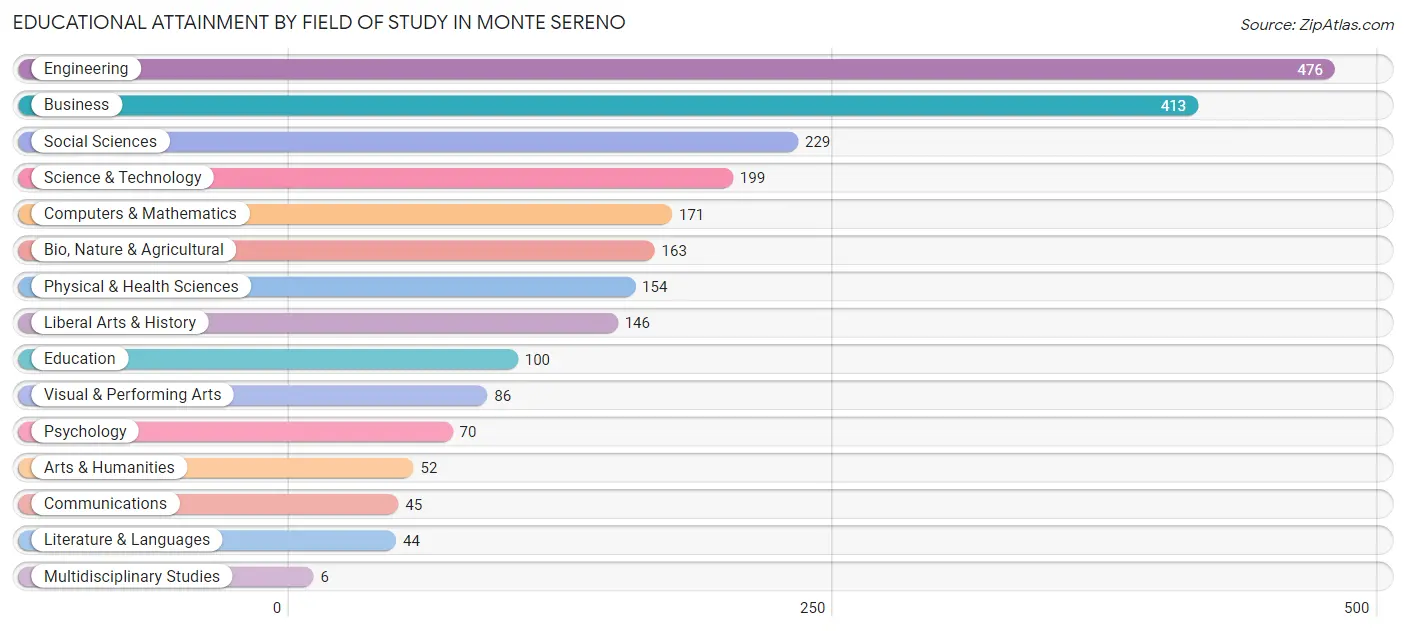
| Field of Study | # Graduates | % Graduates |
| Computers & Mathematics | 171 | 7.3% |
| Bio, Nature & Agricultural | 163 | 6.9% |
| Physical & Health Sciences | 154 | 6.5% |
| Psychology | 70 | 3.0% |
| Social Sciences | 229 | 9.7% |
| Engineering | 476 | 20.2% |
| Multidisciplinary Studies | 6 | 0.3% |
| Science & Technology | 199 | 8.5% |
| Business | 413 | 17.5% |
| Education | 100 | 4.3% |
| Literature & Languages | 44 | 1.9% |
| Liberal Arts & History | 146 | 6.2% |
| Visual & Performing Arts | 86 | 3.6% |
| Communications | 45 | 1.9% |
| Arts & Humanities | 52 | 2.2% |
| Total | 2,354 | 100.0% |
Transportation & Commute in Monte Sereno
Vehicle Availability by Sex in Monte Sereno
The most prevalent vehicle ownership categories in Monte Sereno are males with 2 vehicles (316, accounting for 35.9%) and females with 2 vehicles (185, making up 60.4%).
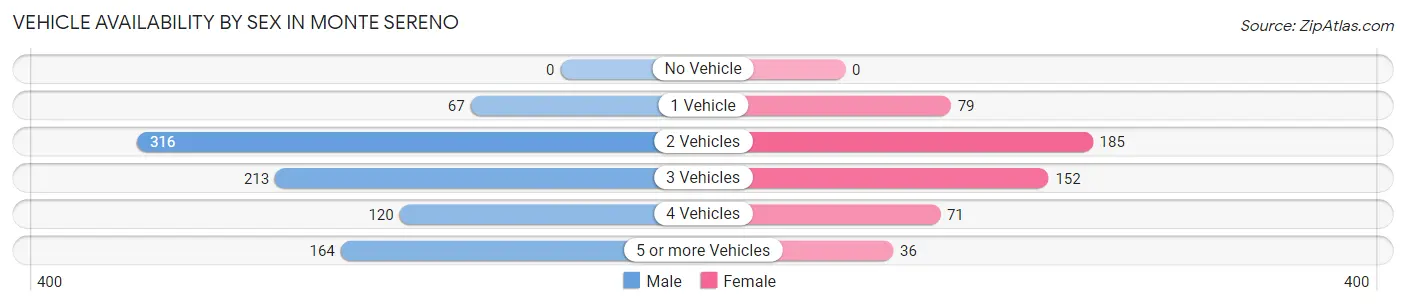
| Vehicles Available | Male | Female |
| No Vehicle | 0 (0.0%) | 0 (0.0%) |
| 1 Vehicle | 67 (7.6%) | 79 (15.1%) |
| 2 Vehicles | 316 (35.9%) | 185 (35.4%) |
| 3 Vehicles | 213 (24.2%) | 152 (29.1%) |
| 4 Vehicles | 120 (13.6%) | 71 (13.6%) |
| 5 or more Vehicles | 164 (18.6%) | 36 (6.9%) |
| Total | 880 (100.0%) | 523 (100.0%) |
Commute Time in Monte Sereno
The most frequently occuring commute durations in Monte Sereno are 25 to 29 minutes (235 commuters, 21.6%), 15 to 19 minutes (178 commuters, 16.4%), and 30 to 34 minutes (164 commuters, 15.1%).
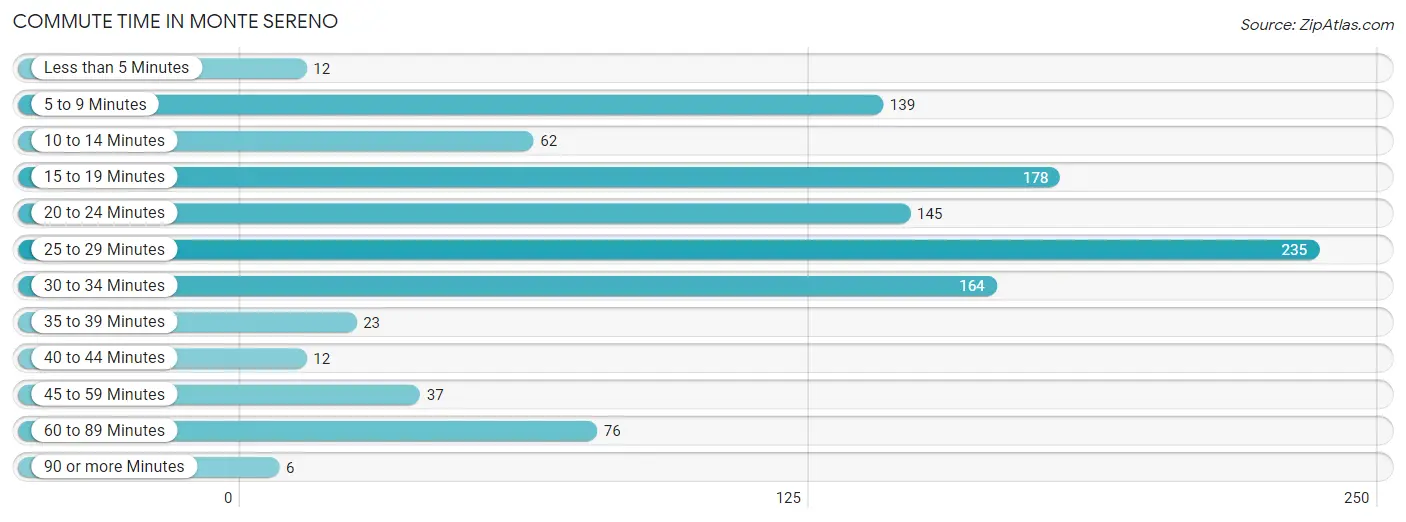
| Commute Time | # Commuters | % Commuters |
| Less than 5 Minutes | 12 | 1.1% |
| 5 to 9 Minutes | 139 | 12.8% |
| 10 to 14 Minutes | 62 | 5.7% |
| 15 to 19 Minutes | 178 | 16.4% |
| 20 to 24 Minutes | 145 | 13.3% |
| 25 to 29 Minutes | 235 | 21.6% |
| 30 to 34 Minutes | 164 | 15.1% |
| 35 to 39 Minutes | 23 | 2.1% |
| 40 to 44 Minutes | 12 | 1.1% |
| 45 to 59 Minutes | 37 | 3.4% |
| 60 to 89 Minutes | 76 | 7.0% |
| 90 or more Minutes | 6 | 0.5% |
Commute Time by Sex in Monte Sereno
The most common commute times in Monte Sereno are 25 to 29 minutes (180 commuters, 28.0%) for males and 15 to 19 minutes (68 commuters, 15.2%) for females.
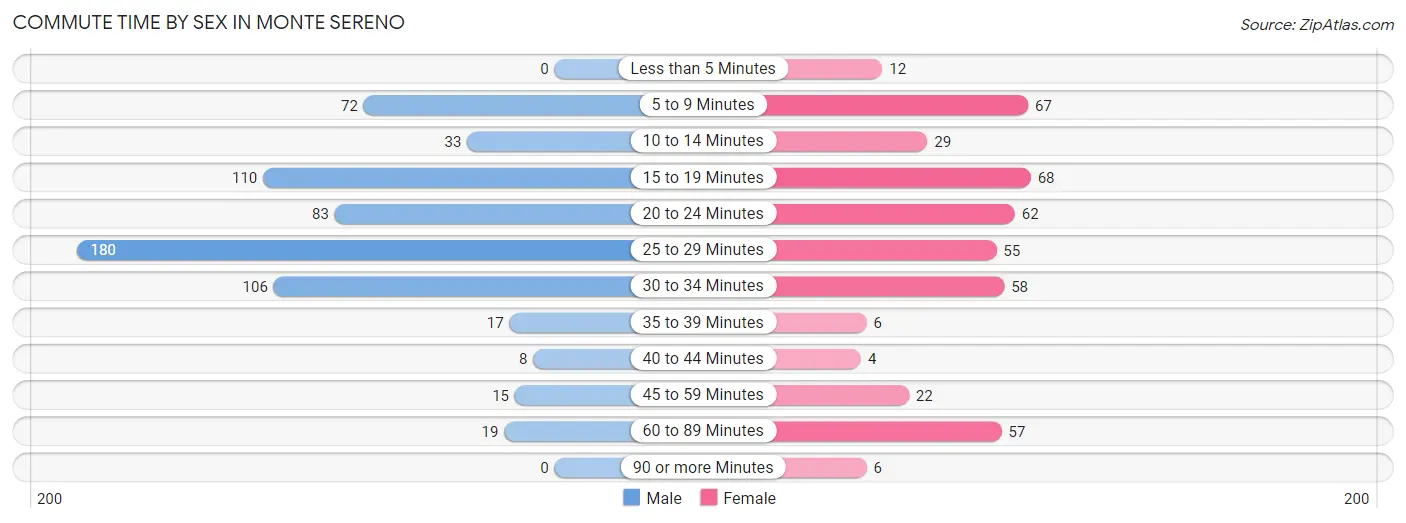
| Commute Time | Male | Female |
| Less than 5 Minutes | 0 (0.0%) | 12 (2.7%) |
| 5 to 9 Minutes | 72 (11.2%) | 67 (15.0%) |
| 10 to 14 Minutes | 33 (5.1%) | 29 (6.5%) |
| 15 to 19 Minutes | 110 (17.1%) | 68 (15.2%) |
| 20 to 24 Minutes | 83 (12.9%) | 62 (13.9%) |
| 25 to 29 Minutes | 180 (28.0%) | 55 (12.3%) |
| 30 to 34 Minutes | 106 (16.5%) | 58 (13.0%) |
| 35 to 39 Minutes | 17 (2.6%) | 6 (1.3%) |
| 40 to 44 Minutes | 8 (1.2%) | 4 (0.9%) |
| 45 to 59 Minutes | 15 (2.3%) | 22 (4.9%) |
| 60 to 89 Minutes | 19 (2.9%) | 57 (12.8%) |
| 90 or more Minutes | 0 (0.0%) | 6 (1.3%) |
Time of Departure to Work by Sex in Monte Sereno
The most frequent times of departure to work in Monte Sereno are 7:30 AM to 7:59 AM (151, 23.5%) for males and 8:30 AM to 8:59 AM (127, 28.5%) for females.
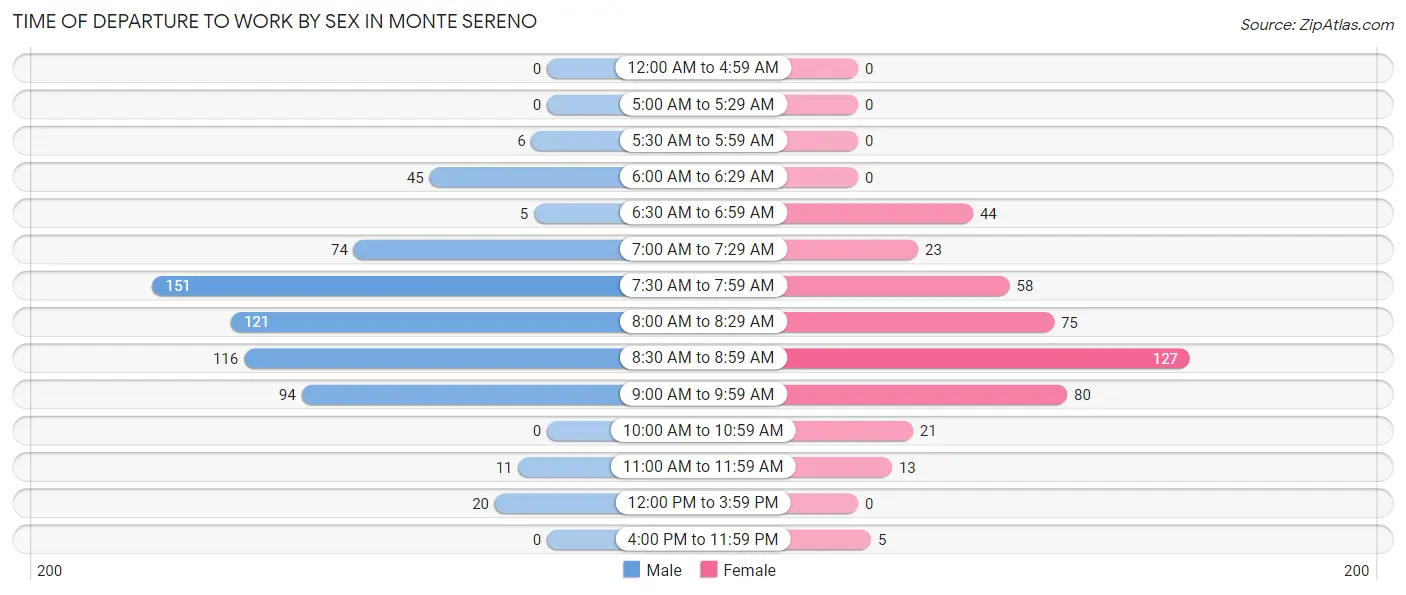
| Time of Departure | Male | Female |
| 12:00 AM to 4:59 AM | 0 (0.0%) | 0 (0.0%) |
| 5:00 AM to 5:29 AM | 0 (0.0%) | 0 (0.0%) |
| 5:30 AM to 5:59 AM | 6 (0.9%) | 0 (0.0%) |
| 6:00 AM to 6:29 AM | 45 (7.0%) | 0 (0.0%) |
| 6:30 AM to 6:59 AM | 5 (0.8%) | 44 (9.9%) |
| 7:00 AM to 7:29 AM | 74 (11.5%) | 23 (5.2%) |
| 7:30 AM to 7:59 AM | 151 (23.5%) | 58 (13.0%) |
| 8:00 AM to 8:29 AM | 121 (18.8%) | 75 (16.8%) |
| 8:30 AM to 8:59 AM | 116 (18.0%) | 127 (28.5%) |
| 9:00 AM to 9:59 AM | 94 (14.6%) | 80 (17.9%) |
| 10:00 AM to 10:59 AM | 0 (0.0%) | 21 (4.7%) |
| 11:00 AM to 11:59 AM | 11 (1.7%) | 13 (2.9%) |
| 12:00 PM to 3:59 PM | 20 (3.1%) | 0 (0.0%) |
| 4:00 PM to 11:59 PM | 0 (0.0%) | 5 (1.1%) |
| Total | 643 (100.0%) | 446 (100.0%) |
Housing Occupancy in Monte Sereno
Occupancy by Ownership in Monte Sereno
Of the total 1,270 dwellings in Monte Sereno, owner-occupied units account for 1,208 (95.1%), while renter-occupied units make up 62 (4.9%).
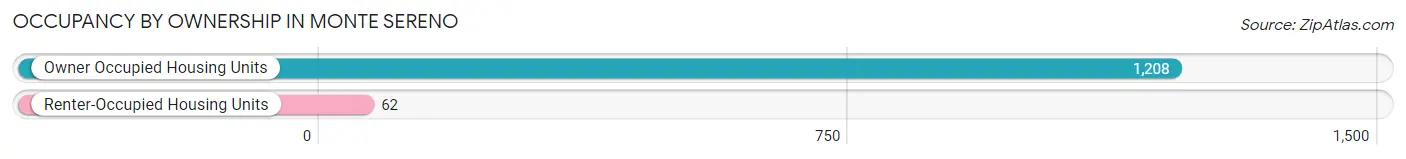
| Occupancy | # Housing Units | % Housing Units |
| Owner Occupied Housing Units | 1,208 | 95.1% |
| Renter-Occupied Housing Units | 62 | 4.9% |
| Total Occupied Housing Units | 1,270 | 100.0% |
Occupancy by Household Size in Monte Sereno
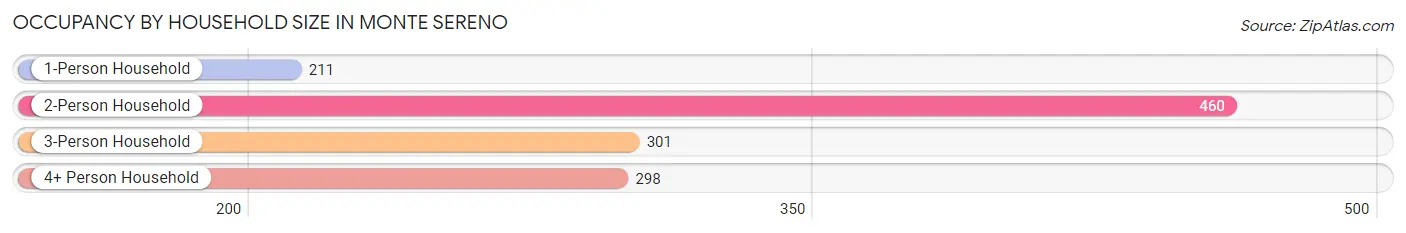
| Household Size | # Housing Units | % Housing Units |
| 1-Person Household | 211 | 16.6% |
| 2-Person Household | 460 | 36.2% |
| 3-Person Household | 301 | 23.7% |
| 4+ Person Household | 298 | 23.5% |
| Total Housing Units | 1,270 | 100.0% |
Occupancy by Ownership by Household Size in Monte Sereno
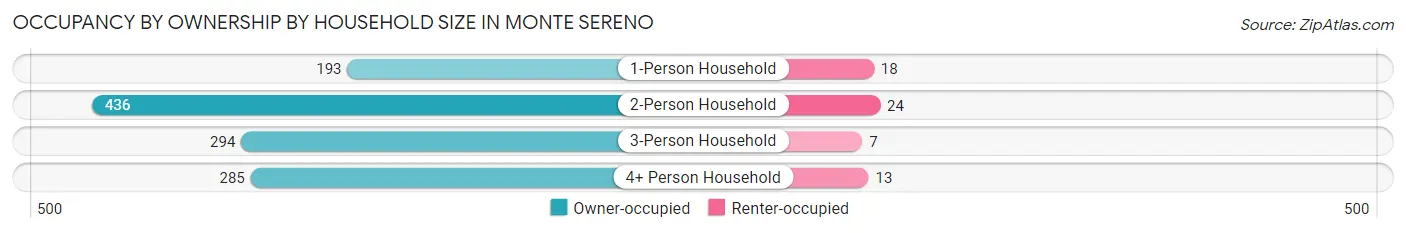
| Household Size | Owner-occupied | Renter-occupied |
| 1-Person Household | 193 (91.5%) | 18 (8.5%) |
| 2-Person Household | 436 (94.8%) | 24 (5.2%) |
| 3-Person Household | 294 (97.7%) | 7 (2.3%) |
| 4+ Person Household | 285 (95.6%) | 13 (4.4%) |
| Total Housing Units | 1,208 (95.1%) | 62 (4.9%) |
Occupancy by Educational Attainment in Monte Sereno
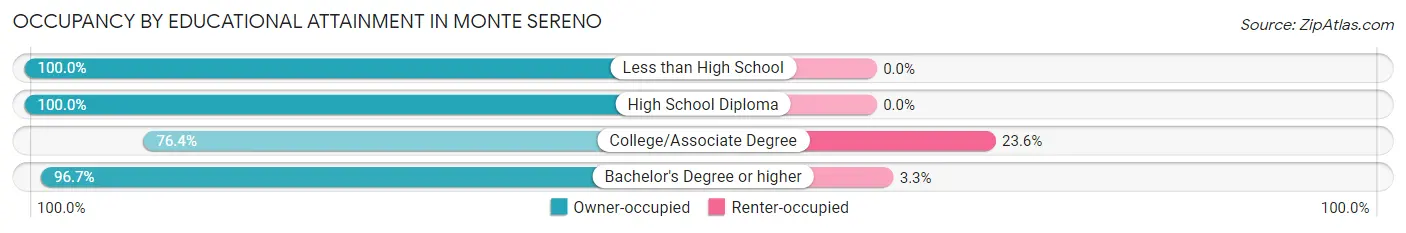
| Household Size | Owner-occupied | Renter-occupied |
| Less than High School | 9 (100.0%) | 0 (0.0%) |
| High School Diploma | 32 (100.0%) | 0 (0.0%) |
| College/Associate Degree | 81 (76.4%) | 25 (23.6%) |
| Bachelor's Degree or higher | 1,086 (96.7%) | 37 (3.3%) |
Occupancy by Age of Householder in Monte Sereno
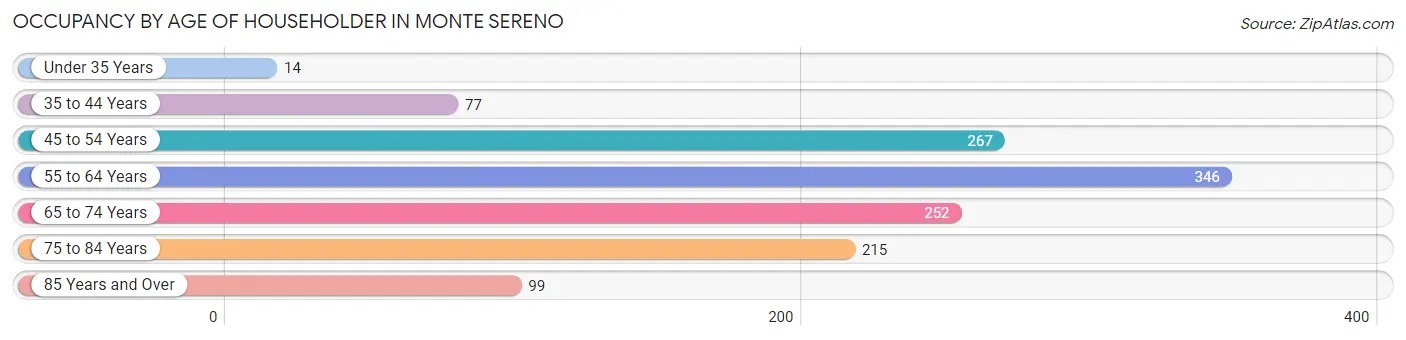
| Age Bracket | # Households | % Households |
| Under 35 Years | 14 | 1.1% |
| 35 to 44 Years | 77 | 6.1% |
| 45 to 54 Years | 267 | 21.0% |
| 55 to 64 Years | 346 | 27.2% |
| 65 to 74 Years | 252 | 19.8% |
| 75 to 84 Years | 215 | 16.9% |
| 85 Years and Over | 99 | 7.8% |
| Total | 1,270 | 100.0% |
Housing Finances in Monte Sereno
Median Income by Occupancy in Monte Sereno
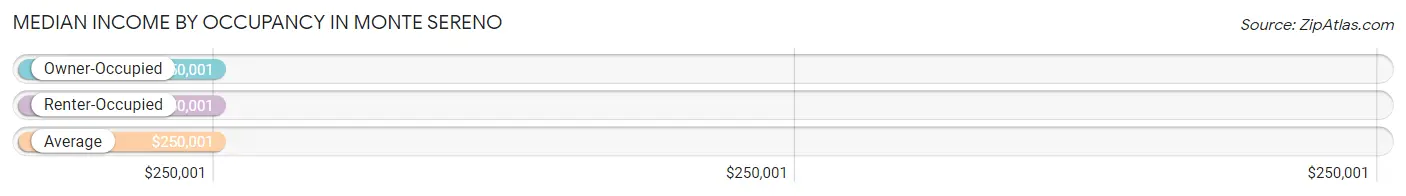
| Occupancy Type | # Households | Median Income |
| Owner-Occupied | 1,208 (95.1%) | $250,001 |
| Renter-Occupied | 62 (4.9%) | $250,001 |
| Average | 1,270 (100.0%) | $250,001 |
Occupancy by Householder Income Bracket in Monte Sereno
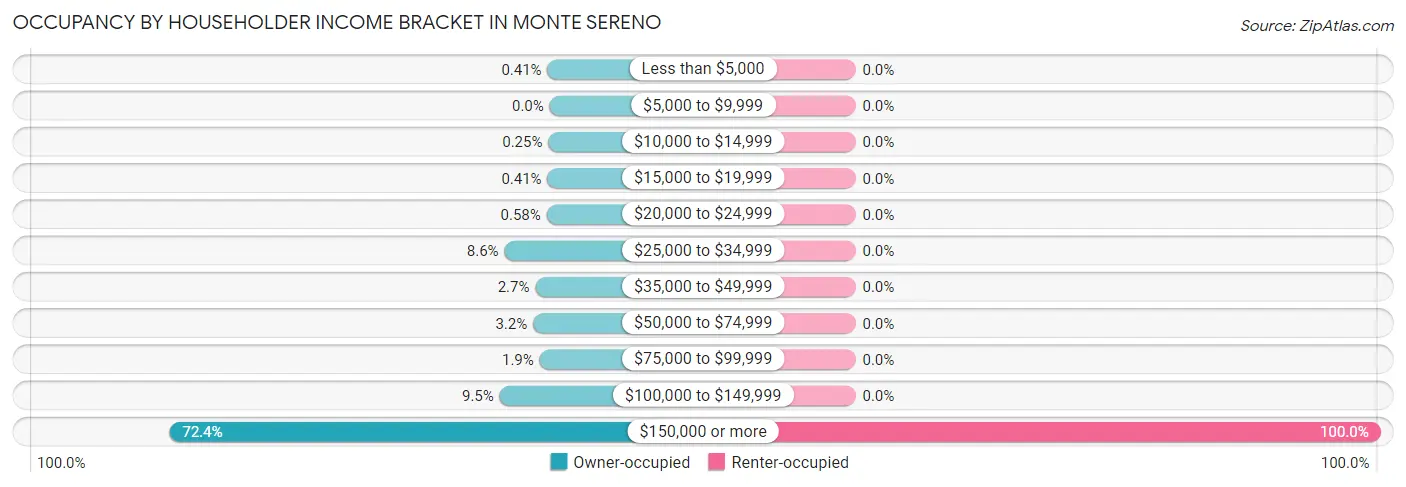
| Income Bracket | Owner-occupied | Renter-occupied |
| Less than $5,000 | 5 (0.4%) | 0 (0.0%) |
| $5,000 to $9,999 | 0 (0.0%) | 0 (0.0%) |
| $10,000 to $14,999 | 3 (0.3%) | 0 (0.0%) |
| $15,000 to $19,999 | 5 (0.4%) | 0 (0.0%) |
| $20,000 to $24,999 | 7 (0.6%) | 0 (0.0%) |
| $25,000 to $34,999 | 104 (8.6%) | 0 (0.0%) |
| $35,000 to $49,999 | 33 (2.7%) | 0 (0.0%) |
| $50,000 to $74,999 | 38 (3.2%) | 0 (0.0%) |
| $75,000 to $99,999 | 23 (1.9%) | 0 (0.0%) |
| $100,000 to $149,999 | 115 (9.5%) | 0 (0.0%) |
| $150,000 or more | 875 (72.4%) | 62 (100.0%) |
| Total | 1,208 (100.0%) | 62 (100.0%) |
Monthly Housing Cost Tiers in Monte Sereno
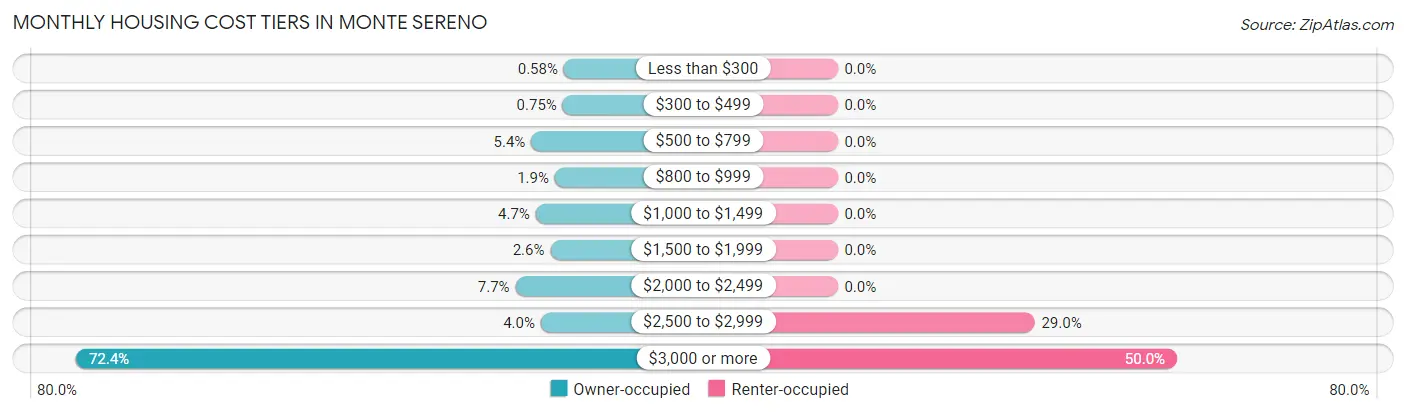
| Monthly Cost | Owner-occupied | Renter-occupied |
| Less than $300 | 7 (0.6%) | 0 (0.0%) |
| $300 to $499 | 9 (0.7%) | 0 (0.0%) |
| $500 to $799 | 65 (5.4%) | 0 (0.0%) |
| $800 to $999 | 23 (1.9%) | 0 (0.0%) |
| $1,000 to $1,499 | 57 (4.7%) | 0 (0.0%) |
| $1,500 to $1,999 | 31 (2.6%) | 0 (0.0%) |
| $2,000 to $2,499 | 93 (7.7%) | 0 (0.0%) |
| $2,500 to $2,999 | 48 (4.0%) | 18 (29.0%) |
| $3,000 or more | 875 (72.4%) | 31 (50.0%) |
| Total | 1,208 (100.0%) | 62 (100.0%) |
Physical Housing Characteristics in Monte Sereno
Housing Structures in Monte Sereno
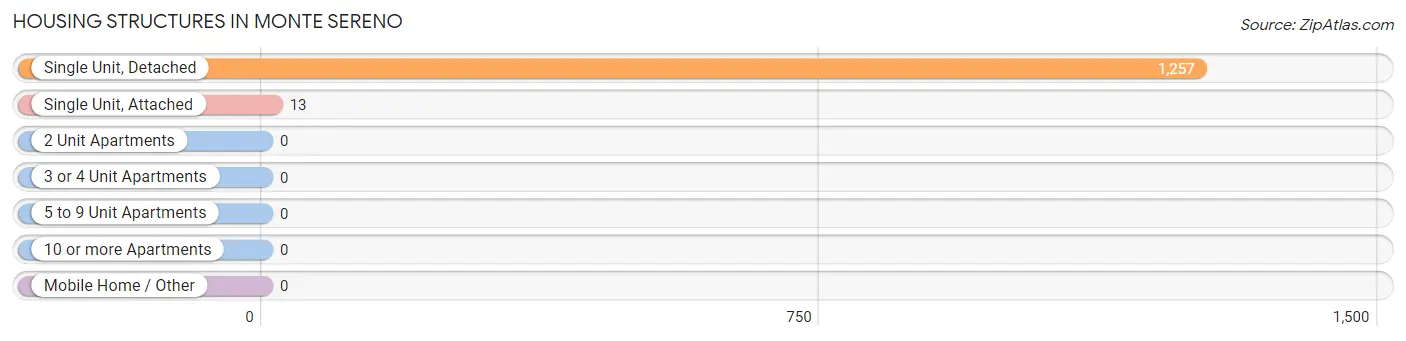
| Structure Type | # Housing Units | % Housing Units |
| Single Unit, Detached | 1,257 | 99.0% |
| Single Unit, Attached | 13 | 1.0% |
| 2 Unit Apartments | 0 | 0.0% |
| 3 or 4 Unit Apartments | 0 | 0.0% |
| 5 to 9 Unit Apartments | 0 | 0.0% |
| 10 or more Apartments | 0 | 0.0% |
| Mobile Home / Other | 0 | 0.0% |
| Total | 1,270 | 100.0% |
Housing Structures by Occupancy in Monte Sereno
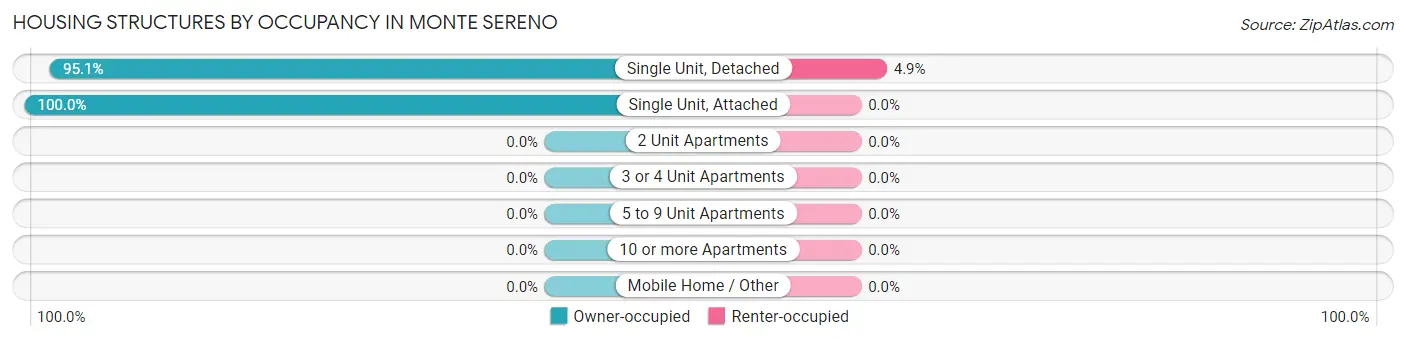
| Structure Type | Owner-occupied | Renter-occupied |
| Single Unit, Detached | 1,195 (95.1%) | 62 (4.9%) |
| Single Unit, Attached | 13 (100.0%) | 0 (0.0%) |
| 2 Unit Apartments | 0 (0.0%) | 0 (0.0%) |
| 3 or 4 Unit Apartments | 0 (0.0%) | 0 (0.0%) |
| 5 to 9 Unit Apartments | 0 (0.0%) | 0 (0.0%) |
| 10 or more Apartments | 0 (0.0%) | 0 (0.0%) |
| Mobile Home / Other | 0 (0.0%) | 0 (0.0%) |
| Total | 1,208 (95.1%) | 62 (4.9%) |
Housing Structures by Number of Rooms in Monte Sereno
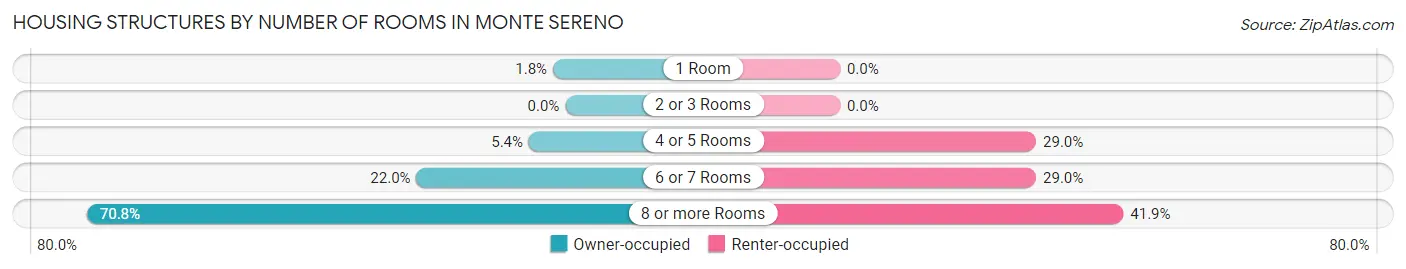
| Number of Rooms | Owner-occupied | Renter-occupied |
| 1 Room | 22 (1.8%) | 0 (0.0%) |
| 2 or 3 Rooms | 0 (0.0%) | 0 (0.0%) |
| 4 or 5 Rooms | 65 (5.4%) | 18 (29.0%) |
| 6 or 7 Rooms | 266 (22.0%) | 18 (29.0%) |
| 8 or more Rooms | 855 (70.8%) | 26 (41.9%) |
| Total | 1,208 (100.0%) | 62 (100.0%) |
Housing Structure by Heating Type in Monte Sereno
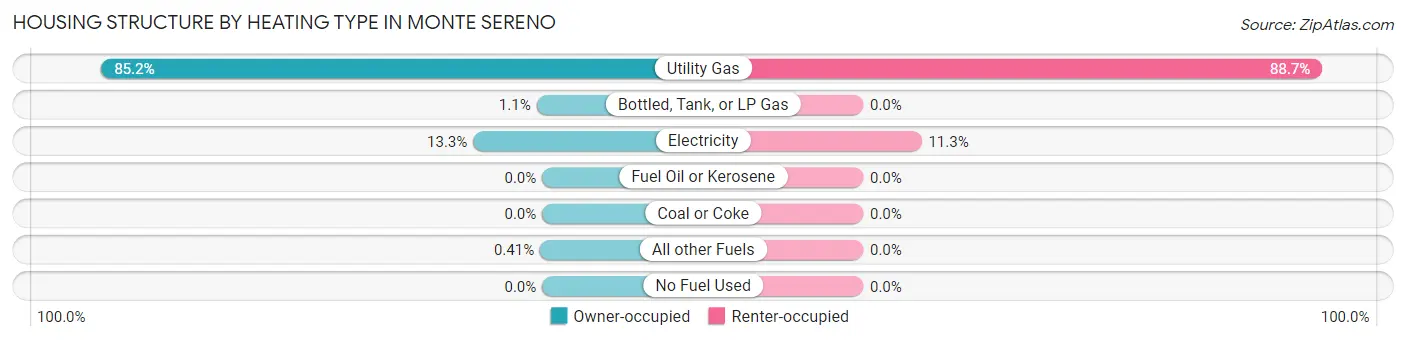
| Heating Type | Owner-occupied | Renter-occupied |
| Utility Gas | 1,029 (85.2%) | 55 (88.7%) |
| Bottled, Tank, or LP Gas | 13 (1.1%) | 0 (0.0%) |
| Electricity | 161 (13.3%) | 7 (11.3%) |
| Fuel Oil or Kerosene | 0 (0.0%) | 0 (0.0%) |
| Coal or Coke | 0 (0.0%) | 0 (0.0%) |
| All other Fuels | 5 (0.4%) | 0 (0.0%) |
| No Fuel Used | 0 (0.0%) | 0 (0.0%) |
| Total | 1,208 (100.0%) | 62 (100.0%) |
Household Vehicle Usage in Monte Sereno
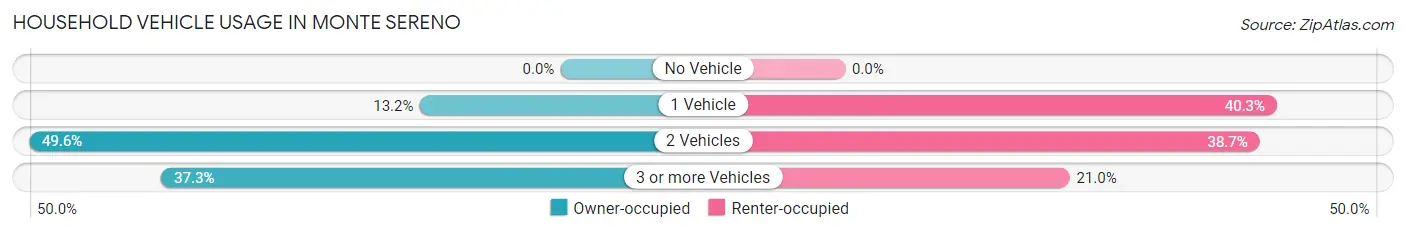
| Vehicles per Household | Owner-occupied | Renter-occupied |
| No Vehicle | 0 (0.0%) | 0 (0.0%) |
| 1 Vehicle | 159 (13.2%) | 25 (40.3%) |
| 2 Vehicles | 599 (49.6%) | 24 (38.7%) |
| 3 or more Vehicles | 450 (37.2%) | 13 (21.0%) |
| Total | 1,208 (100.0%) | 62 (100.0%) |
Real Estate & Mortgages in Monte Sereno
Real Estate and Mortgage Overview in Monte Sereno
| Characteristic | Without Mortgage | With Mortgage |
| Housing Units | 416 | 792 |
| Median Property Value | $2,000,001 | $2,000,001 |
| Median Household Income | $199,091 | $609 |
| Monthly Housing Costs | $1,501 | $764 |
| Real Estate Taxes | $10,001 | $0 |
Property Value by Mortgage Status in Monte Sereno
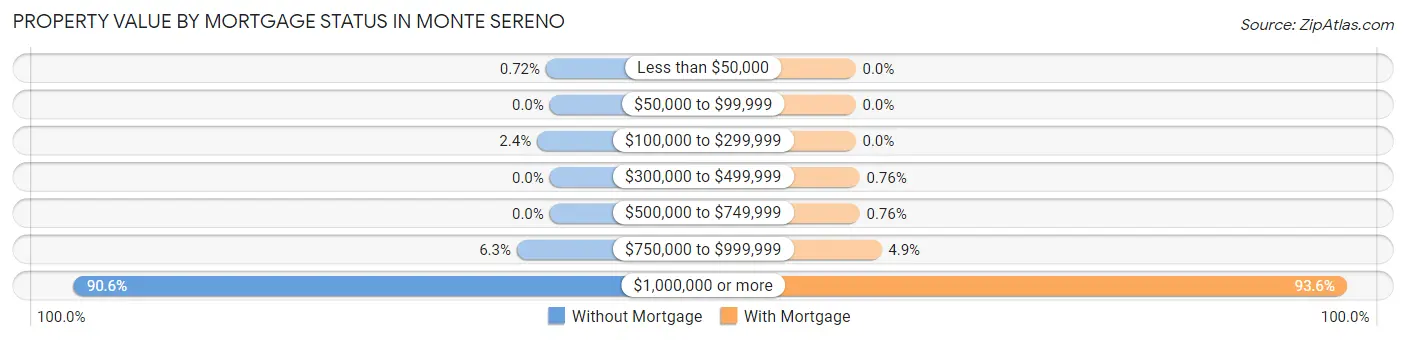
| Property Value | Without Mortgage | With Mortgage |
| Less than $50,000 | 3 (0.7%) | 0 (0.0%) |
| $50,000 to $99,999 | 0 (0.0%) | 0 (0.0%) |
| $100,000 to $299,999 | 10 (2.4%) | 0 (0.0%) |
| $300,000 to $499,999 | 0 (0.0%) | 6 (0.8%) |
| $500,000 to $749,999 | 0 (0.0%) | 6 (0.8%) |
| $750,000 to $999,999 | 26 (6.2%) | 39 (4.9%) |
| $1,000,000 or more | 377 (90.6%) | 741 (93.6%) |
| Total | 416 (100.0%) | 792 (100.0%) |
Household Income by Mortgage Status in Monte Sereno
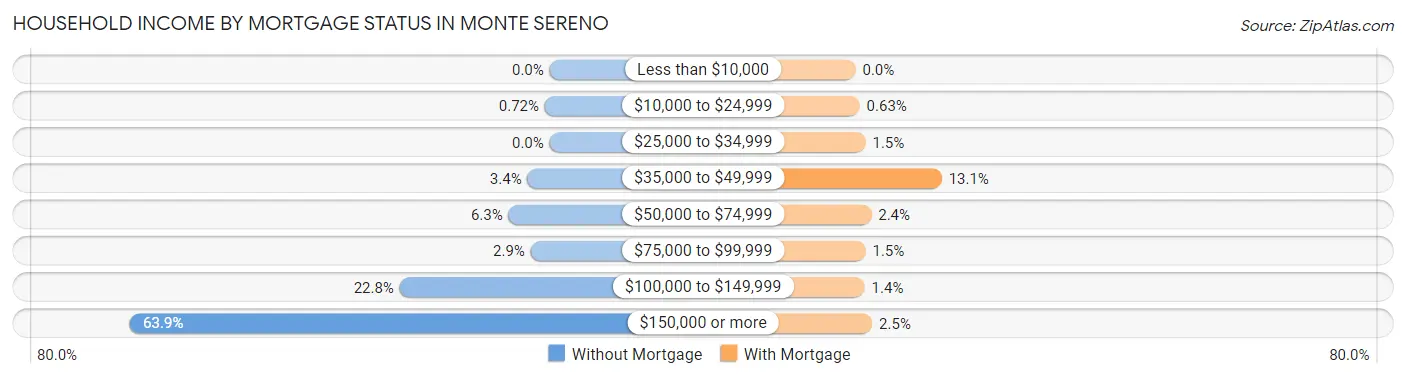
| Household Income | Without Mortgage | With Mortgage |
| Less than $10,000 | 0 (0.0%) | 0 (0.0%) |
| $10,000 to $24,999 | 3 (0.7%) | 5 (0.6%) |
| $25,000 to $34,999 | 0 (0.0%) | 12 (1.5%) |
| $35,000 to $49,999 | 14 (3.4%) | 104 (13.1%) |
| $50,000 to $74,999 | 26 (6.2%) | 19 (2.4%) |
| $75,000 to $99,999 | 12 (2.9%) | 12 (1.5%) |
| $100,000 to $149,999 | 95 (22.8%) | 11 (1.4%) |
| $150,000 or more | 266 (63.9%) | 20 (2.5%) |
| Total | 416 (100.0%) | 792 (100.0%) |
Property Value to Household Income Ratio in Monte Sereno
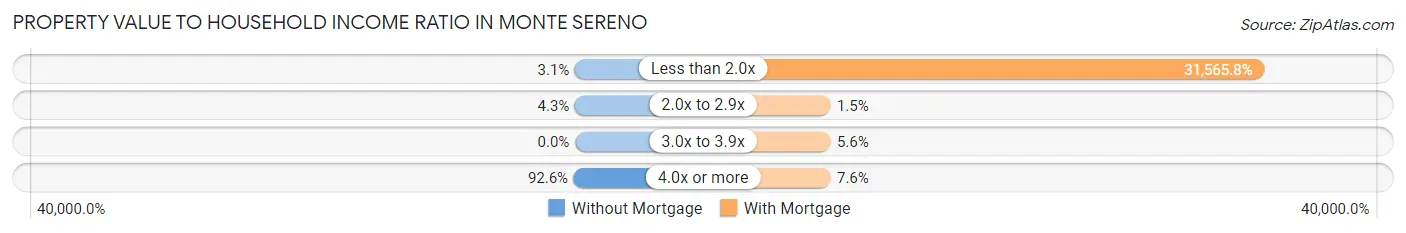
| Value-to-Income Ratio | Without Mortgage | With Mortgage |
| Less than 2.0x | 13 (3.1%) | 250,001 (31,565.8%) |
| 2.0x to 2.9x | 18 (4.3%) | 12 (1.5%) |
| 3.0x to 3.9x | 0 (0.0%) | 44 (5.6%) |
| 4.0x or more | 385 (92.5%) | 60 (7.6%) |
| Total | 416 (100.0%) | 792 (100.0%) |
Real Estate Taxes by Mortgage Status in Monte Sereno
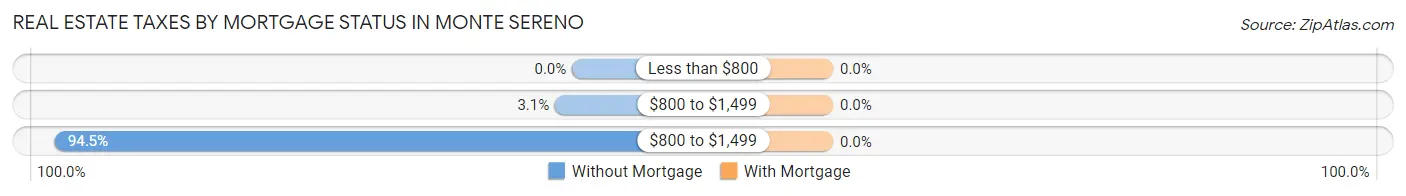
| Property Taxes | Without Mortgage | With Mortgage |
| Less than $800 | 0 (0.0%) | 0 (0.0%) |
| $800 to $1,499 | 13 (3.1%) | 0 (0.0%) |
| $800 to $1,499 | 393 (94.5%) | 0 (0.0%) |
| Total | 416 (100.0%) | 792 (100.0%) |
Health & Disability in Monte Sereno
Health Insurance Coverage by Age in Monte Sereno
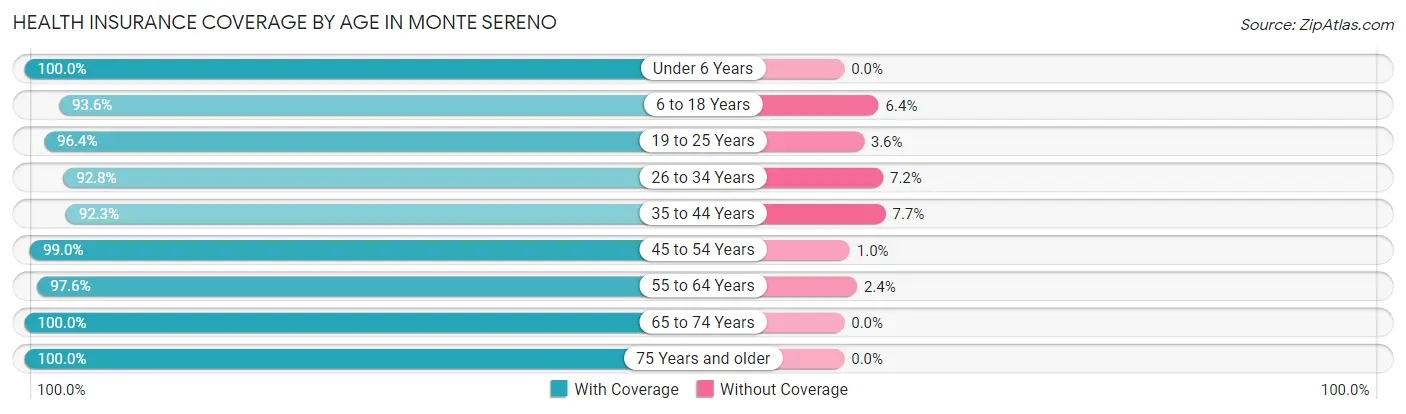
| Age Bracket | With Coverage | Without Coverage |
| Under 6 Years | 64 (100.0%) | 0 (0.0%) |
| 6 to 18 Years | 511 (93.6%) | 35 (6.4%) |
| 19 to 25 Years | 292 (96.4%) | 11 (3.6%) |
| 26 to 34 Years | 90 (92.8%) | 7 (7.2%) |
| 35 to 44 Years | 204 (92.3%) | 17 (7.7%) |
| 45 to 54 Years | 577 (99.0%) | 6 (1.0%) |
| 55 to 64 Years | 700 (97.6%) | 17 (2.4%) |
| 65 to 74 Years | 500 (100.0%) | 0 (0.0%) |
| 75 Years and older | 413 (100.0%) | 0 (0.0%) |
| Total | 3,351 (97.3%) | 93 (2.7%) |
Health Insurance Coverage by Citizenship Status in Monte Sereno
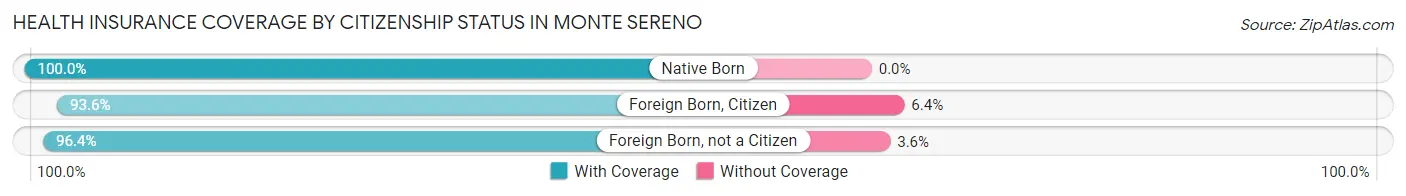
| Citizenship Status | With Coverage | Without Coverage |
| Native Born | 64 (100.0%) | 0 (0.0%) |
| Foreign Born, Citizen | 511 (93.6%) | 35 (6.4%) |
| Foreign Born, not a Citizen | 292 (96.4%) | 11 (3.6%) |
Health Insurance Coverage by Household Income in Monte Sereno
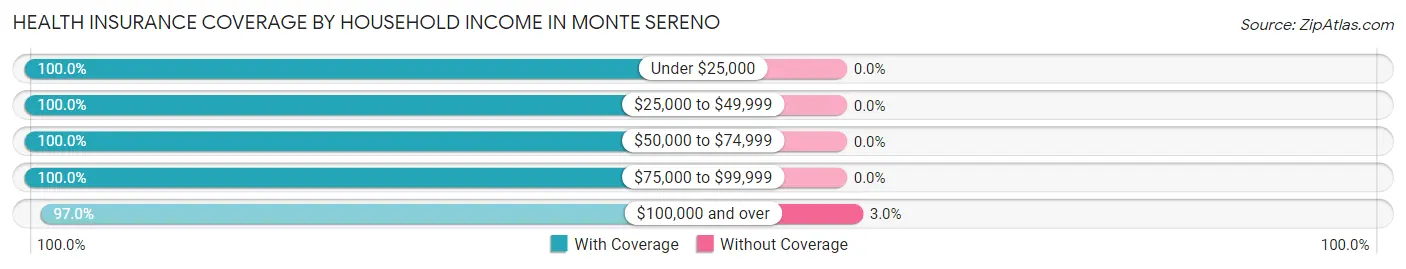
| Household Income | With Coverage | Without Coverage |
| Under $25,000 | 45 (100.0%) | 0 (0.0%) |
| $25,000 to $49,999 | 178 (100.0%) | 0 (0.0%) |
| $50,000 to $74,999 | 76 (100.0%) | 0 (0.0%) |
| $75,000 to $99,999 | 37 (100.0%) | 0 (0.0%) |
| $100,000 and over | 3,015 (97.0%) | 93 (3.0%) |
Public vs Private Health Insurance Coverage by Age in Monte Sereno
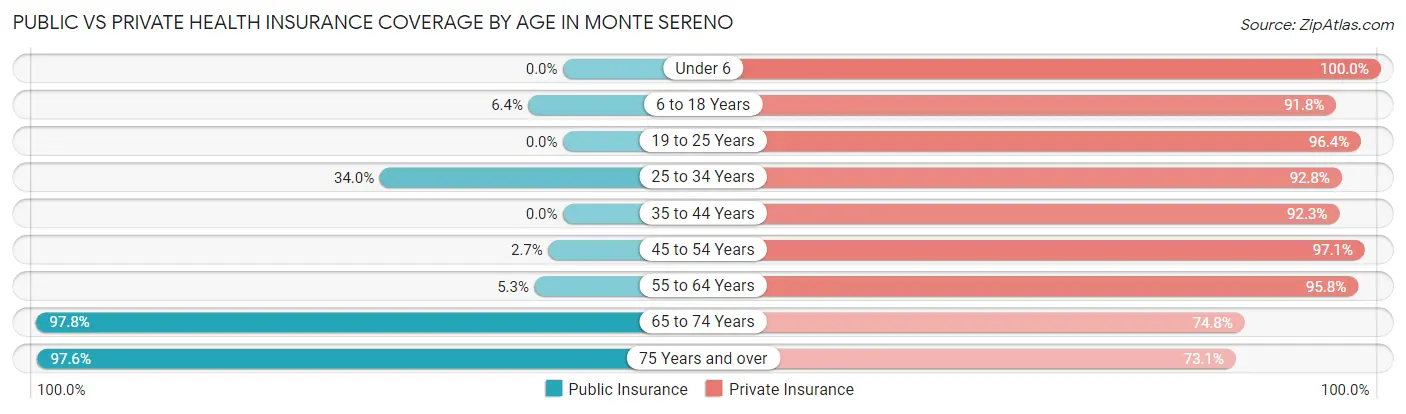
| Age Bracket | Public Insurance | Private Insurance |
| Under 6 | 0 (0.0%) | 64 (100.0%) |
| 6 to 18 Years | 35 (6.4%) | 501 (91.8%) |
| 19 to 25 Years | 0 (0.0%) | 292 (96.4%) |
| 25 to 34 Years | 33 (34.0%) | 90 (92.8%) |
| 35 to 44 Years | 0 (0.0%) | 204 (92.3%) |
| 45 to 54 Years | 16 (2.7%) | 566 (97.1%) |
| 55 to 64 Years | 38 (5.3%) | 687 (95.8%) |
| 65 to 74 Years | 489 (97.8%) | 374 (74.8%) |
| 75 Years and over | 403 (97.6%) | 302 (73.1%) |
| Total | 1,014 (29.4%) | 3,080 (89.4%) |
Disability Status by Sex by Age in Monte Sereno
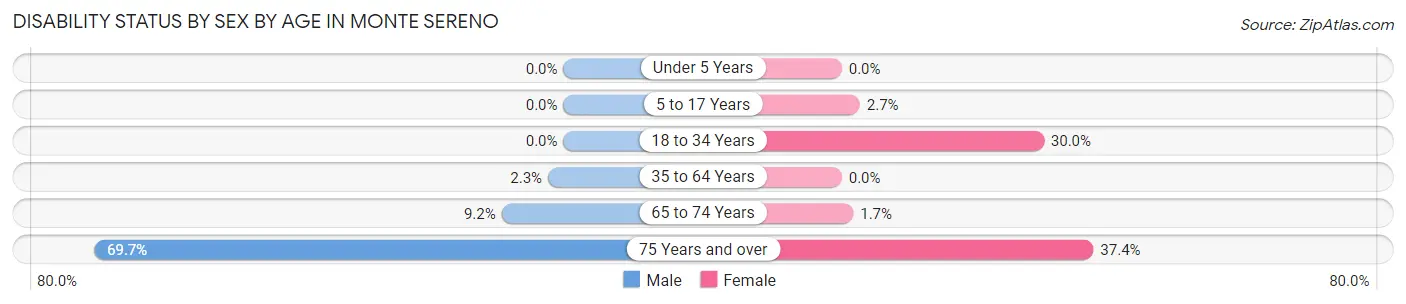
| Age Bracket | Male | Female |
| Under 5 Years | 0 (0.0%) | 0 (0.0%) |
| 5 to 17 Years | 0 (0.0%) | 7 (2.7%) |
| 18 to 34 Years | 0 (0.0%) | 33 (30.0%) |
| 35 to 64 Years | 17 (2.3%) | 0 (0.0%) |
| 65 to 74 Years | 19 (9.2%) | 5 (1.7%) |
| 75 Years and over | 161 (69.7%) | 68 (37.4%) |
Disability Class by Sex by Age in Monte Sereno
Disability Class: Hearing Difficulty
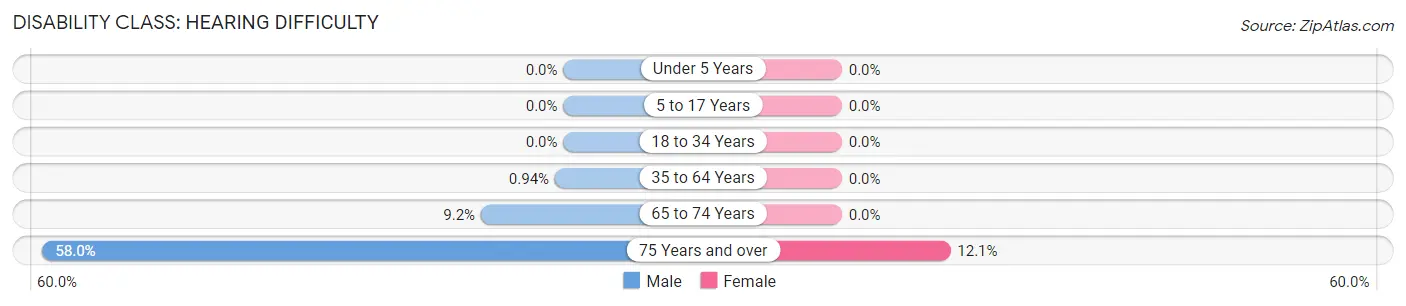
| Age Bracket | Male | Female |
| Under 5 Years | 0 (0.0%) | 0 (0.0%) |
| 5 to 17 Years | 0 (0.0%) | 0 (0.0%) |
| 18 to 34 Years | 0 (0.0%) | 0 (0.0%) |
| 35 to 64 Years | 7 (0.9%) | 0 (0.0%) |
| 65 to 74 Years | 19 (9.2%) | 0 (0.0%) |
| 75 Years and over | 134 (58.0%) | 22 (12.1%) |
Disability Class: Vision Difficulty
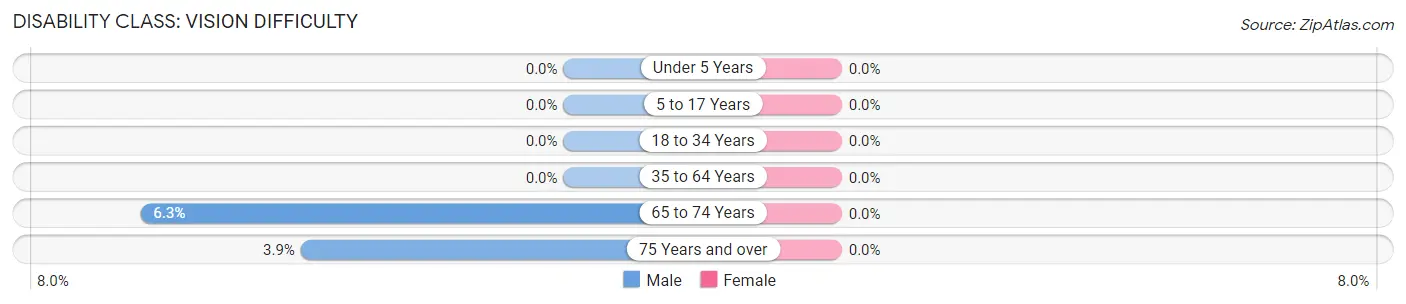
| Age Bracket | Male | Female |
| Under 5 Years | 0 (0.0%) | 0 (0.0%) |
| 5 to 17 Years | 0 (0.0%) | 0 (0.0%) |
| 18 to 34 Years | 0 (0.0%) | 0 (0.0%) |
| 35 to 64 Years | 0 (0.0%) | 0 (0.0%) |
| 65 to 74 Years | 13 (6.3%) | 0 (0.0%) |
| 75 Years and over | 9 (3.9%) | 0 (0.0%) |
Disability Class: Cognitive Difficulty
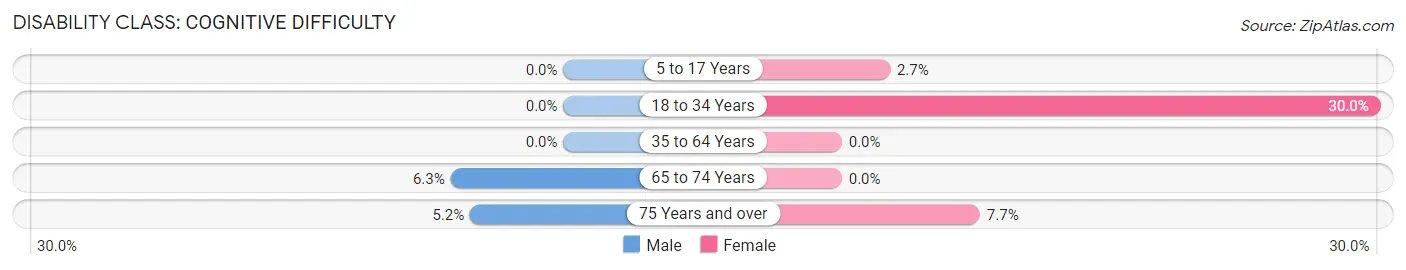
| Age Bracket | Male | Female |
| 5 to 17 Years | 0 (0.0%) | 7 (2.7%) |
| 18 to 34 Years | 0 (0.0%) | 33 (30.0%) |
| 35 to 64 Years | 0 (0.0%) | 0 (0.0%) |
| 65 to 74 Years | 13 (6.3%) | 0 (0.0%) |
| 75 Years and over | 12 (5.2%) | 14 (7.7%) |
Disability Class: Ambulatory Difficulty
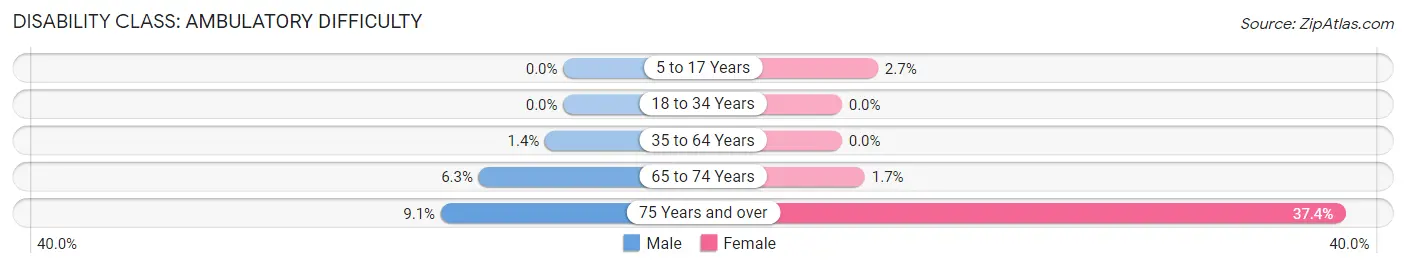
| Age Bracket | Male | Female |
| 5 to 17 Years | 0 (0.0%) | 7 (2.7%) |
| 18 to 34 Years | 0 (0.0%) | 0 (0.0%) |
| 35 to 64 Years | 10 (1.3%) | 0 (0.0%) |
| 65 to 74 Years | 13 (6.3%) | 5 (1.7%) |
| 75 Years and over | 21 (9.1%) | 68 (37.4%) |
Disability Class: Self-Care Difficulty
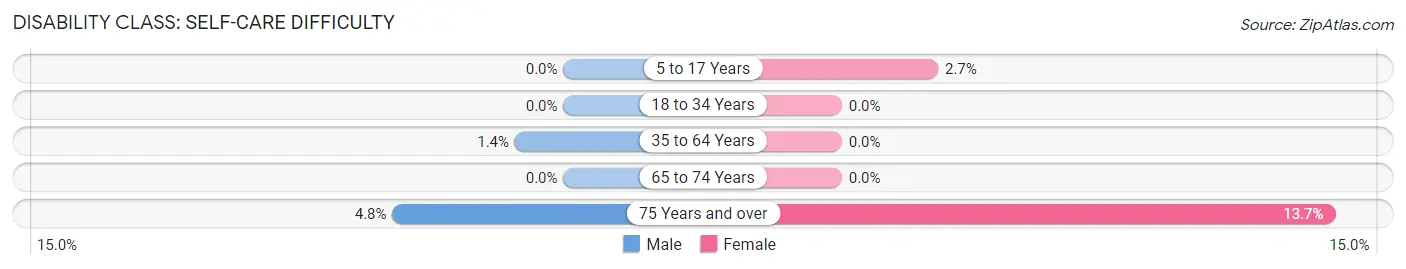
| Age Bracket | Male | Female |
| 5 to 17 Years | 0 (0.0%) | 7 (2.7%) |
| 18 to 34 Years | 0 (0.0%) | 0 (0.0%) |
| 35 to 64 Years | 10 (1.3%) | 0 (0.0%) |
| 65 to 74 Years | 0 (0.0%) | 0 (0.0%) |
| 75 Years and over | 11 (4.8%) | 25 (13.7%) |
Technology Access in Monte Sereno
Computing Device Access in Monte Sereno
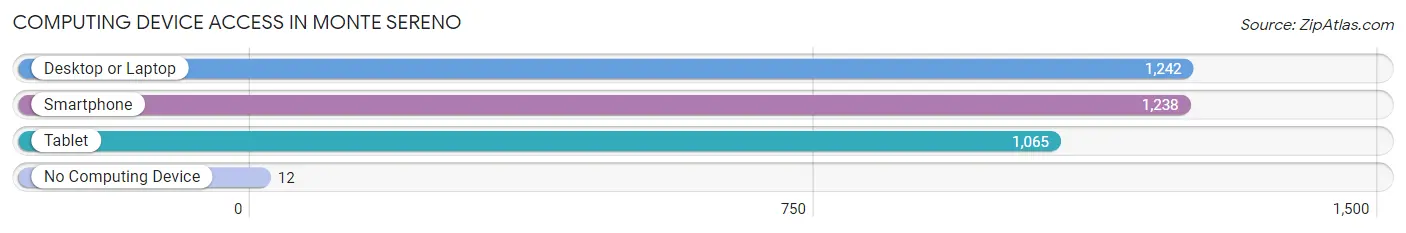
| Device Type | # Households | % Households |
| Desktop or Laptop | 1,242 | 97.8% |
| Smartphone | 1,238 | 97.5% |
| Tablet | 1,065 | 83.9% |
| No Computing Device | 12 | 0.9% |
| Total | 1,270 | 100.0% |
Internet Access in Monte Sereno
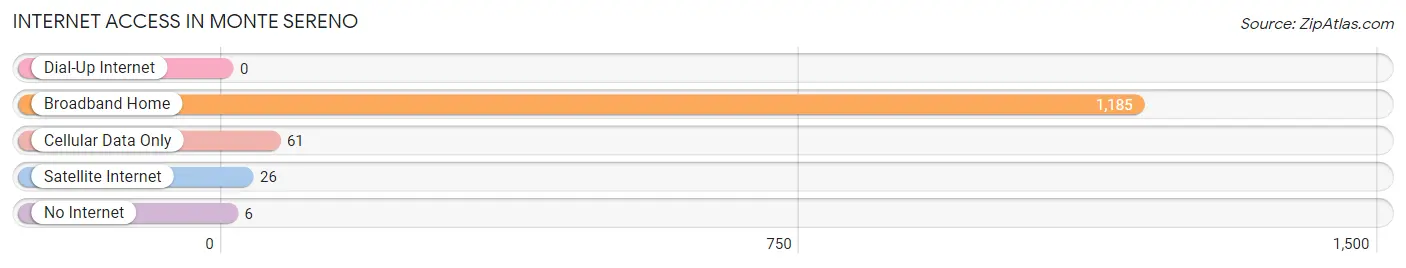
| Internet Type | # Households | % Households |
| Dial-Up Internet | 0 | 0.0% |
| Broadband Home | 1,185 | 93.3% |
| Cellular Data Only | 61 | 4.8% |
| Satellite Internet | 26 | 2.1% |
| No Internet | 6 | 0.5% |
| Total | 1,270 | 100.0% |
Monte Sereno Summary
Monte Sereno is a small city located in Santa Clara County, California, United States. It is situated in the foothills of the Santa Cruz Mountains, about 10 miles (16 km) southwest of San Jose and 50 miles (80 km) southeast of San Francisco. As of the 2010 census, the city had a population of 3,341.
History
Monte Sereno was originally part of the Rancho Rinconada de Los Gatos land grant, which was granted to José María Alviso in 1839. The area was later subdivided and sold to settlers in the late 19th century. The city was incorporated in 1957, and its name is derived from the Italian phrase for “serene mountain.”
Geography
Monte Sereno is located at 37°14′N 121°59′W (37.23, -121.98). According to the United States Census Bureau, the city has a total area of 2.2 square miles (5.7 km2), all of it land.
Economy
Monte Sereno is a small city with a limited economic base. The city’s primary industry is residential real estate, with a few small businesses located in the city. The city is also home to several technology companies, including Apple Inc., Google, and Oracle.
Demographics
As of the 2010 census, there were 3,341 people, 1,093 households, and 890 families residing in the city. The population density was 1,521.2 people per square mile (586.3/km2). The racial makeup of the city was 79.2% White, 0.7% African American, 0.2% Native American, 15.2% Asian, 0.1% Pacific Islander, 1.3% from other races, and 3.3% from two or more races. Hispanic or Latino of any race were 6.2% of the population.
There were 1,093 households, out of which 39.2% had children under the age of 18 living with them, 68.2% were married couples living together, 6.7% had a female householder with no husband present, and 22.2% were non-families. 17.2% of all households were made up of individuals, and 6.7% had someone living alone who was 65 years of age or older. The average household size was 3.04 and the average family size was 3.45.
In the city, the population was spread out, with 28.7% under the age of 18, 4.7% from 18 to 24, 24.2% from 25 to 44, 32.2% from 45 to 64, and 10.2% who were 65 years of age or older. The median age was 40 years. For every 100 females, there were 97.2 males. For every 100 females age 18 and over, there were 94.2 males.
The median income for a household in the city was $142,857, and the median income for a family was $157,857. Males had a median income of $100,000 versus $60,000 for females. The per capita income for the city was $68,857. About 1.7% of families and 2.7% of the population were below the poverty line, including 2.2% of those under age 18 and none of those age 65 or over.
Common Questions
What is Per Capita Income in Monte Sereno?
Per Capita income in Monte Sereno is $157,911.
What is the Median Family Income in Monte Sereno?
Median Family Income in Monte Sereno is $250,001.
What is the Median Household income in Monte Sereno?
Median Household Income in Monte Sereno is $250,001.
What is Income or Wage Gap in Monte Sereno?
Income or Wage Gap in Monte Sereno is 57.8%.
Women in Monte Sereno earn 42.2 cents for every dollar earned by a man.
What is Inequality or Gini Index in Monte Sereno?
Inequality or Gini Index in Monte Sereno is 0.49.
What is the Total Population of Monte Sereno?
Total Population of Monte Sereno is 3,444.
What is the Total Male Population of Monte Sereno?
Total Male Population of Monte Sereno is 1,804.
What is the Total Female Population of Monte Sereno?
Total Female Population of Monte Sereno is 1,640.
What is the Ratio of Males per 100 Females in Monte Sereno?
There are 110.00 Males per 100 Females in Monte Sereno.
What is the Ratio of Females per 100 Males in Monte Sereno?
There are 90.91 Females per 100 Males in Monte Sereno.
What is the Median Population Age in Monte Sereno?
Median Population Age in Monte Sereno is 53.7 Years.
What is the Average Family Size in Monte Sereno
Average Family Size in Monte Sereno is 3.0 People.
What is the Average Household Size in Monte Sereno
Average Household Size in Monte Sereno is 2.7 People.
How Large is the Labor Force in Monte Sereno?
There are 1,542 People in the Labor Forcein in Monte Sereno.
What is the Percentage of People in the Labor Force in Monte Sereno?
52.9% of People are in the Labor Force in Monte Sereno.
What is the Unemployment Rate in Monte Sereno?
Unemployment Rate in Monte Sereno is 0.9%.