Bear Valley Springs, CA Map & Demographics
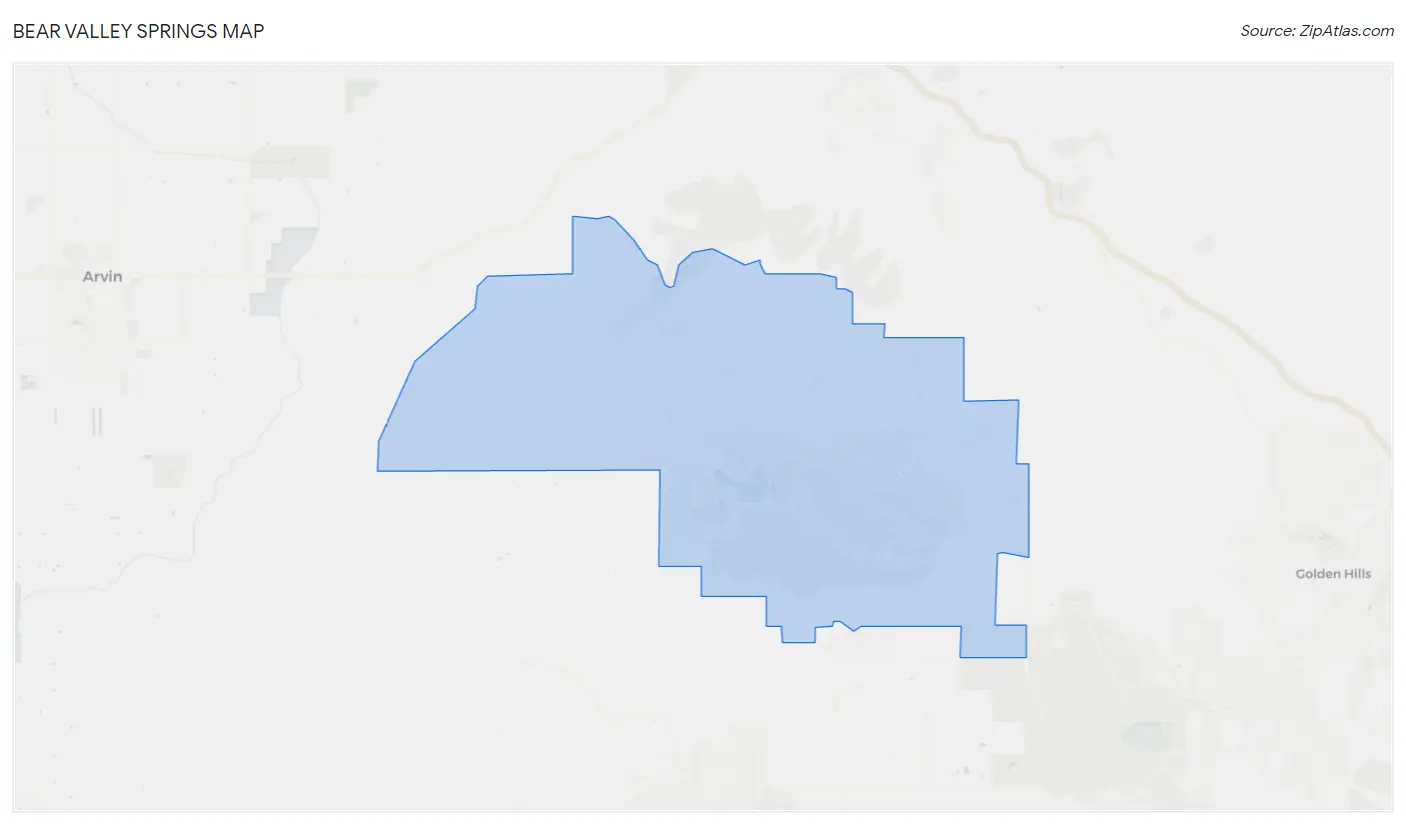
Bear Valley Springs Map
Bear Valley Springs Overview
$56,047
PER CAPITA INCOME
$142,886
AVG FAMILY INCOME
$115,135
AVG HOUSEHOLD INCOME
61.7%
WAGE / INCOME GAP [ % ]
38.3¢/ $1
WAGE / INCOME GAP [ $ ]
0.37
INEQUALITY / GINI INDEX
5,598
TOTAL POPULATION
2,950
MALE POPULATION
2,648
FEMALE POPULATION
111.40
MALES / 100 FEMALES
89.76
FEMALES / 100 MALES
55.0
MEDIAN AGE
2.7
AVG FAMILY SIZE
2.3
AVG HOUSEHOLD SIZE
2,141
LABOR FORCE [ PEOPLE ]
45.3%
PERCENT IN LABOR FORCE
3.2%
UNEMPLOYMENT RATE
Bear Valley Springs Area Codes
Income in Bear Valley Springs
Income Overview in Bear Valley Springs
Per Capita Income in Bear Valley Springs is $56,047, while median incomes of families and households are $142,886 and $115,135 respectively.
| Characteristic | Number | Measure |
| Per Capita Income | 5,598 | $56,047 |
| Median Family Income | 1,733 | $142,886 |
| Mean Family Income | 1,733 | $151,530 |
| Median Household Income | 2,429 | $115,135 |
| Mean Household Income | 2,429 | $130,334 |
| Income Deficit | 1,733 | $0 |
| Wage / Income Gap (%) | 5,598 | 61.66% |
| Wage / Income Gap ($) | 5,598 | 38.34¢ per $1 |
| Gini / Inequality Index | 5,598 | 0.37 |
Earnings by Sex in Bear Valley Springs
Average Earnings in Bear Valley Springs are $54,815, $90,536 for men and $34,712 for women, a difference of 61.7%.
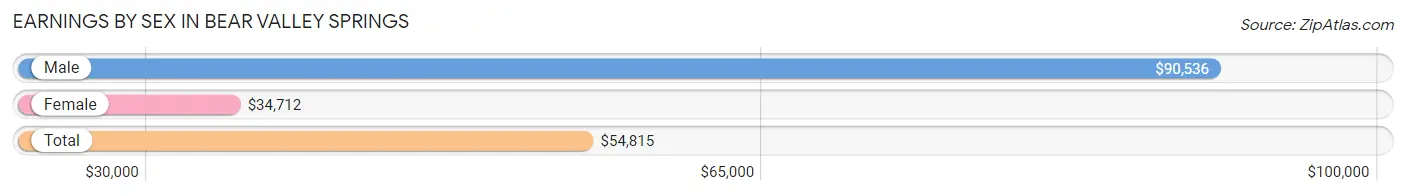
| Sex | Number | Average Earnings |
| Male | 1,315 (58.4%) | $90,536 |
| Female | 935 (41.6%) | $34,712 |
| Total | 2,250 (100.0%) | $54,815 |
Earnings by Sex by Income Bracket in Bear Valley Springs
The most common earnings brackets in Bear Valley Springs are $100,000+ for men (626 | 47.6%) and $100,000+ for women (144 | 15.4%).
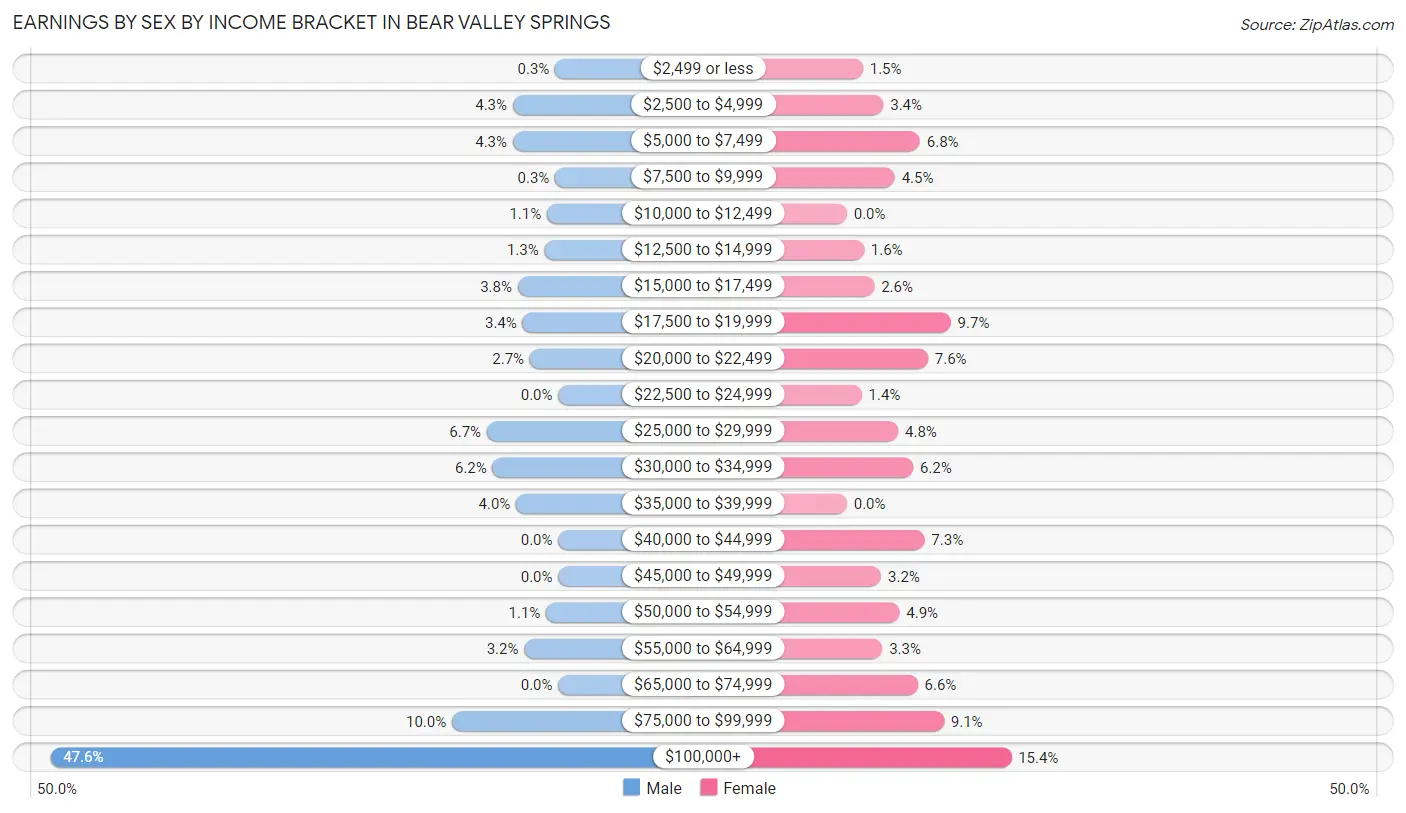
| Income | Male | Female |
| $2,499 or less | 4 (0.3%) | 14 (1.5%) |
| $2,500 to $4,999 | 56 (4.3%) | 32 (3.4%) |
| $5,000 to $7,499 | 56 (4.3%) | 64 (6.8%) |
| $7,500 to $9,999 | 4 (0.3%) | 42 (4.5%) |
| $10,000 to $12,499 | 14 (1.1%) | 0 (0.0%) |
| $12,500 to $14,999 | 17 (1.3%) | 15 (1.6%) |
| $15,000 to $17,499 | 50 (3.8%) | 24 (2.6%) |
| $17,500 to $19,999 | 44 (3.4%) | 91 (9.7%) |
| $20,000 to $22,499 | 35 (2.7%) | 71 (7.6%) |
| $22,500 to $24,999 | 0 (0.0%) | 13 (1.4%) |
| $25,000 to $29,999 | 88 (6.7%) | 45 (4.8%) |
| $30,000 to $34,999 | 81 (6.2%) | 58 (6.2%) |
| $35,000 to $39,999 | 52 (4.0%) | 0 (0.0%) |
| $40,000 to $44,999 | 0 (0.0%) | 68 (7.3%) |
| $45,000 to $49,999 | 0 (0.0%) | 30 (3.2%) |
| $50,000 to $54,999 | 15 (1.1%) | 46 (4.9%) |
| $55,000 to $64,999 | 42 (3.2%) | 31 (3.3%) |
| $65,000 to $74,999 | 0 (0.0%) | 62 (6.6%) |
| $75,000 to $99,999 | 131 (10.0%) | 85 (9.1%) |
| $100,000+ | 626 (47.6%) | 144 (15.4%) |
| Total | 1,315 (100.0%) | 935 (100.0%) |
Earnings by Sex by Educational Attainment in Bear Valley Springs
Average earnings in Bear Valley Springs are $110,000 for men and $41,447 for women, a difference of 62.3%. Men with an educational attainment of bachelor's degree enjoy the highest average annual earnings of $155,391, while those with college or associate's degree education earn the least with $116,776. Women with an educational attainment of graduate degree earn the most with the average annual earnings of $53,125, while those with bachelor's degree education have the smallest earnings of $41,397.
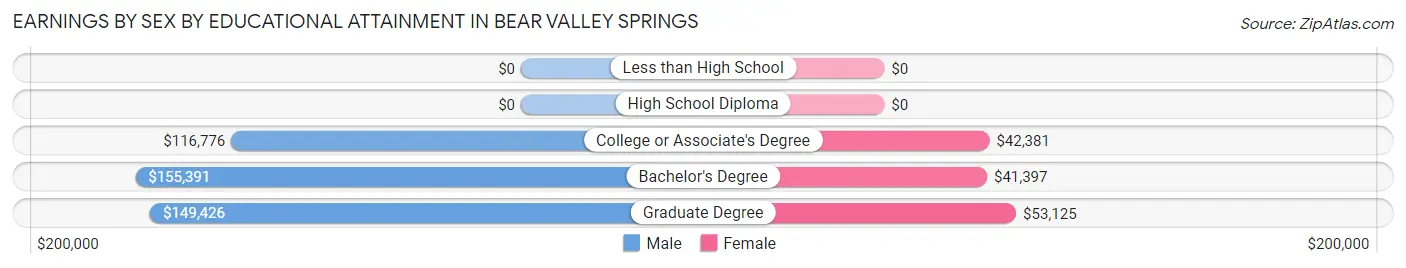
| Educational Attainment | Male Income | Female Income |
| Less than High School | - | - |
| High School Diploma | - | - |
| College or Associate's Degree | $116,776 | $42,381 |
| Bachelor's Degree | $155,391 | $41,397 |
| Graduate Degree | $149,426 | $53,125 |
| Total | $110,000 | $41,447 |
Family Income in Bear Valley Springs
Family Income Brackets in Bear Valley Springs
According to the Bear Valley Springs family income data, there are 523 families falling into the $200,000+ income range, which is the most common income bracket and makes up 30.2% of all families.
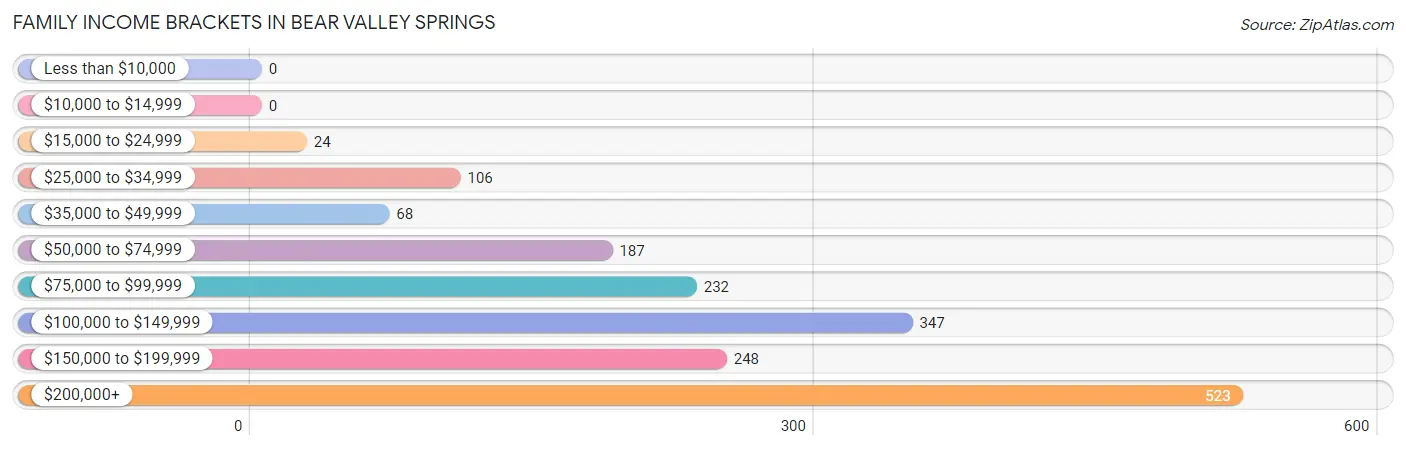
| Income Bracket | # Families | % Families |
| Less than $10,000 | 0 | 0.0% |
| $10,000 to $14,999 | 0 | 0.0% |
| $15,000 to $24,999 | 24 | 1.4% |
| $25,000 to $34,999 | 106 | 6.1% |
| $35,000 to $49,999 | 68 | 3.9% |
| $50,000 to $74,999 | 187 | 10.8% |
| $75,000 to $99,999 | 232 | 13.4% |
| $100,000 to $149,999 | 347 | 20.0% |
| $150,000 to $199,999 | 248 | 14.3% |
| $200,000+ | 523 | 30.2% |
Family Income by Famaliy Size in Bear Valley Springs
4-person families (179 | 10.3%) account for the highest median family income in Bear Valley Springs with $144,568 per family, while 2-person families (1,142 | 65.9%) have the highest median income of $63,458 per family member.
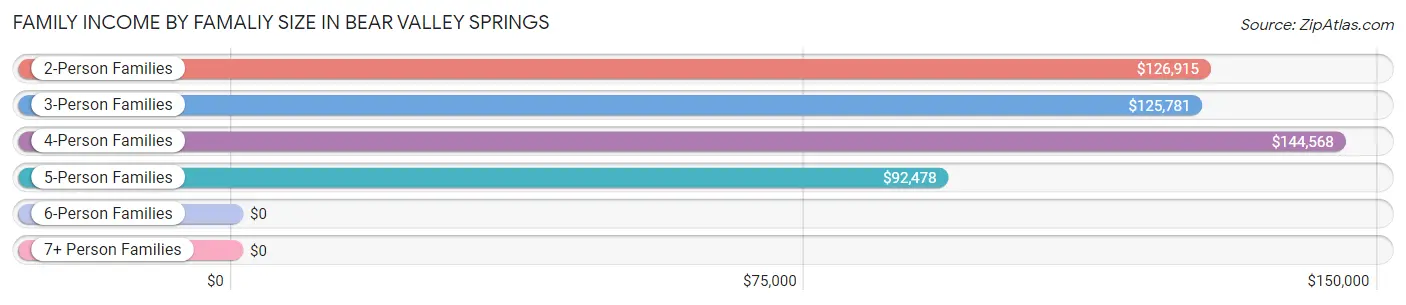
| Income Bracket | # Families | Median Income |
| 2-Person Families | 1,142 (65.9%) | $126,915 |
| 3-Person Families | 233 (13.4%) | $125,781 |
| 4-Person Families | 179 (10.3%) | $144,568 |
| 5-Person Families | 155 (8.9%) | $92,478 |
| 6-Person Families | 24 (1.4%) | $0 |
| 7+ Person Families | 0 (0.0%) | $0 |
| Total | 1,733 (100.0%) | $142,886 |
Family Income by Number of Earners in Bear Valley Springs
The median family income in Bear Valley Springs is $142,886, with families comprising 3+ earners (113) having the highest median family income of $250,001, while families with no earners (706) have the lowest median family income of $102,083, accounting for 6.5% and 40.7% of families, respectively.
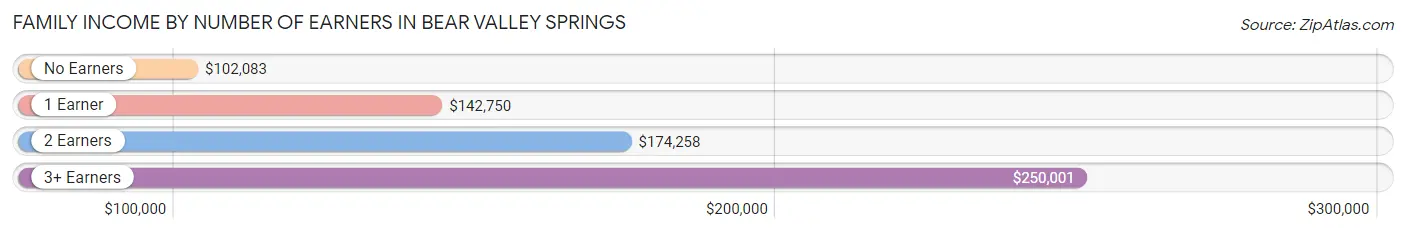
| Number of Earners | # Families | Median Income |
| No Earners | 706 (40.7%) | $102,083 |
| 1 Earner | 353 (20.4%) | $142,750 |
| 2 Earners | 561 (32.4%) | $174,258 |
| 3+ Earners | 113 (6.5%) | $250,001 |
| Total | 1,733 (100.0%) | $142,886 |
Household Income in Bear Valley Springs
Household Income Brackets in Bear Valley Springs
With 539 households falling in the category, the $100,000 to $149,999 income range is the most frequent in Bear Valley Springs, accounting for 22.2% of all households. In contrast, only 32 households (1.3%) fall into the $10,000 to $14,999 income bracket, making it the least populous group.
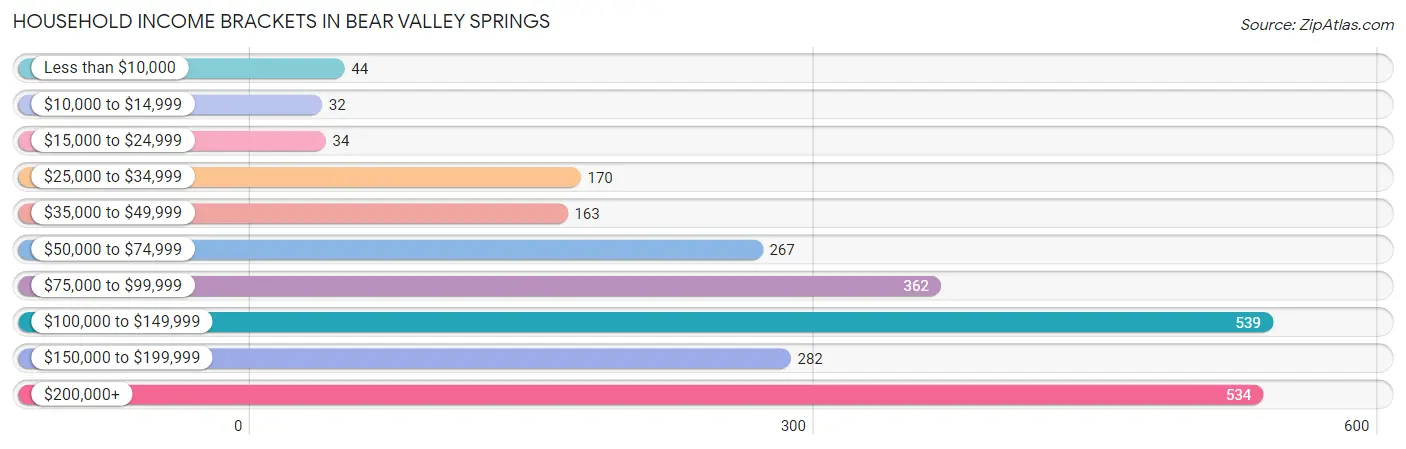
| Income Bracket | # Households | % Households |
| Less than $10,000 | 44 | 1.8% |
| $10,000 to $14,999 | 32 | 1.3% |
| $15,000 to $24,999 | 34 | 1.4% |
| $25,000 to $34,999 | 170 | 7.0% |
| $35,000 to $49,999 | 163 | 6.7% |
| $50,000 to $74,999 | 267 | 11.0% |
| $75,000 to $99,999 | 362 | 14.9% |
| $100,000 to $149,999 | 539 | 22.2% |
| $150,000 to $199,999 | 282 | 11.6% |
| $200,000+ | 534 | 22.0% |
Household Income by Householder Age in Bear Valley Springs
The median household income in Bear Valley Springs is $115,135, with the highest median household income of $148,795 found in the 45 to 64 years age bracket for the primary householder. A total of 783 households (32.2%) fall into this category. Meanwhile, the 15 to 24 years age bracket for the primary householder has the lowest median household income of $0, with 14 households (0.6%) in this group.
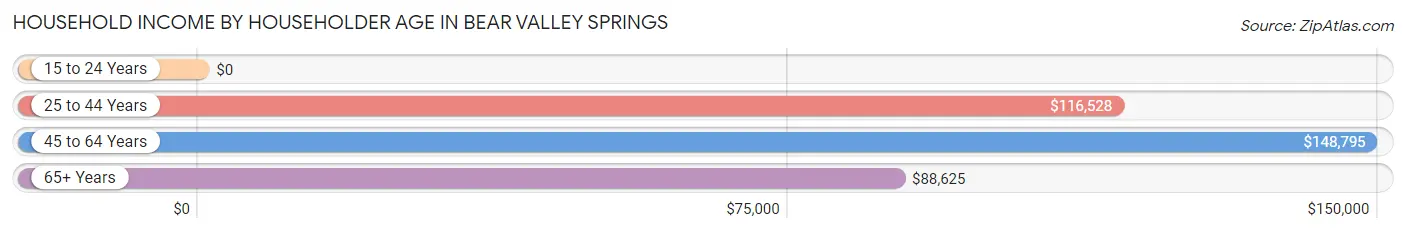
| Income Bracket | # Households | Median Income |
| 15 to 24 Years | 14 (0.6%) | $0 |
| 25 to 44 Years | 441 (18.2%) | $116,528 |
| 45 to 64 Years | 783 (32.2%) | $148,795 |
| 65+ Years | 1,191 (49.0%) | $88,625 |
| Total | 2,429 (100.0%) | $115,135 |
Poverty in Bear Valley Springs
Income Below Poverty by Sex and Age in Bear Valley Springs
With 3.3% poverty level for males and 3.2% for females among the residents of Bear Valley Springs, under 5 year old males and 18 to 24 year old females are the most vulnerable to poverty, with 26 males (22.0%) and 13 females (68.4%) in their respective age groups living below the poverty level.
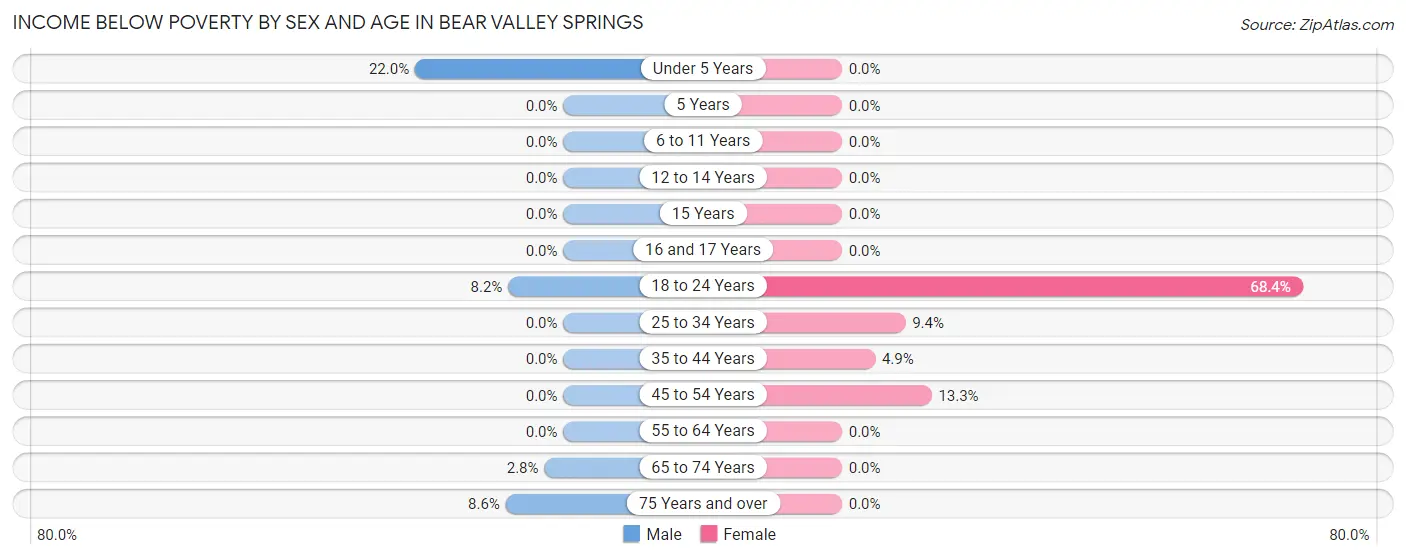
| Age Bracket | Male | Female |
| Under 5 Years | 26 (22.0%) | 0 (0.0%) |
| 5 Years | 0 (0.0%) | 0 (0.0%) |
| 6 to 11 Years | 0 (0.0%) | 0 (0.0%) |
| 12 to 14 Years | 0 (0.0%) | 0 (0.0%) |
| 15 Years | 0 (0.0%) | 0 (0.0%) |
| 16 and 17 Years | 0 (0.0%) | 0 (0.0%) |
| 18 to 24 Years | 14 (8.2%) | 13 (68.4%) |
| 25 to 34 Years | 0 (0.0%) | 21 (9.4%) |
| 35 to 44 Years | 0 (0.0%) | 13 (4.9%) |
| 45 to 54 Years | 0 (0.0%) | 37 (13.3%) |
| 55 to 64 Years | 0 (0.0%) | 0 (0.0%) |
| 65 to 74 Years | 13 (2.8%) | 0 (0.0%) |
| 75 Years and over | 44 (8.6%) | 0 (0.0%) |
| Total | 97 (3.3%) | 84 (3.2%) |
Income Above Poverty by Sex and Age in Bear Valley Springs
According to the poverty statistics in Bear Valley Springs, males aged 5 years and females aged under 5 years are the age groups that are most secure financially, with 100.0% of males and 100.0% of females in these age groups living above the poverty line.
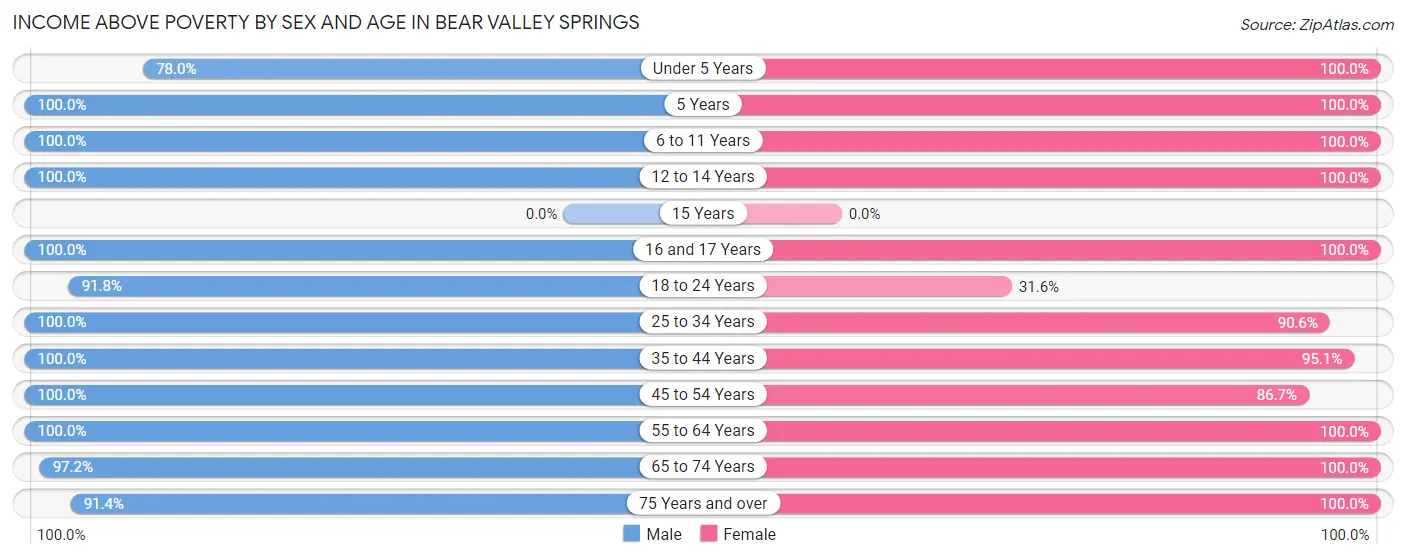
| Age Bracket | Male | Female |
| Under 5 Years | 92 (78.0%) | 206 (100.0%) |
| 5 Years | 26 (100.0%) | 33 (100.0%) |
| 6 to 11 Years | 245 (100.0%) | 155 (100.0%) |
| 12 to 14 Years | 29 (100.0%) | 60 (100.0%) |
| 15 Years | 0 (0.0%) | 0 (0.0%) |
| 16 and 17 Years | 59 (100.0%) | 85 (100.0%) |
| 18 to 24 Years | 157 (91.8%) | 6 (31.6%) |
| 25 to 34 Years | 416 (100.0%) | 202 (90.6%) |
| 35 to 44 Years | 166 (100.0%) | 251 (95.1%) |
| 45 to 54 Years | 245 (100.0%) | 241 (86.7%) |
| 55 to 64 Years | 500 (100.0%) | 478 (100.0%) |
| 65 to 74 Years | 448 (97.2%) | 606 (100.0%) |
| 75 Years and over | 470 (91.4%) | 241 (100.0%) |
| Total | 2,853 (96.7%) | 2,564 (96.8%) |
Income Below Poverty Among Married-Couple Families in Bear Valley Springs
The poverty statistics for married-couple families in Bear Valley Springs show that 0.9% or 14 of the total 1,551 families live below the poverty line. Families with 1 or 2 children have the highest poverty rate of 5.1%, comprising of 14 families. On the other hand, families with no children have the lowest poverty rate of 0.0%, which includes 0 families.
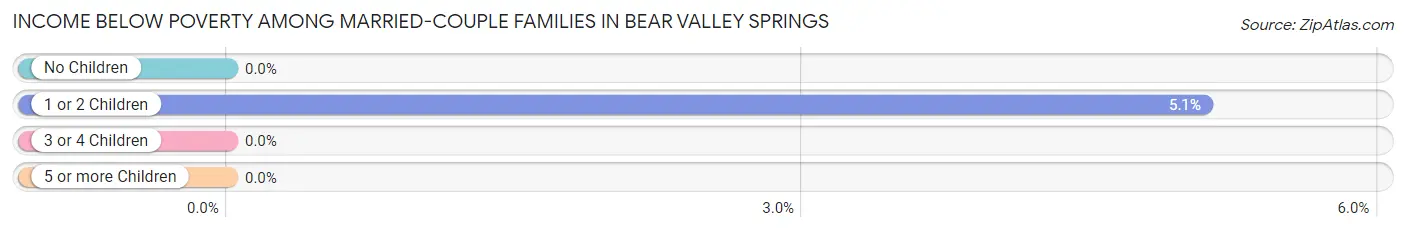
| Children | Above Poverty | Below Poverty |
| No Children | 1,138 (100.0%) | 0 (0.0%) |
| 1 or 2 Children | 261 (94.9%) | 14 (5.1%) |
| 3 or 4 Children | 138 (100.0%) | 0 (0.0%) |
| 5 or more Children | 0 (0.0%) | 0 (0.0%) |
| Total | 1,537 (99.1%) | 14 (0.9%) |
Income Below Poverty Among Single-Parent Households in Bear Valley Springs
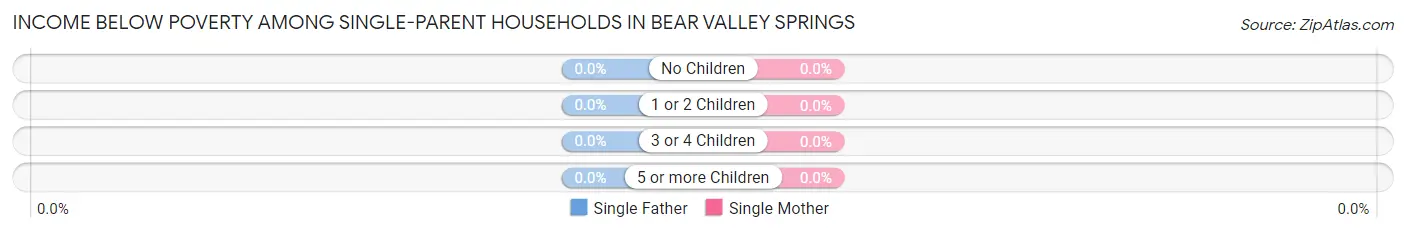
| Children | Single Father | Single Mother |
| No Children | 0 (0.0%) | 0 (0.0%) |
| 1 or 2 Children | 0 (0.0%) | 0 (0.0%) |
| 3 or 4 Children | 0 (0.0%) | 0 (0.0%) |
| 5 or more Children | 0 (0.0%) | 0 (0.0%) |
| Total | 0 (0.0%) | 0 (0.0%) |
Income Below Poverty Among Married-Couple vs Single-Parent Households in Bear Valley Springs
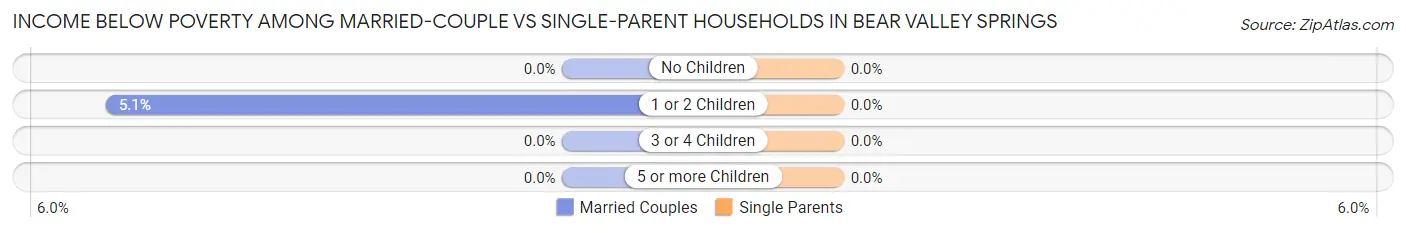
| Children | Married-Couple Families | Single-Parent Households |
| No Children | 0 (0.0%) | 0 (0.0%) |
| 1 or 2 Children | 14 (5.1%) | 0 (0.0%) |
| 3 or 4 Children | 0 (0.0%) | 0 (0.0%) |
| 5 or more Children | 0 (0.0%) | 0 (0.0%) |
| Total | 14 (0.9%) | 0 (0.0%) |
Race in Bear Valley Springs
The most populous races in Bear Valley Springs are White / Caucasian (4,628 | 82.7%), Hispanic or Latino (709 | 12.7%), and Two or more Races (437 | 7.8%).
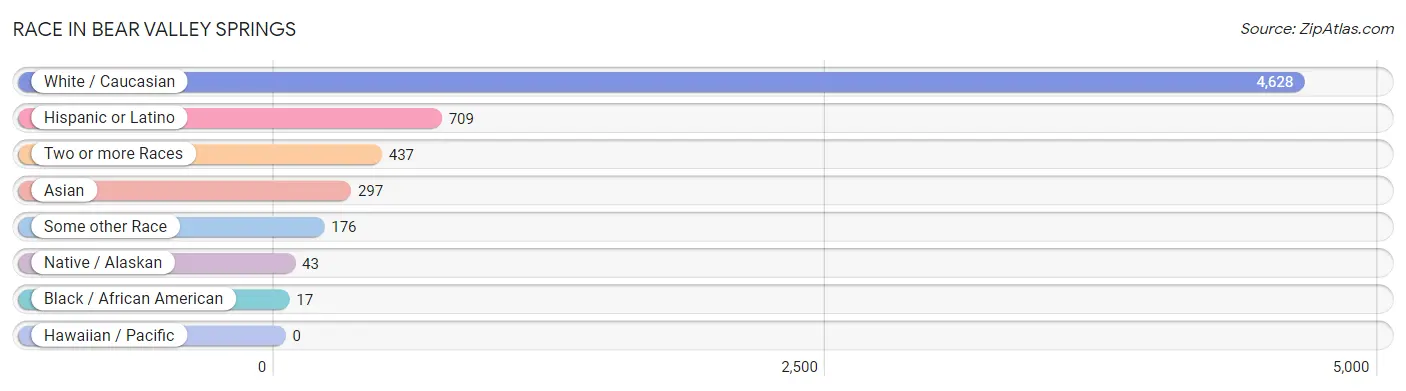
| Race | # Population | % Population |
| Asian | 297 | 5.3% |
| Black / African American | 17 | 0.3% |
| Hawaiian / Pacific | 0 | 0.0% |
| Hispanic or Latino | 709 | 12.7% |
| Native / Alaskan | 43 | 0.8% |
| White / Caucasian | 4,628 | 82.7% |
| Two or more Races | 437 | 7.8% |
| Some other Race | 176 | 3.1% |
| Total | 5,598 | 100.0% |
Ancestry in Bear Valley Springs
The most populous ancestries reported in Bear Valley Springs are German (953 | 17.0%), English (894 | 16.0%), Irish (634 | 11.3%), European (544 | 9.7%), and Mexican (464 | 8.3%), together accounting for 62.3% of all Bear Valley Springs residents.
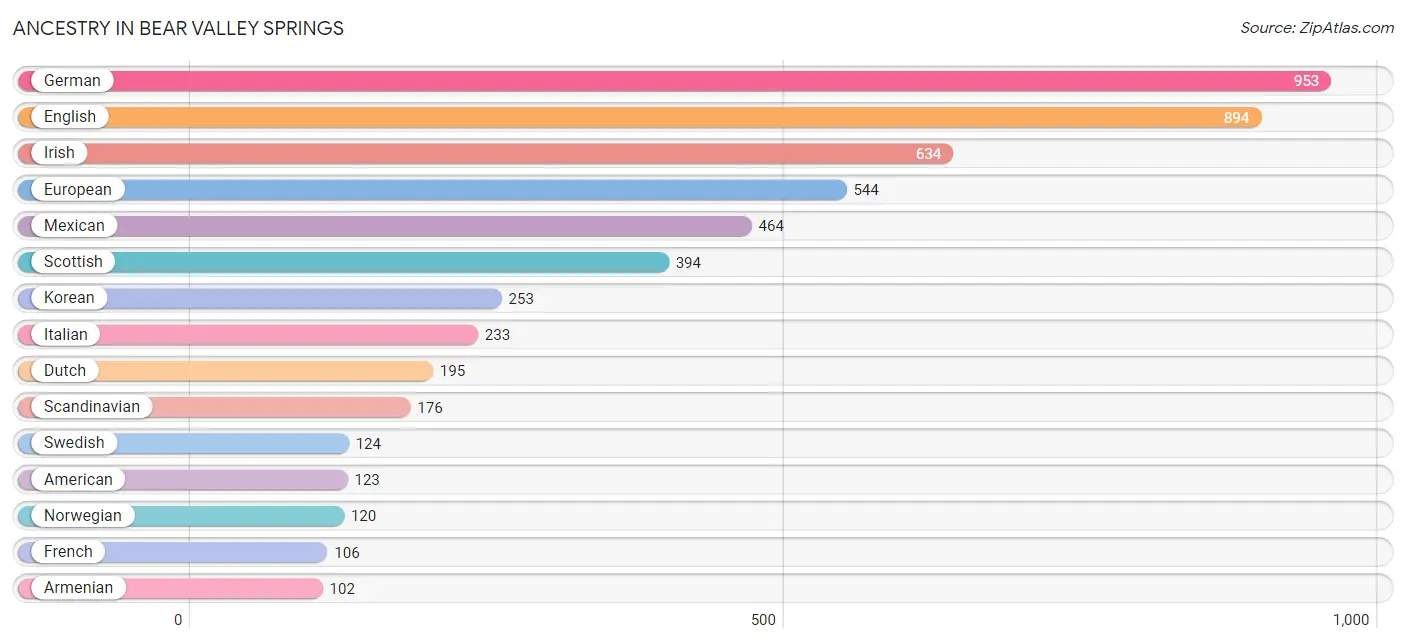
| Ancestry | # Population | % Population |
| American | 123 | 2.2% |
| Arab | 46 | 0.8% |
| Armenian | 102 | 1.8% |
| Bangladeshi | 13 | 0.2% |
| Bhutanese | 14 | 0.3% |
| Blackfeet | 53 | 0.9% |
| British | 23 | 0.4% |
| Burmese | 34 | 0.6% |
| Canadian | 100 | 1.8% |
| Central American | 68 | 1.2% |
| Central American Indian | 43 | 0.8% |
| Cherokee | 53 | 0.9% |
| Cree | 53 | 0.9% |
| Danish | 67 | 1.2% |
| Dutch | 195 | 3.5% |
| English | 894 | 16.0% |
| European | 544 | 9.7% |
| French | 106 | 1.9% |
| French Canadian | 70 | 1.3% |
| German | 953 | 17.0% |
| Honduran | 43 | 0.8% |
| Indian (Asian) | 36 | 0.6% |
| Irish | 634 | 11.3% |
| Italian | 233 | 4.2% |
| Japanese | 19 | 0.3% |
| Korean | 253 | 4.5% |
| Mexican | 464 | 8.3% |
| Norwegian | 120 | 2.1% |
| Osage | 86 | 1.5% |
| Peruvian | 50 | 0.9% |
| Polish | 84 | 1.5% |
| Russian | 48 | 0.9% |
| Salvadoran | 25 | 0.4% |
| Scandinavian | 176 | 3.1% |
| Scotch-Irish | 36 | 0.6% |
| Scottish | 394 | 7.0% |
| Slavic | 10 | 0.2% |
| South African | 86 | 1.5% |
| South American | 50 | 0.9% |
| Spaniard | 86 | 1.5% |
| Spanish | 14 | 0.3% |
| Sri Lankan | 56 | 1.0% |
| Subsaharan African | 86 | 1.5% |
| Swedish | 124 | 2.2% |
| Swiss | 16 | 0.3% |
| Ukrainian | 47 | 0.8% | View All 46 Rows |
Immigrants in Bear Valley Springs
The most numerous immigrant groups reported in Bear Valley Springs came from Canada (441 | 7.9%), Europe (191 | 3.4%), Central America (147 | 2.6%), Latin America (147 | 2.6%), and Mexico (104 | 1.9%), together accounting for 18.4% of all Bear Valley Springs residents.
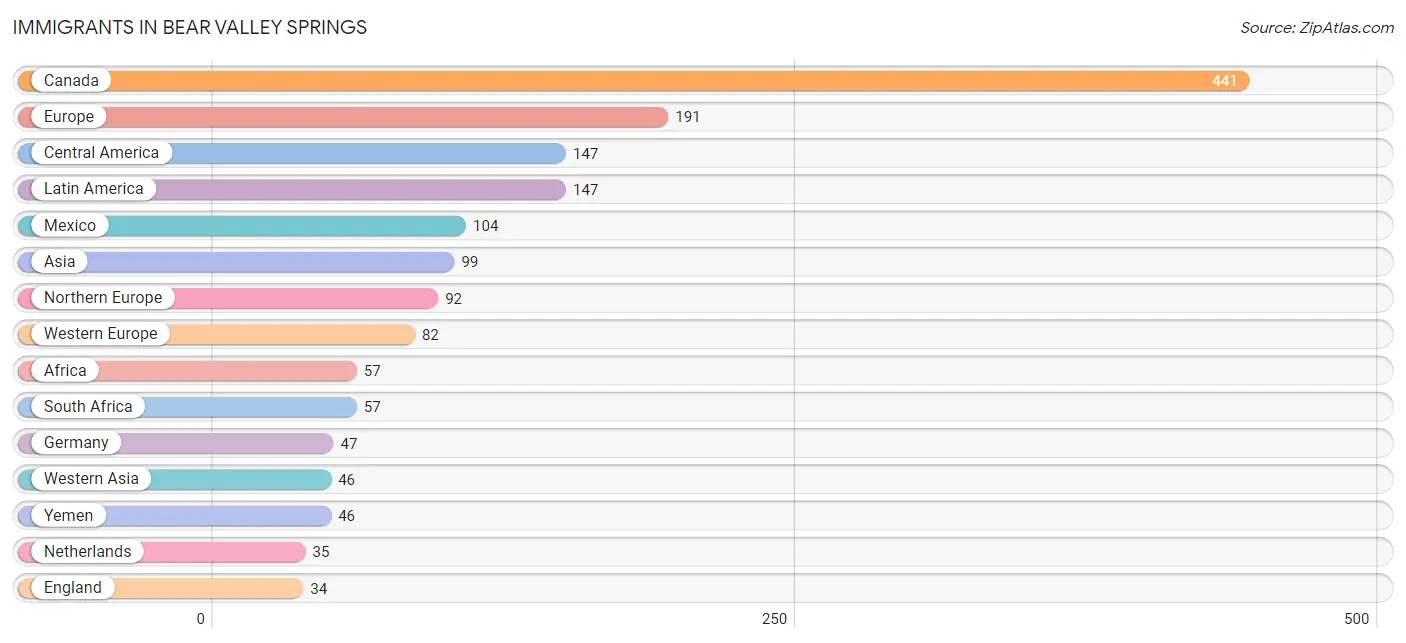
| Immigration Origin | # Population | % Population |
| Africa | 57 | 1.0% |
| Asia | 99 | 1.8% |
| Canada | 441 | 7.9% |
| Central America | 147 | 2.6% |
| China | 17 | 0.3% |
| Eastern Asia | 17 | 0.3% |
| Eastern Europe | 17 | 0.3% |
| El Salvador | 15 | 0.3% |
| England | 34 | 0.6% |
| Europe | 191 | 3.4% |
| Germany | 47 | 0.8% |
| Honduras | 28 | 0.5% |
| India | 19 | 0.3% |
| Latin America | 147 | 2.6% |
| Mexico | 104 | 1.9% |
| Netherlands | 35 | 0.6% |
| Northern Europe | 92 | 1.6% |
| South Africa | 57 | 1.0% |
| South Central Asia | 19 | 0.3% |
| South Eastern Asia | 17 | 0.3% |
| Sweden | 12 | 0.2% |
| Thailand | 17 | 0.3% |
| Ukraine | 17 | 0.3% |
| Western Asia | 46 | 0.8% |
| Western Europe | 82 | 1.5% |
| Yemen | 46 | 0.8% | View All 26 Rows |
Sex and Age in Bear Valley Springs
Sex and Age in Bear Valley Springs
The most populous age groups in Bear Valley Springs are 60 to 64 Years (323 | 11.0%) for men and 65 to 69 Years (314 | 11.9%) for women.
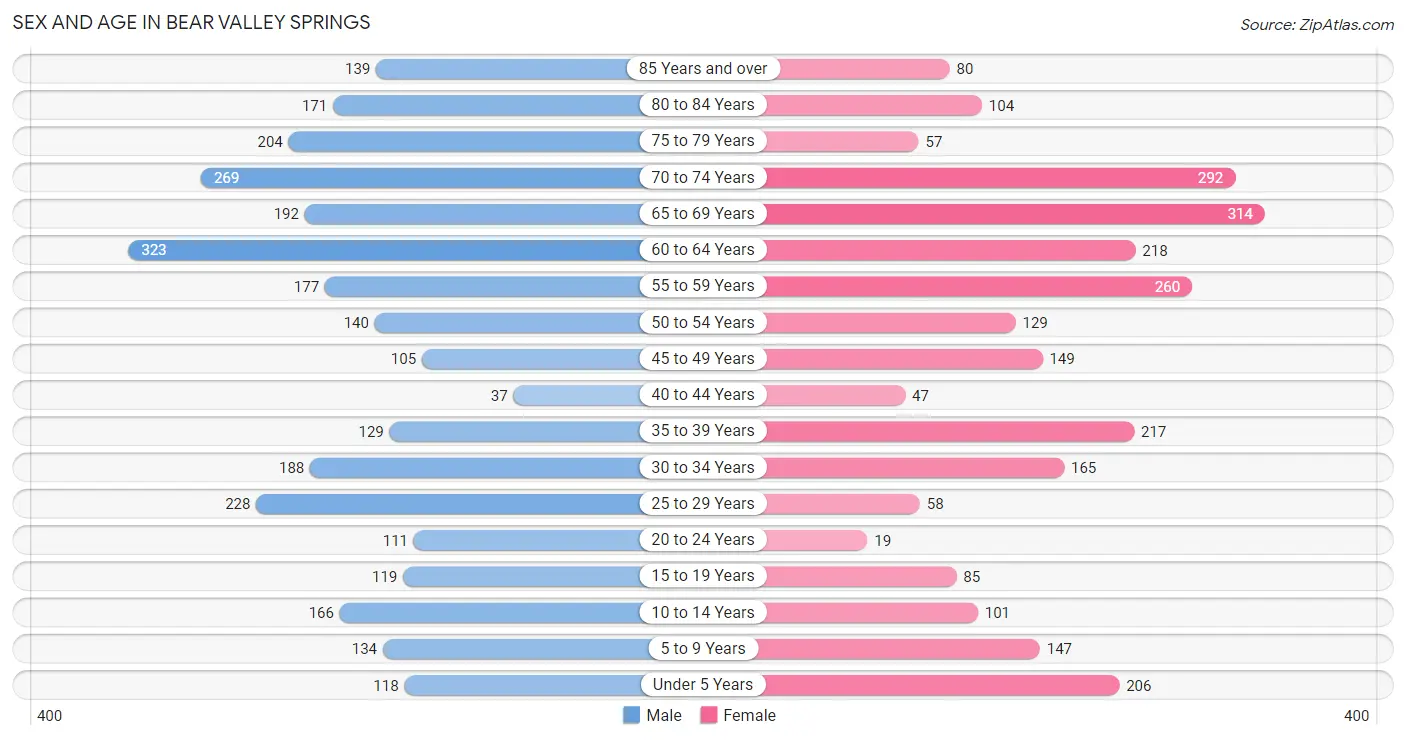
| Age Bracket | Male | Female |
| Under 5 Years | 118 (4.0%) | 206 (7.8%) |
| 5 to 9 Years | 134 (4.5%) | 147 (5.6%) |
| 10 to 14 Years | 166 (5.6%) | 101 (3.8%) |
| 15 to 19 Years | 119 (4.0%) | 85 (3.2%) |
| 20 to 24 Years | 111 (3.8%) | 19 (0.7%) |
| 25 to 29 Years | 228 (7.7%) | 58 (2.2%) |
| 30 to 34 Years | 188 (6.4%) | 165 (6.2%) |
| 35 to 39 Years | 129 (4.4%) | 217 (8.2%) |
| 40 to 44 Years | 37 (1.3%) | 47 (1.8%) |
| 45 to 49 Years | 105 (3.6%) | 149 (5.6%) |
| 50 to 54 Years | 140 (4.8%) | 129 (4.9%) |
| 55 to 59 Years | 177 (6.0%) | 260 (9.8%) |
| 60 to 64 Years | 323 (11.0%) | 218 (8.2%) |
| 65 to 69 Years | 192 (6.5%) | 314 (11.9%) |
| 70 to 74 Years | 269 (9.1%) | 292 (11.0%) |
| 75 to 79 Years | 204 (6.9%) | 57 (2.1%) |
| 80 to 84 Years | 171 (5.8%) | 104 (3.9%) |
| 85 Years and over | 139 (4.7%) | 80 (3.0%) |
| Total | 2,950 (100.0%) | 2,648 (100.0%) |
Families and Households in Bear Valley Springs
Median Family Size in Bear Valley Springs
The median family size in Bear Valley Springs is 2.74 persons per family, with single female/mother families (80 | 4.6%) accounting for the largest median family size of 3.21 persons per family. On the other hand, single male/father families (102 | 5.9%) represent the smallest median family size with 2.57 persons per family.
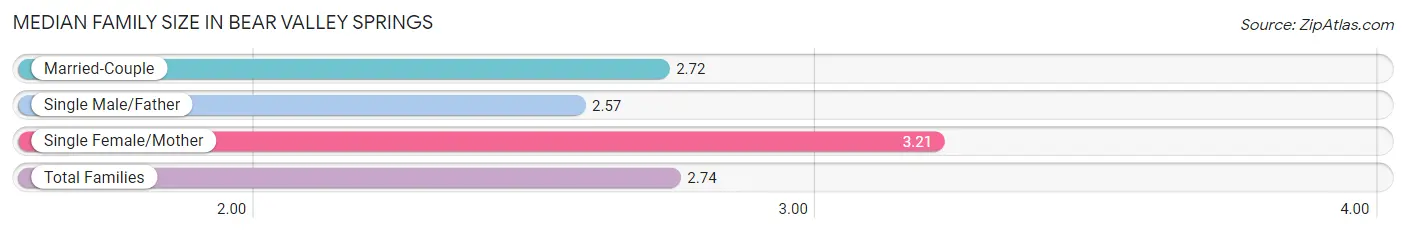
| Family Type | # Families | Family Size |
| Married-Couple | 1,551 (89.5%) | 2.72 |
| Single Male/Father | 102 (5.9%) | 2.57 |
| Single Female/Mother | 80 (4.6%) | 3.21 |
| Total Families | 1,733 (100.0%) | 2.74 |
Median Household Size in Bear Valley Springs
The median household size in Bear Valley Springs is 2.30 persons per household, with single female/mother households (80 | 3.3%) accounting for the largest median household size of 3.21 persons per household. non-family households (696 | 28.6%) represent the smallest median household size with 1.14 persons per household.
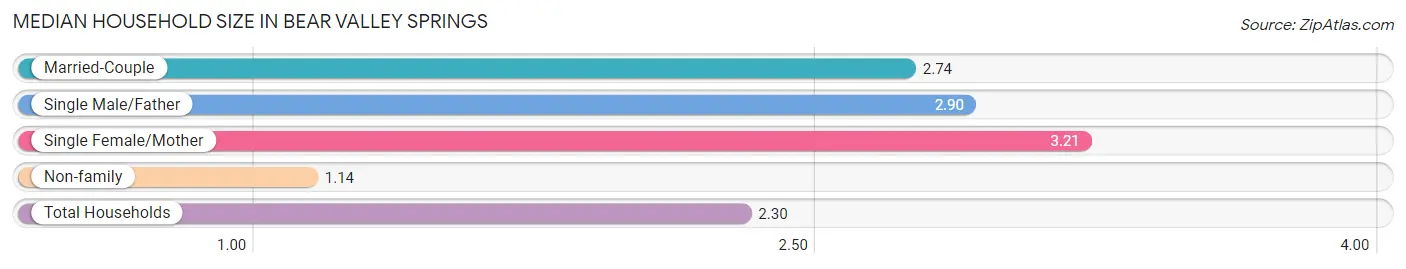
| Household Type | # Households | Household Size |
| Married-Couple | 1,551 (63.8%) | 2.74 |
| Single Male/Father | 102 (4.2%) | 2.90 |
| Single Female/Mother | 80 (3.3%) | 3.21 |
| Non-family | 696 (28.6%) | 1.14 |
| Total Households | 2,429 (100.0%) | 2.30 |
Household Size by Marriage Status in Bear Valley Springs
Out of a total of 2,429 households in Bear Valley Springs, 1,733 (71.4%) are family households, while 696 (28.6%) are nonfamily households. The most numerous type of family households are 2-person households, comprising 1,114, and the most common type of nonfamily households are 1-person households, comprising 609.
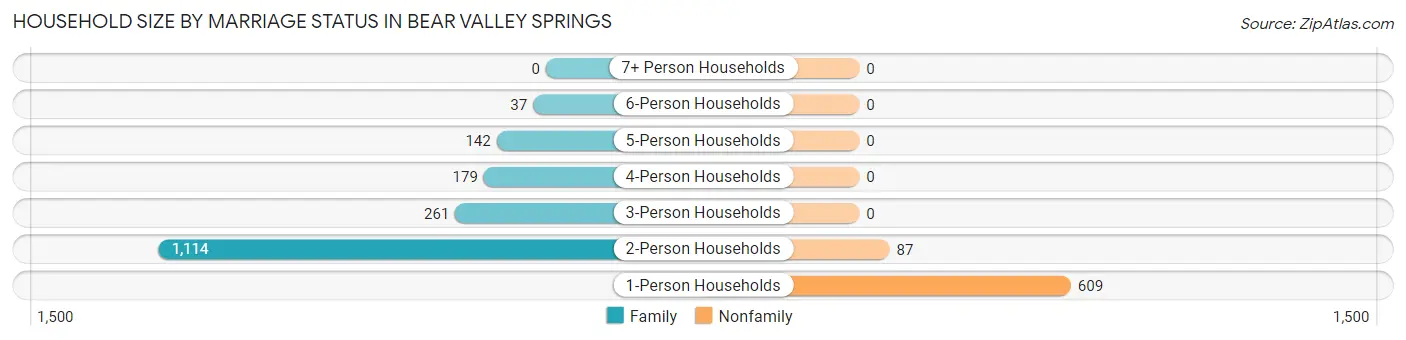
| Household Size | Family Households | Nonfamily Households |
| 1-Person Households | - | 609 (25.1%) |
| 2-Person Households | 1,114 (45.9%) | 87 (3.6%) |
| 3-Person Households | 261 (10.7%) | 0 (0.0%) |
| 4-Person Households | 179 (7.4%) | 0 (0.0%) |
| 5-Person Households | 142 (5.9%) | 0 (0.0%) |
| 6-Person Households | 37 (1.5%) | 0 (0.0%) |
| 7+ Person Households | 0 (0.0%) | 0 (0.0%) |
| Total | 1,733 (71.4%) | 696 (28.6%) |
Female Fertility in Bear Valley Springs
Fertility by Age in Bear Valley Springs
Average fertility rate in Bear Valley Springs is 116.0 births per 1,000 women. Women in the age bracket of 20 to 34 years have the highest fertility rate with 289.0 births per 1,000 women. Women in the age bracket of 20 to 34 years acount for 78.6% of all women with births.
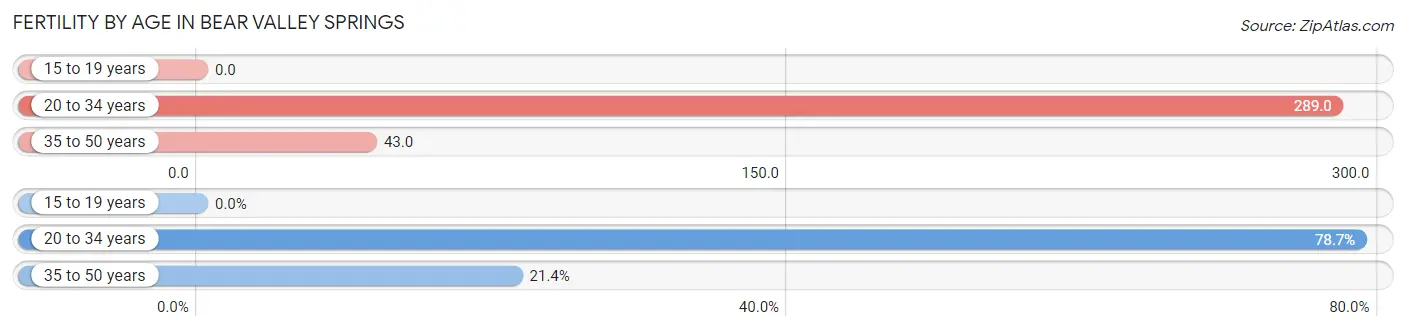
| Age Bracket | Women with Births | Births / 1,000 Women |
| 15 to 19 years | 0 (0.0%) | 0.0 |
| 20 to 34 years | 70 (78.6%) | 289.0 |
| 35 to 50 years | 19 (21.3%) | 43.0 |
| Total | 89 (100.0%) | 116.0 |
Fertility by Age by Marriage Status in Bear Valley Springs
76.4% of women with births (89) in Bear Valley Springs are married. The highest percentage of unmarried women with births falls into 20 to 34 years age bracket with 30.0% of them unmarried at the time of birth, while the lowest percentage of unmarried women with births belong to 35 to 50 years age bracket with 0.0% of them unmarried.
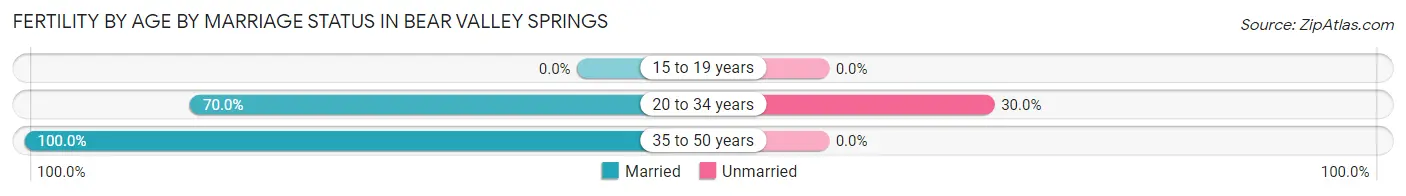
| Age Bracket | Married | Unmarried |
| 15 to 19 years | 0 (0.0%) | 0 (0.0%) |
| 20 to 34 years | 49 (70.0%) | 21 (30.0%) |
| 35 to 50 years | 19 (100.0%) | 0 (0.0%) |
| Total | 68 (76.4%) | 21 (23.6%) |
Fertility by Education in Bear Valley Springs
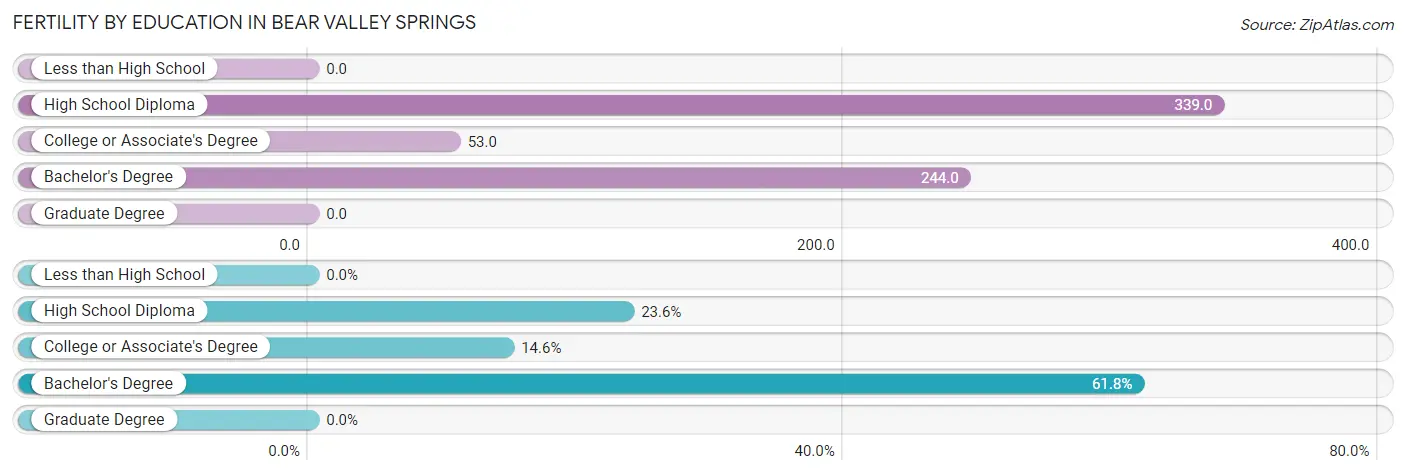
| Educational Attainment | Women with Births | Births / 1,000 Women |
| Less than High School | 0 (0.0%) | 0.0 |
| High School Diploma | 21 (23.6%) | 339.0 |
| College or Associate's Degree | 13 (14.6%) | 53.0 |
| Bachelor's Degree | 55 (61.8%) | 244.0 |
| Graduate Degree | 0 (0.0%) | 0.0 |
| Total | 89 (100.0%) | 116.0 |
Fertility by Education by Marriage Status in Bear Valley Springs
23.6% of women with births in Bear Valley Springs are unmarried. Women with the educational attainment of college or associate's degree are most likely to be married with 100.0% of them married at childbirth, while women with the educational attainment of high school diploma are least likely to be married with 100.0% of them unmarried at childbirth.
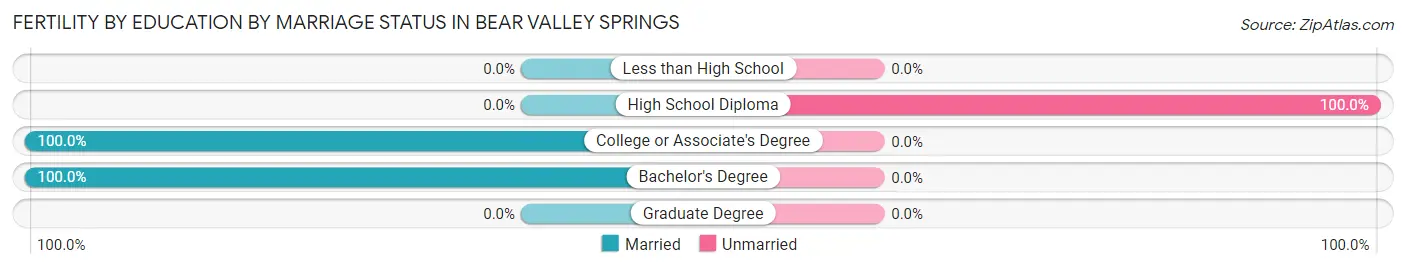
| Educational Attainment | Married | Unmarried |
| Less than High School | 0 (0.0%) | 0 (0.0%) |
| High School Diploma | 0 (0.0%) | 21 (100.0%) |
| College or Associate's Degree | 13 (100.0%) | 0 (0.0%) |
| Bachelor's Degree | 55 (100.0%) | 0 (0.0%) |
| Graduate Degree | 0 (0.0%) | 0 (0.0%) |
| Total | 68 (76.4%) | 21 (23.6%) |
Employment Characteristics in Bear Valley Springs
Employment by Class of Employer in Bear Valley Springs
Among the 2,013 employed individuals in Bear Valley Springs, private company employees (800 | 39.7%), local government employees (370 | 18.4%), and federal government employees (217 | 10.8%) make up the most common classes of employment.
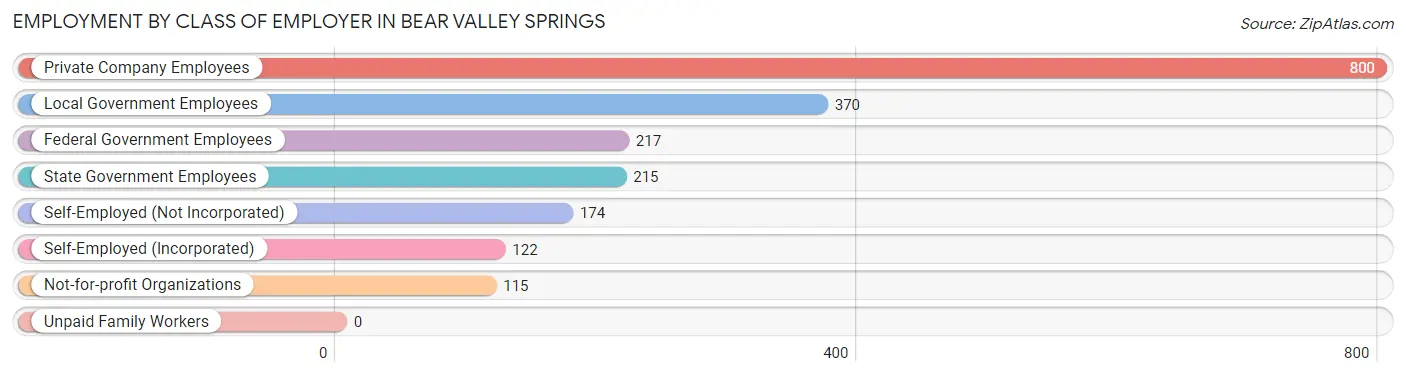
| Employer Class | # Employees | % Employees |
| Private Company Employees | 800 | 39.7% |
| Self-Employed (Incorporated) | 122 | 6.1% |
| Self-Employed (Not Incorporated) | 174 | 8.6% |
| Not-for-profit Organizations | 115 | 5.7% |
| Local Government Employees | 370 | 18.4% |
| State Government Employees | 215 | 10.7% |
| Federal Government Employees | 217 | 10.8% |
| Unpaid Family Workers | 0 | 0.0% |
| Total | 2,013 | 100.0% |
Employment Status by Age in Bear Valley Springs
According to the labor force statistics for Bear Valley Springs, out of the total population over 16 years of age (4,726), 45.3% or 2,141 individuals are in the labor force, with 3.2% or 69 of them unemployed. The age group with the highest labor force participation rate is 35 to 44 years, with 87.9% or 378 individuals in the labor force. Within the labor force, the 20 to 24 years age range has the highest percentage of unemployed individuals, with 27.1% or 26 of them being unemployed.
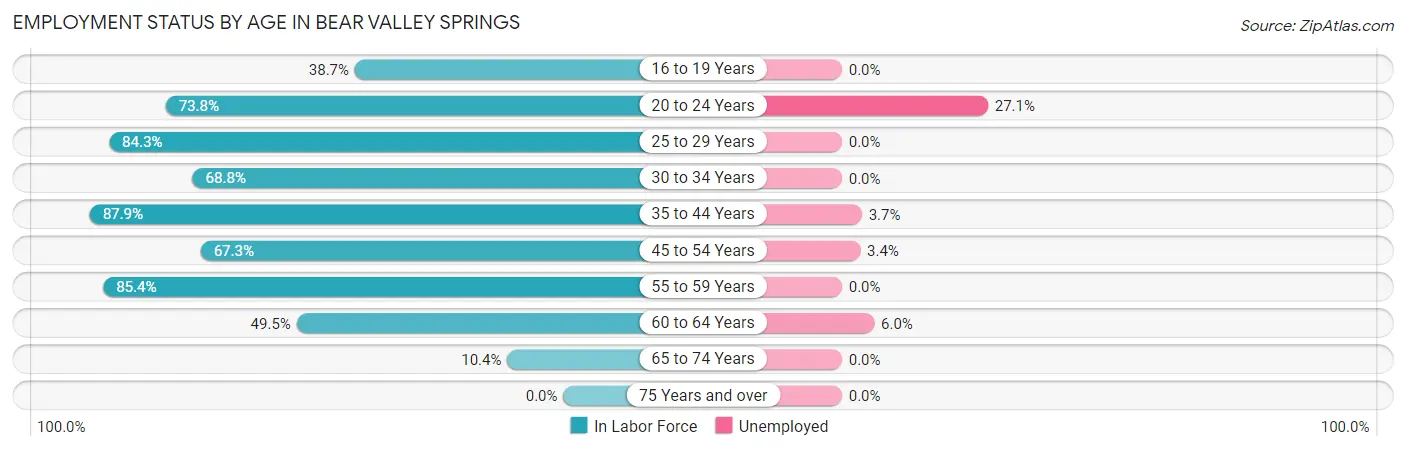
| Age Bracket | In Labor Force | Unemployed |
| 16 to 19 Years | 79 (38.7%) | 0 (0.0%) |
| 20 to 24 Years | 96 (73.8%) | 26 (27.1%) |
| 25 to 29 Years | 241 (84.3%) | 0 (0.0%) |
| 30 to 34 Years | 243 (68.8%) | 0 (0.0%) |
| 35 to 44 Years | 378 (87.9%) | 14 (3.7%) |
| 45 to 54 Years | 352 (67.3%) | 12 (3.4%) |
| 55 to 59 Years | 373 (85.4%) | 0 (0.0%) |
| 60 to 64 Years | 268 (49.5%) | 16 (6.0%) |
| 65 to 74 Years | 111 (10.4%) | 0 (0.0%) |
| 75 Years and over | 0 (0.0%) | 0 (0.0%) |
| Total | 2,141 (45.3%) | 69 (3.2%) |
Employment Status by Educational Attainment in Bear Valley Springs
According to labor force statistics for Bear Valley Springs, 72.2% of individuals (1,856) out of the total population between 25 and 64 years of age (2,570) are in the labor force, with 2.3% or 43 of them being unemployed. The group with the highest labor force participation rate are those with the educational attainment of college / associate degree, with 79.3% or 741 individuals in the labor force. Within the labor force, individuals with college / associate degree education have the highest percentage of unemployment, with 3.5% or 26 of them being unemployed.
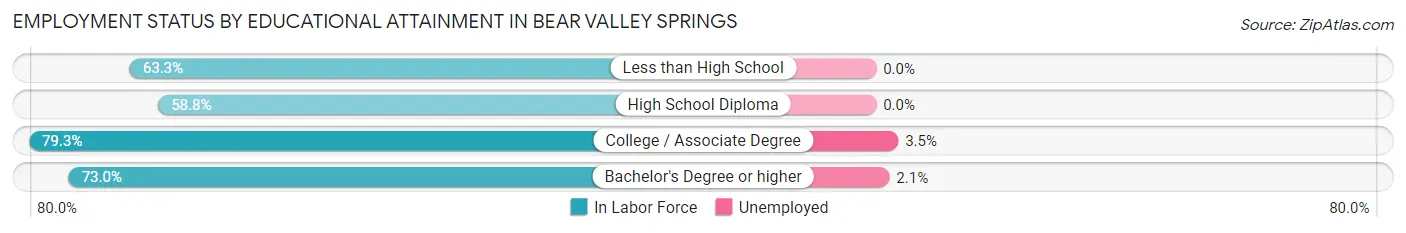
| Educational Attainment | In Labor Force | Unemployed |
| Less than High School | 62 (63.3%) | 0 (0.0%) |
| High School Diploma | 290 (58.8%) | 0 (0.0%) |
| College / Associate Degree | 741 (79.3%) | 33 (3.5%) |
| Bachelor's Degree or higher | 762 (73.0%) | 22 (2.1%) |
| Total | 1,856 (72.2%) | 59 (2.3%) |
Employment Occupations by Sex in Bear Valley Springs
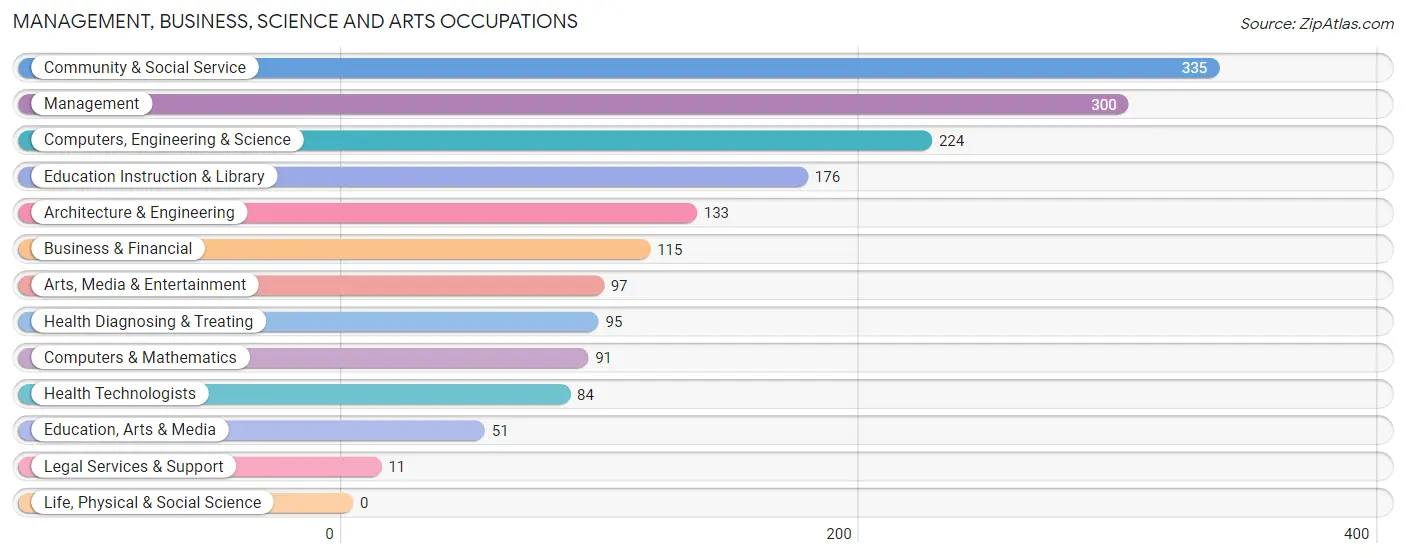
Management, Business, Science and Arts Occupations
The most common Management, Business, Science and Arts occupations in Bear Valley Springs are Community & Social Service (335 | 16.2%), Management (300 | 14.5%), Computers, Engineering & Science (224 | 10.8%), Education Instruction & Library (176 | 8.5%), and Architecture & Engineering (133 | 6.4%).
Management, Business, Science and Arts Occupations by Sex
Within the Management, Business, Science and Arts occupations in Bear Valley Springs, the most male-oriented occupations are Architecture & Engineering (100.0%), Computers, Engineering & Science (91.5%), and Management (81.7%), while the most female-oriented occupations are Business & Financial (100.0%), Education, Arts & Media (100.0%), and Legal Services & Support (100.0%).
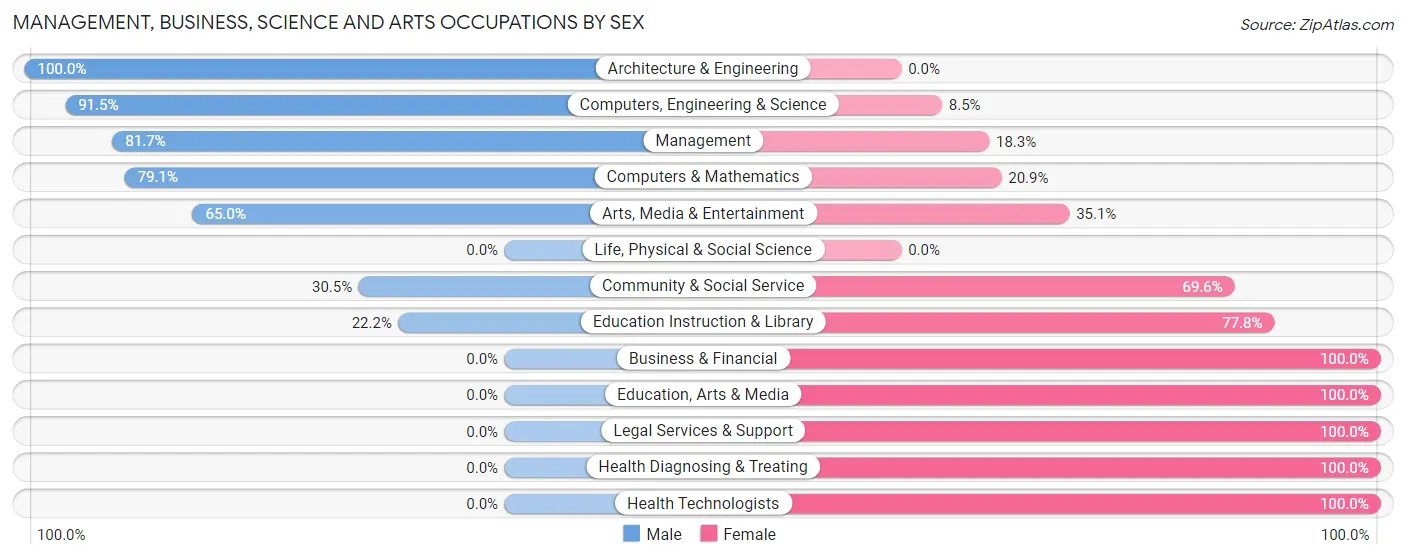
| Occupation | Male | Female |
| Management | 245 (81.7%) | 55 (18.3%) |
| Business & Financial | 0 (0.0%) | 115 (100.0%) |
| Computers, Engineering & Science | 205 (91.5%) | 19 (8.5%) |
| Computers & Mathematics | 72 (79.1%) | 19 (20.9%) |
| Architecture & Engineering | 133 (100.0%) | 0 (0.0%) |
| Life, Physical & Social Science | 0 (0.0%) | 0 (0.0%) |
| Community & Social Service | 102 (30.4%) | 233 (69.6%) |
| Education, Arts & Media | 0 (0.0%) | 51 (100.0%) |
| Legal Services & Support | 0 (0.0%) | 11 (100.0%) |
| Education Instruction & Library | 39 (22.2%) | 137 (77.8%) |
| Arts, Media & Entertainment | 63 (64.9%) | 34 (35.0%) |
| Health Diagnosing & Treating | 0 (0.0%) | 95 (100.0%) |
| Health Technologists | 0 (0.0%) | 84 (100.0%) |
| Total (Category) | 552 (51.6%) | 517 (48.4%) |
| Total (Overall) | 1,216 (58.7%) | 857 (41.3%) |
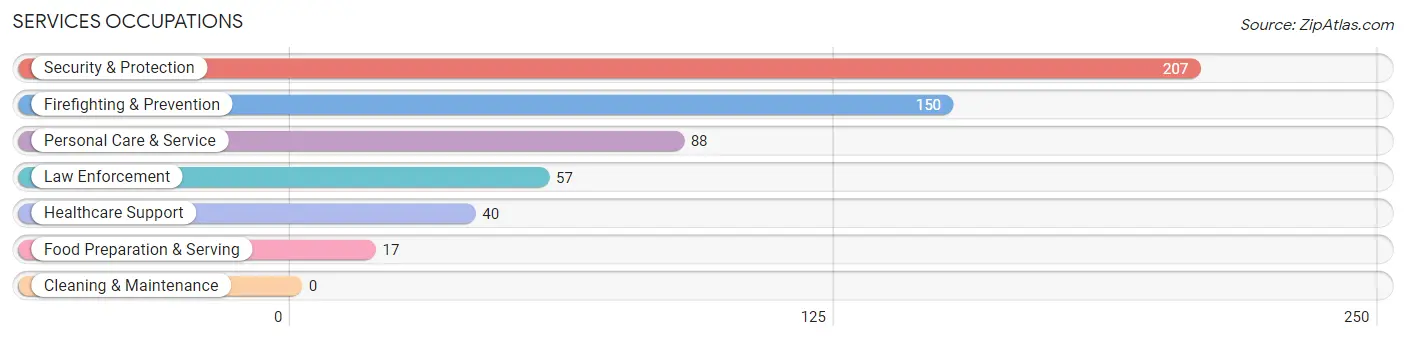
Services Occupations
The most common Services occupations in Bear Valley Springs are Security & Protection (207 | 10.0%), Firefighting & Prevention (150 | 7.2%), Personal Care & Service (88 | 4.3%), Law Enforcement (57 | 2.8%), and Healthcare Support (40 | 1.9%).
Services Occupations by Sex
Within the Services occupations in Bear Valley Springs, the most male-oriented occupations are Law Enforcement (100.0%), Food Preparation & Serving (100.0%), and Security & Protection (88.9%), while the most female-oriented occupations are Healthcare Support (100.0%), Personal Care & Service (84.1%), and Firefighting & Prevention (15.3%).
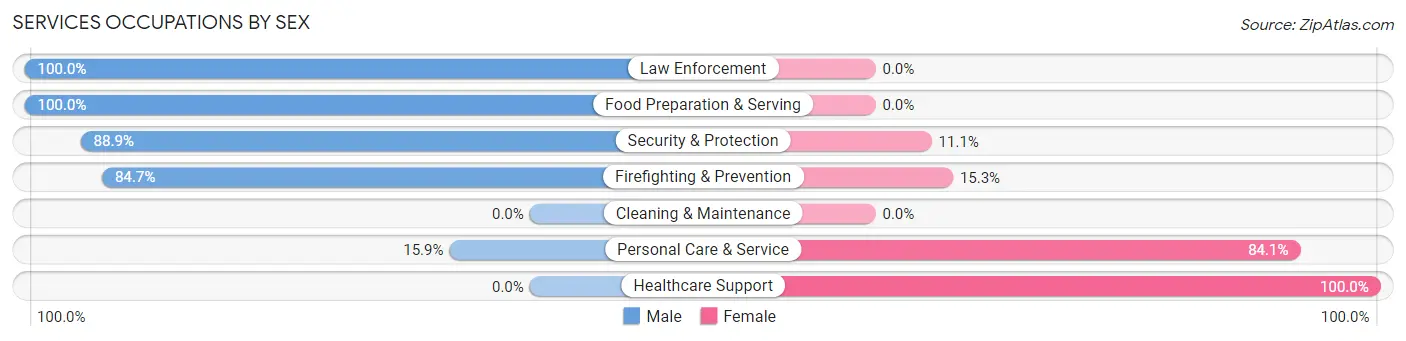
| Occupation | Male | Female |
| Healthcare Support | 0 (0.0%) | 40 (100.0%) |
| Security & Protection | 184 (88.9%) | 23 (11.1%) |
| Firefighting & Prevention | 127 (84.7%) | 23 (15.3%) |
| Law Enforcement | 57 (100.0%) | 0 (0.0%) |
| Food Preparation & Serving | 17 (100.0%) | 0 (0.0%) |
| Cleaning & Maintenance | 0 (0.0%) | 0 (0.0%) |
| Personal Care & Service | 14 (15.9%) | 74 (84.1%) |
| Total (Category) | 215 (61.1%) | 137 (38.9%) |
| Total (Overall) | 1,216 (58.7%) | 857 (41.3%) |
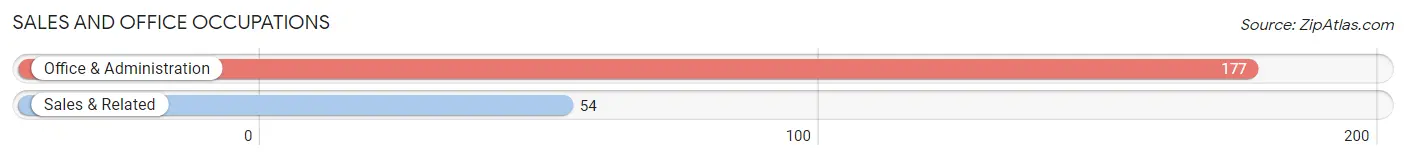
Sales and Office Occupations
The most common Sales and Office occupations in Bear Valley Springs are Office & Administration (177 | 8.5%), and Sales & Related (54 | 2.6%).
Sales and Office Occupations by Sex
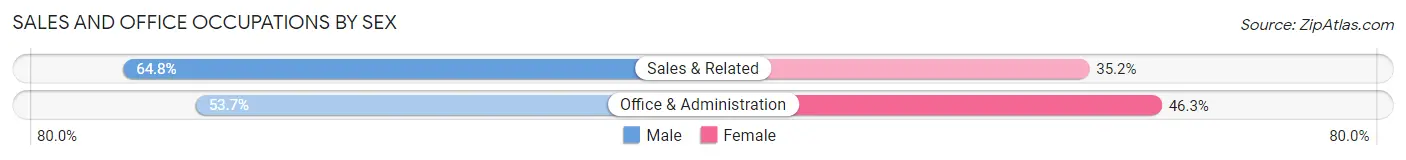
| Occupation | Male | Female |
| Sales & Related | 35 (64.8%) | 19 (35.2%) |
| Office & Administration | 95 (53.7%) | 82 (46.3%) |
| Total (Category) | 130 (56.3%) | 101 (43.7%) |
| Total (Overall) | 1,216 (58.7%) | 857 (41.3%) |
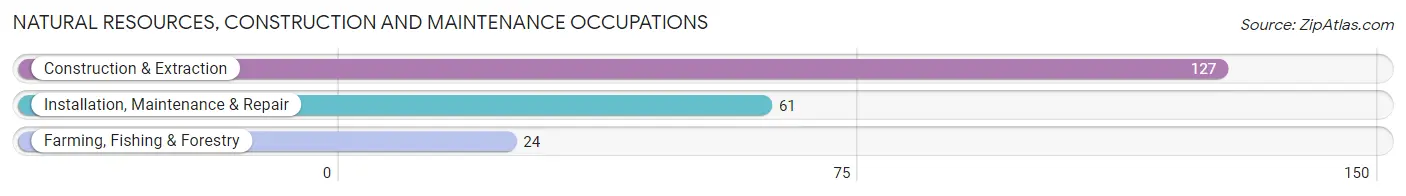
Natural Resources, Construction and Maintenance Occupations
The most common Natural Resources, Construction and Maintenance occupations in Bear Valley Springs are Construction & Extraction (127 | 6.1%), Installation, Maintenance & Repair (61 | 2.9%), and Farming, Fishing & Forestry (24 | 1.2%).
Natural Resources, Construction and Maintenance Occupations by Sex
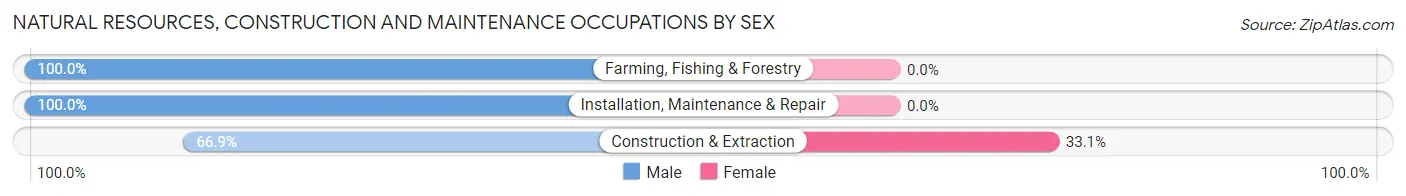
| Occupation | Male | Female |
| Farming, Fishing & Forestry | 24 (100.0%) | 0 (0.0%) |
| Construction & Extraction | 85 (66.9%) | 42 (33.1%) |
| Installation, Maintenance & Repair | 61 (100.0%) | 0 (0.0%) |
| Total (Category) | 170 (80.2%) | 42 (19.8%) |
| Total (Overall) | 1,216 (58.7%) | 857 (41.3%) |
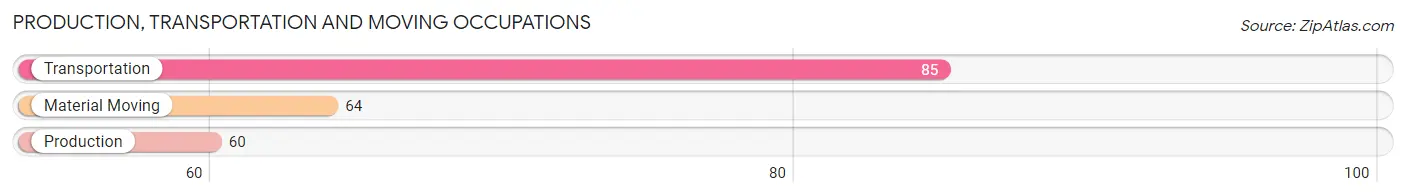
Production, Transportation and Moving Occupations
The most common Production, Transportation and Moving occupations in Bear Valley Springs are Transportation (85 | 4.1%), Material Moving (64 | 3.1%), and Production (60 | 2.9%).
Production, Transportation and Moving Occupations by Sex
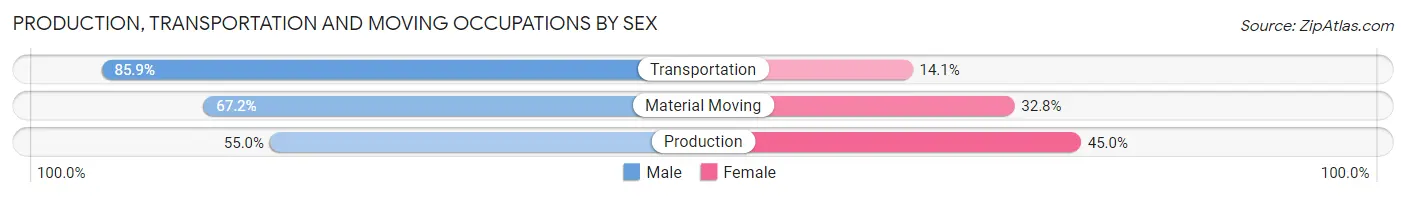
| Occupation | Male | Female |
| Production | 33 (55.0%) | 27 (45.0%) |
| Transportation | 73 (85.9%) | 12 (14.1%) |
| Material Moving | 43 (67.2%) | 21 (32.8%) |
| Total (Category) | 149 (71.3%) | 60 (28.7%) |
| Total (Overall) | 1,216 (58.7%) | 857 (41.3%) |
Employment Industries by Sex in Bear Valley Springs
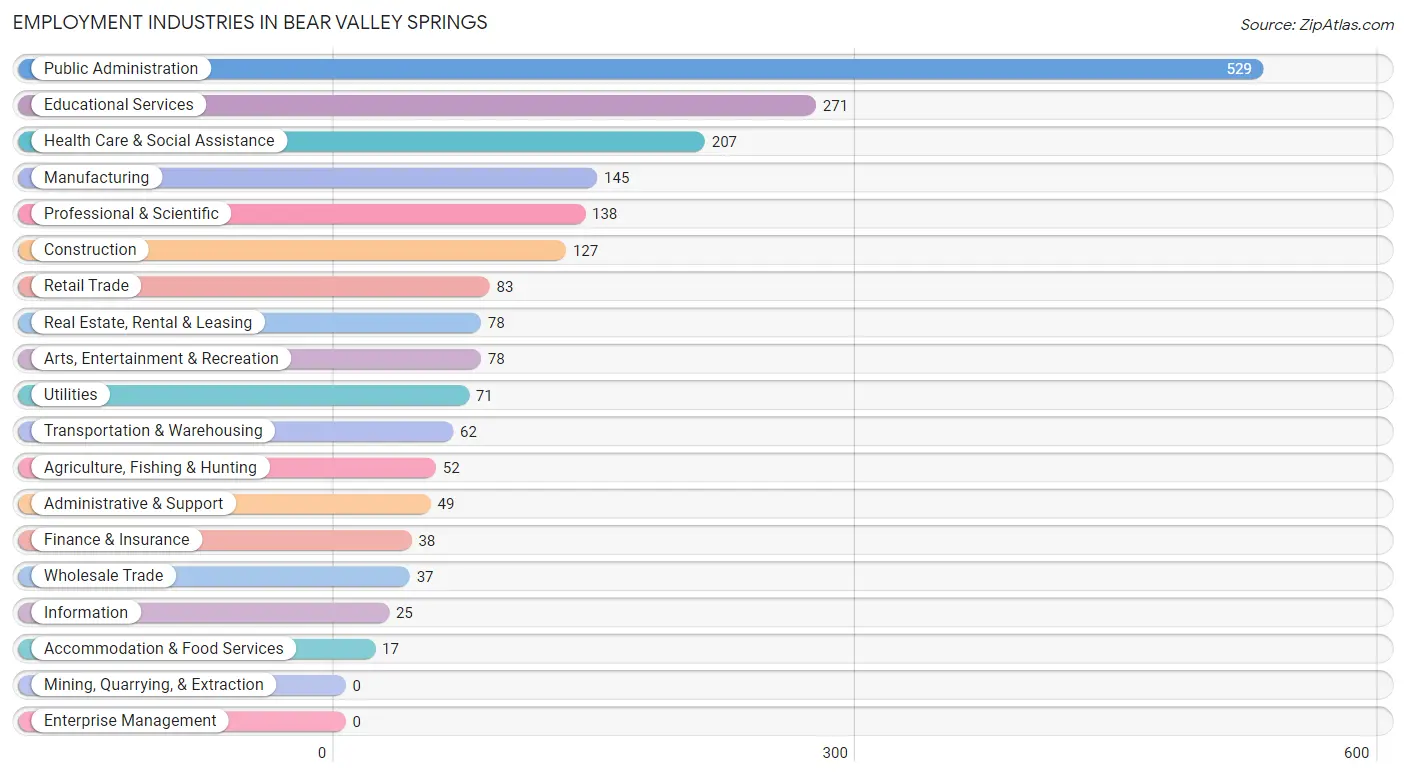
Employment Industries in Bear Valley Springs
The major employment industries in Bear Valley Springs include Public Administration (529 | 25.5%), Educational Services (271 | 13.1%), Health Care & Social Assistance (207 | 10.0%), Manufacturing (145 | 7.0%), and Professional & Scientific (138 | 6.7%).
Employment Industries by Sex in Bear Valley Springs
The Bear Valley Springs industries that see more men than women are Agriculture, Fishing & Hunting (100.0%), Retail Trade (100.0%), and Utilities (100.0%), whereas the industries that tend to have a higher number of women are Finance & Insurance (100.0%), Health Care & Social Assistance (98.1%), and Educational Services (69.7%).
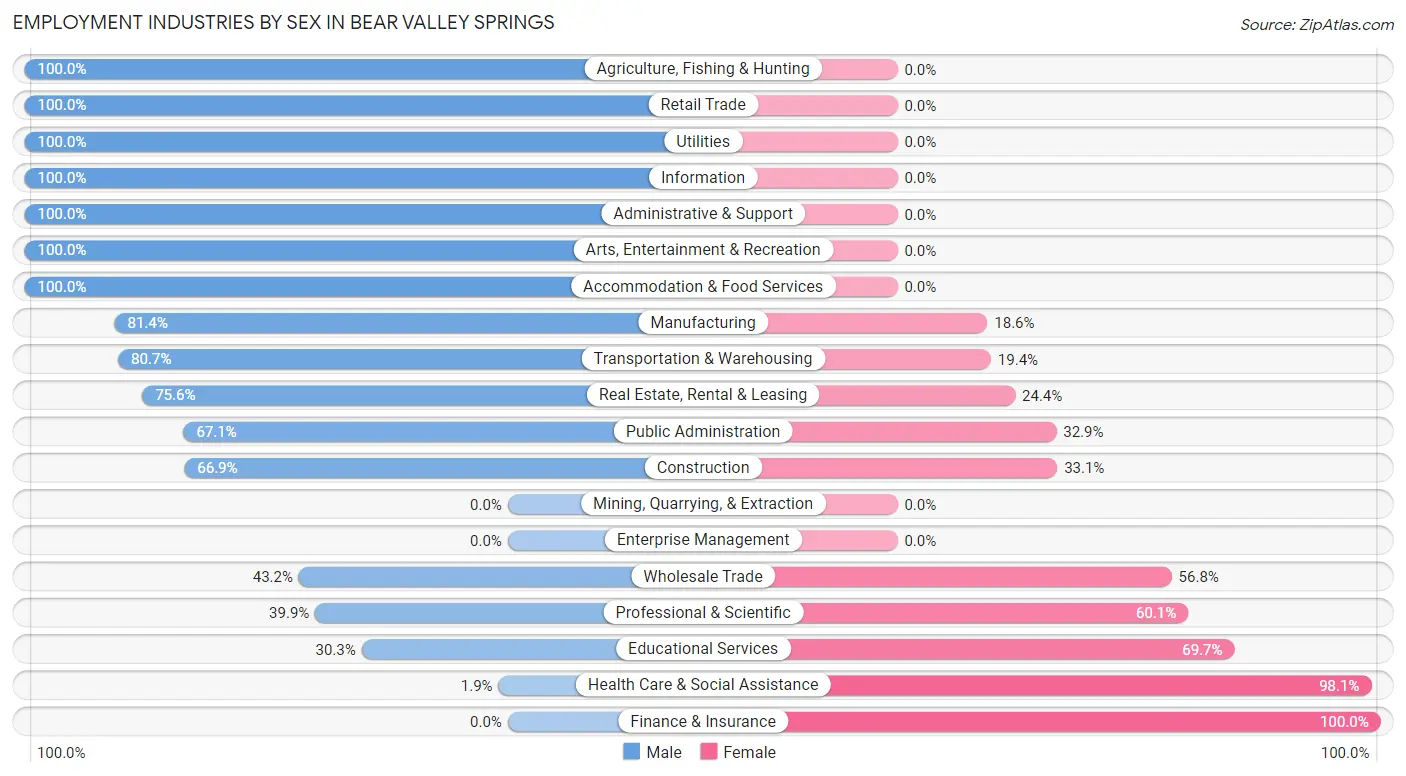
| Industry | Male | Female |
| Agriculture, Fishing & Hunting | 52 (100.0%) | 0 (0.0%) |
| Mining, Quarrying, & Extraction | 0 (0.0%) | 0 (0.0%) |
| Construction | 85 (66.9%) | 42 (33.1%) |
| Manufacturing | 118 (81.4%) | 27 (18.6%) |
| Wholesale Trade | 16 (43.2%) | 21 (56.8%) |
| Retail Trade | 83 (100.0%) | 0 (0.0%) |
| Transportation & Warehousing | 50 (80.6%) | 12 (19.4%) |
| Utilities | 71 (100.0%) | 0 (0.0%) |
| Information | 25 (100.0%) | 0 (0.0%) |
| Finance & Insurance | 0 (0.0%) | 38 (100.0%) |
| Real Estate, Rental & Leasing | 59 (75.6%) | 19 (24.4%) |
| Professional & Scientific | 55 (39.9%) | 83 (60.1%) |
| Enterprise Management | 0 (0.0%) | 0 (0.0%) |
| Administrative & Support | 49 (100.0%) | 0 (0.0%) |
| Educational Services | 82 (30.3%) | 189 (69.7%) |
| Health Care & Social Assistance | 4 (1.9%) | 203 (98.1%) |
| Arts, Entertainment & Recreation | 78 (100.0%) | 0 (0.0%) |
| Accommodation & Food Services | 17 (100.0%) | 0 (0.0%) |
| Public Administration | 355 (67.1%) | 174 (32.9%) |
| Total | 1,216 (58.7%) | 857 (41.3%) |
Education in Bear Valley Springs
School Enrollment in Bear Valley Springs
The most common levels of schooling among the 1,045 students in Bear Valley Springs are elementary school (303 | 29.0%), high school (271 | 25.9%), and middle school (182 | 17.4%).
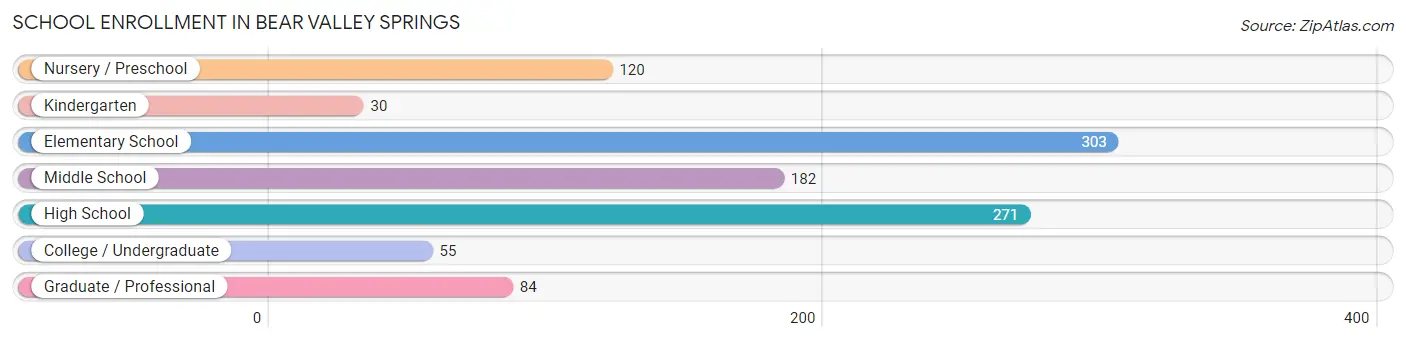
| School Level | # Students | % Students |
| Nursery / Preschool | 120 | 11.5% |
| Kindergarten | 30 | 2.9% |
| Elementary School | 303 | 29.0% |
| Middle School | 182 | 17.4% |
| High School | 271 | 25.9% |
| College / Undergraduate | 55 | 5.3% |
| Graduate / Professional | 84 | 8.0% |
| Total | 1,045 | 100.0% |
School Enrollment by Age by Funding Source in Bear Valley Springs
Out of a total of 1,045 students who are enrolled in schools in Bear Valley Springs, 359 (34.4%) attend a private institution, while the remaining 686 (65.6%) are enrolled in public schools. The age group of 35 years and over has the highest likelihood of being enrolled in private schools, with 57 (72.2% in the age bracket) enrolled. Conversely, the age group of 18 to 19 year olds has the lowest likelihood of being enrolled in a private school, with 60 (100.0% in the age bracket) attending a public institution.
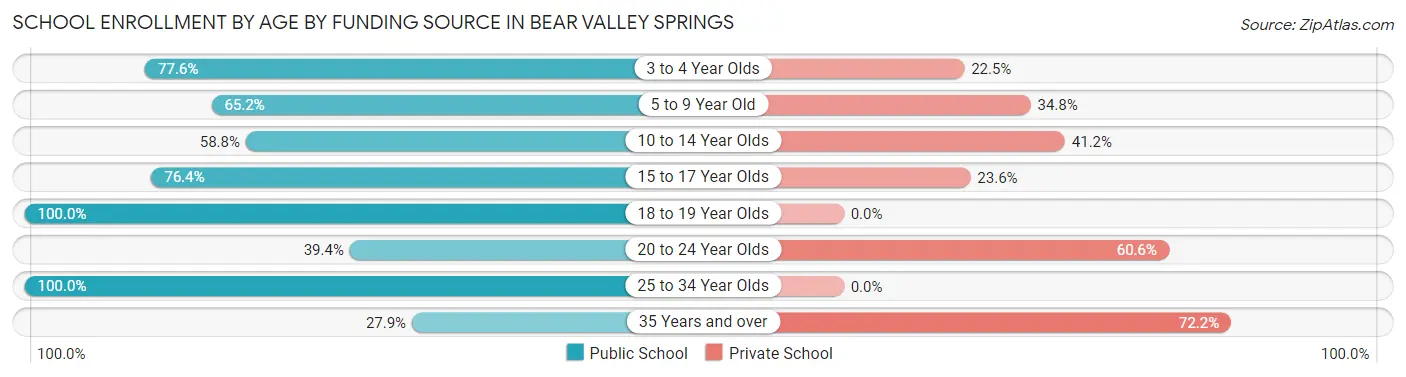
| Age Bracket | Public School | Private School |
| 3 to 4 Year Olds | 76 (77.5%) | 22 (22.5%) |
| 5 to 9 Year Old | 176 (65.2%) | 94 (34.8%) |
| 10 to 14 Year Olds | 157 (58.8%) | 110 (41.2%) |
| 15 to 17 Year Olds | 110 (76.4%) | 34 (23.6%) |
| 18 to 19 Year Olds | 60 (100.0%) | 0 (0.0%) |
| 20 to 24 Year Olds | 28 (39.4%) | 43 (60.6%) |
| 25 to 34 Year Olds | 56 (100.0%) | 0 (0.0%) |
| 35 Years and over | 22 (27.9%) | 57 (72.2%) |
| Total | 686 (65.6%) | 359 (34.4%) |
Educational Attainment by Field of Study in Bear Valley Springs
Engineering (349 | 19.7%), business (223 | 12.6%), education (223 | 12.6%), physical & health sciences (166 | 9.3%), and social sciences (141 | 7.9%) are the most common fields of study among 1,776 individuals in Bear Valley Springs who have obtained a bachelor's degree or higher.
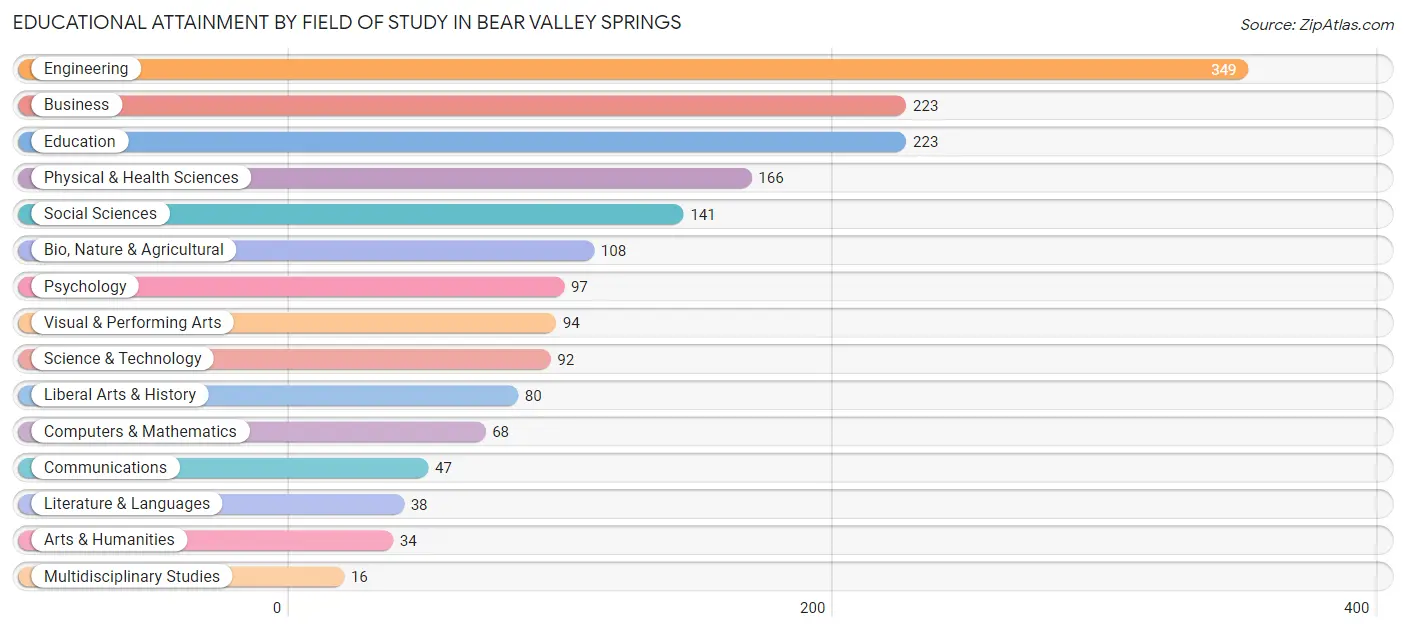
| Field of Study | # Graduates | % Graduates |
| Computers & Mathematics | 68 | 3.8% |
| Bio, Nature & Agricultural | 108 | 6.1% |
| Physical & Health Sciences | 166 | 9.3% |
| Psychology | 97 | 5.5% |
| Social Sciences | 141 | 7.9% |
| Engineering | 349 | 19.7% |
| Multidisciplinary Studies | 16 | 0.9% |
| Science & Technology | 92 | 5.2% |
| Business | 223 | 12.6% |
| Education | 223 | 12.6% |
| Literature & Languages | 38 | 2.1% |
| Liberal Arts & History | 80 | 4.5% |
| Visual & Performing Arts | 94 | 5.3% |
| Communications | 47 | 2.6% |
| Arts & Humanities | 34 | 1.9% |
| Total | 1,776 | 100.0% |
Transportation & Commute in Bear Valley Springs
Vehicle Availability by Sex in Bear Valley Springs
The most prevalent vehicle ownership categories in Bear Valley Springs are males with 2 vehicles (467, accounting for 38.5%) and females with 2 vehicles (359, making up 58.6%).
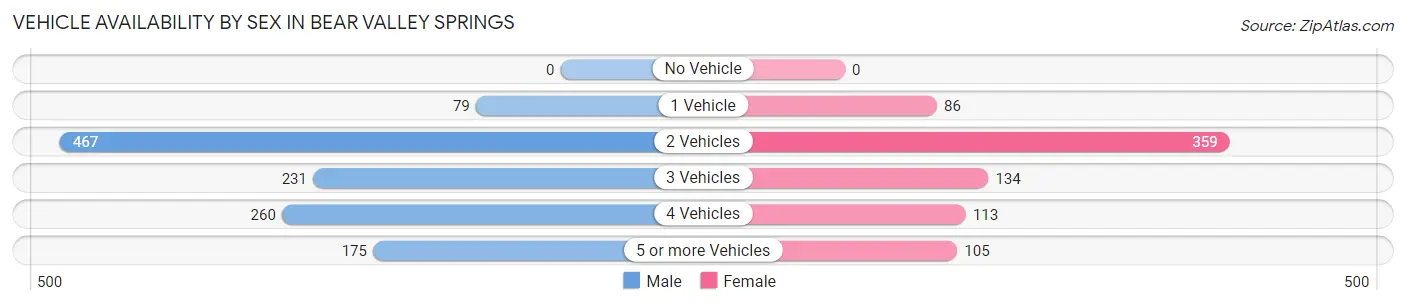
| Vehicles Available | Male | Female |
| No Vehicle | 0 (0.0%) | 0 (0.0%) |
| 1 Vehicle | 79 (6.5%) | 86 (10.8%) |
| 2 Vehicles | 467 (38.5%) | 359 (45.0%) |
| 3 Vehicles | 231 (19.1%) | 134 (16.8%) |
| 4 Vehicles | 260 (21.4%) | 113 (14.2%) |
| 5 or more Vehicles | 175 (14.4%) | 105 (13.2%) |
| Total | 1,212 (100.0%) | 797 (100.0%) |
Commute Time in Bear Valley Springs
The most frequently occuring commute durations in Bear Valley Springs are 60 to 89 minutes (465 commuters, 26.2%), 20 to 24 minutes (336 commuters, 19.0%), and 15 to 19 minutes (225 commuters, 12.7%).
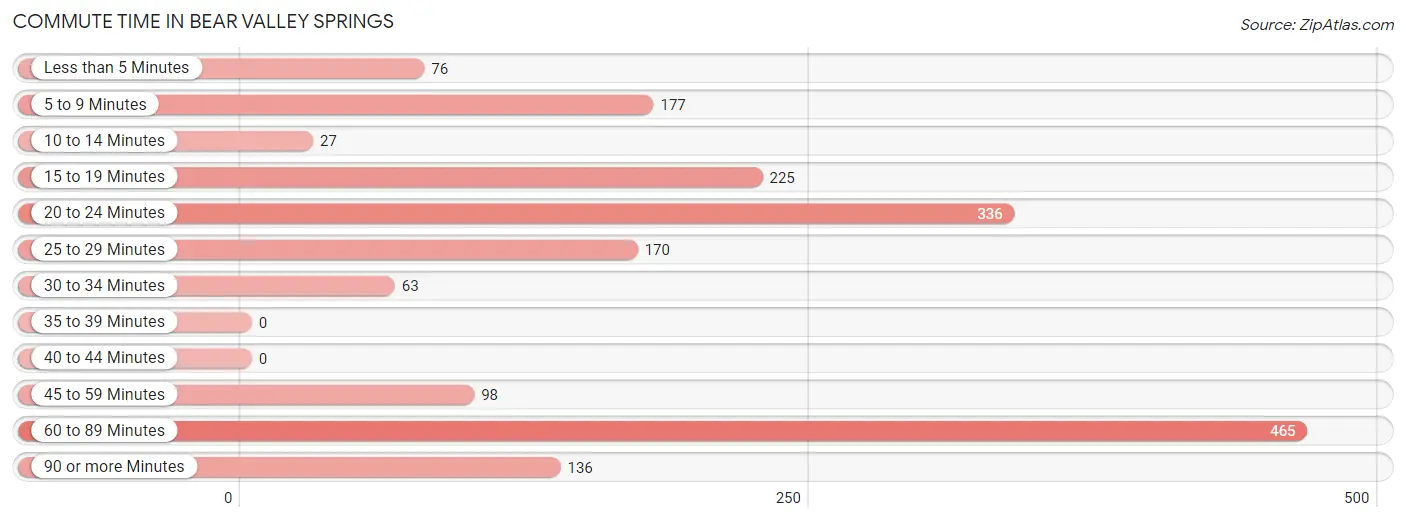
| Commute Time | # Commuters | % Commuters |
| Less than 5 Minutes | 76 | 4.3% |
| 5 to 9 Minutes | 177 | 10.0% |
| 10 to 14 Minutes | 27 | 1.5% |
| 15 to 19 Minutes | 225 | 12.7% |
| 20 to 24 Minutes | 336 | 19.0% |
| 25 to 29 Minutes | 170 | 9.6% |
| 30 to 34 Minutes | 63 | 3.5% |
| 35 to 39 Minutes | 0 | 0.0% |
| 40 to 44 Minutes | 0 | 0.0% |
| 45 to 59 Minutes | 98 | 5.5% |
| 60 to 89 Minutes | 465 | 26.2% |
| 90 or more Minutes | 136 | 7.7% |
Commute Time by Sex in Bear Valley Springs
The most common commute times in Bear Valley Springs are 60 to 89 minutes (326 commuters, 28.7%) for males and 20 to 24 minutes (153 commuters, 24.0%) for females.
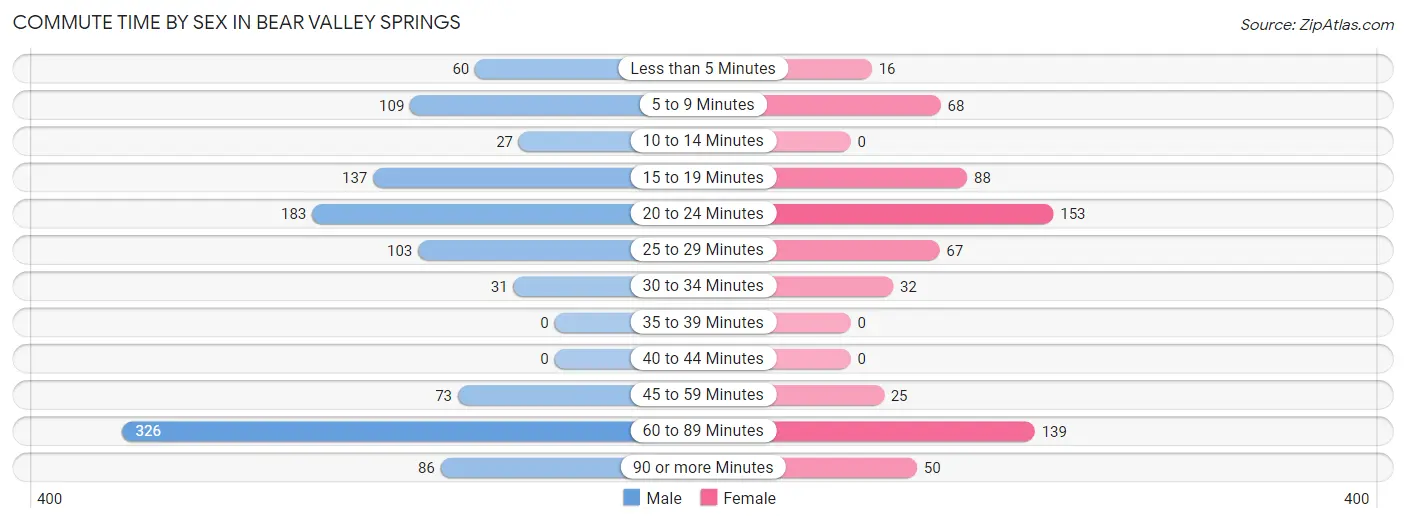
| Commute Time | Male | Female |
| Less than 5 Minutes | 60 (5.3%) | 16 (2.5%) |
| 5 to 9 Minutes | 109 (9.6%) | 68 (10.7%) |
| 10 to 14 Minutes | 27 (2.4%) | 0 (0.0%) |
| 15 to 19 Minutes | 137 (12.1%) | 88 (13.8%) |
| 20 to 24 Minutes | 183 (16.1%) | 153 (24.0%) |
| 25 to 29 Minutes | 103 (9.1%) | 67 (10.5%) |
| 30 to 34 Minutes | 31 (2.7%) | 32 (5.0%) |
| 35 to 39 Minutes | 0 (0.0%) | 0 (0.0%) |
| 40 to 44 Minutes | 0 (0.0%) | 0 (0.0%) |
| 45 to 59 Minutes | 73 (6.4%) | 25 (3.9%) |
| 60 to 89 Minutes | 326 (28.7%) | 139 (21.8%) |
| 90 or more Minutes | 86 (7.6%) | 50 (7.8%) |
Time of Departure to Work by Sex in Bear Valley Springs
The most frequent times of departure to work in Bear Valley Springs are 7:00 AM to 7:29 AM (321, 28.3%) for males and 7:00 AM to 7:29 AM (196, 30.7%) for females.
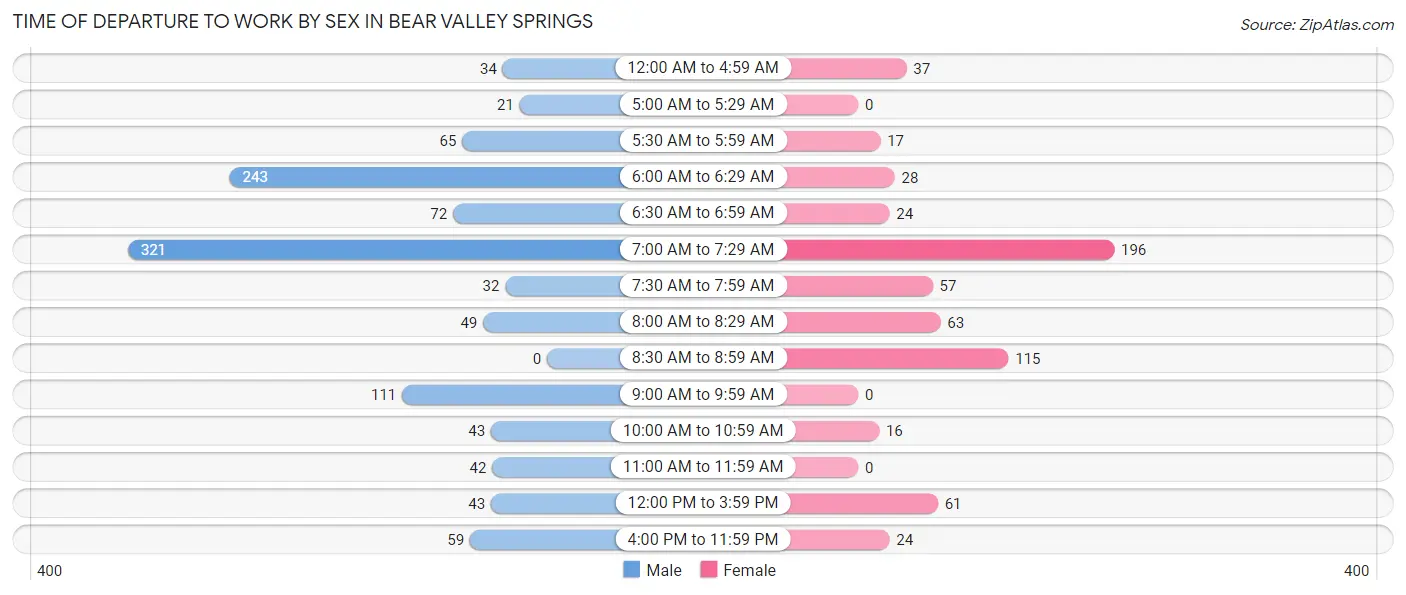
| Time of Departure | Male | Female |
| 12:00 AM to 4:59 AM | 34 (3.0%) | 37 (5.8%) |
| 5:00 AM to 5:29 AM | 21 (1.8%) | 0 (0.0%) |
| 5:30 AM to 5:59 AM | 65 (5.7%) | 17 (2.7%) |
| 6:00 AM to 6:29 AM | 243 (21.4%) | 28 (4.4%) |
| 6:30 AM to 6:59 AM | 72 (6.3%) | 24 (3.8%) |
| 7:00 AM to 7:29 AM | 321 (28.3%) | 196 (30.7%) |
| 7:30 AM to 7:59 AM | 32 (2.8%) | 57 (8.9%) |
| 8:00 AM to 8:29 AM | 49 (4.3%) | 63 (9.9%) |
| 8:30 AM to 8:59 AM | 0 (0.0%) | 115 (18.0%) |
| 9:00 AM to 9:59 AM | 111 (9.8%) | 0 (0.0%) |
| 10:00 AM to 10:59 AM | 43 (3.8%) | 16 (2.5%) |
| 11:00 AM to 11:59 AM | 42 (3.7%) | 0 (0.0%) |
| 12:00 PM to 3:59 PM | 43 (3.8%) | 61 (9.6%) |
| 4:00 PM to 11:59 PM | 59 (5.2%) | 24 (3.8%) |
| Total | 1,135 (100.0%) | 638 (100.0%) |
Housing Occupancy in Bear Valley Springs
Occupancy by Ownership in Bear Valley Springs
Of the total 2,429 dwellings in Bear Valley Springs, owner-occupied units account for 2,189 (90.1%), while renter-occupied units make up 240 (9.9%).
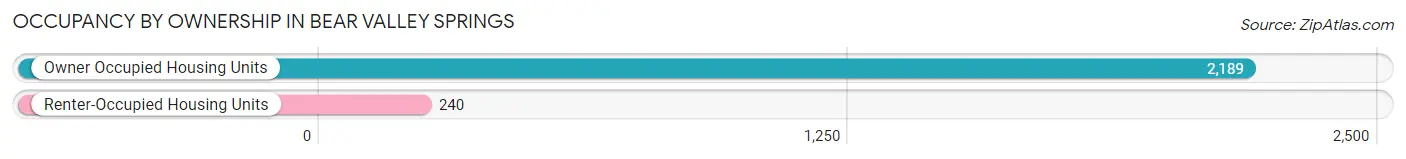
| Occupancy | # Housing Units | % Housing Units |
| Owner Occupied Housing Units | 2,189 | 90.1% |
| Renter-Occupied Housing Units | 240 | 9.9% |
| Total Occupied Housing Units | 2,429 | 100.0% |
Occupancy by Household Size in Bear Valley Springs
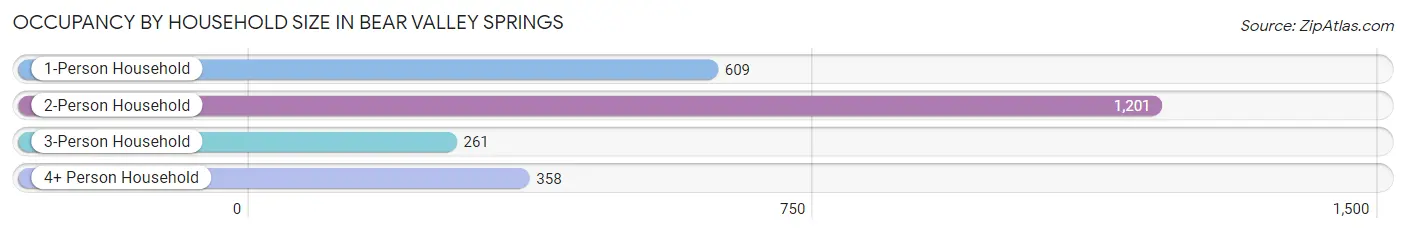
| Household Size | # Housing Units | % Housing Units |
| 1-Person Household | 609 | 25.1% |
| 2-Person Household | 1,201 | 49.4% |
| 3-Person Household | 261 | 10.7% |
| 4+ Person Household | 358 | 14.7% |
| Total Housing Units | 2,429 | 100.0% |
Occupancy by Ownership by Household Size in Bear Valley Springs
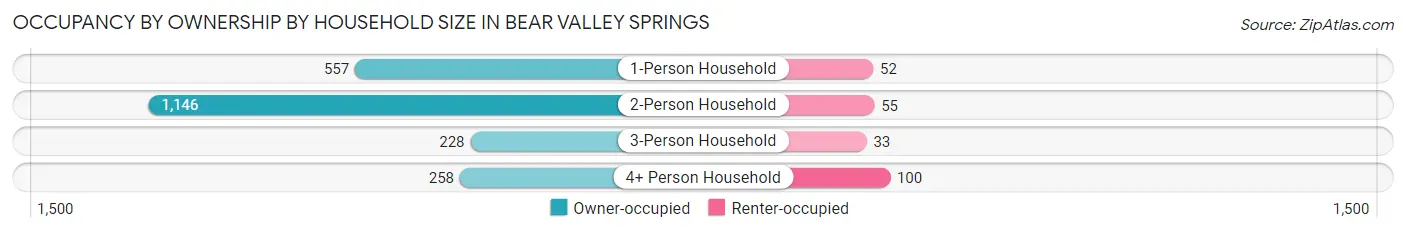
| Household Size | Owner-occupied | Renter-occupied |
| 1-Person Household | 557 (91.5%) | 52 (8.5%) |
| 2-Person Household | 1,146 (95.4%) | 55 (4.6%) |
| 3-Person Household | 228 (87.4%) | 33 (12.6%) |
| 4+ Person Household | 258 (72.1%) | 100 (27.9%) |
| Total Housing Units | 2,189 (90.1%) | 240 (9.9%) |
Occupancy by Educational Attainment in Bear Valley Springs
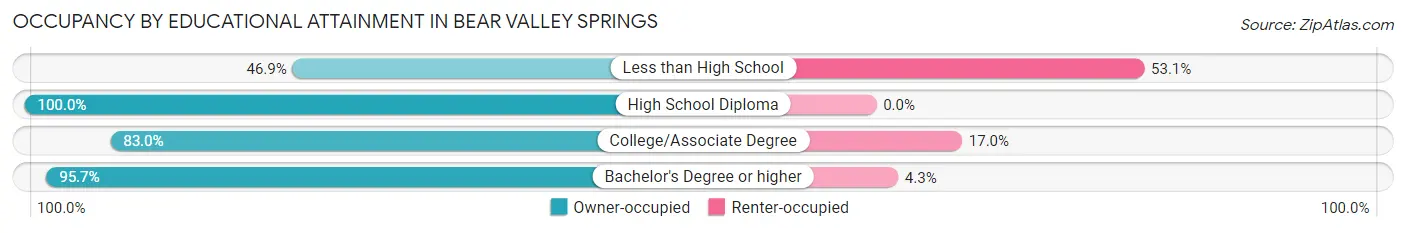
| Household Size | Owner-occupied | Renter-occupied |
| Less than High School | 15 (46.9%) | 17 (53.1%) |
| High School Diploma | 391 (100.0%) | 0 (0.0%) |
| College/Associate Degree | 894 (83.0%) | 183 (17.0%) |
| Bachelor's Degree or higher | 889 (95.7%) | 40 (4.3%) |
Occupancy by Age of Householder in Bear Valley Springs
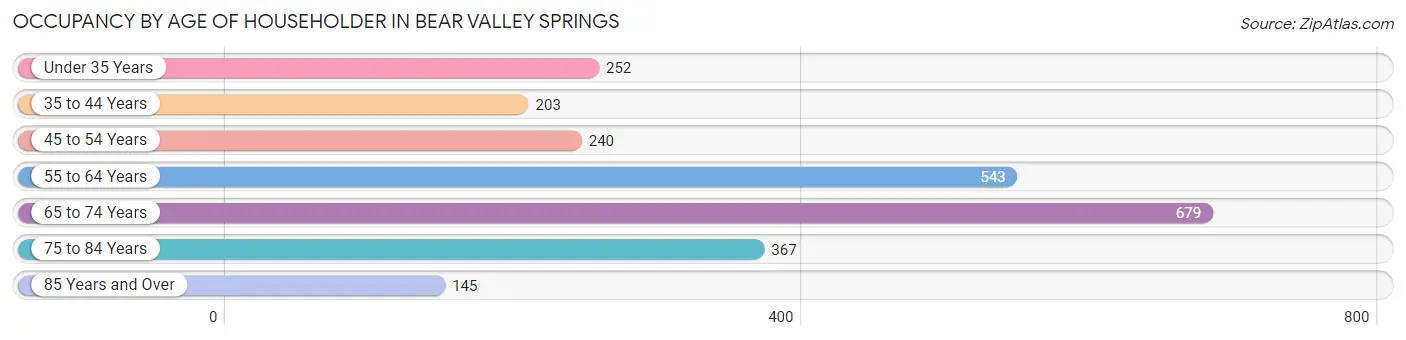
| Age Bracket | # Households | % Households |
| Under 35 Years | 252 | 10.4% |
| 35 to 44 Years | 203 | 8.4% |
| 45 to 54 Years | 240 | 9.9% |
| 55 to 64 Years | 543 | 22.4% |
| 65 to 74 Years | 679 | 28.0% |
| 75 to 84 Years | 367 | 15.1% |
| 85 Years and Over | 145 | 6.0% |
| Total | 2,429 | 100.0% |
Housing Finances in Bear Valley Springs
Median Income by Occupancy in Bear Valley Springs
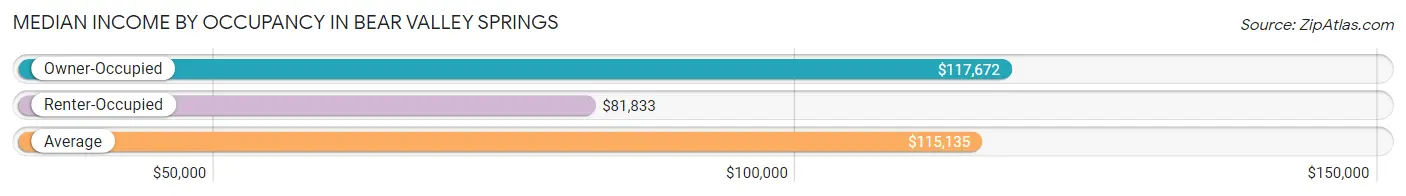
| Occupancy Type | # Households | Median Income |
| Owner-Occupied | 2,189 (90.1%) | $117,672 |
| Renter-Occupied | 240 (9.9%) | $81,833 |
| Average | 2,429 (100.0%) | $115,135 |
Occupancy by Householder Income Bracket in Bear Valley Springs
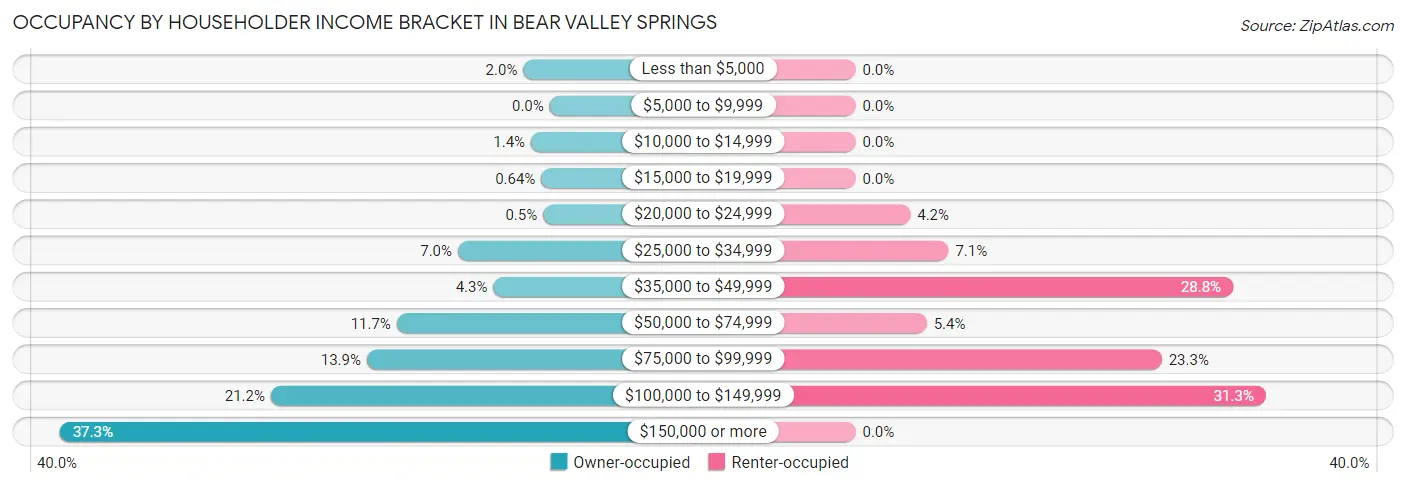
| Income Bracket | Owner-occupied | Renter-occupied |
| Less than $5,000 | 44 (2.0%) | 0 (0.0%) |
| $5,000 to $9,999 | 0 (0.0%) | 0 (0.0%) |
| $10,000 to $14,999 | 31 (1.4%) | 0 (0.0%) |
| $15,000 to $19,999 | 14 (0.6%) | 0 (0.0%) |
| $20,000 to $24,999 | 11 (0.5%) | 10 (4.2%) |
| $25,000 to $34,999 | 153 (7.0%) | 17 (7.1%) |
| $35,000 to $49,999 | 94 (4.3%) | 69 (28.7%) |
| $50,000 to $74,999 | 255 (11.7%) | 13 (5.4%) |
| $75,000 to $99,999 | 305 (13.9%) | 56 (23.3%) |
| $100,000 to $149,999 | 465 (21.2%) | 75 (31.2%) |
| $150,000 or more | 817 (37.3%) | 0 (0.0%) |
| Total | 2,189 (100.0%) | 240 (100.0%) |
Monthly Housing Cost Tiers in Bear Valley Springs
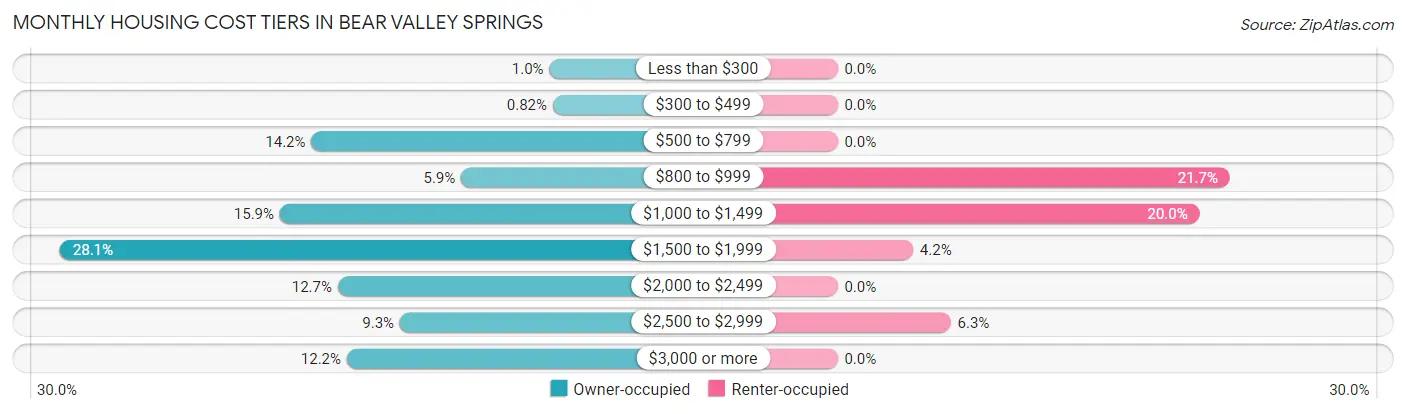
| Monthly Cost | Owner-occupied | Renter-occupied |
| Less than $300 | 22 (1.0%) | 0 (0.0%) |
| $300 to $499 | 18 (0.8%) | 0 (0.0%) |
| $500 to $799 | 310 (14.2%) | 0 (0.0%) |
| $800 to $999 | 129 (5.9%) | 52 (21.7%) |
| $1,000 to $1,499 | 348 (15.9%) | 48 (20.0%) |
| $1,500 to $1,999 | 614 (28.1%) | 10 (4.2%) |
| $2,000 to $2,499 | 278 (12.7%) | 0 (0.0%) |
| $2,500 to $2,999 | 203 (9.3%) | 15 (6.2%) |
| $3,000 or more | 267 (12.2%) | 0 (0.0%) |
| Total | 2,189 (100.0%) | 240 (100.0%) |
Physical Housing Characteristics in Bear Valley Springs
Housing Structures in Bear Valley Springs
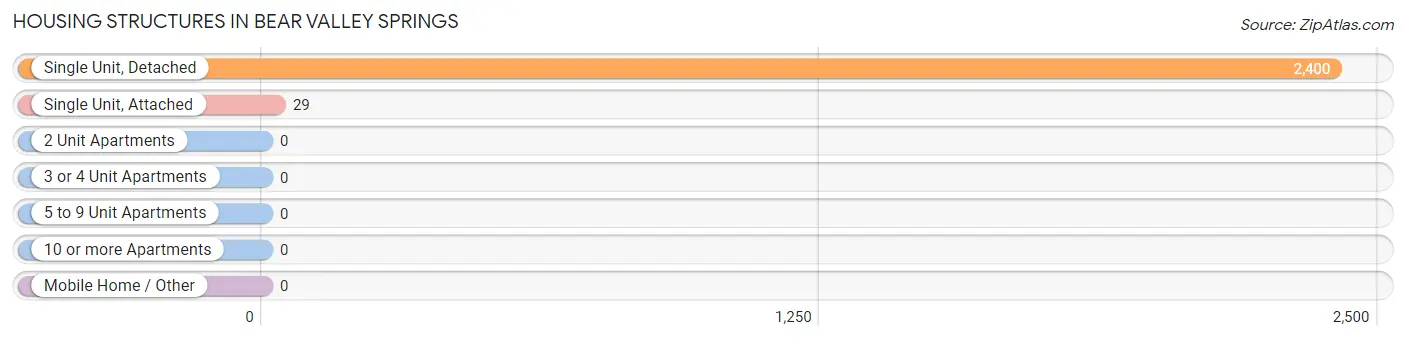
| Structure Type | # Housing Units | % Housing Units |
| Single Unit, Detached | 2,400 | 98.8% |
| Single Unit, Attached | 29 | 1.2% |
| 2 Unit Apartments | 0 | 0.0% |
| 3 or 4 Unit Apartments | 0 | 0.0% |
| 5 to 9 Unit Apartments | 0 | 0.0% |
| 10 or more Apartments | 0 | 0.0% |
| Mobile Home / Other | 0 | 0.0% |
| Total | 2,429 | 100.0% |
Housing Structures by Occupancy in Bear Valley Springs
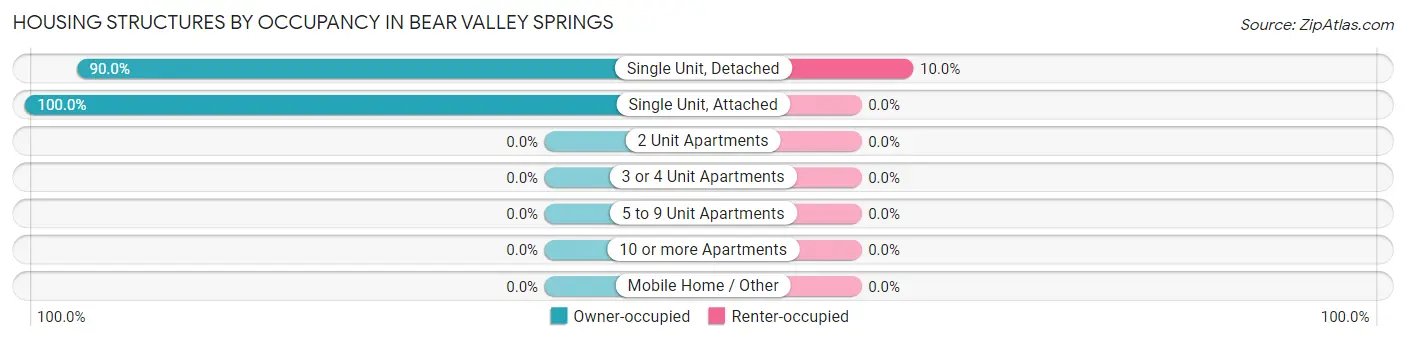
| Structure Type | Owner-occupied | Renter-occupied |
| Single Unit, Detached | 2,160 (90.0%) | 240 (10.0%) |
| Single Unit, Attached | 29 (100.0%) | 0 (0.0%) |
| 2 Unit Apartments | 0 (0.0%) | 0 (0.0%) |
| 3 or 4 Unit Apartments | 0 (0.0%) | 0 (0.0%) |
| 5 to 9 Unit Apartments | 0 (0.0%) | 0 (0.0%) |
| 10 or more Apartments | 0 (0.0%) | 0 (0.0%) |
| Mobile Home / Other | 0 (0.0%) | 0 (0.0%) |
| Total | 2,189 (90.1%) | 240 (9.9%) |
Housing Structures by Number of Rooms in Bear Valley Springs
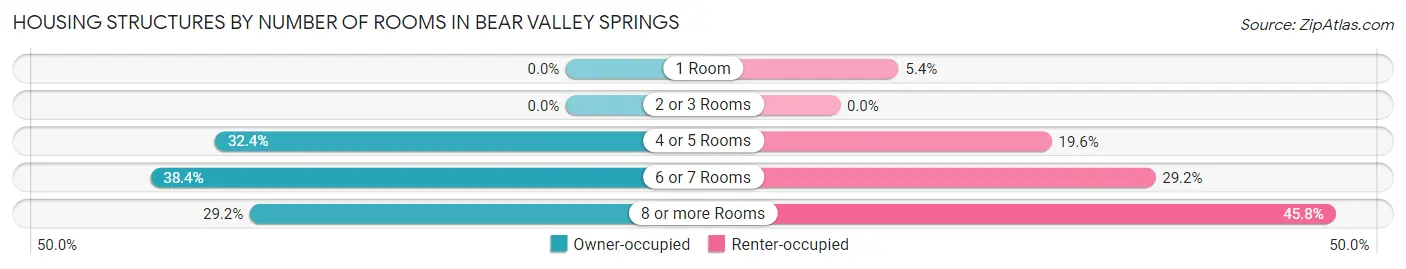
| Number of Rooms | Owner-occupied | Renter-occupied |
| 1 Room | 0 (0.0%) | 13 (5.4%) |
| 2 or 3 Rooms | 0 (0.0%) | 0 (0.0%) |
| 4 or 5 Rooms | 709 (32.4%) | 47 (19.6%) |
| 6 or 7 Rooms | 840 (38.4%) | 70 (29.2%) |
| 8 or more Rooms | 640 (29.2%) | 110 (45.8%) |
| Total | 2,189 (100.0%) | 240 (100.0%) |
Housing Structure by Heating Type in Bear Valley Springs
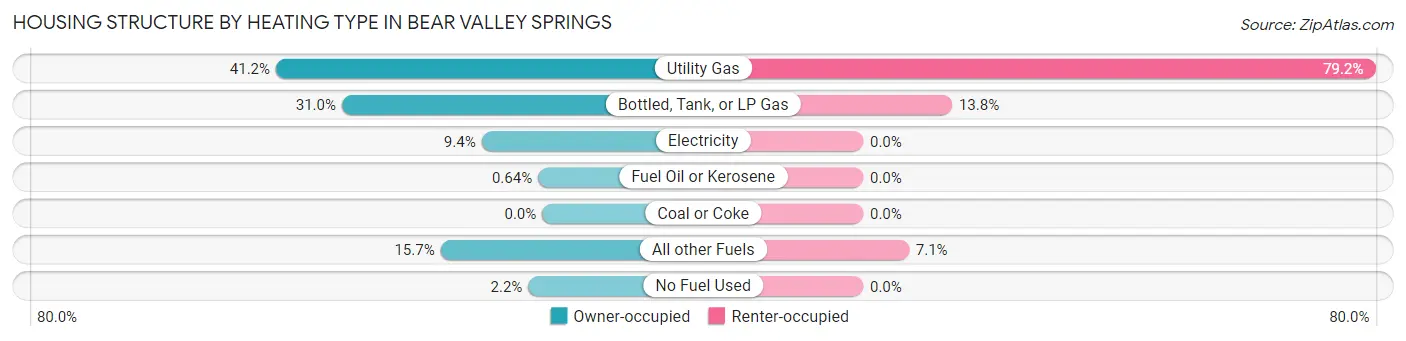
| Heating Type | Owner-occupied | Renter-occupied |
| Utility Gas | 901 (41.2%) | 190 (79.2%) |
| Bottled, Tank, or LP Gas | 678 (31.0%) | 33 (13.8%) |
| Electricity | 205 (9.4%) | 0 (0.0%) |
| Fuel Oil or Kerosene | 14 (0.6%) | 0 (0.0%) |
| Coal or Coke | 0 (0.0%) | 0 (0.0%) |
| All other Fuels | 344 (15.7%) | 17 (7.1%) |
| No Fuel Used | 47 (2.1%) | 0 (0.0%) |
| Total | 2,189 (100.0%) | 240 (100.0%) |
Household Vehicle Usage in Bear Valley Springs
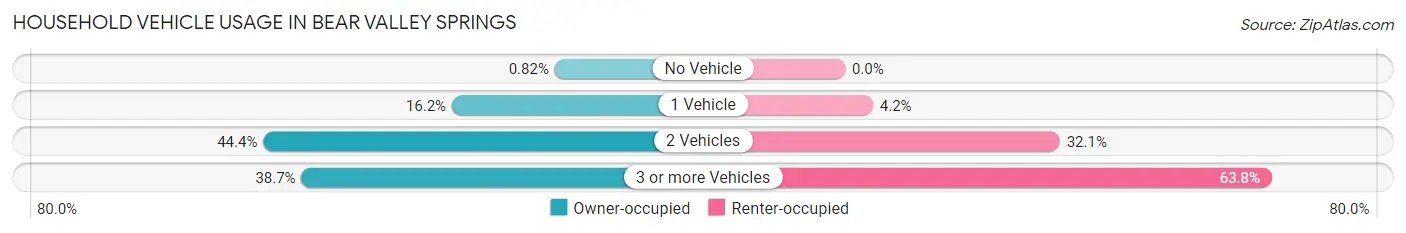
| Vehicles per Household | Owner-occupied | Renter-occupied |
| No Vehicle | 18 (0.8%) | 0 (0.0%) |
| 1 Vehicle | 354 (16.2%) | 10 (4.2%) |
| 2 Vehicles | 971 (44.4%) | 77 (32.1%) |
| 3 or more Vehicles | 846 (38.7%) | 153 (63.7%) |
| Total | 2,189 (100.0%) | 240 (100.0%) |
Real Estate & Mortgages in Bear Valley Springs
Real Estate and Mortgage Overview in Bear Valley Springs
| Characteristic | Without Mortgage | With Mortgage |
| Housing Units | 806 | 1,383 |
| Median Property Value | $458,100 | $433,600 |
| Median Household Income | $86,700 | $566 |
| Monthly Housing Costs | $880 | $267 |
| Real Estate Taxes | $4,940 | $118 |
Property Value by Mortgage Status in Bear Valley Springs
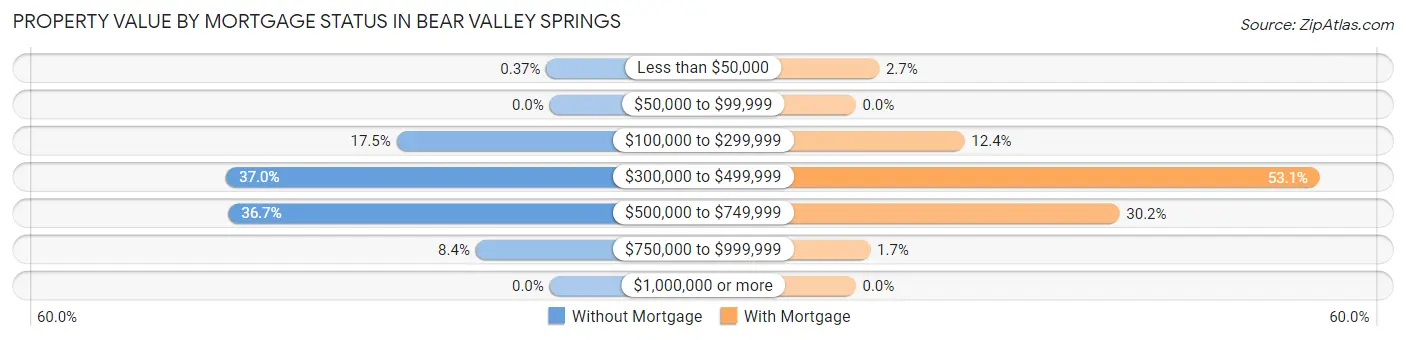
| Property Value | Without Mortgage | With Mortgage |
| Less than $50,000 | 3 (0.4%) | 37 (2.7%) |
| $50,000 to $99,999 | 0 (0.0%) | 0 (0.0%) |
| $100,000 to $299,999 | 141 (17.5%) | 172 (12.4%) |
| $300,000 to $499,999 | 298 (37.0%) | 734 (53.1%) |
| $500,000 to $749,999 | 296 (36.7%) | 417 (30.1%) |
| $750,000 to $999,999 | 68 (8.4%) | 23 (1.7%) |
| $1,000,000 or more | 0 (0.0%) | 0 (0.0%) |
| Total | 806 (100.0%) | 1,383 (100.0%) |
Household Income by Mortgage Status in Bear Valley Springs
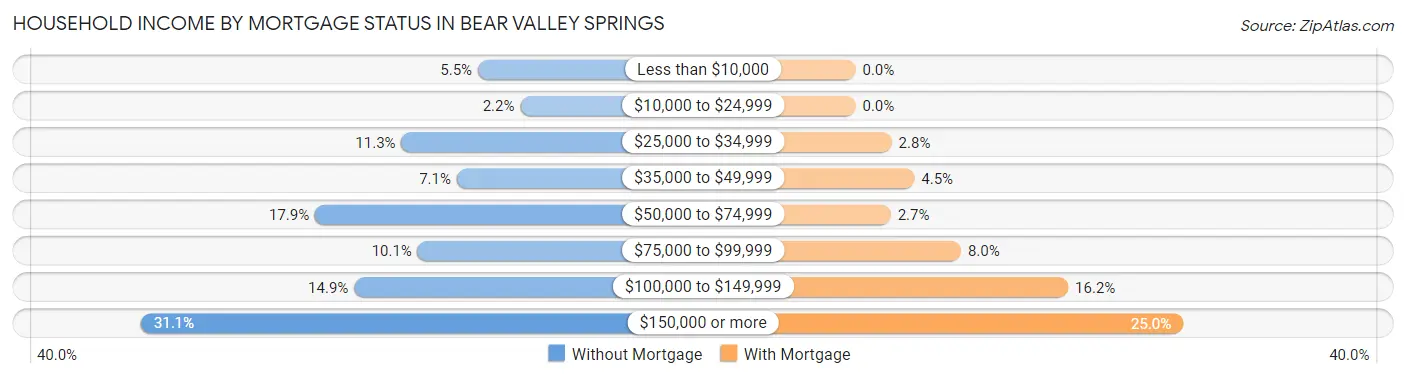
| Household Income | Without Mortgage | With Mortgage |
| Less than $10,000 | 44 (5.5%) | 0 (0.0%) |
| $10,000 to $24,999 | 18 (2.2%) | 0 (0.0%) |
| $25,000 to $34,999 | 91 (11.3%) | 38 (2.8%) |
| $35,000 to $49,999 | 57 (7.1%) | 62 (4.5%) |
| $50,000 to $74,999 | 144 (17.9%) | 37 (2.7%) |
| $75,000 to $99,999 | 81 (10.1%) | 111 (8.0%) |
| $100,000 to $149,999 | 120 (14.9%) | 224 (16.2%) |
| $150,000 or more | 251 (31.1%) | 345 (24.9%) |
| Total | 806 (100.0%) | 1,383 (100.0%) |
Property Value to Household Income Ratio in Bear Valley Springs
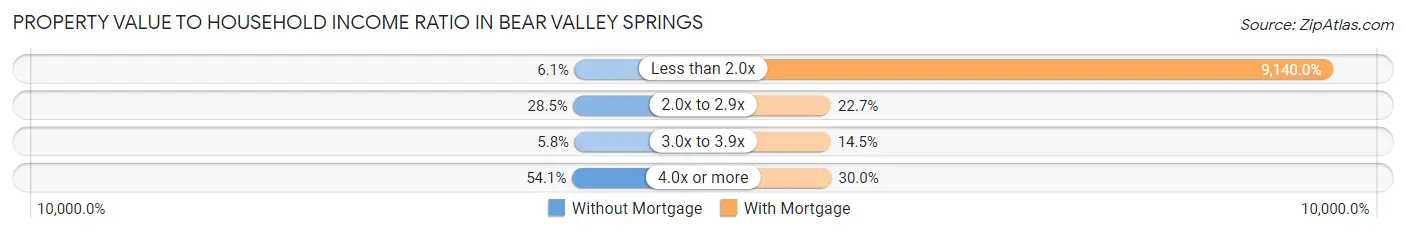
| Value-to-Income Ratio | Without Mortgage | With Mortgage |
| Less than 2.0x | 49 (6.1%) | 126,406 (9,140.0%) |
| 2.0x to 2.9x | 230 (28.5%) | 314 (22.7%) |
| 3.0x to 3.9x | 47 (5.8%) | 201 (14.5%) |
| 4.0x or more | 436 (54.1%) | 415 (30.0%) |
| Total | 806 (100.0%) | 1,383 (100.0%) |
Real Estate Taxes by Mortgage Status in Bear Valley Springs
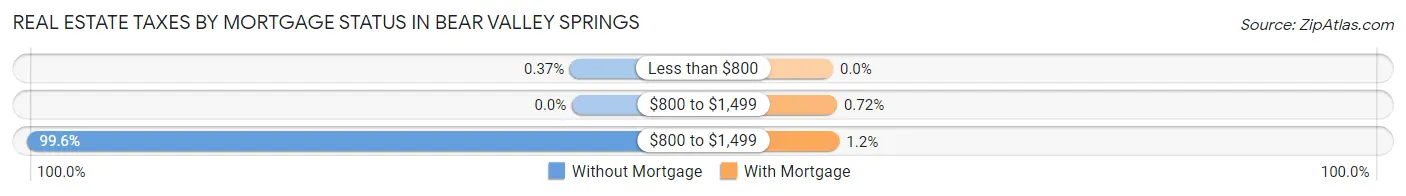
| Property Taxes | Without Mortgage | With Mortgage |
| Less than $800 | 3 (0.4%) | 0 (0.0%) |
| $800 to $1,499 | 0 (0.0%) | 10 (0.7%) |
| $800 to $1,499 | 803 (99.6%) | 16 (1.2%) |
| Total | 806 (100.0%) | 1,383 (100.0%) |
Health & Disability in Bear Valley Springs
Health Insurance Coverage by Age in Bear Valley Springs
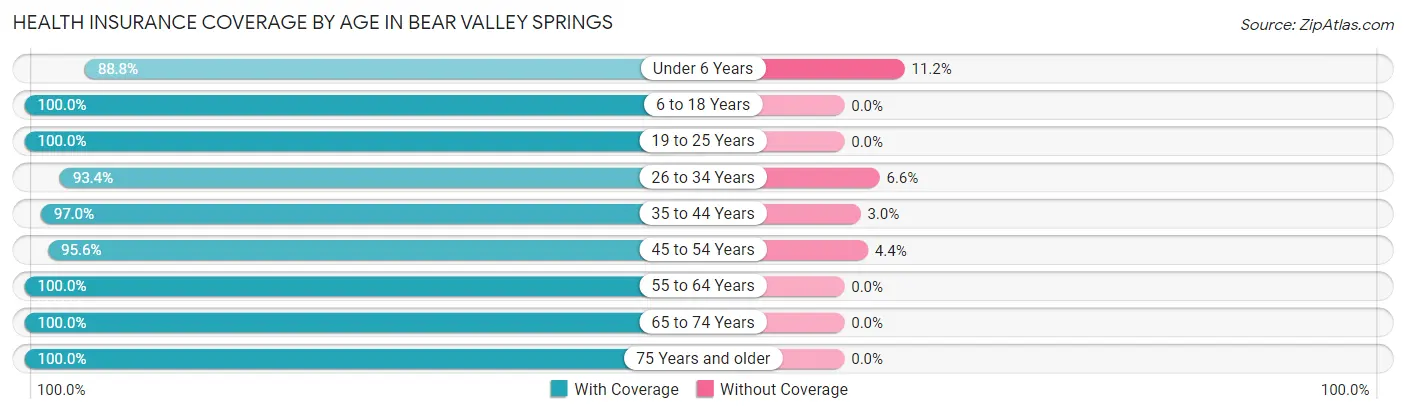
| Age Bracket | With Coverage | Without Coverage |
| Under 6 Years | 340 (88.8%) | 43 (11.2%) |
| 6 to 18 Years | 693 (100.0%) | 0 (0.0%) |
| 19 to 25 Years | 160 (100.0%) | 0 (0.0%) |
| 26 to 34 Years | 569 (93.4%) | 40 (6.6%) |
| 35 to 44 Years | 417 (97.0%) | 13 (3.0%) |
| 45 to 54 Years | 500 (95.6%) | 23 (4.4%) |
| 55 to 64 Years | 978 (100.0%) | 0 (0.0%) |
| 65 to 74 Years | 1,067 (100.0%) | 0 (0.0%) |
| 75 Years and older | 755 (100.0%) | 0 (0.0%) |
| Total | 5,479 (97.9%) | 119 (2.1%) |
Health Insurance Coverage by Citizenship Status in Bear Valley Springs
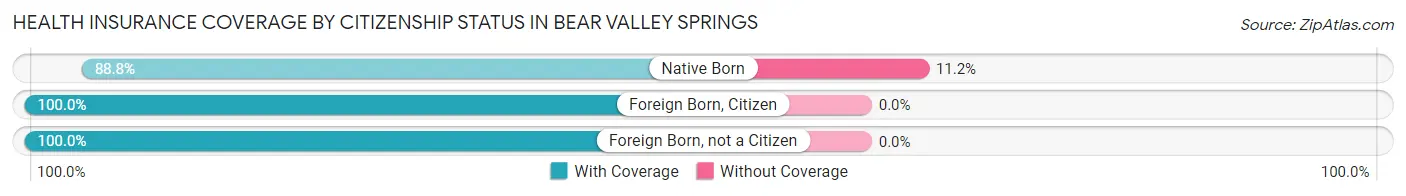
| Citizenship Status | With Coverage | Without Coverage |
| Native Born | 340 (88.8%) | 43 (11.2%) |
| Foreign Born, Citizen | 693 (100.0%) | 0 (0.0%) |
| Foreign Born, not a Citizen | 160 (100.0%) | 0 (0.0%) |
Health Insurance Coverage by Household Income in Bear Valley Springs
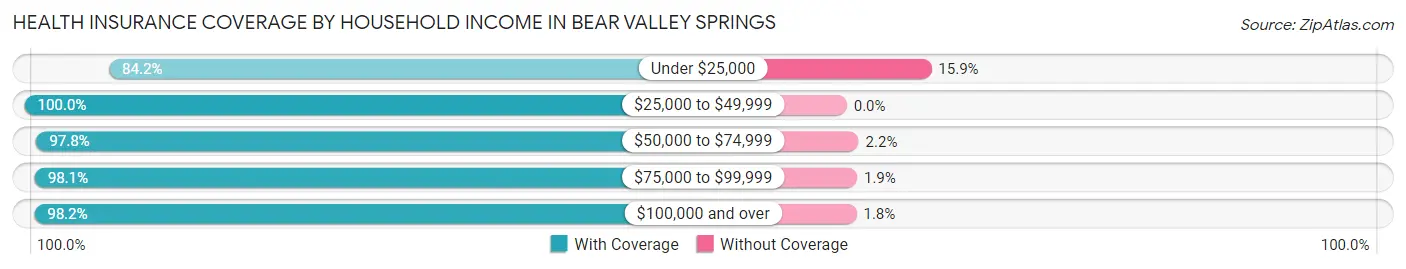
| Household Income | With Coverage | Without Coverage |
| Under $25,000 | 138 (84.2%) | 26 (15.9%) |
| $25,000 to $49,999 | 497 (100.0%) | 0 (0.0%) |
| $50,000 to $74,999 | 573 (97.8%) | 13 (2.2%) |
| $75,000 to $99,999 | 972 (98.1%) | 19 (1.9%) |
| $100,000 and over | 3,292 (98.2%) | 61 (1.8%) |
Public vs Private Health Insurance Coverage by Age in Bear Valley Springs
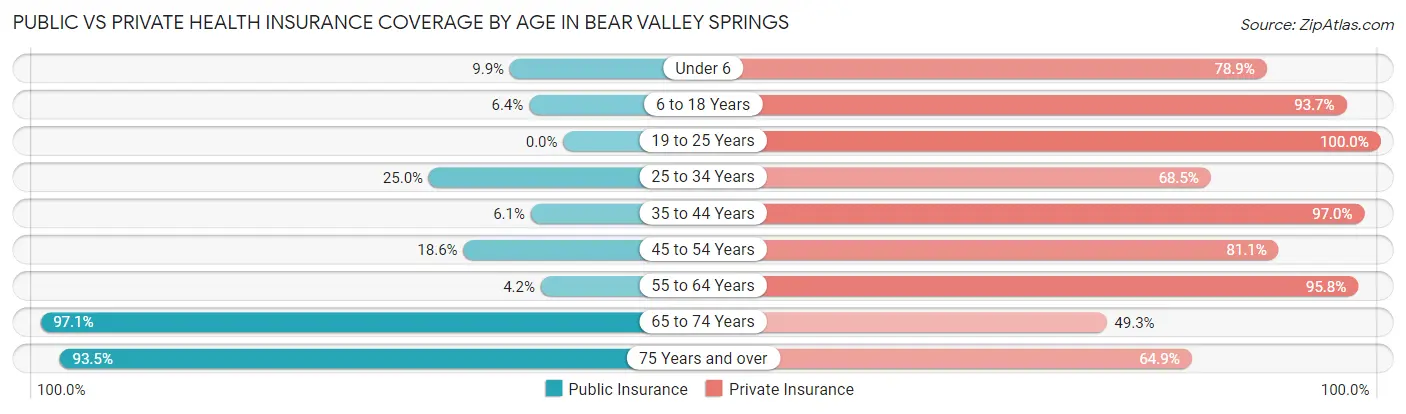
| Age Bracket | Public Insurance | Private Insurance |
| Under 6 | 38 (9.9%) | 302 (78.8%) |
| 6 to 18 Years | 44 (6.4%) | 649 (93.6%) |
| 19 to 25 Years | 0 (0.0%) | 160 (100.0%) |
| 25 to 34 Years | 152 (25.0%) | 417 (68.5%) |
| 35 to 44 Years | 26 (6.0%) | 417 (97.0%) |
| 45 to 54 Years | 97 (18.5%) | 424 (81.1%) |
| 55 to 64 Years | 41 (4.2%) | 937 (95.8%) |
| 65 to 74 Years | 1,036 (97.1%) | 526 (49.3%) |
| 75 Years and over | 706 (93.5%) | 490 (64.9%) |
| Total | 2,140 (38.2%) | 4,322 (77.2%) |
Disability Status by Sex by Age in Bear Valley Springs
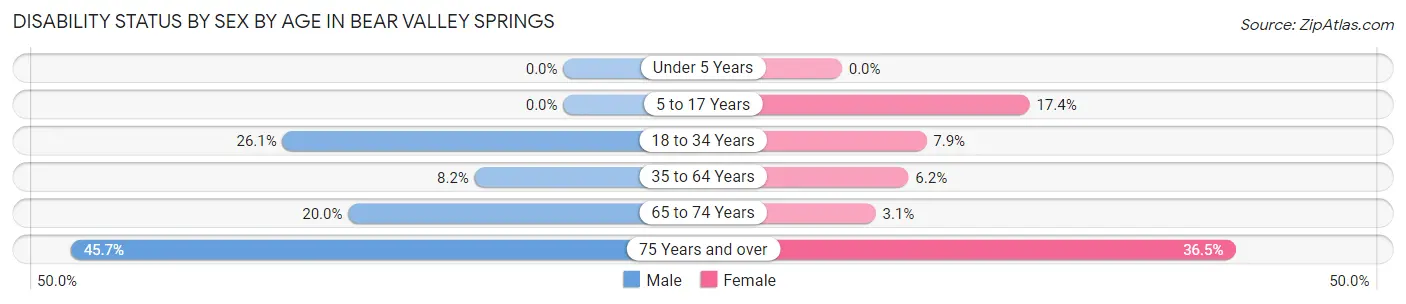
| Age Bracket | Male | Female |
| Under 5 Years | 0 (0.0%) | 0 (0.0%) |
| 5 to 17 Years | 0 (0.0%) | 58 (17.4%) |
| 18 to 34 Years | 153 (26.1%) | 19 (7.9%) |
| 35 to 64 Years | 75 (8.2%) | 63 (6.2%) |
| 65 to 74 Years | 92 (20.0%) | 19 (3.1%) |
| 75 Years and over | 235 (45.7%) | 88 (36.5%) |
Disability Class by Sex by Age in Bear Valley Springs
Disability Class: Hearing Difficulty
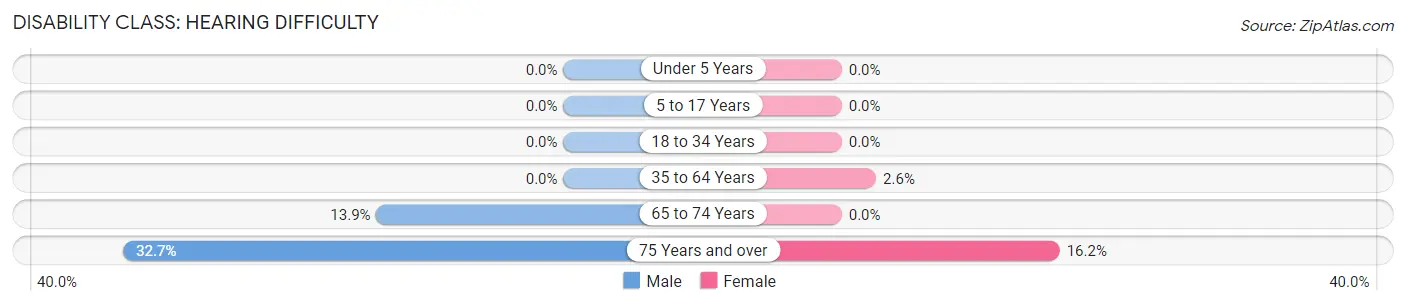
| Age Bracket | Male | Female |
| Under 5 Years | 0 (0.0%) | 0 (0.0%) |
| 5 to 17 Years | 0 (0.0%) | 0 (0.0%) |
| 18 to 34 Years | 0 (0.0%) | 0 (0.0%) |
| 35 to 64 Years | 0 (0.0%) | 26 (2.5%) |
| 65 to 74 Years | 64 (13.9%) | 0 (0.0%) |
| 75 Years and over | 168 (32.7%) | 39 (16.2%) |
Disability Class: Vision Difficulty
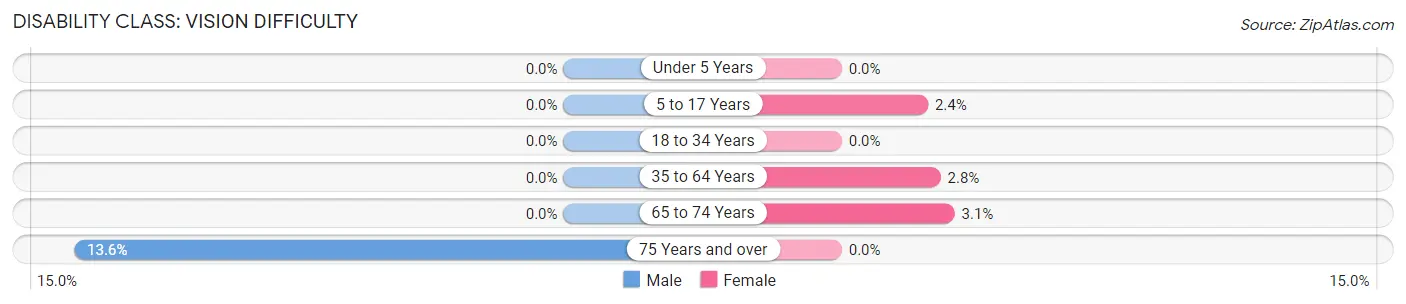
| Age Bracket | Male | Female |
| Under 5 Years | 0 (0.0%) | 0 (0.0%) |
| 5 to 17 Years | 0 (0.0%) | 8 (2.4%) |
| 18 to 34 Years | 0 (0.0%) | 0 (0.0%) |
| 35 to 64 Years | 0 (0.0%) | 28 (2.8%) |
| 65 to 74 Years | 0 (0.0%) | 19 (3.1%) |
| 75 Years and over | 70 (13.6%) | 0 (0.0%) |
Disability Class: Cognitive Difficulty
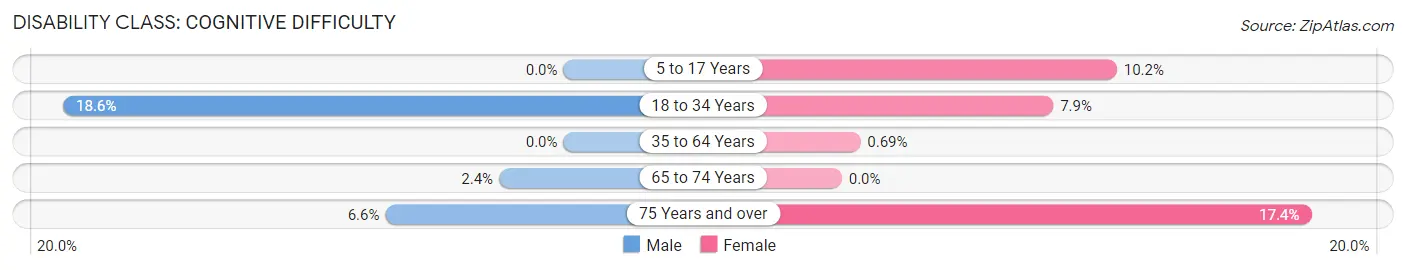
| Age Bracket | Male | Female |
| 5 to 17 Years | 0 (0.0%) | 34 (10.2%) |
| 18 to 34 Years | 109 (18.6%) | 19 (7.9%) |
| 35 to 64 Years | 0 (0.0%) | 7 (0.7%) |
| 65 to 74 Years | 11 (2.4%) | 0 (0.0%) |
| 75 Years and over | 34 (6.6%) | 42 (17.4%) |
Disability Class: Ambulatory Difficulty
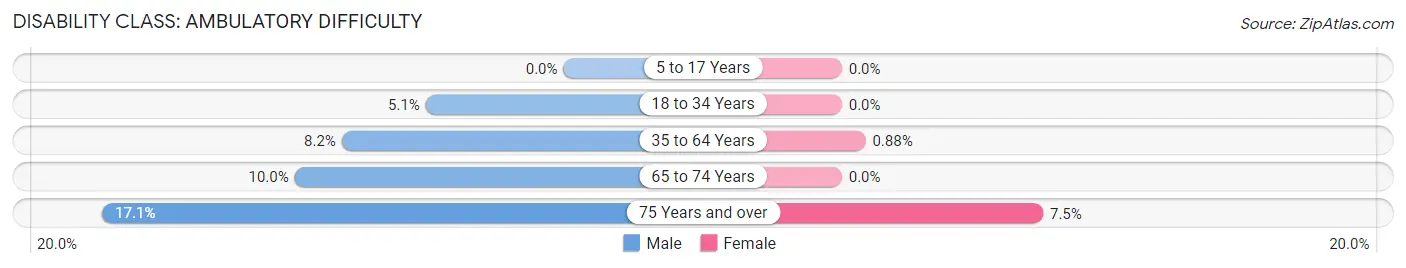
| Age Bracket | Male | Female |
| 5 to 17 Years | 0 (0.0%) | 0 (0.0%) |
| 18 to 34 Years | 30 (5.1%) | 0 (0.0%) |
| 35 to 64 Years | 75 (8.2%) | 9 (0.9%) |
| 65 to 74 Years | 46 (10.0%) | 0 (0.0%) |
| 75 Years and over | 88 (17.1%) | 18 (7.5%) |
Disability Class: Self-Care Difficulty
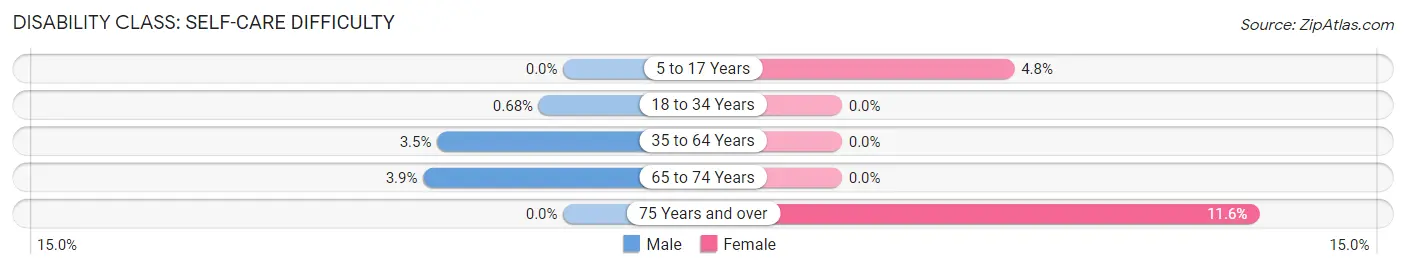
| Age Bracket | Male | Female |
| 5 to 17 Years | 0 (0.0%) | 16 (4.8%) |
| 18 to 34 Years | 4 (0.7%) | 0 (0.0%) |
| 35 to 64 Years | 32 (3.5%) | 0 (0.0%) |
| 65 to 74 Years | 18 (3.9%) | 0 (0.0%) |
| 75 Years and over | 0 (0.0%) | 28 (11.6%) |
Technology Access in Bear Valley Springs
Computing Device Access in Bear Valley Springs
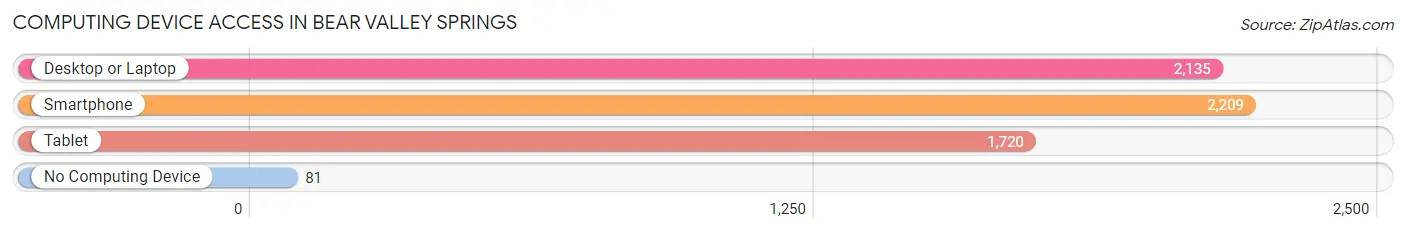
| Device Type | # Households | % Households |
| Desktop or Laptop | 2,135 | 87.9% |
| Smartphone | 2,209 | 90.9% |
| Tablet | 1,720 | 70.8% |
| No Computing Device | 81 | 3.3% |
| Total | 2,429 | 100.0% |
Internet Access in Bear Valley Springs
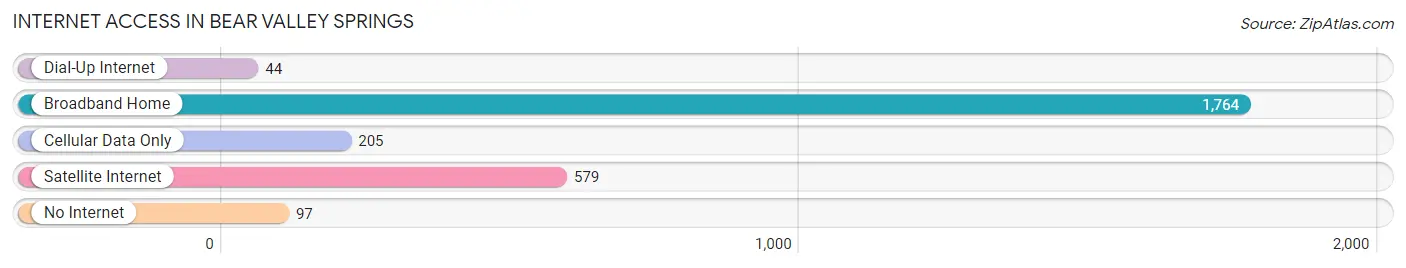
| Internet Type | # Households | % Households |
| Dial-Up Internet | 44 | 1.8% |
| Broadband Home | 1,764 | 72.6% |
| Cellular Data Only | 205 | 8.4% |
| Satellite Internet | 579 | 23.8% |
| No Internet | 97 | 4.0% |
| Total | 2,429 | 100.0% |
Bear Valley Springs Summary
Valley Springs, California is a small town located in the Sierra Nevada foothills of California, about an hour and a half east of Sacramento. It is situated in Calaveras County, and is part of the greater Sacramento metropolitan area. The town has a population of approximately 3,000 people, and is known for its rural charm and outdoor recreation opportunities.
History
Valley Springs was first settled in the late 1800s by miners and ranchers. The town was originally known as “Bear Valley”, and was officially incorporated in 1949. The town was named after the nearby Bear Valley, which was a popular destination for miners and ranchers.
The town was originally a small farming and ranching community, but in the 1950s and 1960s, the population began to grow as people moved to the area for its rural charm and outdoor recreation opportunities. The town was also home to a large number of retirees, who were attracted to the area for its mild climate and low cost of living.
Geography
Valley Springs is located in the Sierra Nevada foothills of California, about an hour and a half east of Sacramento. The town is situated in Calaveras County, and is part of the greater Sacramento metropolitan area. The town is located at an elevation of 1,400 feet, and is surrounded by rolling hills and oak-studded valleys.
The town is located near several lakes, including Lake Camanche, Lake Tulloch, and New Hogan Lake. The nearby Mokelumne River is a popular destination for fishing, boating, and swimming. The town is also located near several state parks, including Calaveras Big Trees State Park, which is home to some of the world’s largest sequoia trees.
Economy
Valley Springs is a small town with a diverse economy. The town is home to several small businesses, including restaurants, retail stores, and service providers. The town is also home to several large employers, including the Valley Springs Medical Center, the Valley Springs School District, and the Valley Springs Fire Department.
The town is also home to several wineries, which produce a variety of wines from local grapes. The town is also home to several farms, which produce a variety of fruits and vegetables.
Demographics
As of the 2010 census, the population of Valley Springs was 3,553. The population is predominantly white (90.2%), with a small percentage of African Americans (2.2%), Asians (2.1%), and Native Americans (0.7%). The median household income is $50,945, and the median age is 44.
Conclusion
Valley Springs, California is a small town located in the Sierra Nevada foothills of California, about an hour and a half east of Sacramento. It is situated in Calaveras County, and is part of the greater Sacramento metropolitan area. The town has a population of approximately 3,000 people, and is known for its rural charm and outdoor recreation opportunities. The town has a diverse economy, with several small businesses, large employers, wineries, and farms. The population is predominantly white, with a small percentage of African Americans, Asians, and Native Americans. Valley Springs is a great place to live, work, and play, and is a great example of small-town living in California.
Common Questions
What is Per Capita Income in Bear Valley Springs?
Per Capita income in Bear Valley Springs is $56,047.
What is the Median Family Income in Bear Valley Springs?
Median Family Income in Bear Valley Springs is $142,886.
What is the Median Household income in Bear Valley Springs?
Median Household Income in Bear Valley Springs is $115,135.
What is Income or Wage Gap in Bear Valley Springs?
Income or Wage Gap in Bear Valley Springs is 61.7%.
Women in Bear Valley Springs earn 38.3 cents for every dollar earned by a man.
What is Inequality or Gini Index in Bear Valley Springs?
Inequality or Gini Index in Bear Valley Springs is 0.37.
What is the Total Population of Bear Valley Springs?
Total Population of Bear Valley Springs is 5,598.
What is the Total Male Population of Bear Valley Springs?
Total Male Population of Bear Valley Springs is 2,950.
What is the Total Female Population of Bear Valley Springs?
Total Female Population of Bear Valley Springs is 2,648.
What is the Ratio of Males per 100 Females in Bear Valley Springs?
There are 111.40 Males per 100 Females in Bear Valley Springs.
What is the Ratio of Females per 100 Males in Bear Valley Springs?
There are 89.76 Females per 100 Males in Bear Valley Springs.
What is the Median Population Age in Bear Valley Springs?
Median Population Age in Bear Valley Springs is 55.0 Years.
What is the Average Family Size in Bear Valley Springs
Average Family Size in Bear Valley Springs is 2.7 People.
What is the Average Household Size in Bear Valley Springs
Average Household Size in Bear Valley Springs is 2.3 People.
How Large is the Labor Force in Bear Valley Springs?
There are 2,141 People in the Labor Forcein in Bear Valley Springs.
What is the Percentage of People in the Labor Force in Bear Valley Springs?
45.3% of People are in the Labor Force in Bear Valley Springs.
What is the Unemployment Rate in Bear Valley Springs?
Unemployment Rate in Bear Valley Springs is 3.2%.